Afghan vs Immigrants from Europe Vision Disability
COMPARE
Afghan
Immigrants from Europe
Vision Disability
Vision Disability Comparison
Afghans
Immigrants from Europe
2.0%
VISION DISABILITY
99.5/ 100
METRIC RATING
50th/ 347
METRIC RANK
2.1%
VISION DISABILITY
96.1/ 100
METRIC RATING
93rd/ 347
METRIC RANK
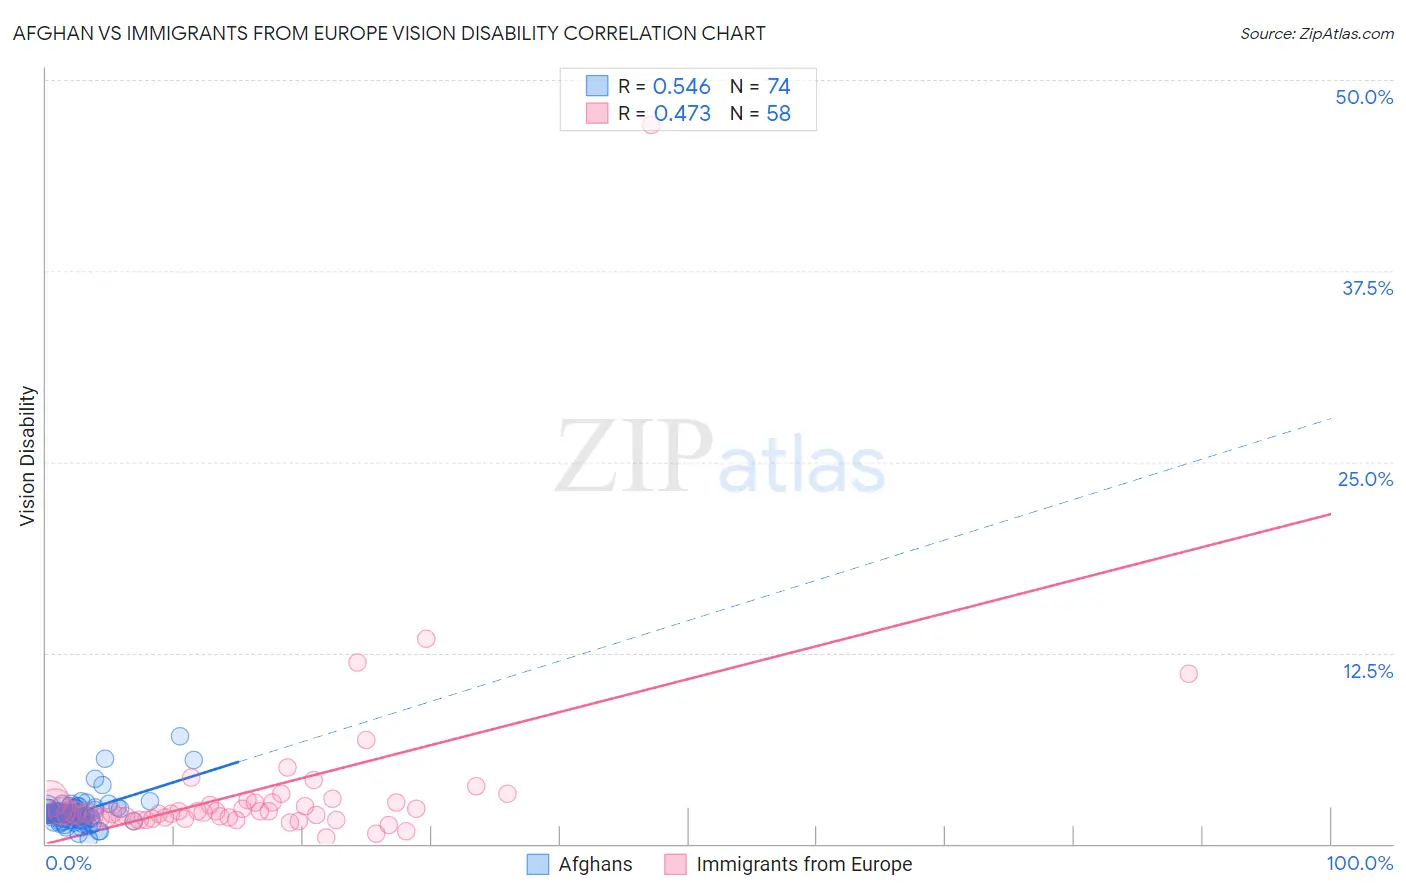
Afghan vs Immigrants from Europe Vision Disability Correlation Chart
The statistical analysis conducted on geographies consisting of 148,842,568 people shows a substantial positive correlation between the proportion of Afghans and percentage of population with vision disability in the United States with a correlation coefficient (R) of 0.546 and weighted average of 2.0%. Similarly, the statistical analysis conducted on geographies consisting of 546,008,895 people shows a moderate positive correlation between the proportion of Immigrants from Europe and percentage of population with vision disability in the United States with a correlation coefficient (R) of 0.473 and weighted average of 2.1%, a difference of 3.6%.
Vision Disability Correlation Summary
| Measurement | Afghan | Immigrants from Europe |
| Minimum | 0.32% | 0.41% |
| Maximum | 7.0% | 47.1% |
| Range | 6.7% | 46.7% |
| Mean | 2.1% | 3.5% |
| Median | 1.9% | 2.1% |
| Interquartile 25% (IQ1) | 1.5% | 1.7% |
| Interquartile 75% (IQ3) | 2.3% | 2.7% |
| Interquartile Range (IQR) | 0.76% | 1.0% |
| Standard Deviation (Sample) | 1.0% | 6.3% |
| Standard Deviation (Population) | 1.0% | 6.3% |
Similar Demographics by Vision Disability
Demographics Similar to Afghans by Vision Disability
In terms of vision disability, the demographic groups most similar to Afghans are Latvian (2.0%, a difference of 0.060%), Tongan (2.0%, a difference of 0.090%), Israeli (2.0%, a difference of 0.13%), Immigrants from Serbia (2.0%, a difference of 0.40%), and Immigrants from Belarus (2.0%, a difference of 0.51%).
| Demographics | Rating | Rank | Vision Disability |
| Eastern Europeans | 99.7 /100 | #43 | Exceptional 2.0% |
| Immigrants | Indonesia | 99.7 /100 | #44 | Exceptional 2.0% |
| Ethiopians | 99.7 /100 | #45 | Exceptional 2.0% |
| Immigrants | Sweden | 99.7 /100 | #46 | Exceptional 2.0% |
| Immigrants | Bulgaria | 99.7 /100 | #47 | Exceptional 2.0% |
| Israelis | 99.6 /100 | #48 | Exceptional 2.0% |
| Latvians | 99.5 /100 | #49 | Exceptional 2.0% |
| Afghans | 99.5 /100 | #50 | Exceptional 2.0% |
| Tongans | 99.5 /100 | #51 | Exceptional 2.0% |
| Immigrants | Serbia | 99.4 /100 | #52 | Exceptional 2.0% |
| Immigrants | Belarus | 99.3 /100 | #53 | Exceptional 2.0% |
| Macedonians | 99.3 /100 | #54 | Exceptional 2.0% |
| Laotians | 99.3 /100 | #55 | Exceptional 2.0% |
| Jordanians | 99.2 /100 | #56 | Exceptional 2.0% |
| Somalis | 99.2 /100 | #57 | Exceptional 2.0% |
Demographics Similar to Immigrants from Europe by Vision Disability
In terms of vision disability, the demographic groups most similar to Immigrants from Europe are Immigrants from Croatia (2.1%, a difference of 0.020%), Immigrants from Syria (2.1%, a difference of 0.050%), Immigrants from Somalia (2.1%, a difference of 0.060%), Australian (2.1%, a difference of 0.090%), and Romanian (2.1%, a difference of 0.15%).
| Demographics | Rating | Rank | Vision Disability |
| Immigrants | Moldova | 97.2 /100 | #86 | Exceptional 2.0% |
| Immigrants | Switzerland | 97.0 /100 | #87 | Exceptional 2.0% |
| Norwegians | 97.0 /100 | #88 | Exceptional 2.0% |
| Immigrants | Eastern Africa | 97.0 /100 | #89 | Exceptional 2.0% |
| Immigrants | Lebanon | 96.7 /100 | #90 | Exceptional 2.1% |
| Immigrants | Somalia | 96.2 /100 | #91 | Exceptional 2.1% |
| Immigrants | Syria | 96.2 /100 | #92 | Exceptional 2.1% |
| Immigrants | Europe | 96.1 /100 | #93 | Exceptional 2.1% |
| Immigrants | Croatia | 96.0 /100 | #94 | Exceptional 2.1% |
| Australians | 95.9 /100 | #95 | Exceptional 2.1% |
| Romanians | 95.7 /100 | #96 | Exceptional 2.1% |
| Immigrants | Afghanistan | 95.6 /100 | #97 | Exceptional 2.1% |
| Immigrants | South Africa | 95.4 /100 | #98 | Exceptional 2.1% |
| Estonians | 95.3 /100 | #99 | Exceptional 2.1% |
| Greeks | 95.1 /100 | #100 | Exceptional 2.1% |