Afghan vs Immigrants from Africa Family Poverty
COMPARE
Afghan
Immigrants from Africa
Family Poverty
Family Poverty Comparison
Afghans
Immigrants from Africa
8.8%
FAMILY POVERTY
63.5/ 100
METRIC RATING
166th/ 347
METRIC RANK
9.9%
FAMILY POVERTY
4.3/ 100
METRIC RATING
223rd/ 347
METRIC RANK
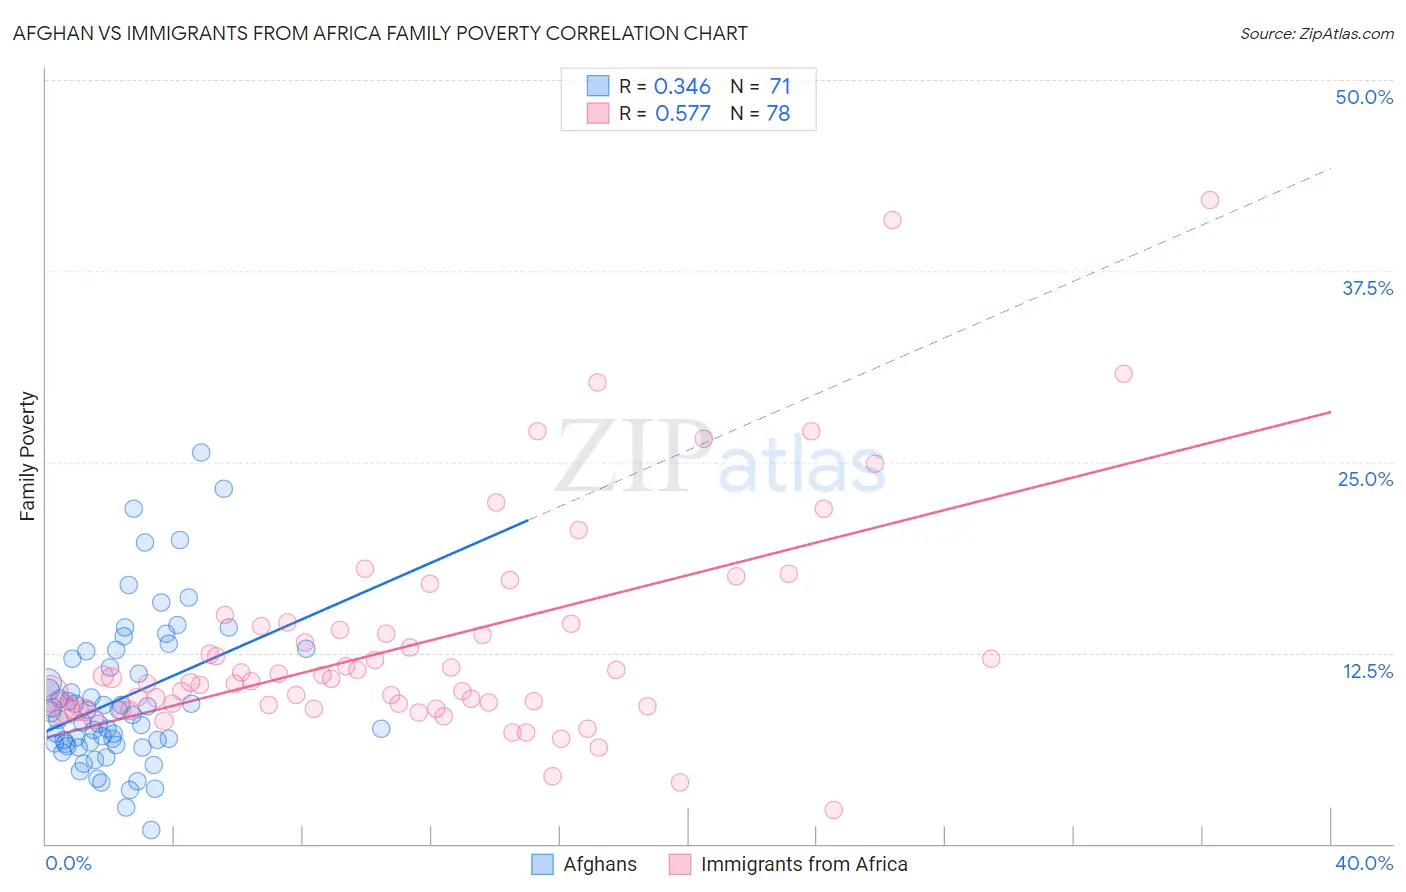
Afghan vs Immigrants from Africa Family Poverty Correlation Chart
The statistical analysis conducted on geographies consisting of 148,686,157 people shows a mild positive correlation between the proportion of Afghans and poverty level among families in the United States with a correlation coefficient (R) of 0.346 and weighted average of 8.8%. Similarly, the statistical analysis conducted on geographies consisting of 467,521,718 people shows a substantial positive correlation between the proportion of Immigrants from Africa and poverty level among families in the United States with a correlation coefficient (R) of 0.577 and weighted average of 9.9%, a difference of 12.1%.
Family Poverty Correlation Summary
| Measurement | Afghan | Immigrants from Africa |
| Minimum | 0.91% | 2.2% |
| Maximum | 25.6% | 42.2% |
| Range | 24.7% | 40.0% |
| Mean | 9.5% | 13.1% |
| Median | 8.4% | 10.7% |
| Interquartile 25% (IQ1) | 6.5% | 8.9% |
| Interquartile 75% (IQ3) | 12.1% | 14.2% |
| Interquartile Range (IQR) | 5.6% | 5.3% |
| Standard Deviation (Sample) | 4.8% | 7.4% |
| Standard Deviation (Population) | 4.8% | 7.3% |
Similar Demographics by Family Poverty
Demographics Similar to Afghans by Family Poverty
In terms of family poverty, the demographic groups most similar to Afghans are Immigrants from Ethiopia (8.9%, a difference of 0.14%), Guamanian/Chamorro (8.8%, a difference of 0.18%), Israeli (8.9%, a difference of 0.20%), Celtic (8.8%, a difference of 0.21%), and Pennsylvania German (8.8%, a difference of 0.37%).
| Demographics | Rating | Rank | Family Poverty |
| Peruvians | 68.0 /100 | #159 | Good 8.8% |
| Hungarians | 67.2 /100 | #160 | Good 8.8% |
| Immigrants | Northern Africa | 66.9 /100 | #161 | Good 8.8% |
| Ethiopians | 66.3 /100 | #162 | Good 8.8% |
| Pennsylvania Germans | 66.0 /100 | #163 | Good 8.8% |
| Celtics | 64.9 /100 | #164 | Good 8.8% |
| Guamanians/Chamorros | 64.7 /100 | #165 | Good 8.8% |
| Afghans | 63.5 /100 | #166 | Good 8.8% |
| Immigrants | Ethiopia | 62.5 /100 | #167 | Good 8.9% |
| Israelis | 62.1 /100 | #168 | Good 8.9% |
| Immigrants | Chile | 59.6 /100 | #169 | Average 8.9% |
| Kenyans | 58.2 /100 | #170 | Average 8.9% |
| Lebanese | 57.6 /100 | #171 | Average 8.9% |
| Immigrants | Peru | 57.5 /100 | #172 | Average 8.9% |
| Immigrants | Fiji | 56.4 /100 | #173 | Average 8.9% |
Demographics Similar to Immigrants from Africa by Family Poverty
In terms of family poverty, the demographic groups most similar to Immigrants from Africa are Japanese (9.9%, a difference of 0.30%), Marshallese (9.9%, a difference of 0.30%), Immigrants from Cambodia (9.9%, a difference of 0.33%), Immigrants (10.0%, a difference of 0.55%), and Bermudan (9.9%, a difference of 0.61%).
| Demographics | Rating | Rank | Family Poverty |
| Moroccans | 6.5 /100 | #216 | Tragic 9.8% |
| Americans | 6.2 /100 | #217 | Tragic 9.8% |
| Panamanians | 5.6 /100 | #218 | Tragic 9.8% |
| Immigrants | Eritrea | 5.4 /100 | #219 | Tragic 9.9% |
| Bermudans | 5.3 /100 | #220 | Tragic 9.9% |
| Immigrants | Cambodia | 4.8 /100 | #221 | Tragic 9.9% |
| Japanese | 4.8 /100 | #222 | Tragic 9.9% |
| Immigrants | Africa | 4.3 /100 | #223 | Tragic 9.9% |
| Marshallese | 3.9 /100 | #224 | Tragic 9.9% |
| Immigrants | Immigrants | 3.6 /100 | #225 | Tragic 10.0% |
| Ottawa | 3.3 /100 | #226 | Tragic 10.0% |
| Immigrants | Armenia | 3.3 /100 | #227 | Tragic 10.0% |
| Sudanese | 3.1 /100 | #228 | Tragic 10.0% |
| Immigrants | Uzbekistan | 3.1 /100 | #229 | Tragic 10.0% |
| Immigrants | Panama | 3.1 /100 | #230 | Tragic 10.0% |