Zip Codes with the Highest Percentage of Population Employed in Manufacturing in Reading, PA
RELATED REPORTS & OPTIONS
Manufacturing
Reading
Compare Zip Codes
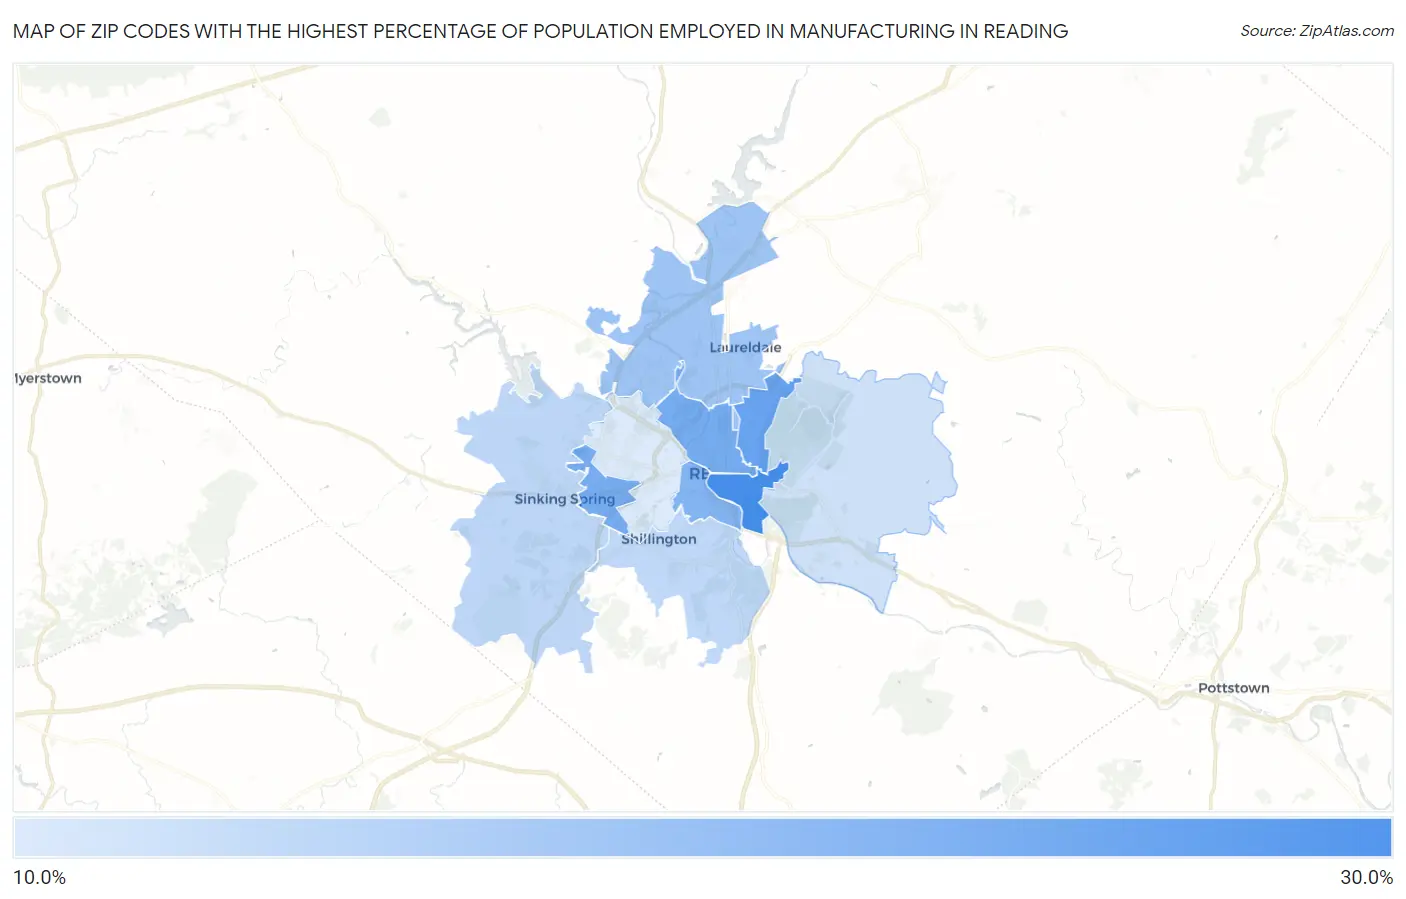
Map of Zip Codes with the Highest Percentage of Population Employed in Manufacturing in Reading
0.0%
30.0%
Zip Codes with the Highest Percentage of Population Employed in Manufacturing in Reading, PA
| Zip Code | % Employed | vs State | vs National | |
| 1. | 19602 | 25.4% | 11.6%(+13.9)#158 | 10.0%(+15.4)#2,358 |
| 2. | 19604 | 22.5% | 11.6%(+11.0)#244 | 10.0%(+12.5)#3,521 |
| 3. | 19601 | 21.4% | 11.6%(+9.80)#282 | 10.0%(+11.4)#4,099 |
| 4. | 19609 | 21.0% | 11.6%(+9.44)#306 | 10.0%(+11.0)#4,296 |
| 5. | 19611 | 20.0% | 11.6%(+8.41)#357 | 10.0%(+9.98)#4,904 |
| 6. | 19605 | 17.7% | 11.6%(+6.16)#472 | 10.0%(+7.73)#6,538 |
| 7. | 19608 | 15.0% | 11.6%(+3.44)#660 | 10.0%(+5.01)#9,071 |
| 8. | 19607 | 14.8% | 11.6%(+3.28)#670 | 10.0%(+4.85)#9,245 |
| 9. | 19606 | 13.6% | 11.6%(+2.01)#796 | 10.0%(+3.58)#10,678 |
| 10. | 19610 | 12.4% | 11.6%(+0.808)#922 | 10.0%(+2.38)#12,191 |
1
Common Questions
What are the Top 5 Zip Codes with the Highest Percentage of Population Employed in Manufacturing in Reading, PA?
Top 5 Zip Codes with the Highest Percentage of Population Employed in Manufacturing in Reading, PA are:
What zip code has the Highest Percentage of Population Employed in Manufacturing in Reading, PA?
19602 has the Highest Percentage of Population Employed in Manufacturing in Reading, PA with 25.4%.
What is the Percentage of Population Employed in Manufacturing in Reading, PA?
Percentage of Population Employed in Manufacturing in Reading is 21.8%.
What is the Percentage of Population Employed in Manufacturing in Pennsylvania?
Percentage of Population Employed in Manufacturing in Pennsylvania is 11.6%.
What is the Percentage of Population Employed in Manufacturing in the United States?
Percentage of Population Employed in Manufacturing in the United States is 10.0%.