Zip Codes with the Highest Percentage of Black / African American Population in Reading, PA
RELATED REPORTS & OPTIONS
Black / African American
Reading
Compare Zip Codes
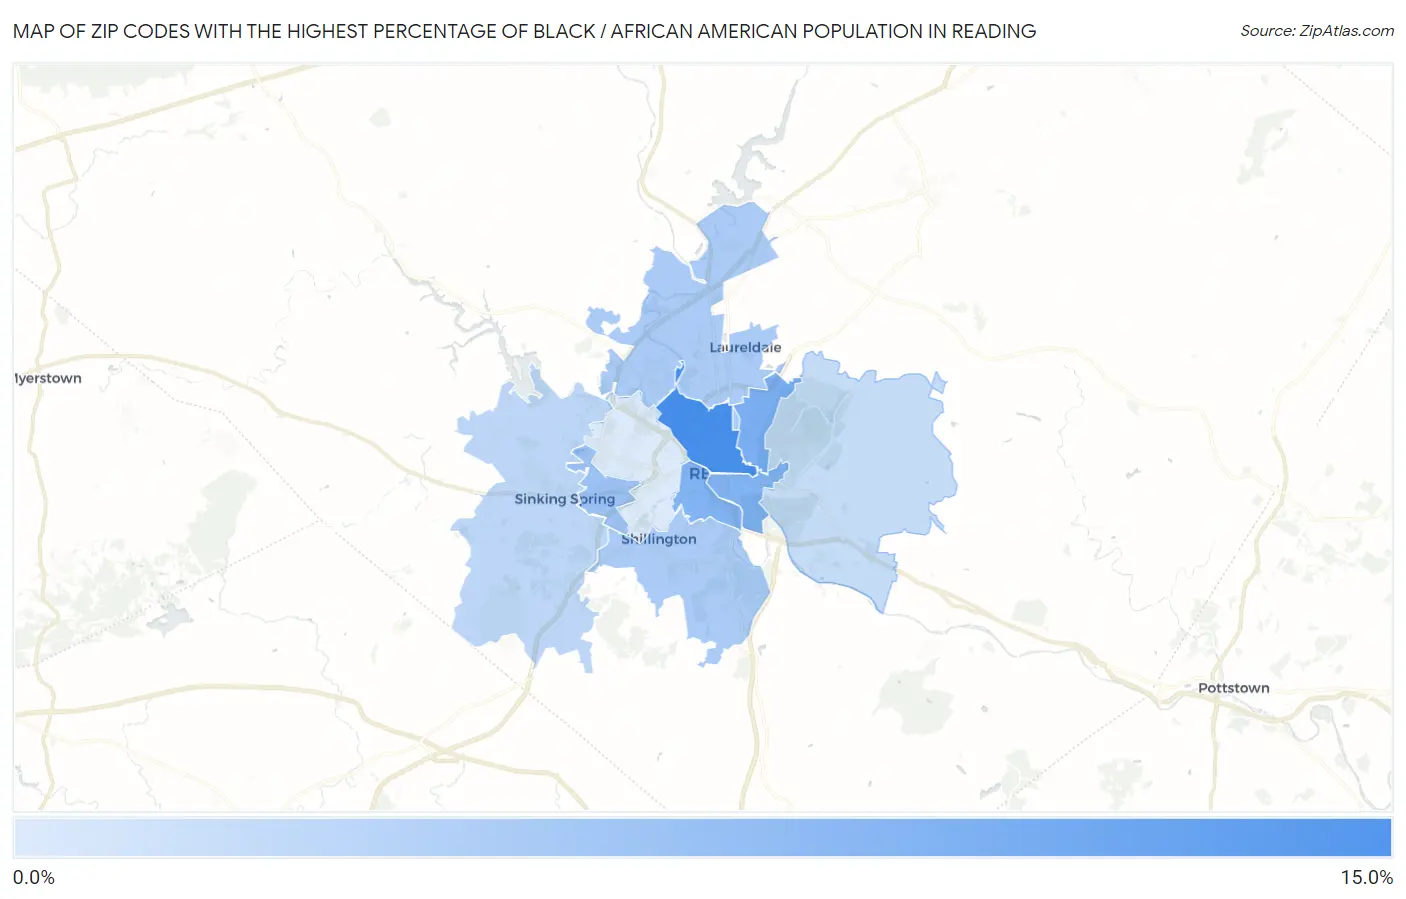
Map of Zip Codes with the Highest Percentage of Black / African American Population in Reading
2.5%
13.5%
Zip Codes with the Highest Percentage of Black / African American Population in Reading, PA
| Zip Code | Black / African American | vs State | vs National | |
| 1. | 19601 | 13.5% | 10.8%(+2.63)#144 | 12.5%(+0.998)#5,389 |
| 2. | 19604 | 9.7% | 10.8%(-1.11)#186 | 12.5%(-2.75)#6,737 |
| 3. | 19611 | 9.2% | 10.8%(-1.63)#191 | 12.5%(-3.26)#6,942 |
| 4. | 19602 | 9.1% | 10.8%(-1.75)#194 | 12.5%(-3.39)#6,996 |
| 5. | 19609 | 7.3% | 10.8%(-3.52)#227 | 12.5%(-5.15)#7,912 |
| 6. | 19607 | 6.2% | 10.8%(-4.64)#266 | 12.5%(-6.28)#8,624 |
| 7. | 19605 | 6.0% | 10.8%(-4.79)#272 | 12.5%(-6.42)#8,724 |
| 8. | 19608 | 4.8% | 10.8%(-6.07)#333 | 12.5%(-7.71)#9,762 |
| 9. | 19606 | 4.2% | 10.8%(-6.66)#367 | 12.5%(-8.29)#10,315 |
| 10. | 19610 | 2.5% | 10.8%(-8.29)#495 | 12.5%(-9.92)#12,528 |
1
Common Questions
What are the Top 5 Zip Codes with the Highest Percentage of Black / African American Population in Reading, PA?
Top 5 Zip Codes with the Highest Percentage of Black / African American Population in Reading, PA are:
What zip code has the Highest Percentage of Black / African American Population in Reading, PA?
19601 has the Highest Percentage of Black / African American Population in Reading, PA with 13.5%.
What is the Percentage of Black / African American Population in Reading, PA?
Percentage of Black / African American Population in Reading is 11.2%.
What is the Percentage of Black / African American Population in Pennsylvania?
Percentage of Black / African American Population in Pennsylvania is 10.8%.
What is the Percentage of Black / African American Population in the United States?
Percentage of Black / African American Population in the United States is 12.5%.