Zip Codes with the Highest Percentage of Black / African American Population in Chambersburg, PA
RELATED REPORTS & OPTIONS
Black / African American
Chambersburg
Compare Zip Codes
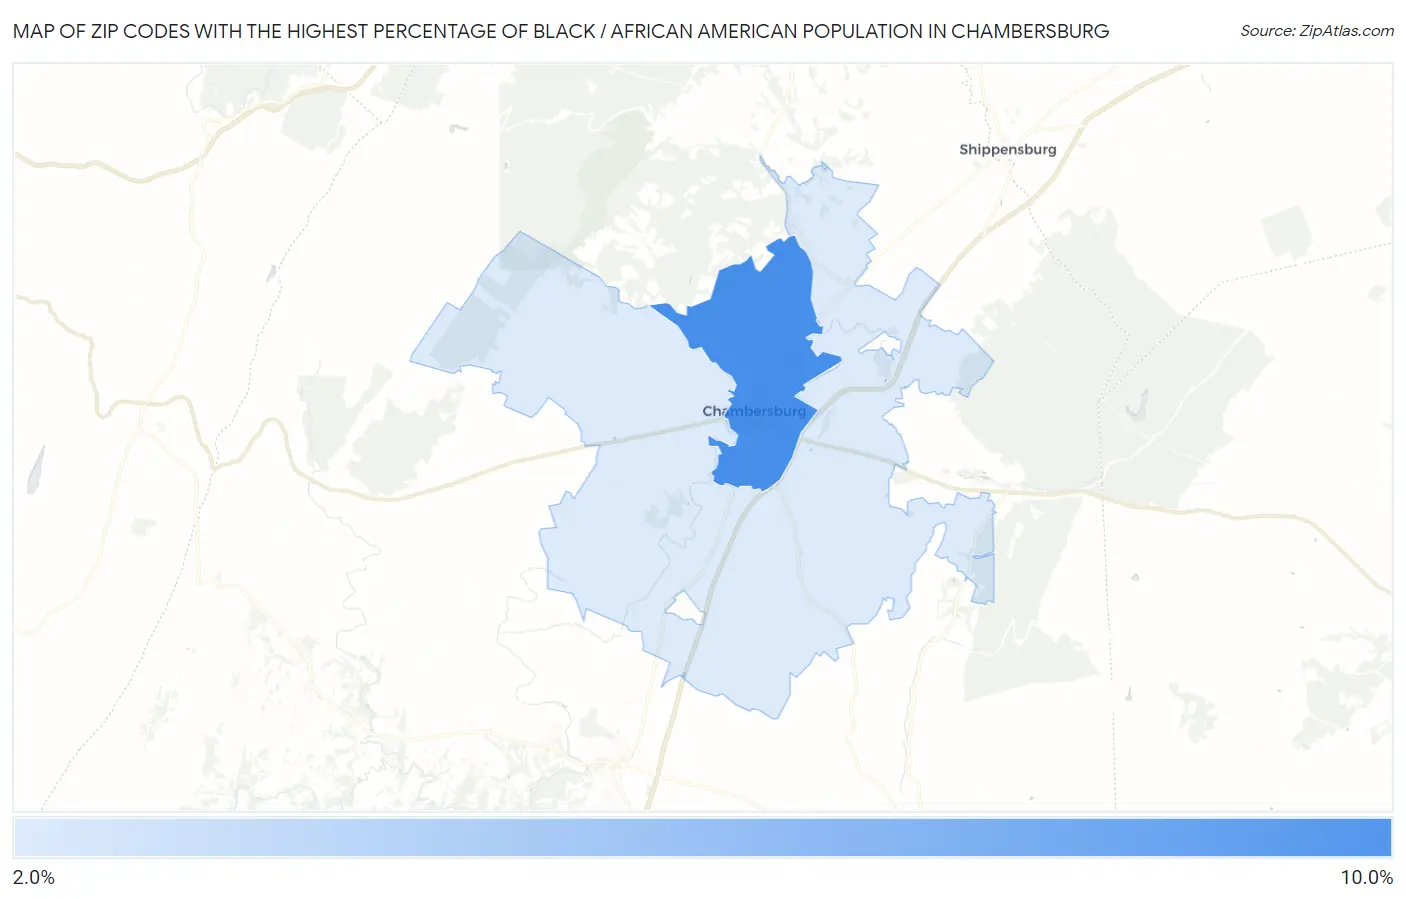
Map of Zip Codes with the Highest Percentage of Black / African American Population in Chambersburg
2.6%
8.1%
Zip Codes with the Highest Percentage of Black / African American Population in Chambersburg, PA
| Zip Code | Black / African American | vs State | vs National | |
| 1. | 17201 | 8.1% | 10.8%(-2.74)#213 | 12.5%(-4.37)#7,492 |
| 2. | 17202 | 2.6% | 10.8%(-8.21)#489 | 12.5%(-9.84)#12,404 |
1
Common Questions
What are the Top Zip Codes with the Highest Percentage of Black / African American Population in Chambersburg, PA?
Top Zip Codes with the Highest Percentage of Black / African American Population in Chambersburg, PA are:
What zip code has the Highest Percentage of Black / African American Population in Chambersburg, PA?
17201 has the Highest Percentage of Black / African American Population in Chambersburg, PA with 8.1%.
What is the Percentage of Black / African American Population in Pennsylvania?
Percentage of Black / African American Population in Pennsylvania is 10.8%.
What is the Percentage of Black / African American Population in the United States?
Percentage of Black / African American Population in the United States is 12.5%.