Zip Codes with the Highest Percentage of Households Heated by Bottled Gas / Liquid Propane in Butler, PA
RELATED REPORTS & OPTIONS
Bottled Gas / LP Heating
Butler
Compare Zip Codes
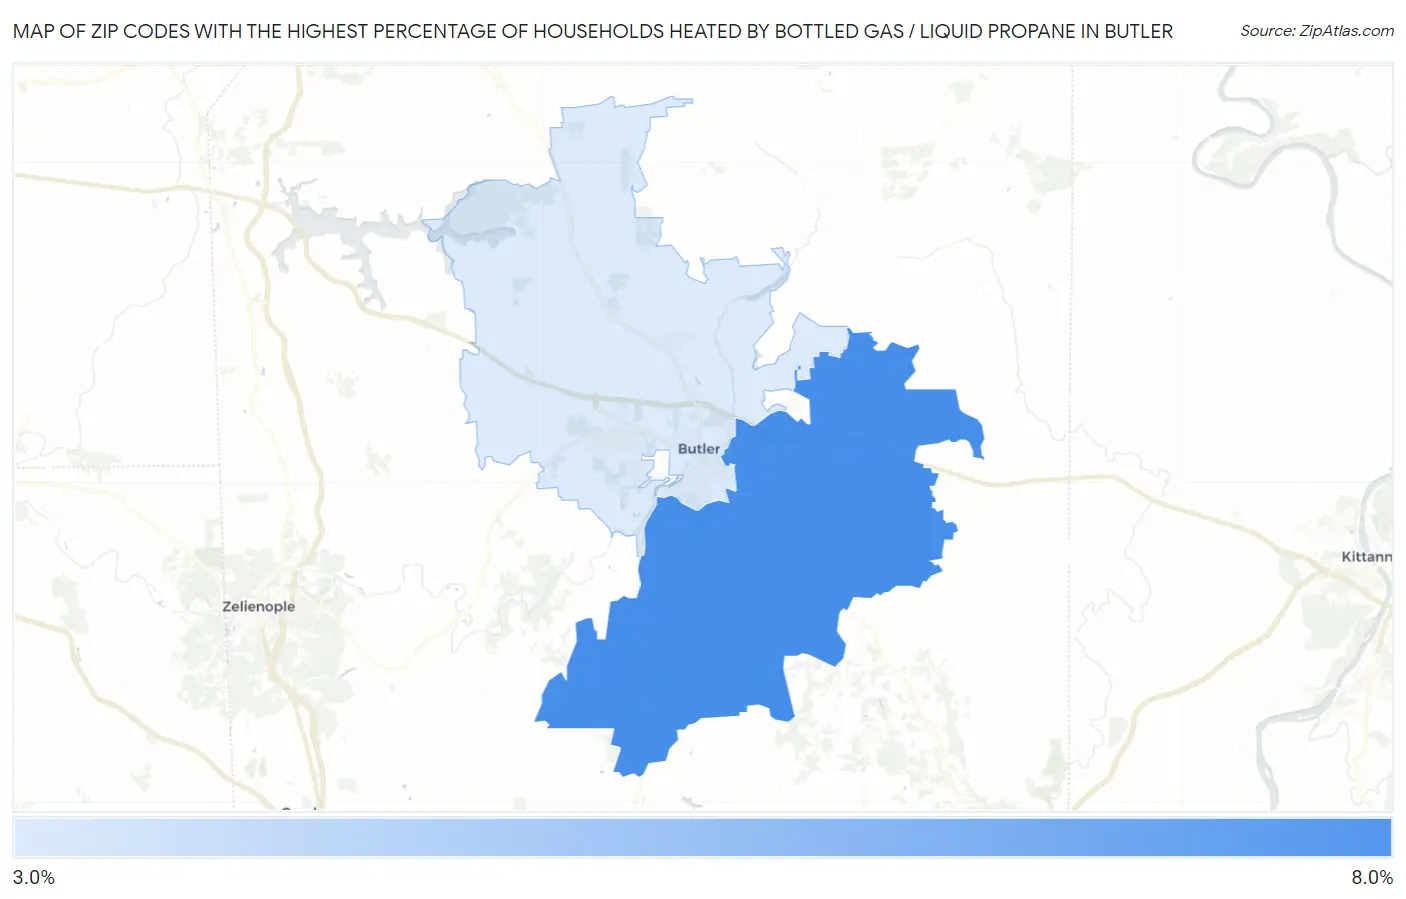
Map of Zip Codes with the Highest Percentage of Households Heated by Bottled Gas / Liquid Propane in Butler
0.0%
8.0%
Zip Codes with the Highest Percentage of Households Heated by Bottled Gas / Liquid Propane in Butler, PA
| Zip Code | Bottled Gas / LP Heating | vs State | vs National | |
| 1. | 16002 | 6.7% | 4.8%(+1.90)#643 | 4.9%(+1.80)#16,990 |
| 2. | 16001 | 3.1% | 4.8%(-1.70)#989 | 4.9%(-1.80)#20,830 |
1
Common Questions
What are the Top Zip Codes with the Highest Percentage of Households Heated by Bottled Gas / Liquid Propane in Butler, PA?
Top Zip Codes with the Highest Percentage of Households Heated by Bottled Gas / Liquid Propane in Butler, PA are:
What zip code has the Highest Percentage of Households Heated by Bottled Gas / Liquid Propane in Butler, PA?
16002 has the Highest Percentage of Households Heated by Bottled Gas / Liquid Propane in Butler, PA with 6.7%.
What is the Percentage of Households Heated by Bottled Gas / Liquid Propane in Butler, PA?
Percentage of Households Heated by Bottled Gas / Liquid Propane in Butler is 1.7%.
What is the Percentage of Households Heated by Bottled Gas / Liquid Propane in Pennsylvania?
Percentage of Households Heated by Bottled Gas / Liquid Propane in Pennsylvania is 4.8%.
What is the Percentage of Households Heated by Bottled Gas / Liquid Propane in the United States?
Percentage of Households Heated by Bottled Gas / Liquid Propane in the United States is 4.9%.