Zip Codes with the Highest Percentage of Black / African American Population in Butler, PA
RELATED REPORTS & OPTIONS
Black / African American
Butler
Compare Zip Codes
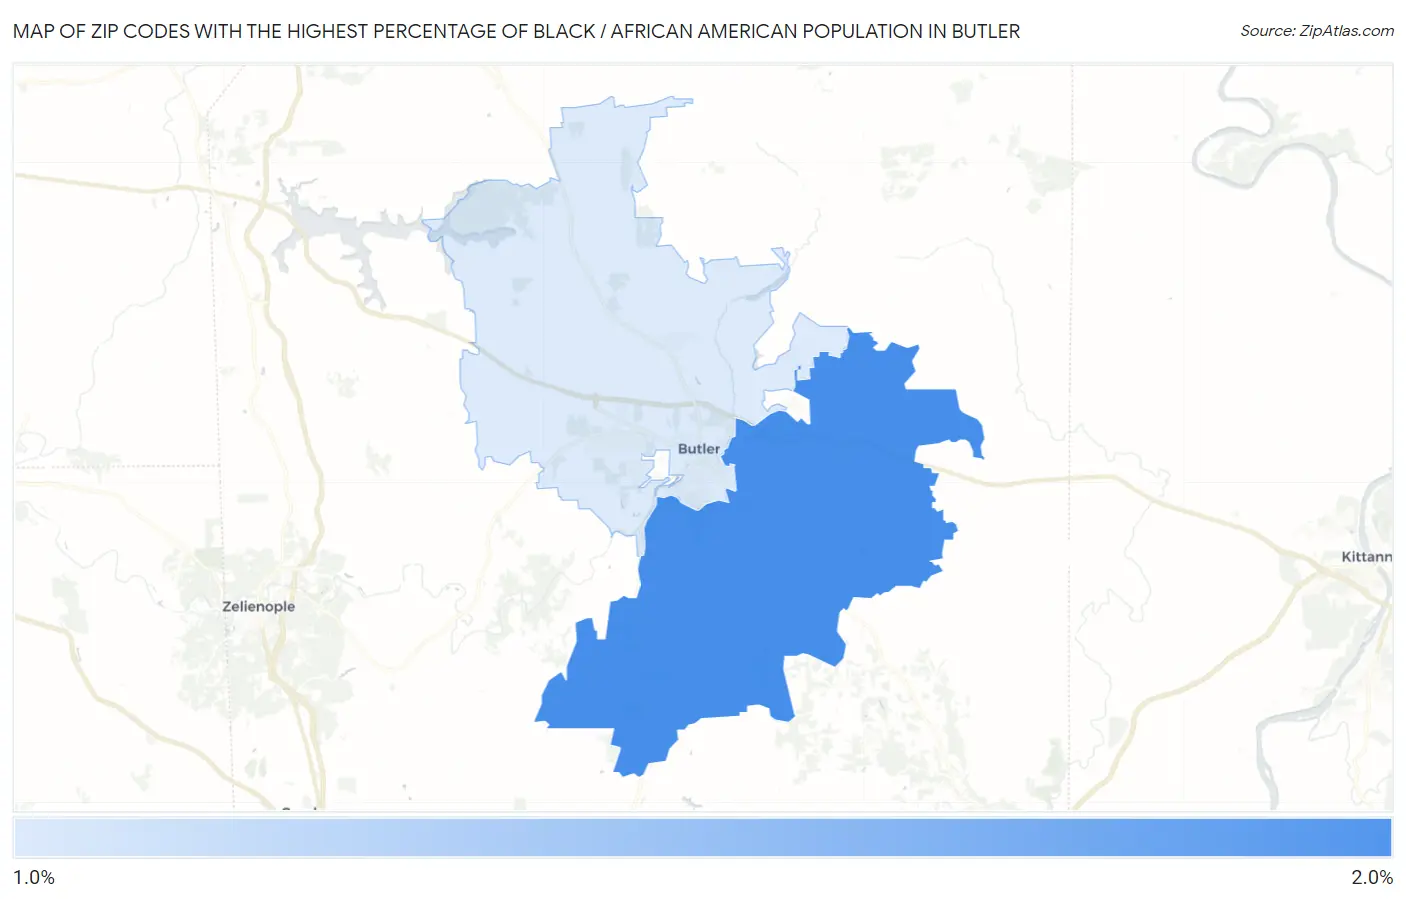
Map of Zip Codes with the Highest Percentage of Black / African American Population in Butler
1.5%
1.8%
Zip Codes with the Highest Percentage of Black / African American Population in Butler, PA
| Zip Code | Black / African American | vs State | vs National | |
| 1. | 16002 | 1.8% | 10.8%(-9.04)#580 | 12.5%(-10.7)#14,049 |
| 2. | 16001 | 1.5% | 10.8%(-9.30)#617 | 12.5%(-10.9)#14,725 |
1
Common Questions
What are the Top Zip Codes with the Highest Percentage of Black / African American Population in Butler, PA?
Top Zip Codes with the Highest Percentage of Black / African American Population in Butler, PA are:
What zip code has the Highest Percentage of Black / African American Population in Butler, PA?
16002 has the Highest Percentage of Black / African American Population in Butler, PA with 1.8%.
What is the Percentage of Black / African American Population in Butler, PA?
Percentage of Black / African American Population in Butler is 2.7%.
What is the Percentage of Black / African American Population in Pennsylvania?
Percentage of Black / African American Population in Pennsylvania is 10.8%.
What is the Percentage of Black / African American Population in the United States?
Percentage of Black / African American Population in the United States is 12.5%.