Zip Codes with the Highest Percentage of Population Employed in Accommodation & Food Services in Hillsboro, OR
RELATED REPORTS & OPTIONS
Accommodation & Food Services
Hillsboro
Compare Zip Codes
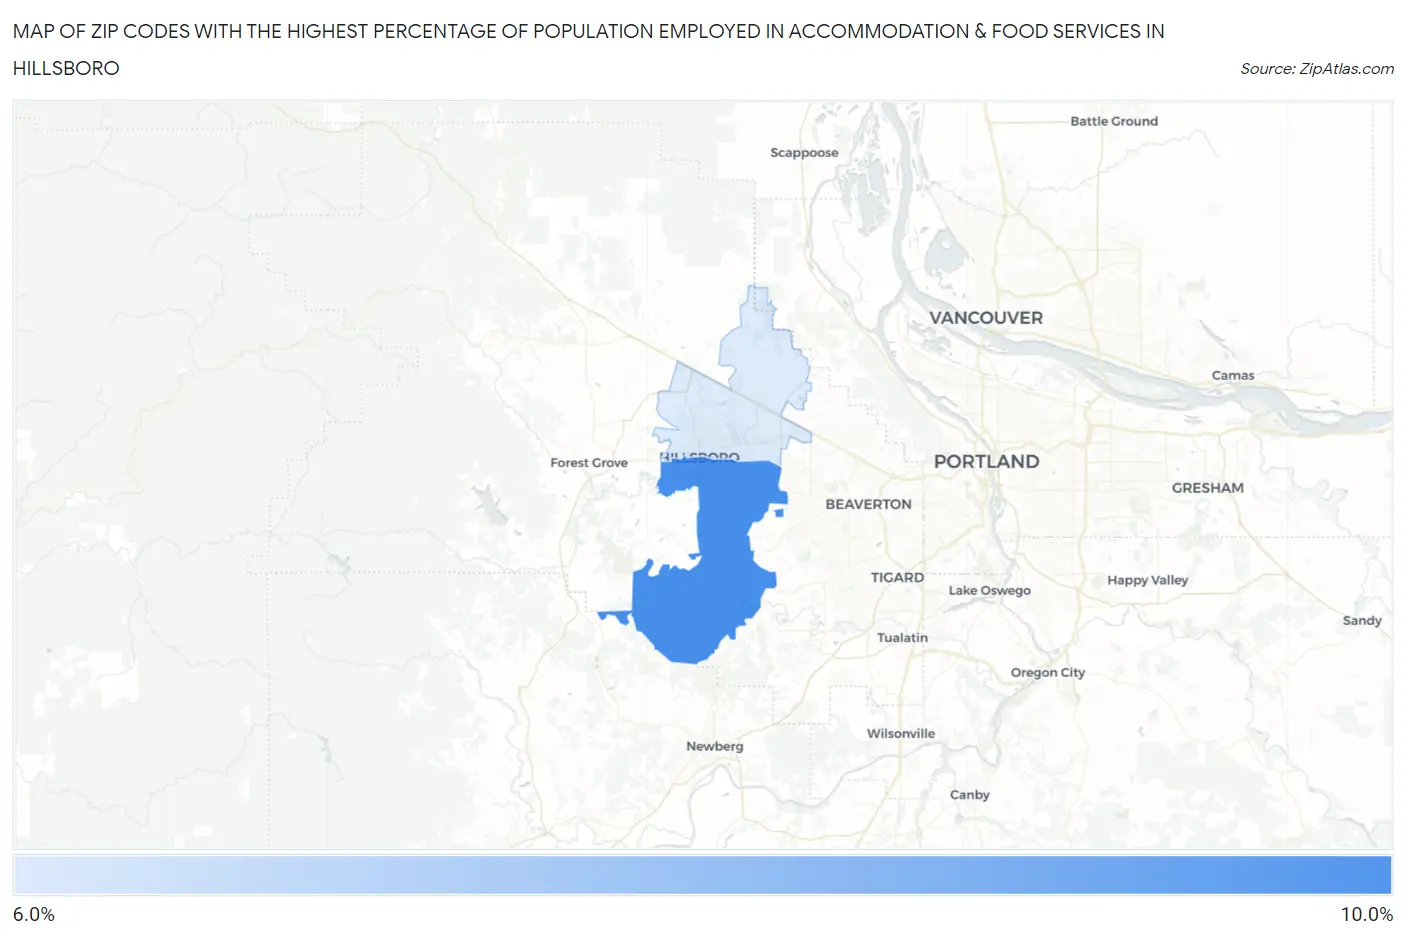
Map of Zip Codes with the Highest Percentage of Population Employed in Accommodation & Food Services in Hillsboro
6.1%
9.9%
Zip Codes with the Highest Percentage of Population Employed in Accommodation & Food Services in Hillsboro, OR
| Zip Code | % Employed | vs State | vs National | |
| 1. | 97123 | 9.9% | 7.2%(+2.68)#82 | 6.9%(+3.02)#4,661 |
| 2. | 97124 | 6.1% | 7.2%(-1.08)#200 | 6.9%(-0.731)#12,965 |
1
Common Questions
What are the Top Zip Codes with the Highest Percentage of Population Employed in Accommodation & Food Services in Hillsboro, OR?
Top Zip Codes with the Highest Percentage of Population Employed in Accommodation & Food Services in Hillsboro, OR are:
What zip code has the Highest Percentage of Population Employed in Accommodation & Food Services in Hillsboro, OR?
97123 has the Highest Percentage of Population Employed in Accommodation & Food Services in Hillsboro, OR with 9.9%.
What is the Percentage of Population Employed in Accommodation & Food Services in Hillsboro, OR?
Percentage of Population Employed in Accommodation & Food Services in Hillsboro is 7.7%.
What is the Percentage of Population Employed in Accommodation & Food Services in Oregon?
Percentage of Population Employed in Accommodation & Food Services in Oregon is 7.2%.
What is the Percentage of Population Employed in Accommodation & Food Services in the United States?
Percentage of Population Employed in Accommodation & Food Services in the United States is 6.9%.