Zip Codes with the Highest Percentage of Population Employed in Transportation & Warehousing in Youngstown, OH
RELATED REPORTS & OPTIONS
Transportation & Warehousing
Youngstown
Compare Zip Codes
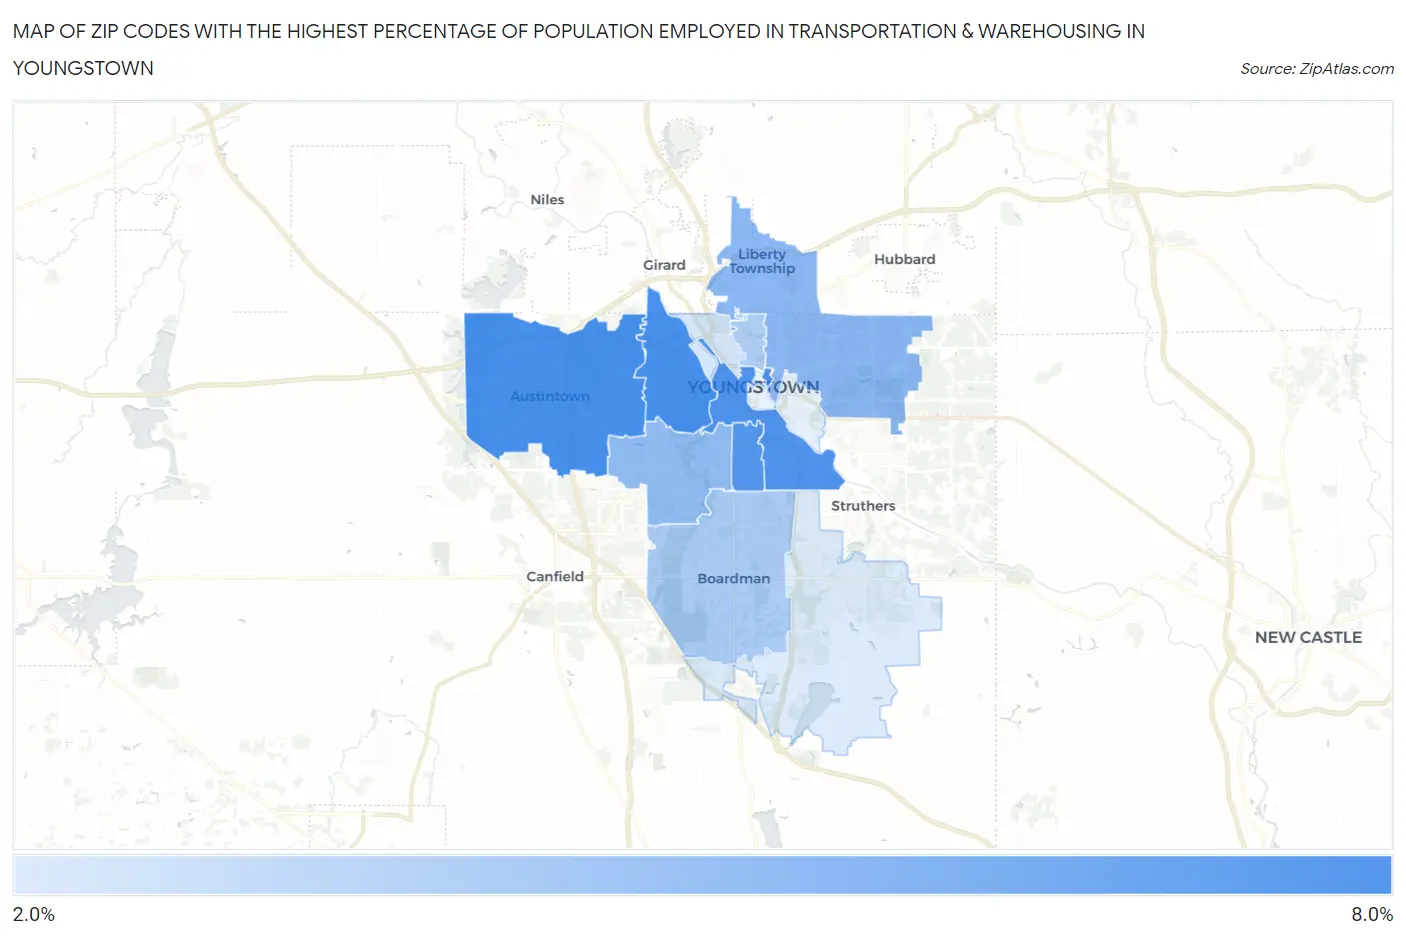
Map of Zip Codes with the Highest Percentage of Population Employed in Transportation & Warehousing in Youngstown
0.0%
8.0%
Zip Codes with the Highest Percentage of Population Employed in Transportation & Warehousing in Youngstown, OH
| Zip Code | % Employed | vs State | vs National | |
| 1. | 44509 | 6.9% | 4.9%(+1.96)#272 | 4.9%(+1.95)#6,767 |
| 2. | 44515 | 6.9% | 4.9%(+1.96)#273 | 4.9%(+1.95)#6,769 |
| 3. | 44502 | 6.7% | 4.9%(+1.75)#295 | 4.9%(+1.74)#7,187 |
| 4. | 44507 | 6.4% | 4.9%(+1.51)#314 | 4.9%(+1.50)#7,685 |
| 5. | 44505 | 4.7% | 4.9%(-0.242)#566 | 4.9%(-0.252)#13,048 |
| 6. | 44511 | 4.4% | 4.9%(-0.501)#603 | 4.9%(-0.511)#14,016 |
| 7. | 44512 | 3.6% | 4.9%(-1.29)#743 | 4.9%(-1.31)#17,471 |
| 8. | 44504 | 3.5% | 4.9%(-1.46)#771 | 4.9%(-1.47)#18,172 |
| 9. | 44510 | 2.2% | 4.9%(-2.72)#946 | 4.9%(-2.73)#23,501 |
| 10. | 44514 | 2.0% | 4.9%(-2.93)#975 | 4.9%(-2.94)#24,249 |
1
Common Questions
What are the Top 10 Zip Codes with the Highest Percentage of Population Employed in Transportation & Warehousing in Youngstown, OH?
Top 10 Zip Codes with the Highest Percentage of Population Employed in Transportation & Warehousing in Youngstown, OH are:
What zip code has the Highest Percentage of Population Employed in Transportation & Warehousing in Youngstown, OH?
44509 has the Highest Percentage of Population Employed in Transportation & Warehousing in Youngstown, OH with 6.9%.
What is the Percentage of Population Employed in Transportation & Warehousing in Youngstown, OH?
Percentage of Population Employed in Transportation & Warehousing in Youngstown is 5.2%.
What is the Percentage of Population Employed in Transportation & Warehousing in Ohio?
Percentage of Population Employed in Transportation & Warehousing in Ohio is 4.9%.
What is the Percentage of Population Employed in Transportation & Warehousing in the United States?
Percentage of Population Employed in Transportation & Warehousing in the United States is 4.9%.