Wallkill, NY Map & Demographics
Wallkill Map
Wallkill Overview
$38,472
PER CAPITA INCOME
$82,386
AVG FAMILY INCOME
$73,870
AVG HOUSEHOLD INCOME
16.0%
WAGE / INCOME GAP [ % ]
84.0¢/ $1
WAGE / INCOME GAP [ $ ]
0.35
INEQUALITY / GINI INDEX
1,859
TOTAL POPULATION
931
MALE POPULATION
928
FEMALE POPULATION
100.32
MALES / 100 FEMALES
99.68
FEMALES / 100 MALES
45.7
MEDIAN AGE
2.6
AVG FAMILY SIZE
2.3
AVG HOUSEHOLD SIZE
938
LABOR FORCE [ PEOPLE ]
58.1%
PERCENT IN LABOR FORCE
4.2%
UNEMPLOYMENT RATE
Wallkill Zip Codes
Wallkill Area Codes
Income in Wallkill
Income Overview in Wallkill
Per Capita Income in Wallkill is $38,472, while median incomes of families and households are $82,386 and $73,870 respectively.
| Characteristic | Number | Measure |
| Per Capita Income | 1,859 | $38,472 |
| Median Family Income | 566 | $82,386 |
| Mean Family Income | 566 | $104,848 |
| Median Household Income | 809 | $73,870 |
| Mean Household Income | 809 | $88,081 |
| Income Deficit | 566 | $0 |
| Wage / Income Gap (%) | 1,859 | 16.00% |
| Wage / Income Gap ($) | 1,859 | 84.00¢ per $1 |
| Gini / Inequality Index | 1,859 | 0.35 |
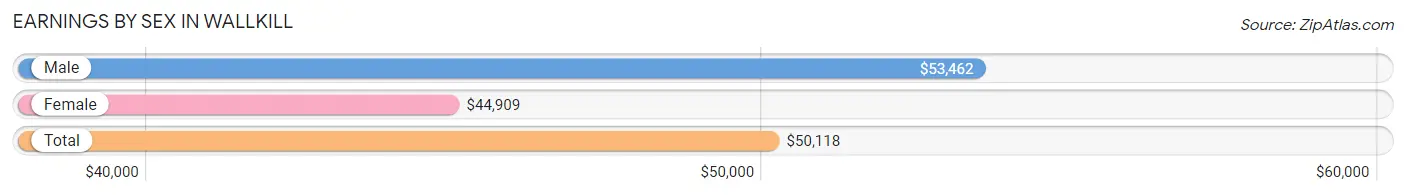
Earnings by Sex in Wallkill
Average Earnings in Wallkill are $50,118, $53,462 for men and $44,909 for women, a difference of 16.0%.
| Sex | Number | Average Earnings |
| Male | 488 (51.4%) | $53,462 |
| Female | 461 (48.6%) | $44,909 |
| Total | 949 (100.0%) | $50,118 |
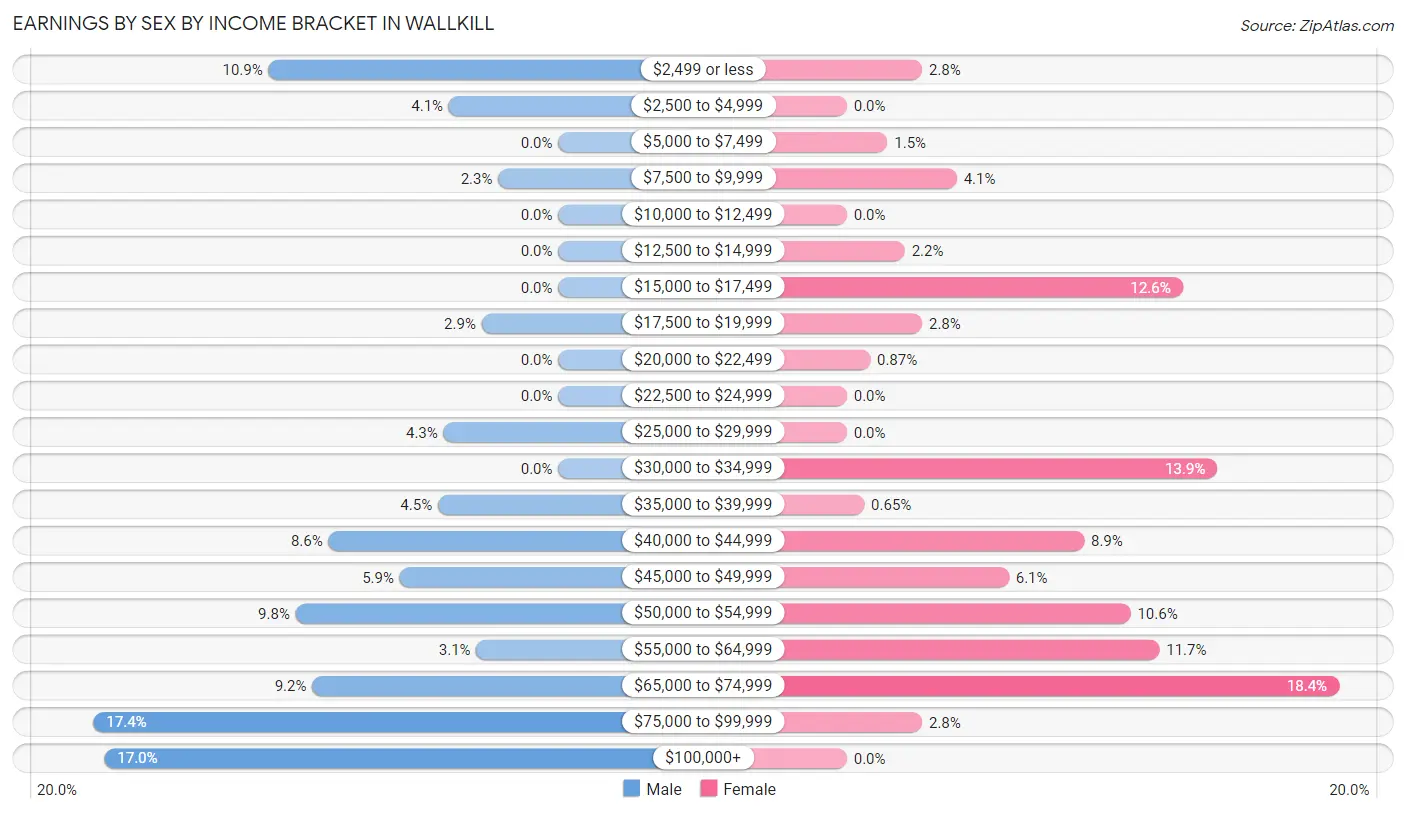
Earnings by Sex by Income Bracket in Wallkill
The most common earnings brackets in Wallkill are $75,000 to $99,999 for men (85 | 17.4%) and $65,000 to $74,999 for women (85 | 18.4%).
| Income | Male | Female |
| $2,499 or less | 53 (10.9%) | 13 (2.8%) |
| $2,500 to $4,999 | 20 (4.1%) | 0 (0.0%) |
| $5,000 to $7,499 | 0 (0.0%) | 7 (1.5%) |
| $7,500 to $9,999 | 11 (2.2%) | 19 (4.1%) |
| $10,000 to $12,499 | 0 (0.0%) | 0 (0.0%) |
| $12,500 to $14,999 | 0 (0.0%) | 10 (2.2%) |
| $15,000 to $17,499 | 0 (0.0%) | 58 (12.6%) |
| $17,500 to $19,999 | 14 (2.9%) | 13 (2.8%) |
| $20,000 to $22,499 | 0 (0.0%) | 4 (0.9%) |
| $22,500 to $24,999 | 0 (0.0%) | 0 (0.0%) |
| $25,000 to $29,999 | 21 (4.3%) | 0 (0.0%) |
| $30,000 to $34,999 | 0 (0.0%) | 64 (13.9%) |
| $35,000 to $39,999 | 22 (4.5%) | 3 (0.6%) |
| $40,000 to $44,999 | 42 (8.6%) | 41 (8.9%) |
| $45,000 to $49,999 | 29 (5.9%) | 28 (6.1%) |
| $50,000 to $54,999 | 48 (9.8%) | 49 (10.6%) |
| $55,000 to $64,999 | 15 (3.1%) | 54 (11.7%) |
| $65,000 to $74,999 | 45 (9.2%) | 85 (18.4%) |
| $75,000 to $99,999 | 85 (17.4%) | 13 (2.8%) |
| $100,000+ | 83 (17.0%) | 0 (0.0%) |
| Total | 488 (100.0%) | 461 (100.0%) |
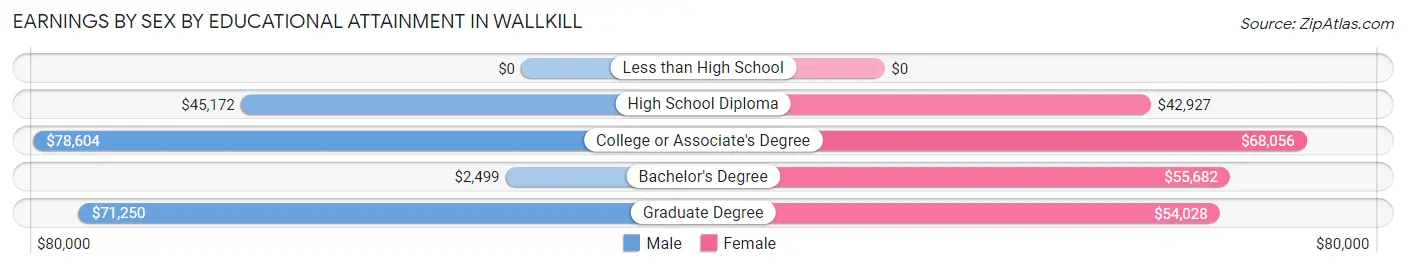
Earnings by Sex by Educational Attainment in Wallkill
Average earnings in Wallkill are $55,250 for men and $44,970 for women, a difference of 18.6%. Men with an educational attainment of college or associate's degree enjoy the highest average annual earnings of $78,604, while those with bachelor's degree education earn the least with $2,499. Women with an educational attainment of college or associate's degree earn the most with the average annual earnings of $68,056, while those with high school diploma education have the smallest earnings of $42,927.
| Educational Attainment | Male Income | Female Income |
| Less than High School | - | - |
| High School Diploma | $45,172 | $42,927 |
| College or Associate's Degree | $78,604 | $68,056 |
| Bachelor's Degree | $2,499 | $55,682 |
| Graduate Degree | $71,250 | $54,028 |
| Total | $55,250 | $44,970 |
Family Income in Wallkill
Family Income Brackets in Wallkill
According to the Wallkill family income data, there are 179 families falling into the $100,000 to $149,999 income range, which is the most common income bracket and makes up 31.6% of all families.
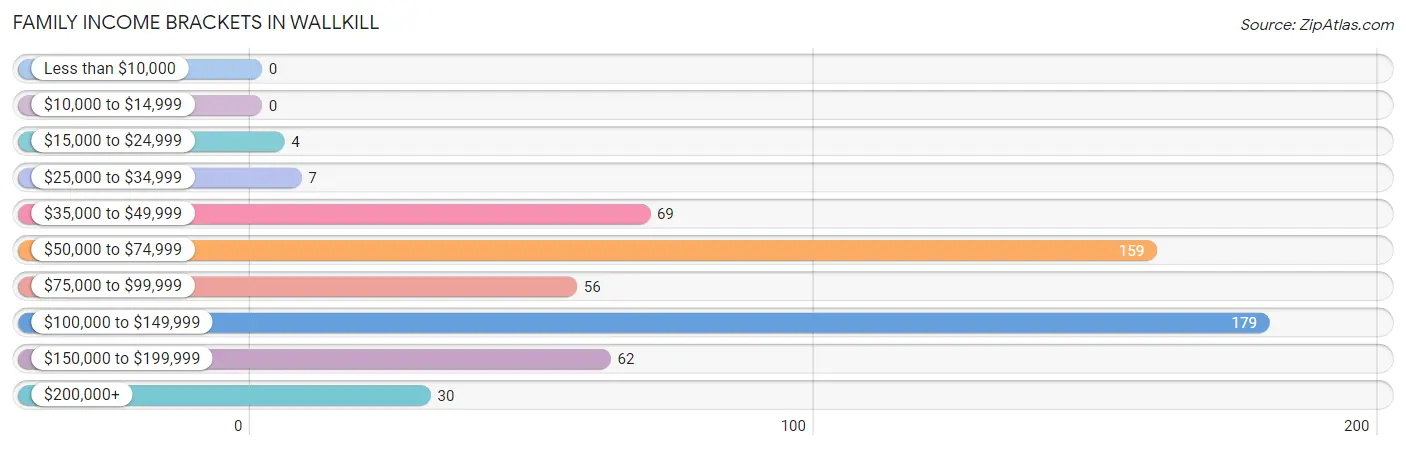
| Income Bracket | # Families | % Families |
| Less than $10,000 | 0 | 0.0% |
| $10,000 to $14,999 | 0 | 0.0% |
| $15,000 to $24,999 | 4 | 0.7% |
| $25,000 to $34,999 | 7 | 1.2% |
| $35,000 to $49,999 | 69 | 12.2% |
| $50,000 to $74,999 | 159 | 28.1% |
| $75,000 to $99,999 | 56 | 9.9% |
| $100,000 to $149,999 | 179 | 31.6% |
| $150,000 to $199,999 | 62 | 11.0% |
| $200,000+ | 30 | 5.3% |
Family Income by Famaliy Size in Wallkill
2-person families (276 | 48.8%) account for the highest median family income in Wallkill with $80,568 per family, while 2-person families (276 | 48.8%) have the highest median income of $40,284 per family member.
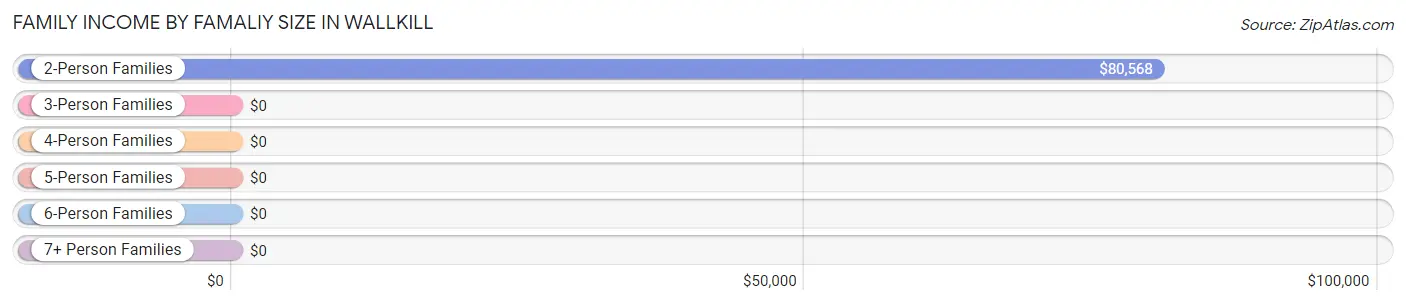
| Income Bracket | # Families | Median Income |
| 2-Person Families | 276 (48.8%) | $80,568 |
| 3-Person Families | 255 (45.1%) | $0 |
| 4-Person Families | 22 (3.9%) | $0 |
| 5-Person Families | 13 (2.3%) | $0 |
| 6-Person Families | 0 (0.0%) | $0 |
| 7+ Person Families | 0 (0.0%) | $0 |
| Total | 566 (100.0%) | $82,386 |
Family Income by Number of Earners in Wallkill
The median family income in Wallkill is $82,386, with families comprising 3+ earners (38) having the highest median family income of $247,935, while families with 1 earner (282) have the lowest median family income of $59,695, accounting for 6.7% and 49.8% of families, respectively.
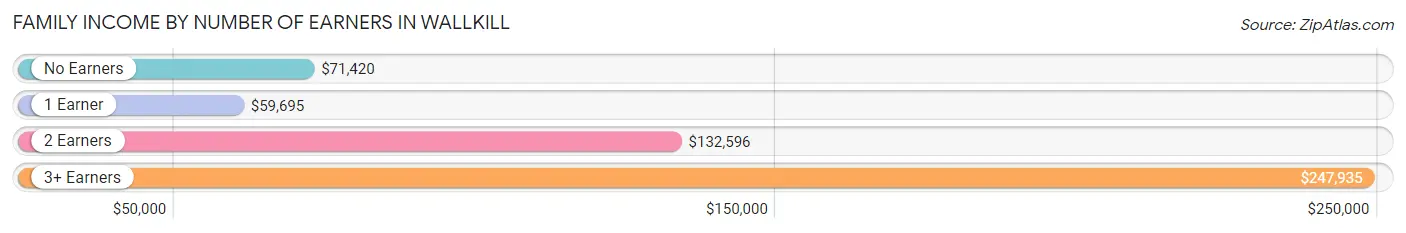
| Number of Earners | # Families | Median Income |
| No Earners | 79 (14.0%) | $71,420 |
| 1 Earner | 282 (49.8%) | $59,695 |
| 2 Earners | 167 (29.5%) | $132,596 |
| 3+ Earners | 38 (6.7%) | $247,935 |
| Total | 566 (100.0%) | $82,386 |
Household Income in Wallkill
Household Income Brackets in Wallkill
With 217 households falling in the category, the $50,000 to $74,999 income range is the most frequent in Wallkill, accounting for 26.8% of all households.
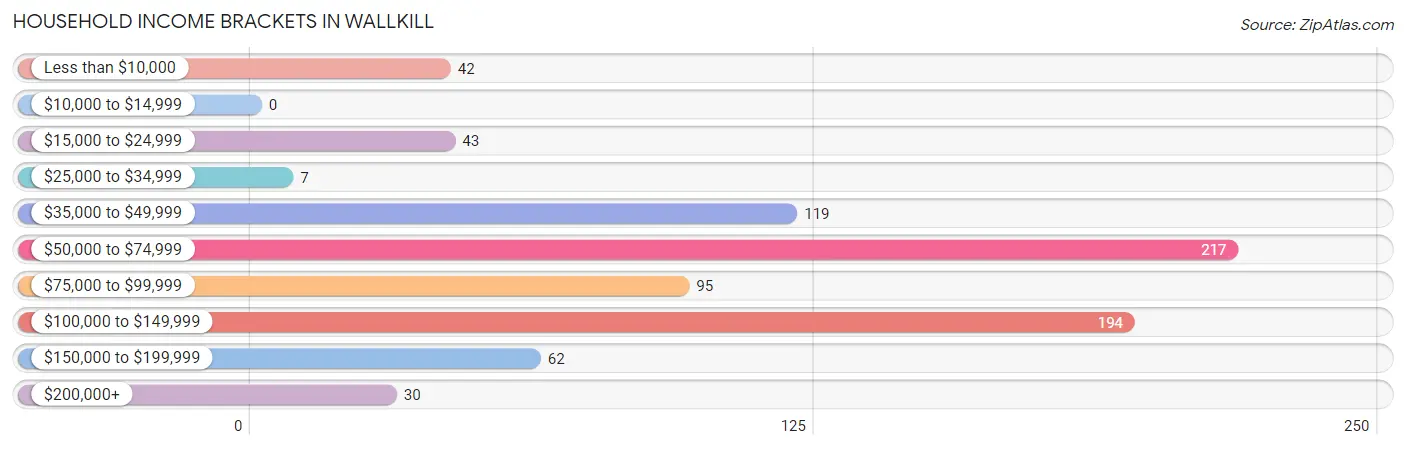
| Income Bracket | # Households | % Households |
| Less than $10,000 | 42 | 5.2% |
| $10,000 to $14,999 | 0 | 0.0% |
| $15,000 to $24,999 | 43 | 5.3% |
| $25,000 to $34,999 | 7 | 0.9% |
| $35,000 to $49,999 | 119 | 14.7% |
| $50,000 to $74,999 | 217 | 26.8% |
| $75,000 to $99,999 | 95 | 11.7% |
| $100,000 to $149,999 | 194 | 24.0% |
| $150,000 to $199,999 | 62 | 7.7% |
| $200,000+ | 30 | 3.7% |
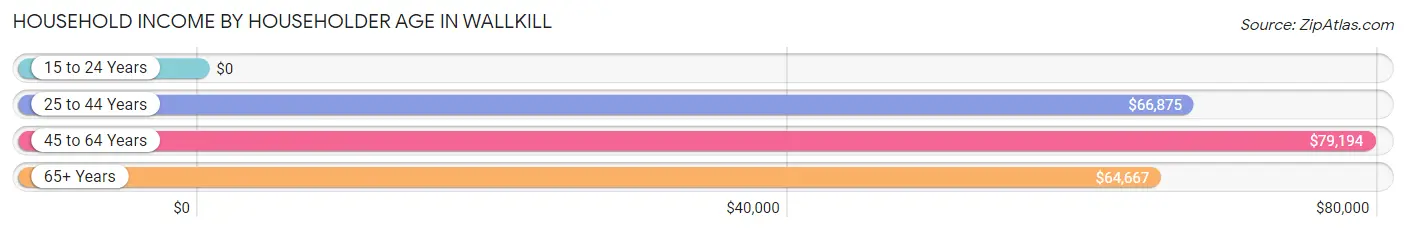
Household Income by Householder Age in Wallkill
The median household income in Wallkill is $73,870, with the highest median household income of $79,194 found in the 45 to 64 years age bracket for the primary householder. A total of 405 households (50.1%) fall into this category.
| Income Bracket | # Households | Median Income |
| 15 to 24 Years | 0 (0.0%) | $0 |
| 25 to 44 Years | 226 (27.9%) | $66,875 |
| 45 to 64 Years | 405 (50.1%) | $79,194 |
| 65+ Years | 178 (22.0%) | $64,667 |
| Total | 809 (100.0%) | $73,870 |
Poverty in Wallkill
Income Below Poverty by Sex and Age in Wallkill
With 1.8% poverty level for males and 9.7% for females among the residents of Wallkill, 55 to 64 year old males and 45 to 54 year old females are the most vulnerable to poverty, with 11 males (4.6%) and 40 females (27.8%) in their respective age groups living below the poverty level.
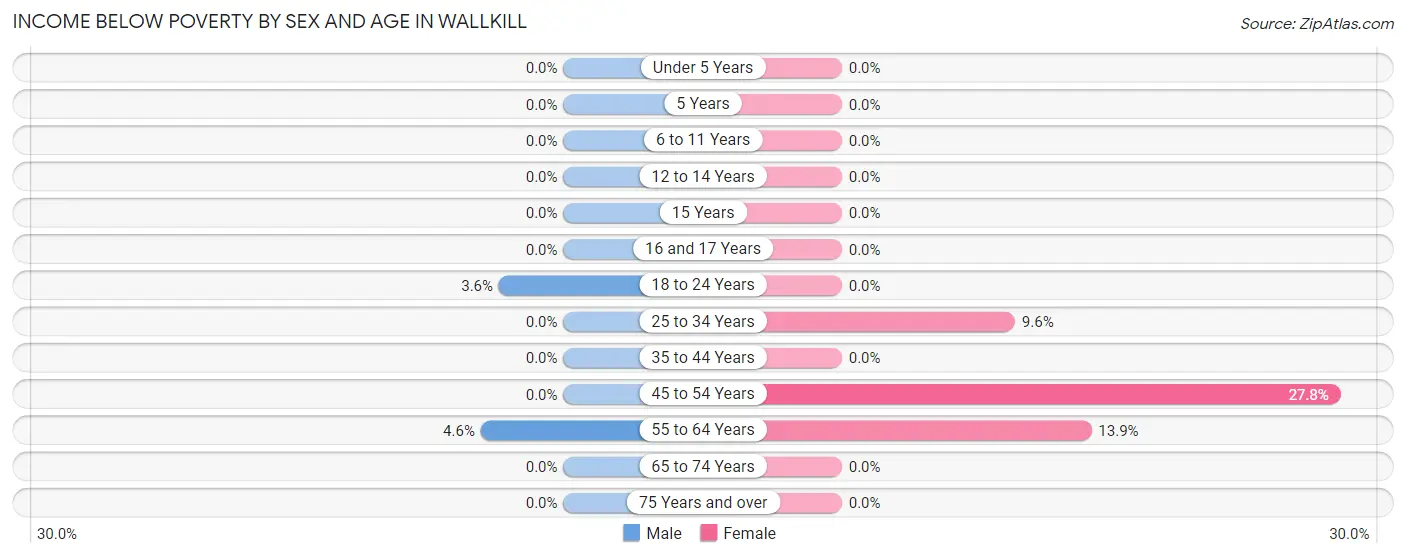
| Age Bracket | Male | Female |
| Under 5 Years | 0 (0.0%) | 0 (0.0%) |
| 5 Years | 0 (0.0%) | 0 (0.0%) |
| 6 to 11 Years | 0 (0.0%) | 0 (0.0%) |
| 12 to 14 Years | 0 (0.0%) | 0 (0.0%) |
| 15 Years | 0 (0.0%) | 0 (0.0%) |
| 16 and 17 Years | 0 (0.0%) | 0 (0.0%) |
| 18 to 24 Years | 6 (3.6%) | 0 (0.0%) |
| 25 to 34 Years | 0 (0.0%) | 19 (9.6%) |
| 35 to 44 Years | 0 (0.0%) | 0 (0.0%) |
| 45 to 54 Years | 0 (0.0%) | 40 (27.8%) |
| 55 to 64 Years | 11 (4.6%) | 31 (13.9%) |
| 65 to 74 Years | 0 (0.0%) | 0 (0.0%) |
| 75 Years and over | 0 (0.0%) | 0 (0.0%) |
| Total | 17 (1.8%) | 90 (9.7%) |
Income Above Poverty by Sex and Age in Wallkill
According to the poverty statistics in Wallkill, males aged under 5 years and females aged under 5 years are the age groups that are most secure financially, with 100.0% of males and 100.0% of females in these age groups living above the poverty line.
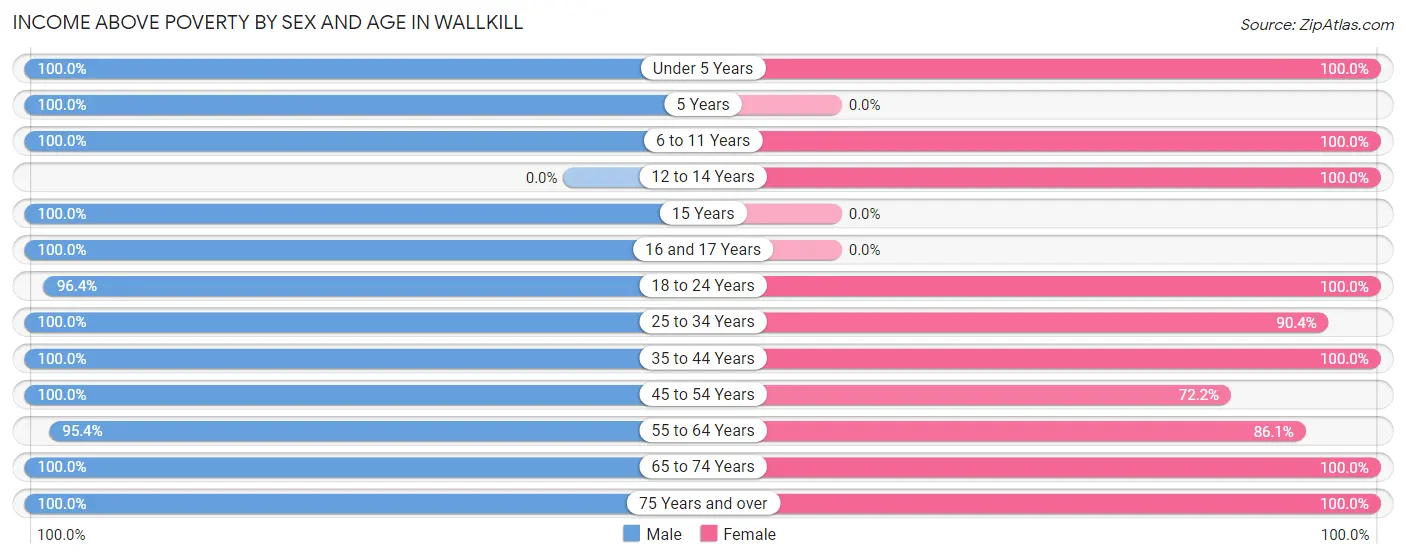
| Age Bracket | Male | Female |
| Under 5 Years | 16 (100.0%) | 6 (100.0%) |
| 5 Years | 18 (100.0%) | 0 (0.0%) |
| 6 to 11 Years | 39 (100.0%) | 89 (100.0%) |
| 12 to 14 Years | 0 (0.0%) | 63 (100.0%) |
| 15 Years | 14 (100.0%) | 0 (0.0%) |
| 16 and 17 Years | 8 (100.0%) | 0 (0.0%) |
| 18 to 24 Years | 161 (96.4%) | 2 (100.0%) |
| 25 to 34 Years | 153 (100.0%) | 178 (90.4%) |
| 35 to 44 Years | 42 (100.0%) | 55 (100.0%) |
| 45 to 54 Years | 81 (100.0%) | 104 (72.2%) |
| 55 to 64 Years | 228 (95.4%) | 192 (86.1%) |
| 65 to 74 Years | 102 (100.0%) | 113 (100.0%) |
| 75 Years and over | 52 (100.0%) | 36 (100.0%) |
| Total | 914 (98.2%) | 838 (90.3%) |
Income Below Poverty Among Married-Couple Families in Wallkill
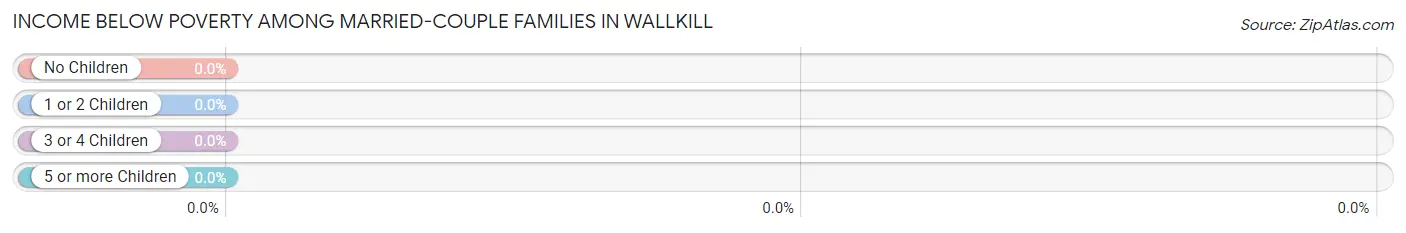
| Children | Above Poverty | Below Poverty |
| No Children | 357 (100.0%) | 0 (0.0%) |
| 1 or 2 Children | 77 (100.0%) | 0 (0.0%) |
| 3 or 4 Children | 0 (0.0%) | 0 (0.0%) |
| 5 or more Children | 0 (0.0%) | 0 (0.0%) |
| Total | 434 (100.0%) | 0 (0.0%) |
Income Below Poverty Among Single-Parent Households in Wallkill
| Children | Single Father | Single Mother |
| No Children | 0 (0.0%) | 0 (0.0%) |
| 1 or 2 Children | 0 (0.0%) | 0 (0.0%) |
| 3 or 4 Children | 0 (0.0%) | 0 (0.0%) |
| 5 or more Children | 0 (0.0%) | 0 (0.0%) |
| Total | 0 (0.0%) | 0 (0.0%) |
Income Below Poverty Among Married-Couple vs Single-Parent Households in Wallkill
| Children | Married-Couple Families | Single-Parent Households |
| No Children | 0 (0.0%) | 0 (0.0%) |
| 1 or 2 Children | 0 (0.0%) | 0 (0.0%) |
| 3 or 4 Children | 0 (0.0%) | 0 (0.0%) |
| 5 or more Children | 0 (0.0%) | 0 (0.0%) |
| Total | 0 (0.0%) | 0 (0.0%) |
Race in Wallkill
The most populous races in Wallkill are White / Caucasian (1,718 | 92.4%), Two or more Races (113 | 6.1%), and Hispanic or Latino (63 | 3.4%).
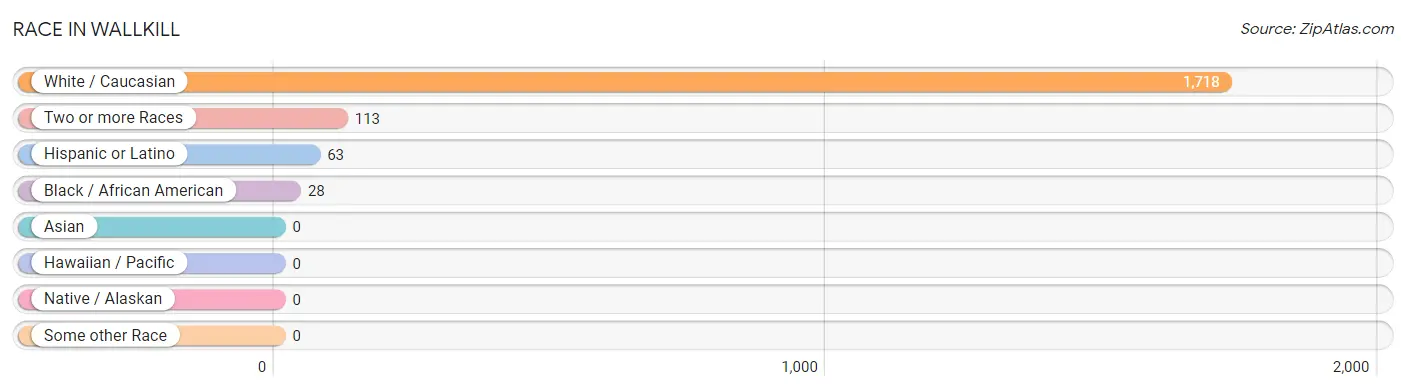
| Race | # Population | % Population |
| Asian | 0 | 0.0% |
| Black / African American | 28 | 1.5% |
| Hawaiian / Pacific | 0 | 0.0% |
| Hispanic or Latino | 63 | 3.4% |
| Native / Alaskan | 0 | 0.0% |
| White / Caucasian | 1,718 | 92.4% |
| Two or more Races | 113 | 6.1% |
| Some other Race | 0 | 0.0% |
| Total | 1,859 | 100.0% |
Ancestry in Wallkill
The most populous ancestries reported in Wallkill are German (452 | 24.3%), Irish (428 | 23.0%), Italian (388 | 20.9%), English (254 | 13.7%), and Polish (143 | 7.7%), together accounting for 89.5% of all Wallkill residents.
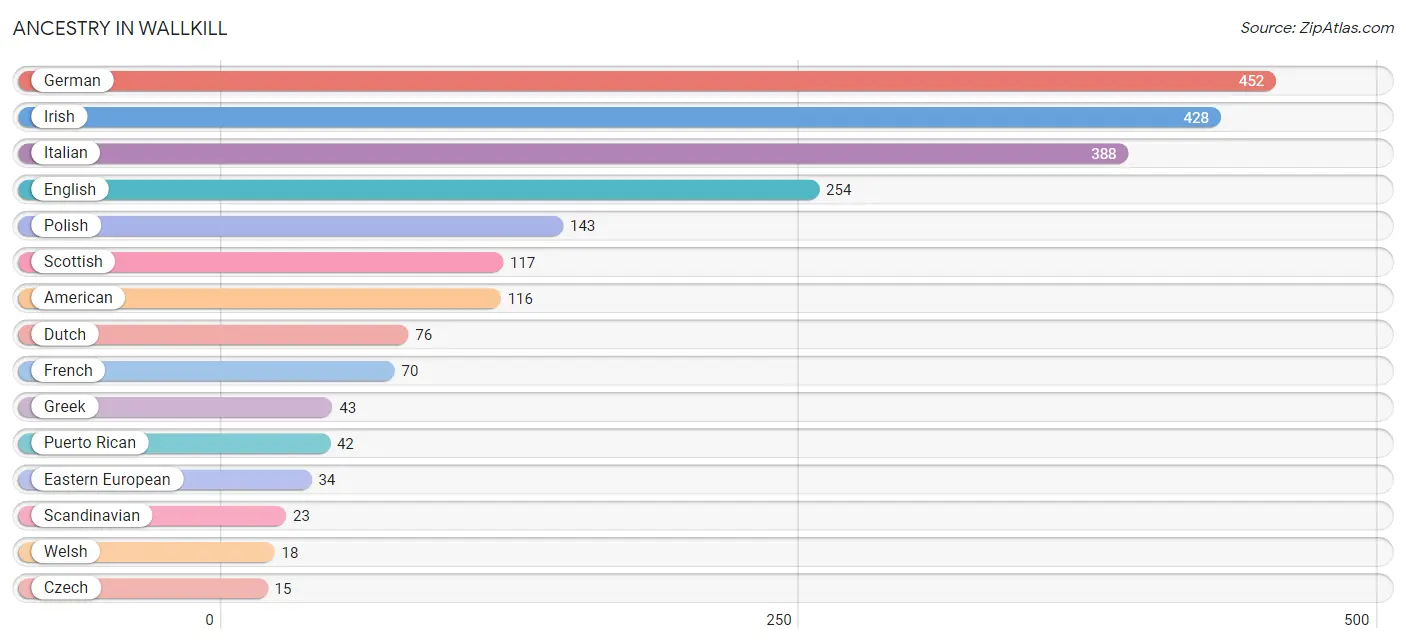
| Ancestry | # Population | % Population |
| American | 116 | 6.2% |
| Arab | 6 | 0.3% |
| Bhutanese | 8 | 0.4% |
| Czech | 15 | 0.8% |
| Dominican | 8 | 0.4% |
| Dutch | 76 | 4.1% |
| Eastern European | 34 | 1.8% |
| English | 254 | 13.7% |
| European | 13 | 0.7% |
| French | 70 | 3.8% |
| French Canadian | 10 | 0.5% |
| German | 452 | 24.3% |
| Greek | 43 | 2.3% |
| Irish | 428 | 23.0% |
| Italian | 388 | 20.9% |
| Norwegian | 7 | 0.4% |
| Polish | 143 | 7.7% |
| Puerto Rican | 42 | 2.3% |
| Russian | 13 | 0.7% |
| Scandinavian | 23 | 1.2% |
| Scottish | 117 | 6.3% |
| Slovak | 8 | 0.4% |
| Spanish | 13 | 0.7% |
| Welsh | 18 | 1.0% | View All 24 Rows |
Immigrants in Wallkill
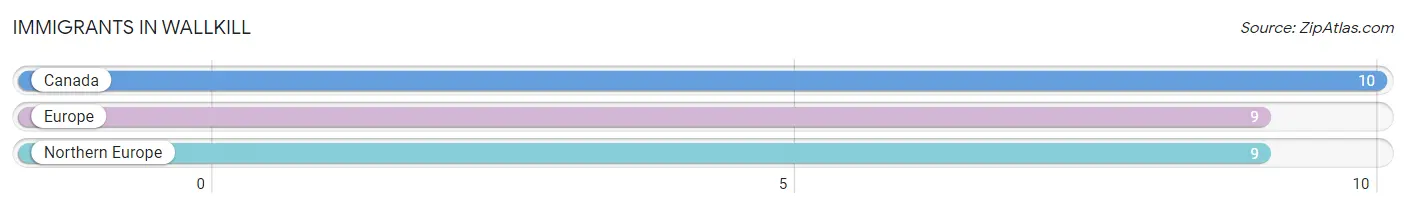
The most numerous immigrant groups reported in Wallkill came from Canada (10 | 0.5%), Europe (9 | 0.5%), and Northern Europe (9 | 0.5%), together accounting for 1.5% of all Wallkill residents.
| Immigration Origin | # Population | % Population |
| Canada | 10 | 0.5% |
| Europe | 9 | 0.5% |
| Northern Europe | 9 | 0.5% | View All 3 Rows |
Sex and Age in Wallkill
Sex and Age in Wallkill
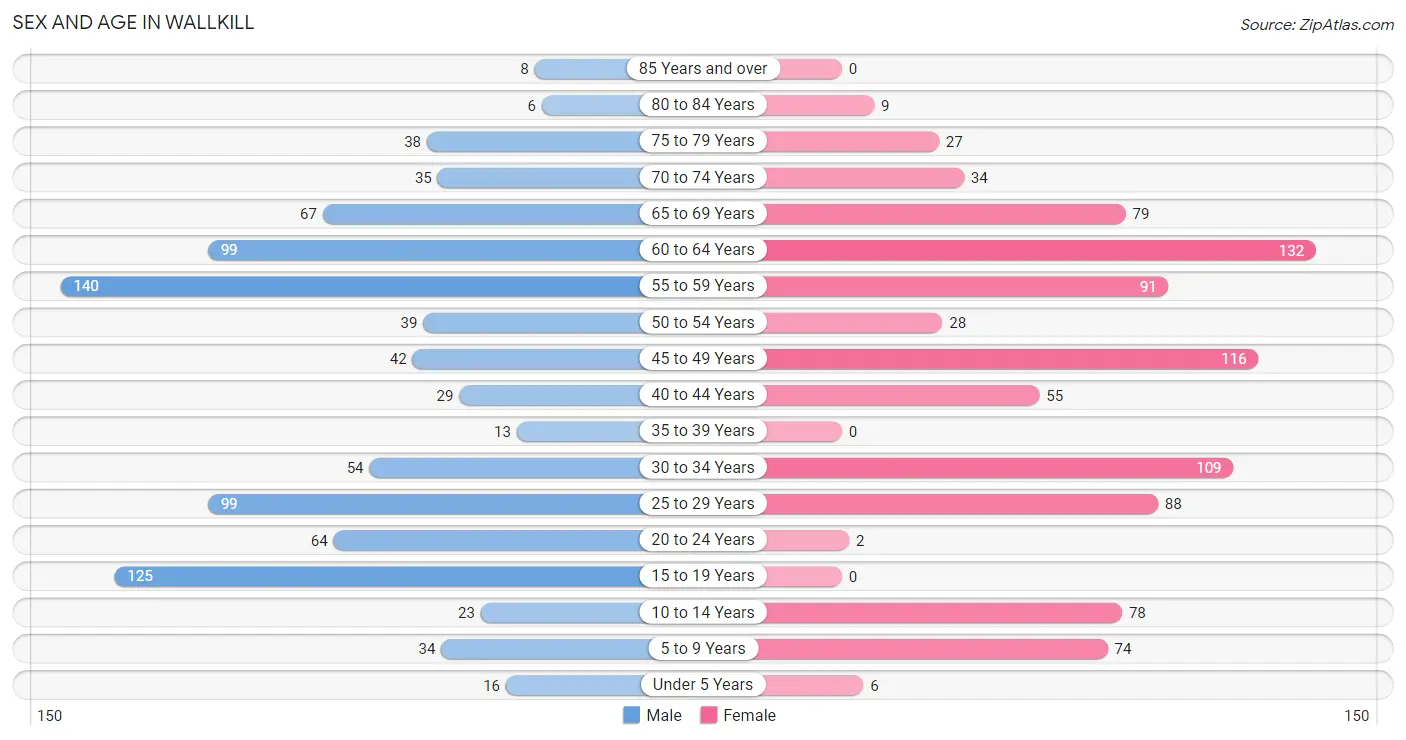
The most populous age groups in Wallkill are 55 to 59 Years (140 | 15.0%) for men and 60 to 64 Years (132 | 14.2%) for women.
| Age Bracket | Male | Female |
| Under 5 Years | 16 (1.7%) | 6 (0.6%) |
| 5 to 9 Years | 34 (3.6%) | 74 (8.0%) |
| 10 to 14 Years | 23 (2.5%) | 78 (8.4%) |
| 15 to 19 Years | 125 (13.4%) | 0 (0.0%) |
| 20 to 24 Years | 64 (6.9%) | 2 (0.2%) |
| 25 to 29 Years | 99 (10.6%) | 88 (9.5%) |
| 30 to 34 Years | 54 (5.8%) | 109 (11.7%) |
| 35 to 39 Years | 13 (1.4%) | 0 (0.0%) |
| 40 to 44 Years | 29 (3.1%) | 55 (5.9%) |
| 45 to 49 Years | 42 (4.5%) | 116 (12.5%) |
| 50 to 54 Years | 39 (4.2%) | 28 (3.0%) |
| 55 to 59 Years | 140 (15.0%) | 91 (9.8%) |
| 60 to 64 Years | 99 (10.6%) | 132 (14.2%) |
| 65 to 69 Years | 67 (7.2%) | 79 (8.5%) |
| 70 to 74 Years | 35 (3.8%) | 34 (3.7%) |
| 75 to 79 Years | 38 (4.1%) | 27 (2.9%) |
| 80 to 84 Years | 6 (0.6%) | 9 (1.0%) |
| 85 Years and over | 8 (0.9%) | 0 (0.0%) |
| Total | 931 (100.0%) | 928 (100.0%) |
Families and Households in Wallkill
Median Family Size in Wallkill
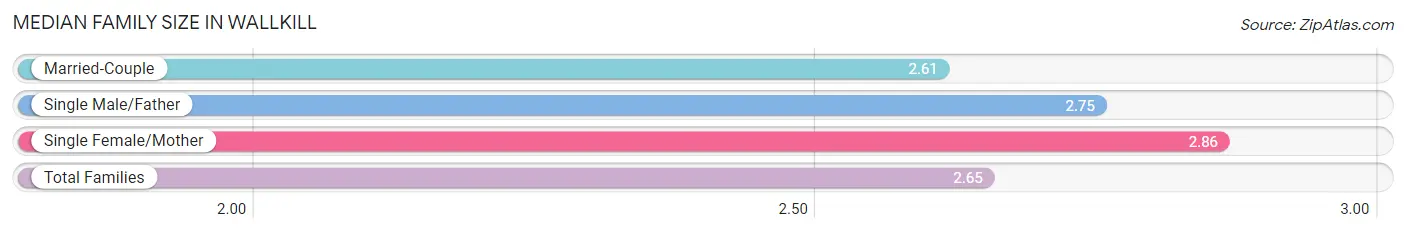
The median family size in Wallkill is 2.65 persons per family, with single female/mother families (59 | 10.4%) accounting for the largest median family size of 2.86 persons per family. On the other hand, married-couple families (434 | 76.7%) represent the smallest median family size with 2.61 persons per family.
| Family Type | # Families | Family Size |
| Married-Couple | 434 (76.7%) | 2.61 |
| Single Male/Father | 73 (12.9%) | 2.75 |
| Single Female/Mother | 59 (10.4%) | 2.86 |
| Total Families | 566 (100.0%) | 2.65 |
Median Household Size in Wallkill
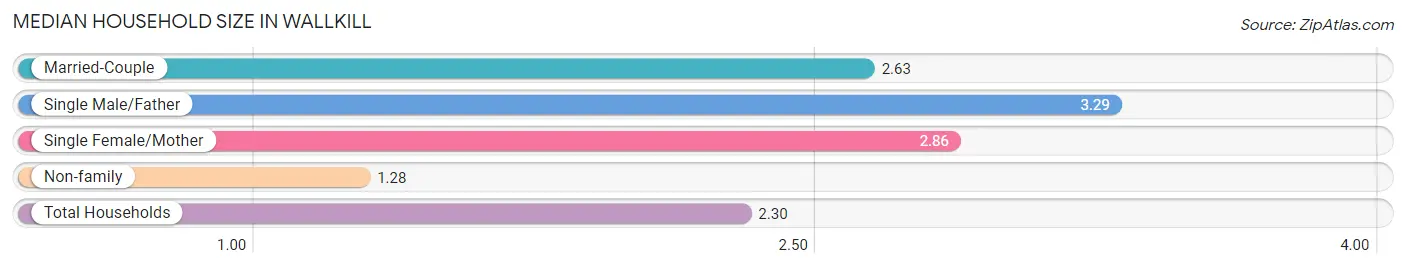
The median household size in Wallkill is 2.30 persons per household, with single male/father households (73 | 9.0%) accounting for the largest median household size of 3.29 persons per household. non-family households (243 | 30.0%) represent the smallest median household size with 1.28 persons per household.
| Household Type | # Households | Household Size |
| Married-Couple | 434 (53.6%) | 2.63 |
| Single Male/Father | 73 (9.0%) | 3.29 |
| Single Female/Mother | 59 (7.3%) | 2.86 |
| Non-family | 243 (30.0%) | 1.28 |
| Total Households | 809 (100.0%) | 2.30 |
Household Size by Marriage Status in Wallkill
Out of a total of 809 households in Wallkill, 566 (70.0%) are family households, while 243 (30.0%) are nonfamily households. The most numerous type of family households are 2-person households, comprising 270, and the most common type of nonfamily households are 1-person households, comprising 180.
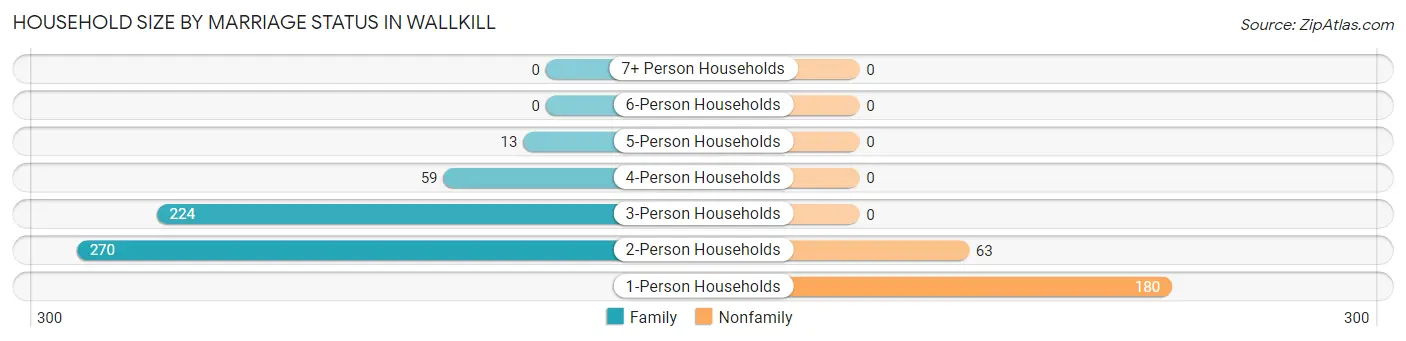
| Household Size | Family Households | Nonfamily Households |
| 1-Person Households | - | 180 (22.3%) |
| 2-Person Households | 270 (33.4%) | 63 (7.8%) |
| 3-Person Households | 224 (27.7%) | 0 (0.0%) |
| 4-Person Households | 59 (7.3%) | 0 (0.0%) |
| 5-Person Households | 13 (1.6%) | 0 (0.0%) |
| 6-Person Households | 0 (0.0%) | 0 (0.0%) |
| 7+ Person Households | 0 (0.0%) | 0 (0.0%) |
| Total | 566 (70.0%) | 243 (30.0%) |
Female Fertility in Wallkill
Fertility by Age in Wallkill
Average fertility rate in Wallkill is 78.0 births per 1,000 women. Women in the age bracket of 20 to 34 years have the highest fertility rate with 146.0 births per 1,000 women. Women in the age bracket of 20 to 34 years acount for 100.0% of all women with births.
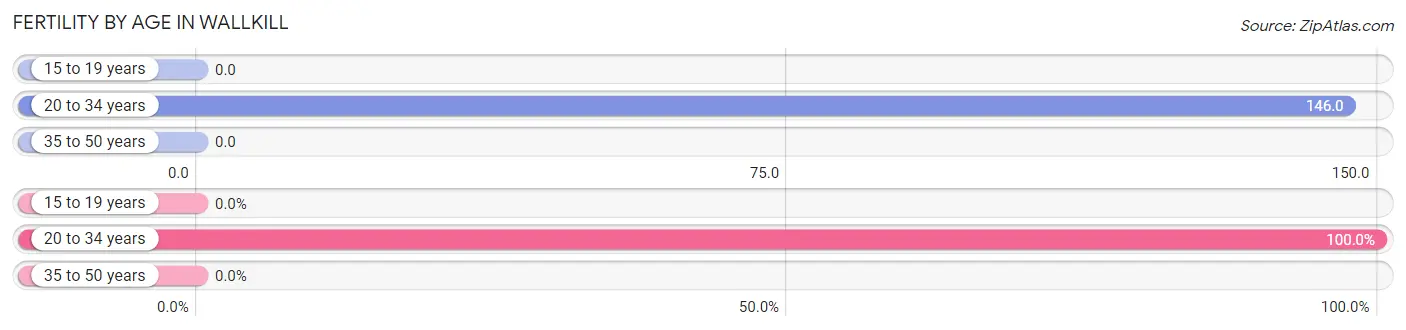
| Age Bracket | Women with Births | Births / 1,000 Women |
| 15 to 19 years | 0 (0.0%) | 0.0 |
| 20 to 34 years | 29 (100.0%) | 146.0 |
| 35 to 50 years | 0 (0.0%) | 0.0 |
| Total | 29 (100.0%) | 78.0 |
Fertility by Age by Marriage Status in Wallkill
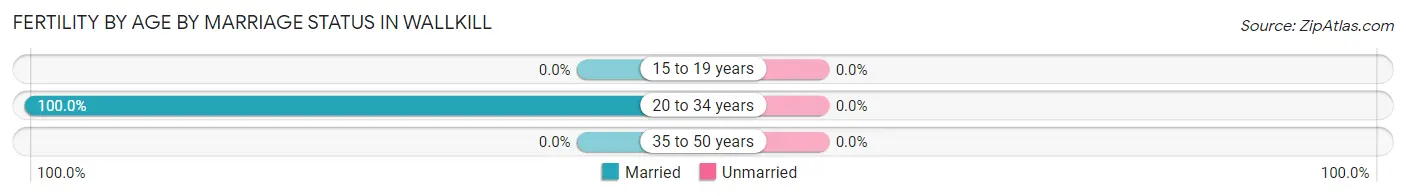
| Age Bracket | Married | Unmarried |
| 15 to 19 years | 0 (0.0%) | 0 (0.0%) |
| 20 to 34 years | 29 (100.0%) | 0 (0.0%) |
| 35 to 50 years | 0 (0.0%) | 0 (0.0%) |
| Total | 29 (100.0%) | 0 (0.0%) |
Fertility by Education in Wallkill
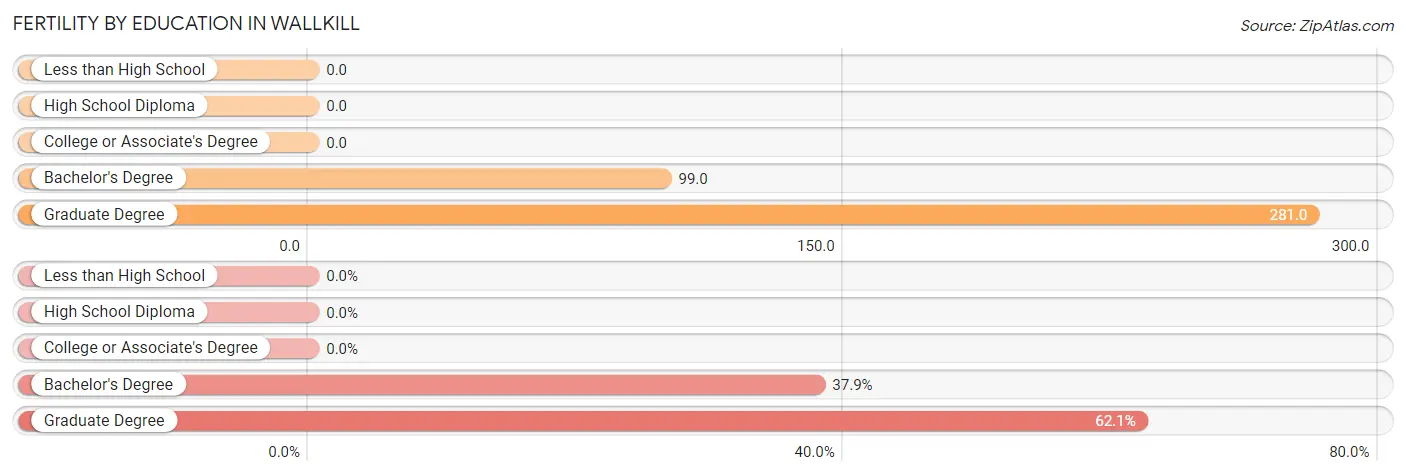
| Educational Attainment | Women with Births | Births / 1,000 Women |
| Less than High School | 0 (0.0%) | 0.0 |
| High School Diploma | 0 (0.0%) | 0.0 |
| College or Associate's Degree | 0 (0.0%) | 0.0 |
| Bachelor's Degree | 11 (37.9%) | 99.0 |
| Graduate Degree | 18 (62.1%) | 281.0 |
| Total | 29 (100.0%) | 78.0 |
Fertility by Education by Marriage Status in Wallkill
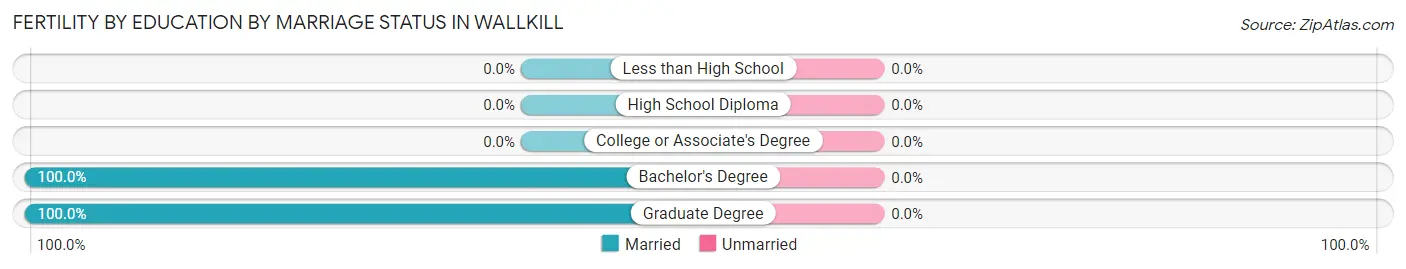
| Educational Attainment | Married | Unmarried |
| Less than High School | 0 (0.0%) | 0 (0.0%) |
| High School Diploma | 0 (0.0%) | 0 (0.0%) |
| College or Associate's Degree | 0 (0.0%) | 0 (0.0%) |
| Bachelor's Degree | 11 (100.0%) | 0 (0.0%) |
| Graduate Degree | 18 (100.0%) | 0 (0.0%) |
| Total | 29 (100.0%) | 0 (0.0%) |
Employment Characteristics in Wallkill
Employment by Class of Employer in Wallkill
Among the 899 employed individuals in Wallkill, private company employees (509 | 56.6%), local government employees (127 | 14.1%), and state government employees (125 | 13.9%) make up the most common classes of employment.
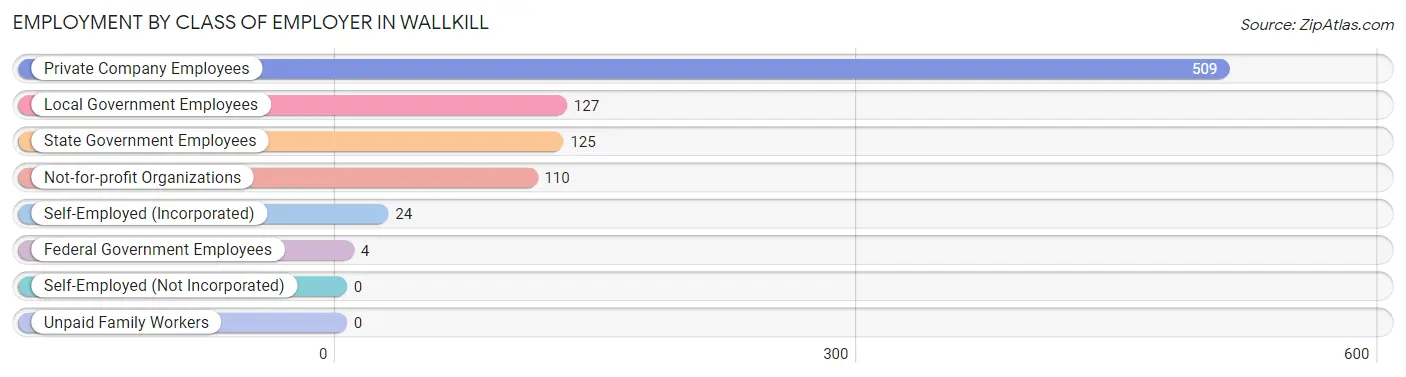
| Employer Class | # Employees | % Employees |
| Private Company Employees | 509 | 56.6% |
| Self-Employed (Incorporated) | 24 | 2.7% |
| Self-Employed (Not Incorporated) | 0 | 0.0% |
| Not-for-profit Organizations | 110 | 12.2% |
| Local Government Employees | 127 | 14.1% |
| State Government Employees | 125 | 13.9% |
| Federal Government Employees | 4 | 0.4% |
| Unpaid Family Workers | 0 | 0.0% |
| Total | 899 | 100.0% |
Employment Status by Age in Wallkill
According to the labor force statistics for Wallkill, out of the total population over 16 years of age (1,614), 58.1% or 938 individuals are in the labor force, with 4.2% or 39 of them unemployed. The age group with the highest labor force participation rate is 30 to 34 years, with 100.0% or 163 individuals in the labor force. Within the labor force, the 20 to 24 years age range has the highest percentage of unemployed individuals, with 63.6% or 28 of them being unemployed.
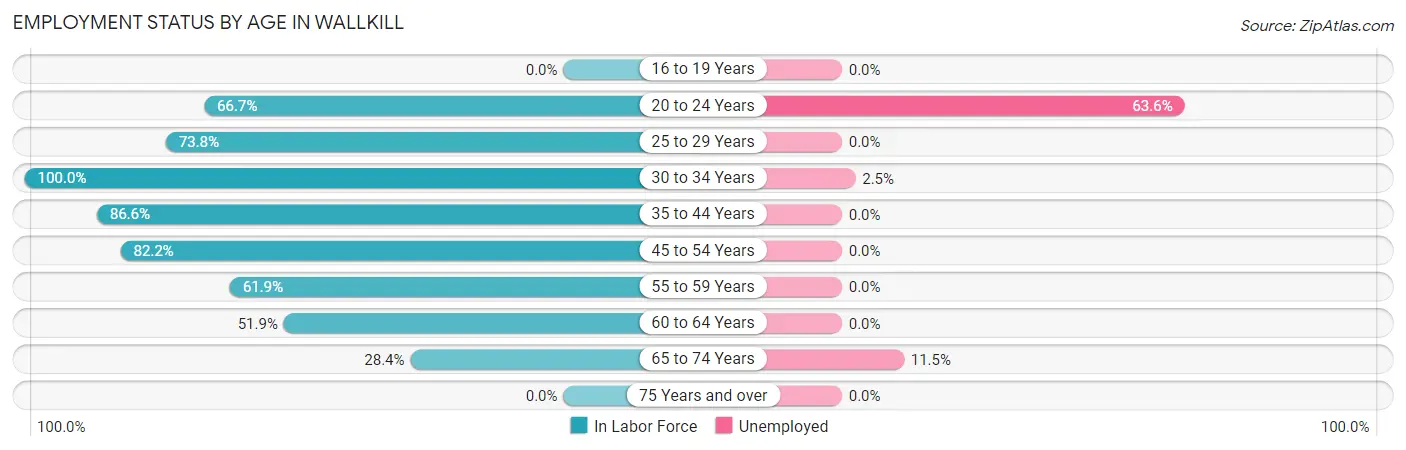
| Age Bracket | In Labor Force | Unemployed |
| 16 to 19 Years | 0 (0.0%) | 0 (0.0%) |
| 20 to 24 Years | 44 (66.7%) | 28 (63.6%) |
| 25 to 29 Years | 138 (73.8%) | 0 (0.0%) |
| 30 to 34 Years | 163 (100.0%) | 4 (2.5%) |
| 35 to 44 Years | 84 (86.6%) | 0 (0.0%) |
| 45 to 54 Years | 185 (82.2%) | 0 (0.0%) |
| 55 to 59 Years | 143 (61.9%) | 0 (0.0%) |
| 60 to 64 Years | 120 (51.9%) | 0 (0.0%) |
| 65 to 74 Years | 61 (28.4%) | 7 (11.5%) |
| 75 Years and over | 0 (0.0%) | 0 (0.0%) |
| Total | 938 (58.1%) | 39 (4.2%) |
Employment Status by Educational Attainment in Wallkill
According to labor force statistics for Wallkill, 73.5% of individuals (833) out of the total population between 25 and 64 years of age (1,134) are in the labor force, with 0.5% or 4 of them being unemployed. The group with the highest labor force participation rate are those with the educational attainment of high school diploma, with 86.2% or 250 individuals in the labor force. Within the labor force, individuals with high school diploma education have the highest percentage of unemployment, with 1.6% or 4 of them being unemployed.
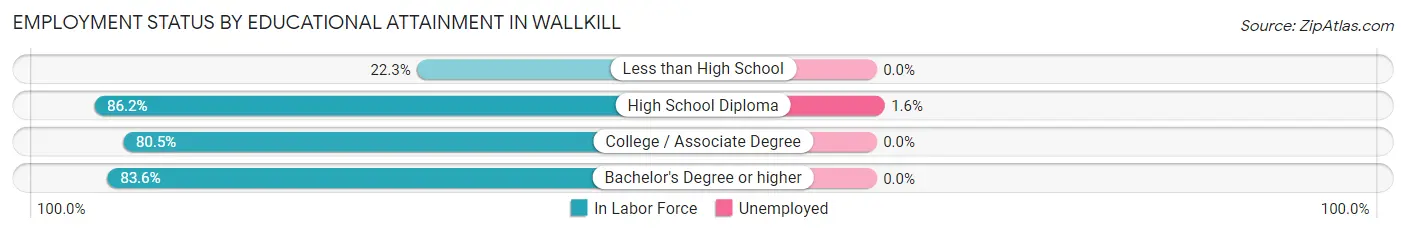
| Educational Attainment | In Labor Force | Unemployed |
| Less than High School | 41 (22.3%) | 0 (0.0%) |
| High School Diploma | 250 (86.2%) | 5 (1.6%) |
| College / Associate Degree | 247 (80.5%) | 0 (0.0%) |
| Bachelor's Degree or higher | 295 (83.6%) | 0 (0.0%) |
| Total | 833 (73.5%) | 6 (0.5%) |
Employment Occupations by Sex in Wallkill
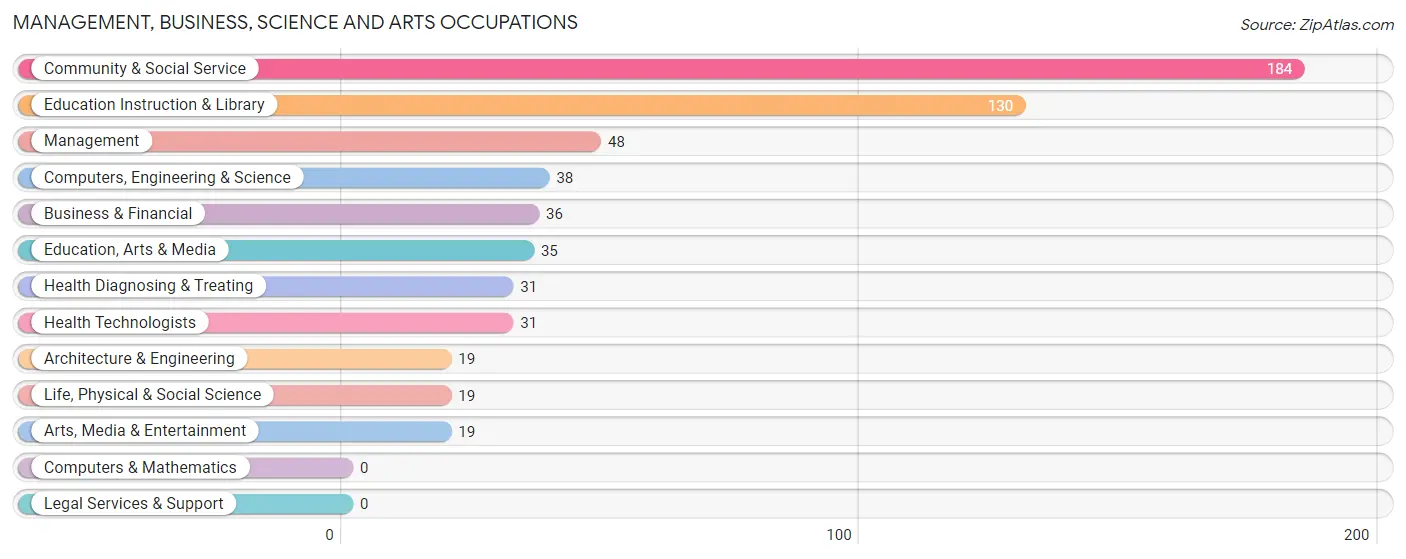
Management, Business, Science and Arts Occupations
The most common Management, Business, Science and Arts occupations in Wallkill are Community & Social Service (184 | 20.5%), Education Instruction & Library (130 | 14.5%), Management (48 | 5.3%), Computers, Engineering & Science (38 | 4.2%), and Business & Financial (36 | 4.0%).
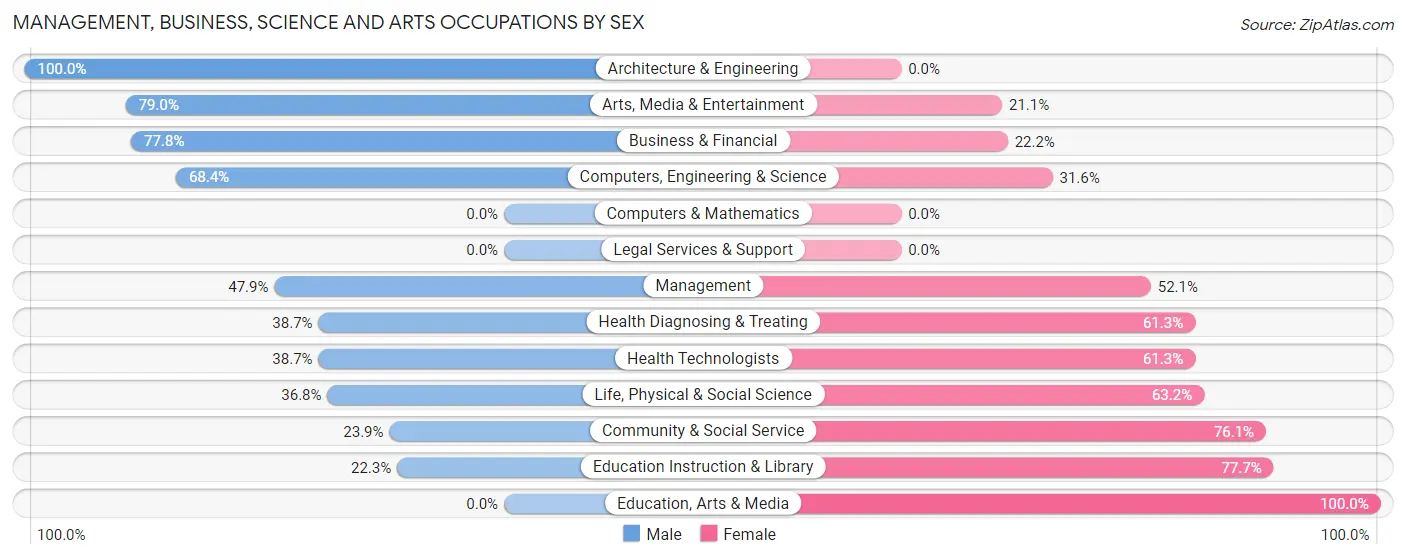
Management, Business, Science and Arts Occupations by Sex
Within the Management, Business, Science and Arts occupations in Wallkill, the most male-oriented occupations are Architecture & Engineering (100.0%), Arts, Media & Entertainment (78.9%), and Business & Financial (77.8%), while the most female-oriented occupations are Education, Arts & Media (100.0%), Education Instruction & Library (77.7%), and Community & Social Service (76.1%).
| Occupation | Male | Female |
| Management | 23 (47.9%) | 25 (52.1%) |
| Business & Financial | 28 (77.8%) | 8 (22.2%) |
| Computers, Engineering & Science | 26 (68.4%) | 12 (31.6%) |
| Computers & Mathematics | 0 (0.0%) | 0 (0.0%) |
| Architecture & Engineering | 19 (100.0%) | 0 (0.0%) |
| Life, Physical & Social Science | 7 (36.8%) | 12 (63.2%) |
| Community & Social Service | 44 (23.9%) | 140 (76.1%) |
| Education, Arts & Media | 0 (0.0%) | 35 (100.0%) |
| Legal Services & Support | 0 (0.0%) | 0 (0.0%) |
| Education Instruction & Library | 29 (22.3%) | 101 (77.7%) |
| Arts, Media & Entertainment | 15 (78.9%) | 4 (21.0%) |
| Health Diagnosing & Treating | 12 (38.7%) | 19 (61.3%) |
| Health Technologists | 12 (38.7%) | 19 (61.3%) |
| Total (Category) | 133 (39.5%) | 204 (60.5%) |
| Total (Overall) | 449 (49.9%) | 450 (50.1%) |
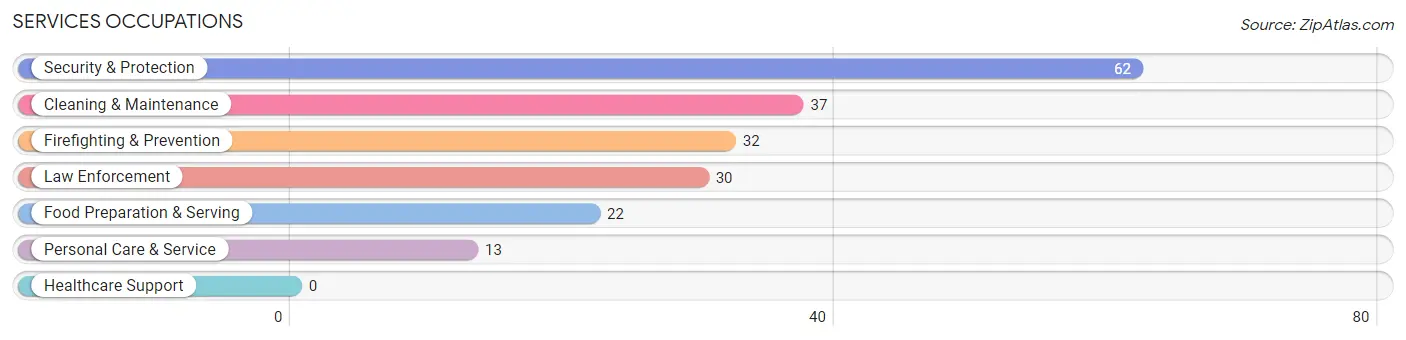
Services Occupations
The most common Services occupations in Wallkill are Security & Protection (62 | 6.9%), Cleaning & Maintenance (37 | 4.1%), Firefighting & Prevention (32 | 3.6%), Law Enforcement (30 | 3.3%), and Food Preparation & Serving (22 | 2.5%).
Services Occupations by Sex
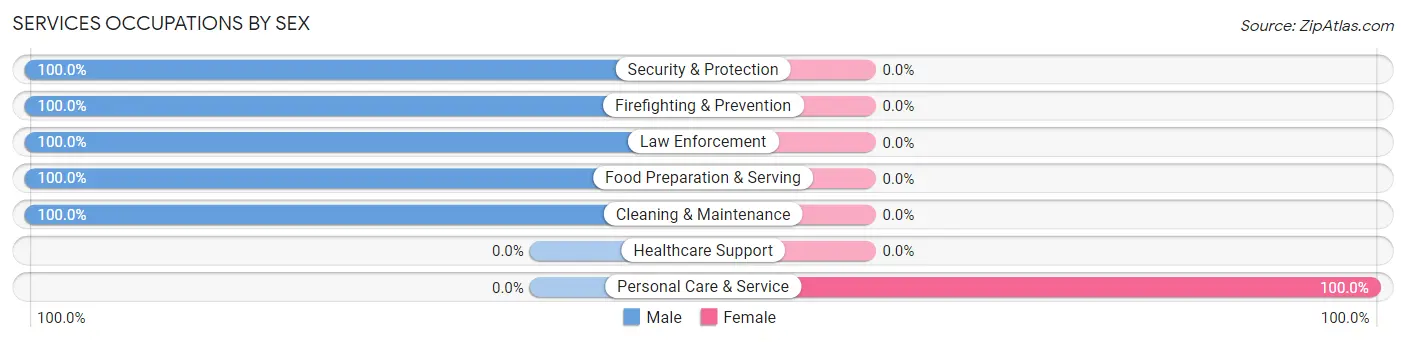
| Occupation | Male | Female |
| Healthcare Support | 0 (0.0%) | 0 (0.0%) |
| Security & Protection | 62 (100.0%) | 0 (0.0%) |
| Firefighting & Prevention | 32 (100.0%) | 0 (0.0%) |
| Law Enforcement | 30 (100.0%) | 0 (0.0%) |
| Food Preparation & Serving | 22 (100.0%) | 0 (0.0%) |
| Cleaning & Maintenance | 37 (100.0%) | 0 (0.0%) |
| Personal Care & Service | 0 (0.0%) | 13 (100.0%) |
| Total (Category) | 121 (90.3%) | 13 (9.7%) |
| Total (Overall) | 449 (49.9%) | 450 (50.1%) |
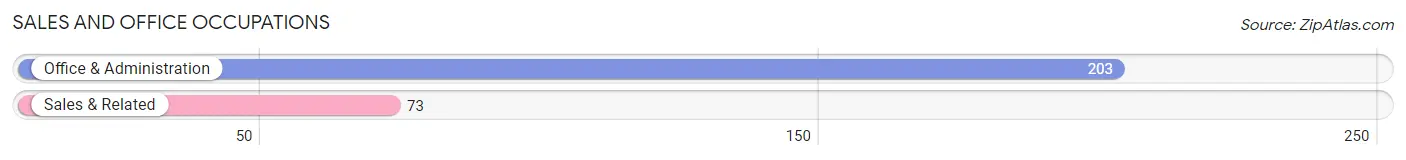
Sales and Office Occupations
The most common Sales and Office occupations in Wallkill are Office & Administration (203 | 22.6%), and Sales & Related (73 | 8.1%).
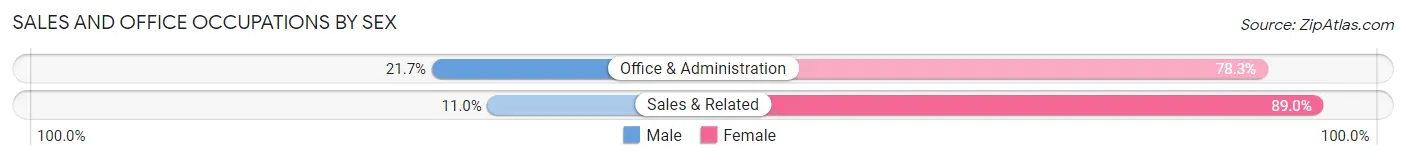
Sales and Office Occupations by Sex
| Occupation | Male | Female |
| Sales & Related | 8 (11.0%) | 65 (89.0%) |
| Office & Administration | 44 (21.7%) | 159 (78.3%) |
| Total (Category) | 52 (18.8%) | 224 (81.2%) |
| Total (Overall) | 449 (49.9%) | 450 (50.1%) |
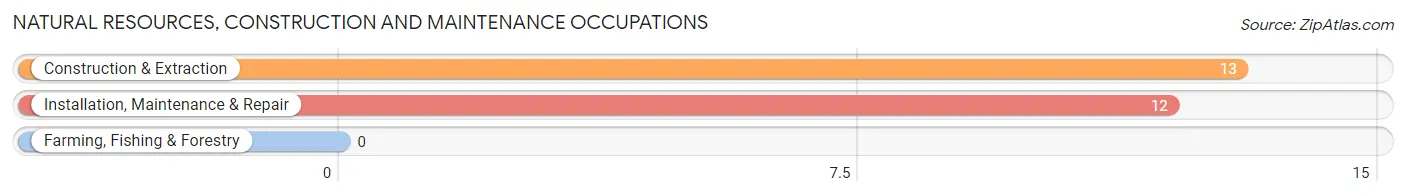
Natural Resources, Construction and Maintenance Occupations
The most common Natural Resources, Construction and Maintenance occupations in Wallkill are Construction & Extraction (13 | 1.5%), and Installation, Maintenance & Repair (12 | 1.3%).
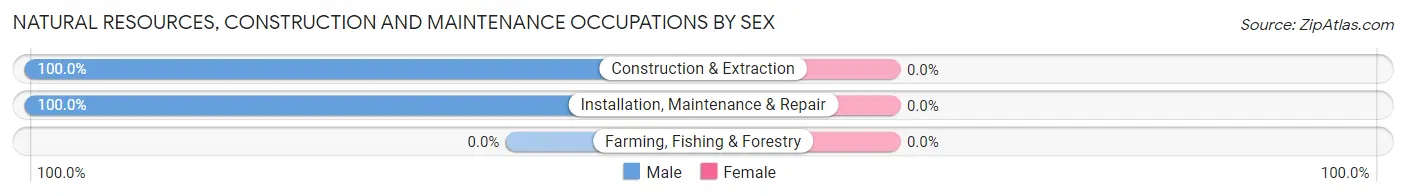
Natural Resources, Construction and Maintenance Occupations by Sex
| Occupation | Male | Female |
| Farming, Fishing & Forestry | 0 (0.0%) | 0 (0.0%) |
| Construction & Extraction | 13 (100.0%) | 0 (0.0%) |
| Installation, Maintenance & Repair | 12 (100.0%) | 0 (0.0%) |
| Total (Category) | 25 (100.0%) | 0 (0.0%) |
| Total (Overall) | 449 (49.9%) | 450 (50.1%) |
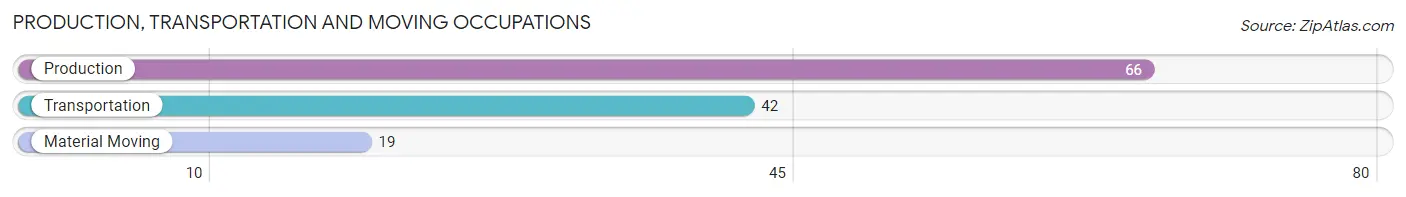
Production, Transportation and Moving Occupations
The most common Production, Transportation and Moving occupations in Wallkill are Production (66 | 7.3%), Transportation (42 | 4.7%), and Material Moving (19 | 2.1%).
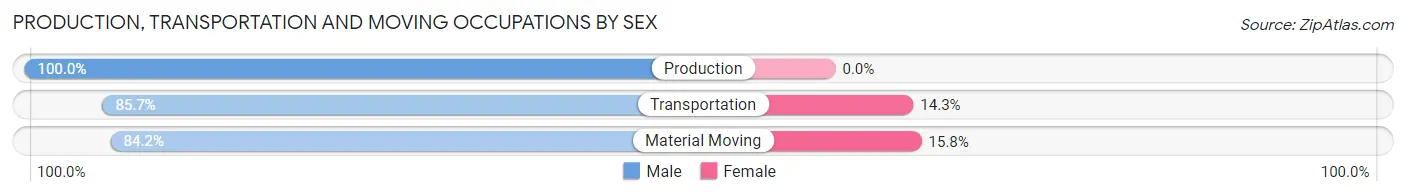
Production, Transportation and Moving Occupations by Sex
| Occupation | Male | Female |
| Production | 66 (100.0%) | 0 (0.0%) |
| Transportation | 36 (85.7%) | 6 (14.3%) |
| Material Moving | 16 (84.2%) | 3 (15.8%) |
| Total (Category) | 118 (92.9%) | 9 (7.1%) |
| Total (Overall) | 449 (49.9%) | 450 (50.1%) |
Employment Industries by Sex in Wallkill
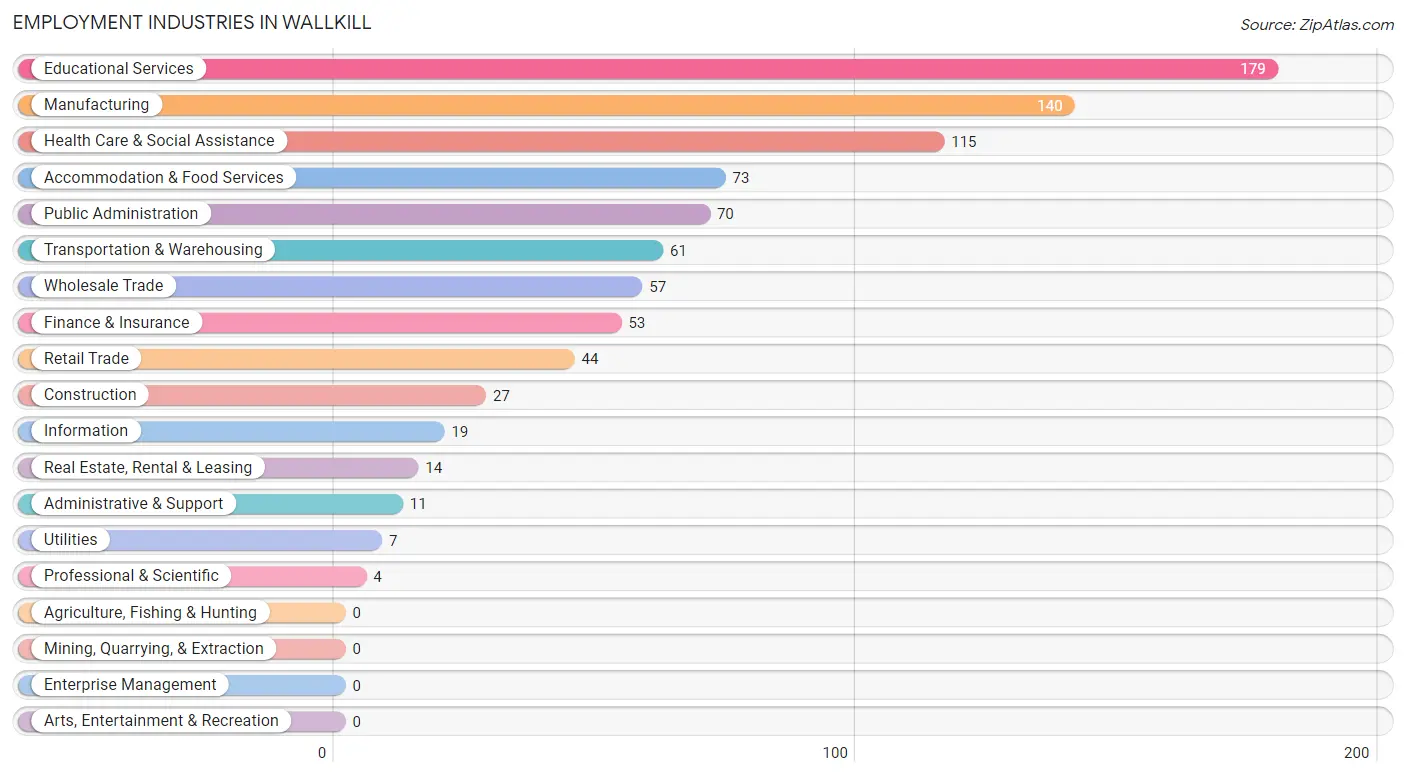
Employment Industries in Wallkill
The major employment industries in Wallkill include Educational Services (179 | 19.9%), Manufacturing (140 | 15.6%), Health Care & Social Assistance (115 | 12.8%), Accommodation & Food Services (73 | 8.1%), and Public Administration (70 | 7.8%).
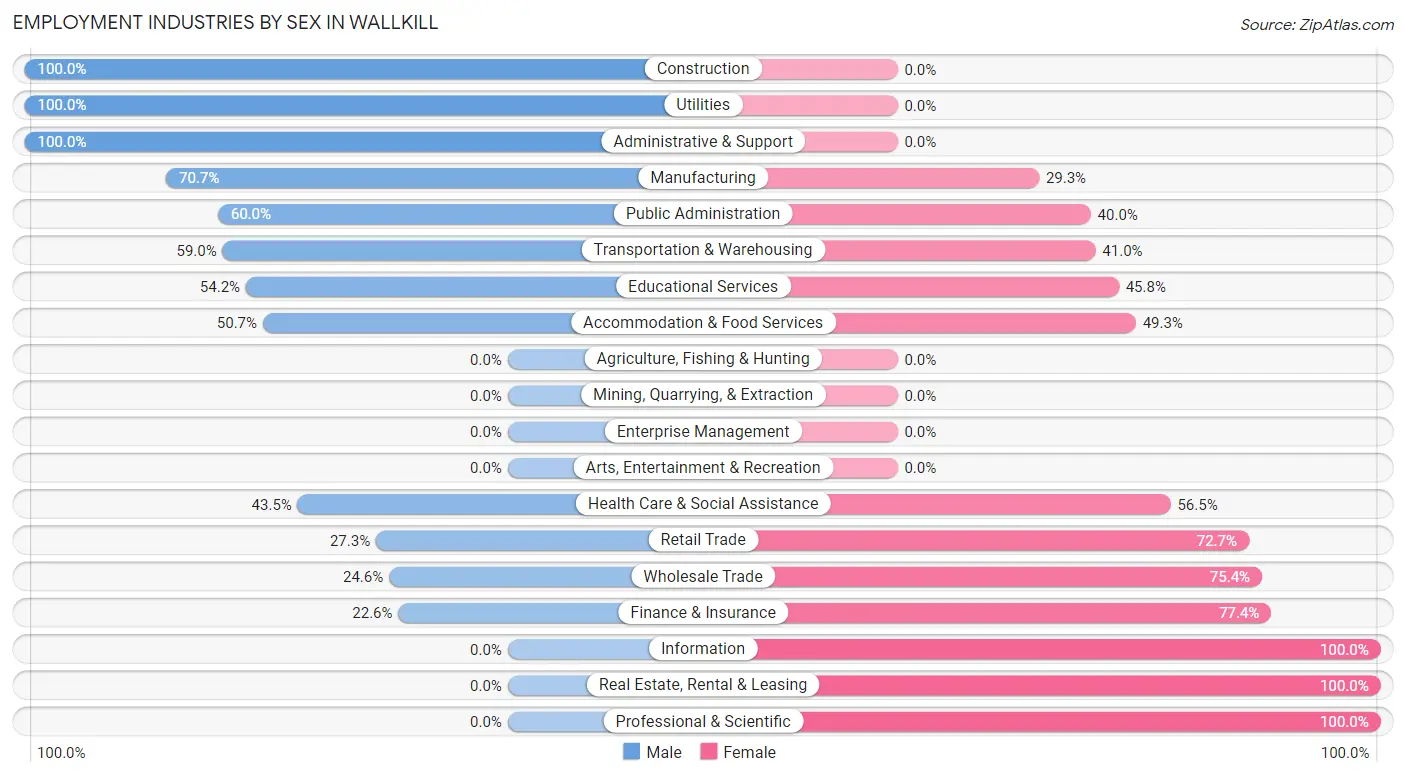
Employment Industries by Sex in Wallkill
The Wallkill industries that see more men than women are Construction (100.0%), Utilities (100.0%), and Administrative & Support (100.0%), whereas the industries that tend to have a higher number of women are Information (100.0%), Real Estate, Rental & Leasing (100.0%), and Professional & Scientific (100.0%).
| Industry | Male | Female |
| Agriculture, Fishing & Hunting | 0 (0.0%) | 0 (0.0%) |
| Mining, Quarrying, & Extraction | 0 (0.0%) | 0 (0.0%) |
| Construction | 27 (100.0%) | 0 (0.0%) |
| Manufacturing | 99 (70.7%) | 41 (29.3%) |
| Wholesale Trade | 14 (24.6%) | 43 (75.4%) |
| Retail Trade | 12 (27.3%) | 32 (72.7%) |
| Transportation & Warehousing | 36 (59.0%) | 25 (41.0%) |
| Utilities | 7 (100.0%) | 0 (0.0%) |
| Information | 0 (0.0%) | 19 (100.0%) |
| Finance & Insurance | 12 (22.6%) | 41 (77.4%) |
| Real Estate, Rental & Leasing | 0 (0.0%) | 14 (100.0%) |
| Professional & Scientific | 0 (0.0%) | 4 (100.0%) |
| Enterprise Management | 0 (0.0%) | 0 (0.0%) |
| Administrative & Support | 11 (100.0%) | 0 (0.0%) |
| Educational Services | 97 (54.2%) | 82 (45.8%) |
| Health Care & Social Assistance | 50 (43.5%) | 65 (56.5%) |
| Arts, Entertainment & Recreation | 0 (0.0%) | 0 (0.0%) |
| Accommodation & Food Services | 37 (50.7%) | 36 (49.3%) |
| Public Administration | 42 (60.0%) | 28 (40.0%) |
| Total | 449 (49.9%) | 450 (50.1%) |
Education in Wallkill
School Enrollment in Wallkill
The most common levels of schooling among the 363 students in Wallkill are middle school (101 | 27.8%), elementary school (90 | 24.8%), and high school (81 | 22.3%).
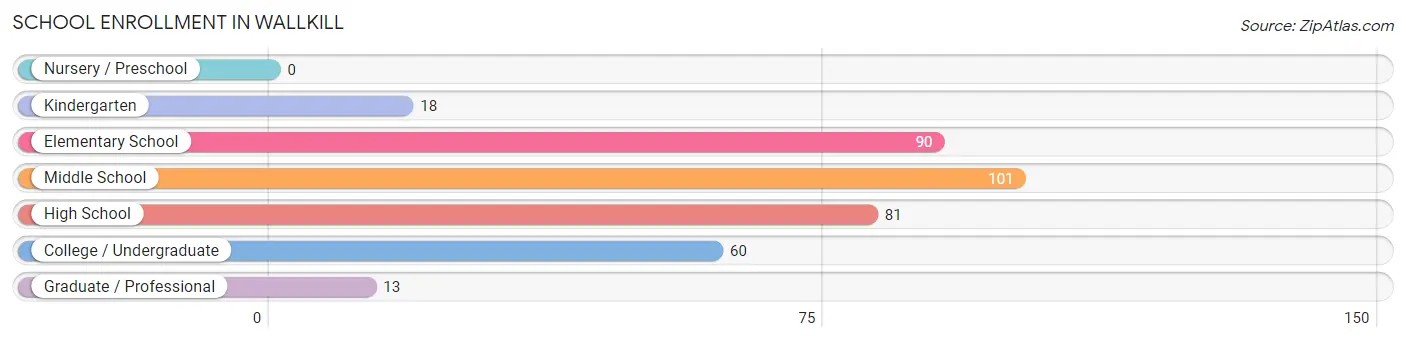
| School Level | # Students | % Students |
| Nursery / Preschool | 0 | 0.0% |
| Kindergarten | 18 | 5.0% |
| Elementary School | 90 | 24.8% |
| Middle School | 101 | 27.8% |
| High School | 81 | 22.3% |
| College / Undergraduate | 60 | 16.5% |
| Graduate / Professional | 13 | 3.6% |
| Total | 363 | 100.0% |
School Enrollment by Age by Funding Source in Wallkill
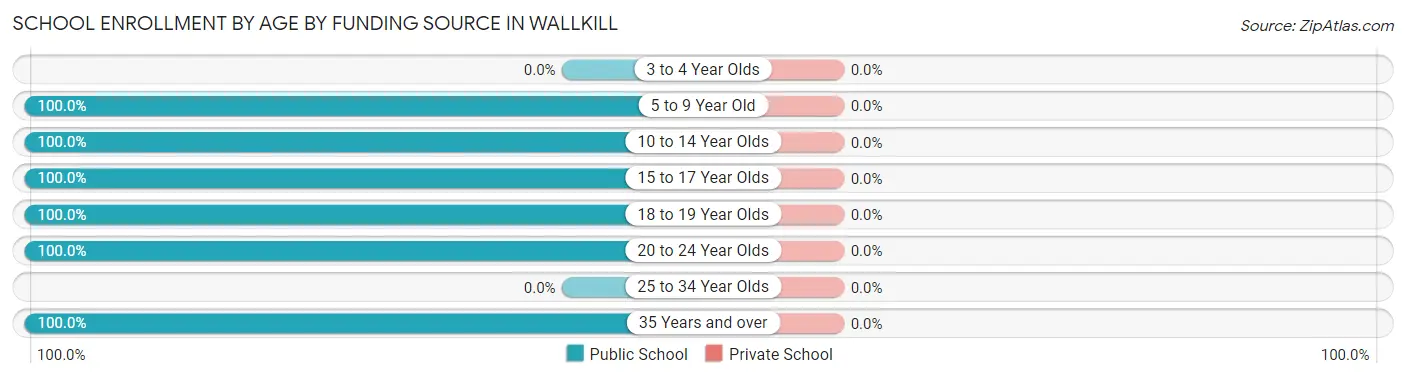
| Age Bracket | Public School | Private School |
| 3 to 4 Year Olds | 0 (0.0%) | 0 (0.0%) |
| 5 to 9 Year Old | 108 (100.0%) | 0 (0.0%) |
| 10 to 14 Year Olds | 101 (100.0%) | 0 (0.0%) |
| 15 to 17 Year Olds | 22 (100.0%) | 0 (0.0%) |
| 18 to 19 Year Olds | 103 (100.0%) | 0 (0.0%) |
| 20 to 24 Year Olds | 18 (100.0%) | 0 (0.0%) |
| 25 to 34 Year Olds | 0 (0.0%) | 0 (0.0%) |
| 35 Years and over | 11 (100.0%) | 0 (0.0%) |
| Total | 363 (100.0%) | 0 (0.0%) |
Educational Attainment by Field of Study in Wallkill
Business (123 | 26.9%), education (67 | 14.6%), science & technology (64 | 14.0%), arts & humanities (55 | 12.0%), and literature & languages (53 | 11.6%) are the most common fields of study among 458 individuals in Wallkill who have obtained a bachelor's degree or higher.
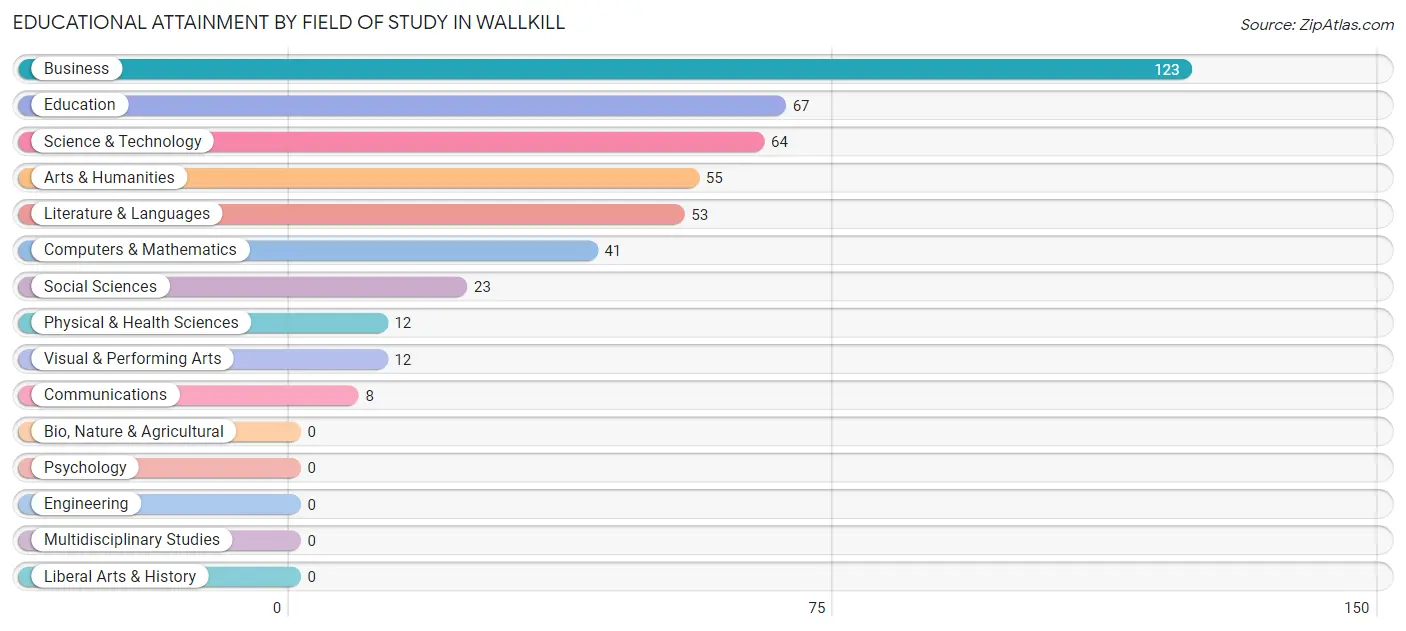
| Field of Study | # Graduates | % Graduates |
| Computers & Mathematics | 41 | 8.9% |
| Bio, Nature & Agricultural | 0 | 0.0% |
| Physical & Health Sciences | 12 | 2.6% |
| Psychology | 0 | 0.0% |
| Social Sciences | 23 | 5.0% |
| Engineering | 0 | 0.0% |
| Multidisciplinary Studies | 0 | 0.0% |
| Science & Technology | 64 | 14.0% |
| Business | 123 | 26.9% |
| Education | 67 | 14.6% |
| Literature & Languages | 53 | 11.6% |
| Liberal Arts & History | 0 | 0.0% |
| Visual & Performing Arts | 12 | 2.6% |
| Communications | 8 | 1.8% |
| Arts & Humanities | 55 | 12.0% |
| Total | 458 | 100.0% |
Transportation & Commute in Wallkill
Vehicle Availability by Sex in Wallkill
The most prevalent vehicle ownership categories in Wallkill are males with 2 vehicles (276, accounting for 61.5%) and females with 2 vehicles (227, making up 61.3%).
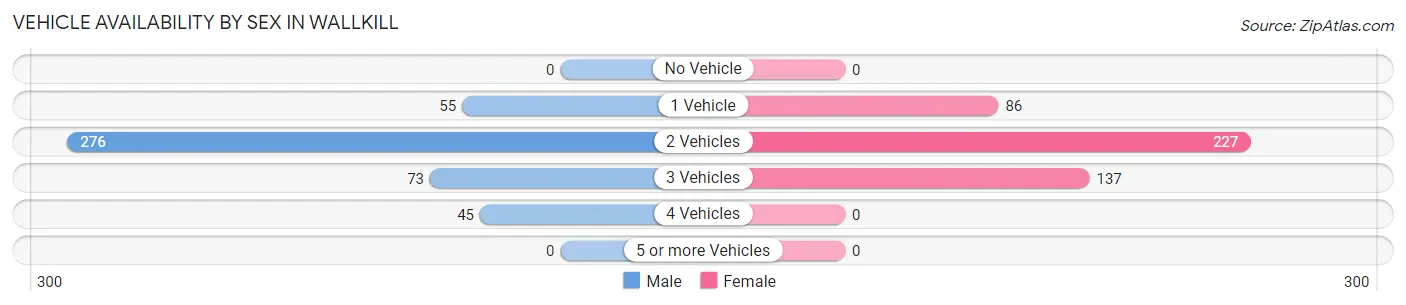
| Vehicles Available | Male | Female |
| No Vehicle | 0 (0.0%) | 0 (0.0%) |
| 1 Vehicle | 55 (12.2%) | 86 (19.1%) |
| 2 Vehicles | 276 (61.5%) | 227 (50.4%) |
| 3 Vehicles | 73 (16.3%) | 137 (30.4%) |
| 4 Vehicles | 45 (10.0%) | 0 (0.0%) |
| 5 or more Vehicles | 0 (0.0%) | 0 (0.0%) |
| Total | 449 (100.0%) | 450 (100.0%) |
Commute Time in Wallkill
The most frequently occuring commute durations in Wallkill are 15 to 19 minutes (138 commuters, 16.2%), 20 to 24 minutes (128 commuters, 15.1%), and 35 to 39 minutes (127 commuters, 14.9%).
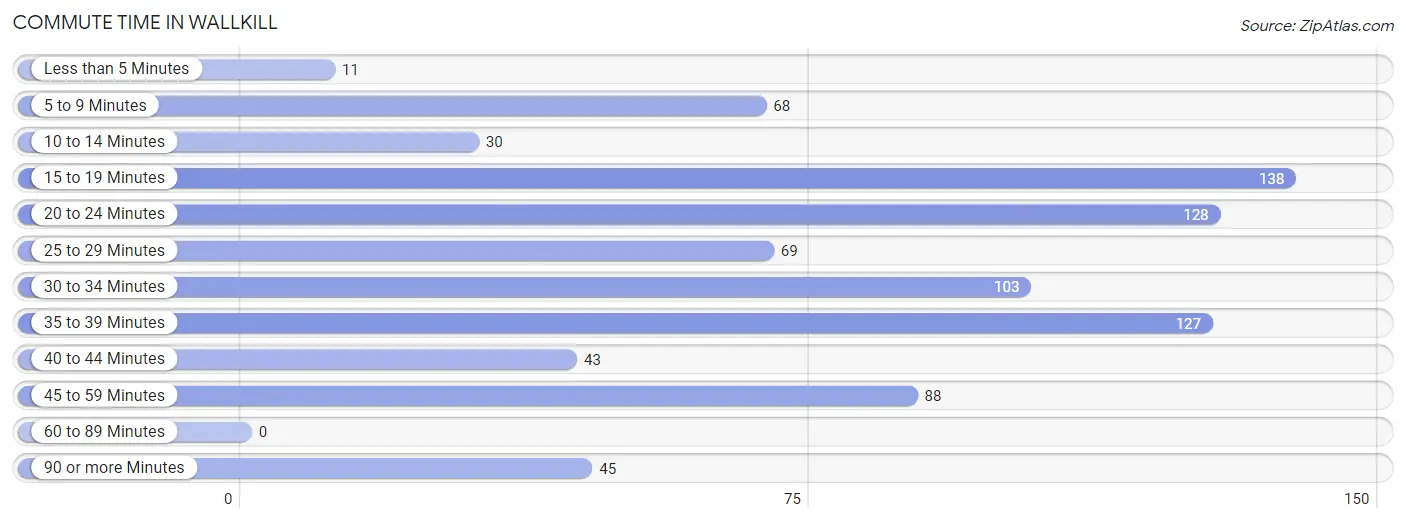
| Commute Time | # Commuters | % Commuters |
| Less than 5 Minutes | 11 | 1.3% |
| 5 to 9 Minutes | 68 | 8.0% |
| 10 to 14 Minutes | 30 | 3.5% |
| 15 to 19 Minutes | 138 | 16.2% |
| 20 to 24 Minutes | 128 | 15.1% |
| 25 to 29 Minutes | 69 | 8.1% |
| 30 to 34 Minutes | 103 | 12.1% |
| 35 to 39 Minutes | 127 | 14.9% |
| 40 to 44 Minutes | 43 | 5.1% |
| 45 to 59 Minutes | 88 | 10.3% |
| 60 to 89 Minutes | 0 | 0.0% |
| 90 or more Minutes | 45 | 5.3% |
Commute Time by Sex in Wallkill
The most common commute times in Wallkill are 35 to 39 minutes (77 commuters, 18.2%) for males and 15 to 19 minutes (99 commuters, 23.2%) for females.
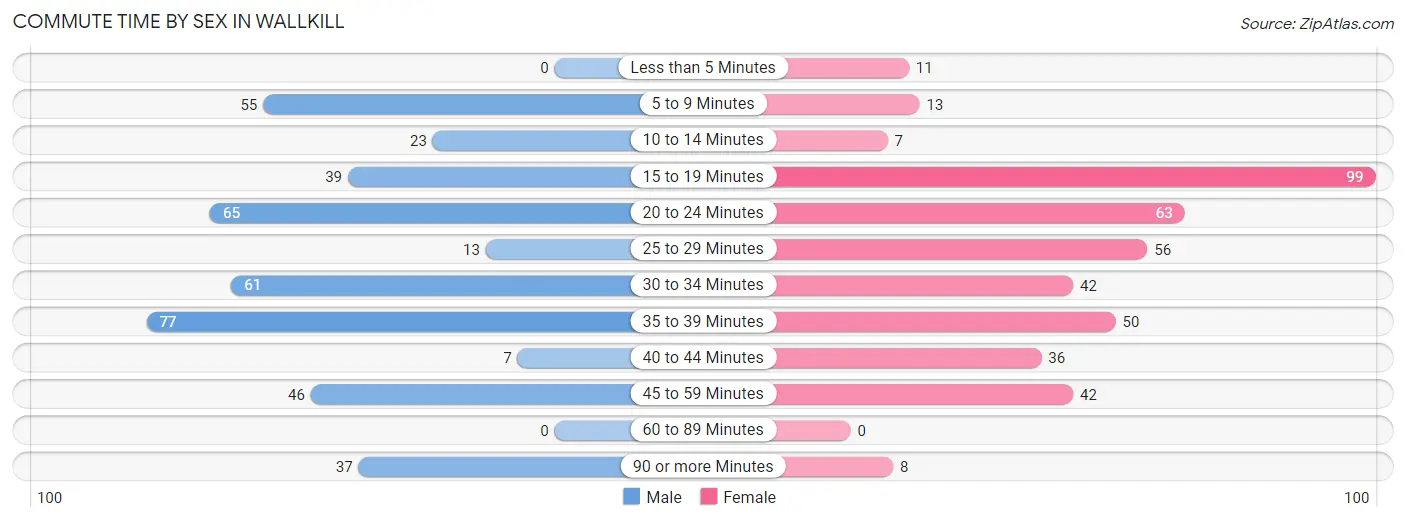
| Commute Time | Male | Female |
| Less than 5 Minutes | 0 (0.0%) | 11 (2.6%) |
| 5 to 9 Minutes | 55 (13.0%) | 13 (3.0%) |
| 10 to 14 Minutes | 23 (5.4%) | 7 (1.6%) |
| 15 to 19 Minutes | 39 (9.2%) | 99 (23.2%) |
| 20 to 24 Minutes | 65 (15.4%) | 63 (14.7%) |
| 25 to 29 Minutes | 13 (3.1%) | 56 (13.1%) |
| 30 to 34 Minutes | 61 (14.4%) | 42 (9.8%) |
| 35 to 39 Minutes | 77 (18.2%) | 50 (11.7%) |
| 40 to 44 Minutes | 7 (1.7%) | 36 (8.4%) |
| 45 to 59 Minutes | 46 (10.9%) | 42 (9.8%) |
| 60 to 89 Minutes | 0 (0.0%) | 0 (0.0%) |
| 90 or more Minutes | 37 (8.7%) | 8 (1.9%) |
Time of Departure to Work by Sex in Wallkill
The most frequent times of departure to work in Wallkill are 6:00 AM to 6:29 AM (92, 21.7%) for males and 7:30 AM to 7:59 AM (154, 36.1%) for females.
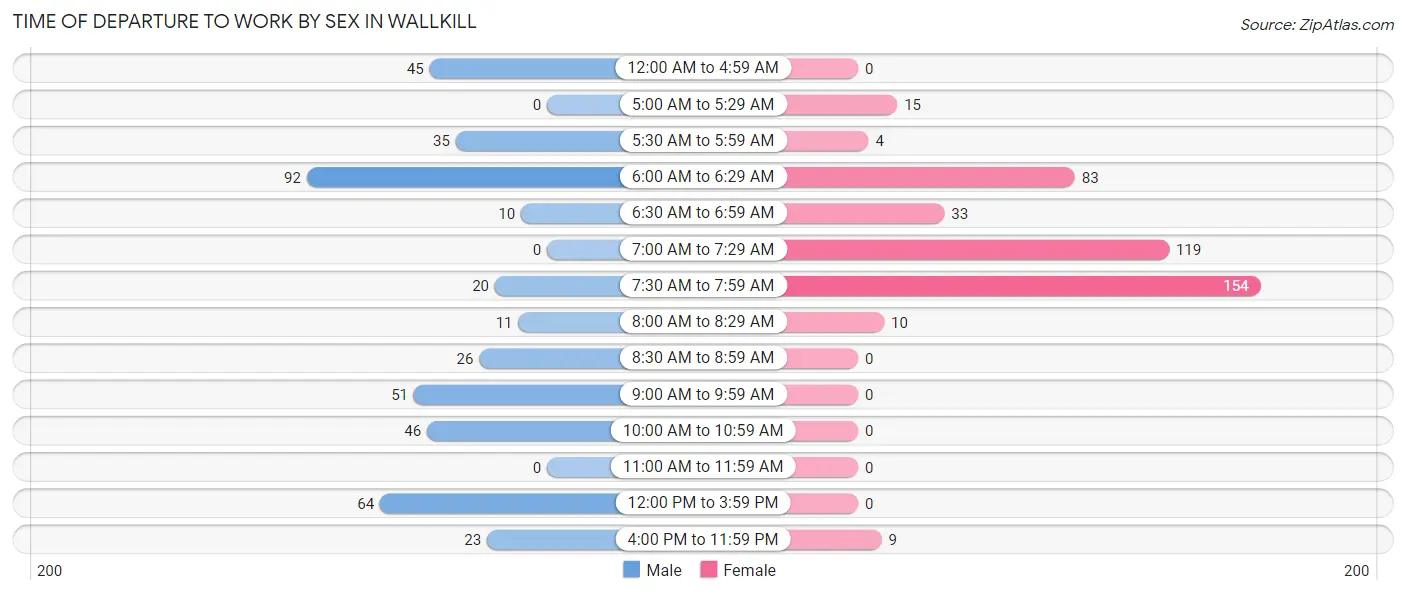
| Time of Departure | Male | Female |
| 12:00 AM to 4:59 AM | 45 (10.6%) | 0 (0.0%) |
| 5:00 AM to 5:29 AM | 0 (0.0%) | 15 (3.5%) |
| 5:30 AM to 5:59 AM | 35 (8.3%) | 4 (0.9%) |
| 6:00 AM to 6:29 AM | 92 (21.7%) | 83 (19.4%) |
| 6:30 AM to 6:59 AM | 10 (2.4%) | 33 (7.7%) |
| 7:00 AM to 7:29 AM | 0 (0.0%) | 119 (27.9%) |
| 7:30 AM to 7:59 AM | 20 (4.7%) | 154 (36.1%) |
| 8:00 AM to 8:29 AM | 11 (2.6%) | 10 (2.3%) |
| 8:30 AM to 8:59 AM | 26 (6.1%) | 0 (0.0%) |
| 9:00 AM to 9:59 AM | 51 (12.1%) | 0 (0.0%) |
| 10:00 AM to 10:59 AM | 46 (10.9%) | 0 (0.0%) |
| 11:00 AM to 11:59 AM | 0 (0.0%) | 0 (0.0%) |
| 12:00 PM to 3:59 PM | 64 (15.1%) | 0 (0.0%) |
| 4:00 PM to 11:59 PM | 23 (5.4%) | 9 (2.1%) |
| Total | 423 (100.0%) | 427 (100.0%) |
Housing Occupancy in Wallkill
Occupancy by Ownership in Wallkill
Of the total 809 dwellings in Wallkill, owner-occupied units account for 516 (63.8%), while renter-occupied units make up 293 (36.2%).
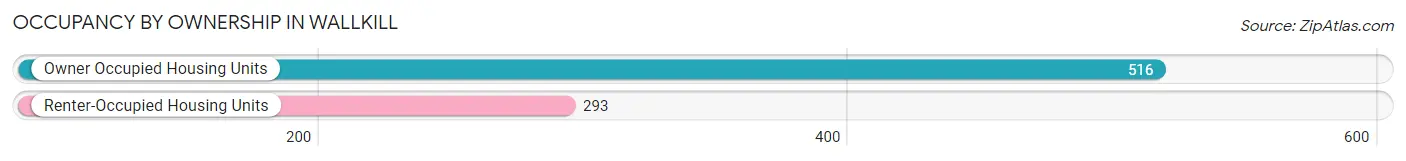
| Occupancy | # Housing Units | % Housing Units |
| Owner Occupied Housing Units | 516 | 63.8% |
| Renter-Occupied Housing Units | 293 | 36.2% |
| Total Occupied Housing Units | 809 | 100.0% |
Occupancy by Household Size in Wallkill
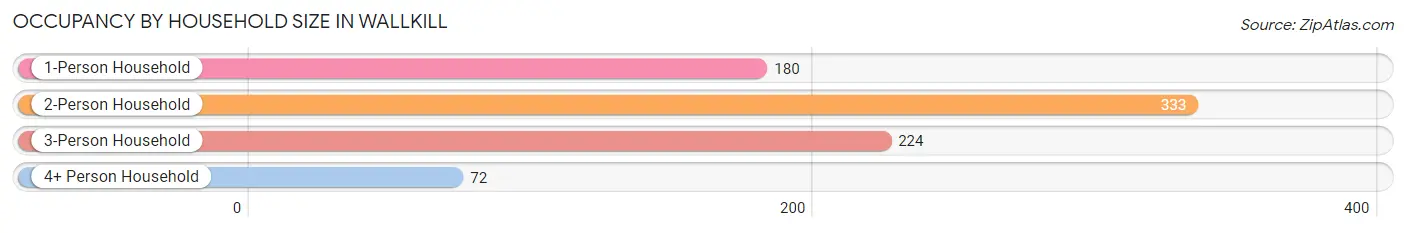
| Household Size | # Housing Units | % Housing Units |
| 1-Person Household | 180 | 22.3% |
| 2-Person Household | 333 | 41.2% |
| 3-Person Household | 224 | 27.7% |
| 4+ Person Household | 72 | 8.9% |
| Total Housing Units | 809 | 100.0% |
Occupancy by Ownership by Household Size in Wallkill
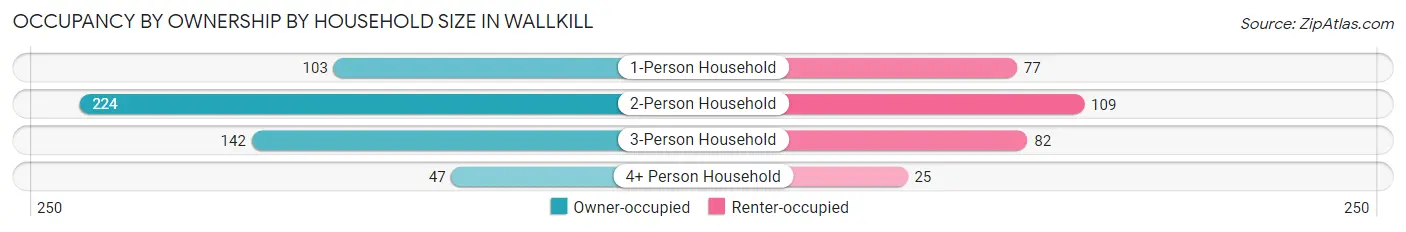
| Household Size | Owner-occupied | Renter-occupied |
| 1-Person Household | 103 (57.2%) | 77 (42.8%) |
| 2-Person Household | 224 (67.3%) | 109 (32.7%) |
| 3-Person Household | 142 (63.4%) | 82 (36.6%) |
| 4+ Person Household | 47 (65.3%) | 25 (34.7%) |
| Total Housing Units | 516 (63.8%) | 293 (36.2%) |
Occupancy by Educational Attainment in Wallkill
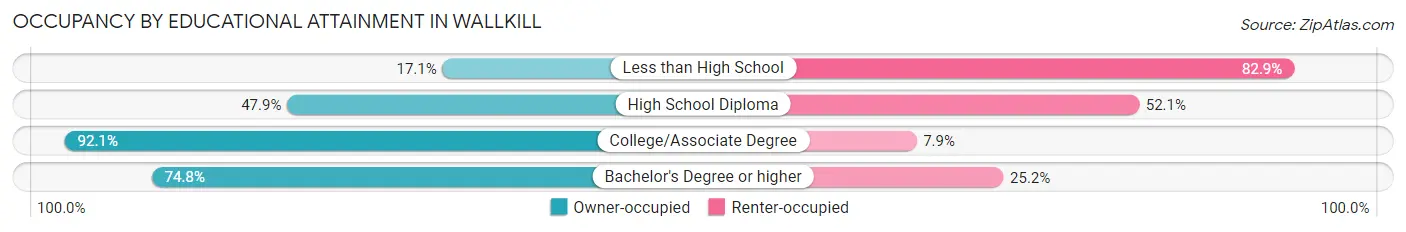
| Household Size | Owner-occupied | Renter-occupied |
| Less than High School | 24 (17.1%) | 116 (82.9%) |
| High School Diploma | 81 (47.9%) | 88 (52.1%) |
| College/Associate Degree | 197 (92.1%) | 17 (7.9%) |
| Bachelor's Degree or higher | 214 (74.8%) | 72 (25.2%) |
Occupancy by Age of Householder in Wallkill
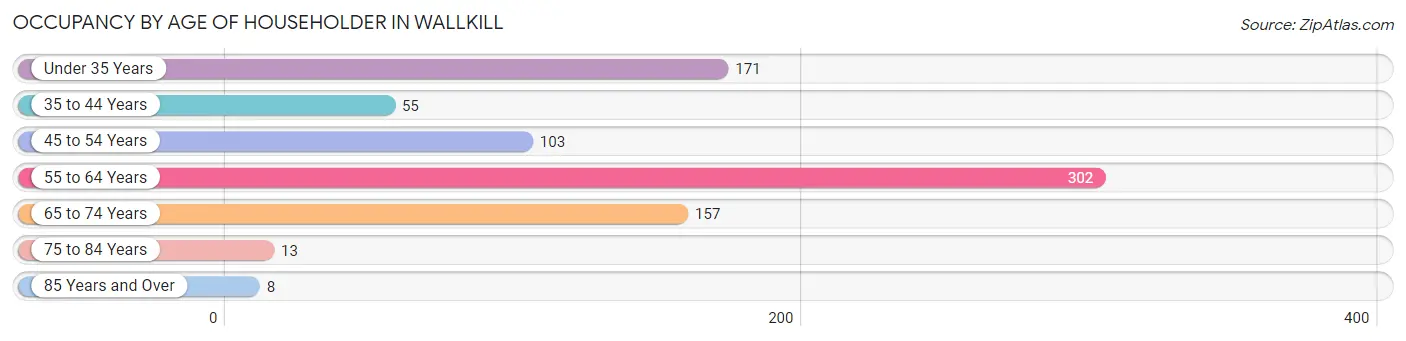
| Age Bracket | # Households | % Households |
| Under 35 Years | 171 | 21.1% |
| 35 to 44 Years | 55 | 6.8% |
| 45 to 54 Years | 103 | 12.7% |
| 55 to 64 Years | 302 | 37.3% |
| 65 to 74 Years | 157 | 19.4% |
| 75 to 84 Years | 13 | 1.6% |
| 85 Years and Over | 8 | 1.0% |
| Total | 809 | 100.0% |
Housing Finances in Wallkill
Median Income by Occupancy in Wallkill
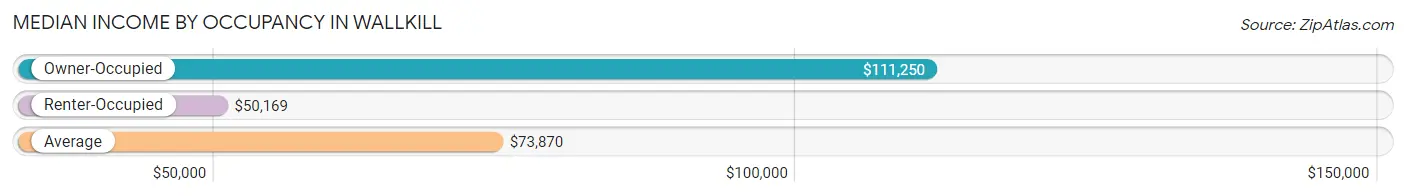
| Occupancy Type | # Households | Median Income |
| Owner-Occupied | 516 (63.8%) | $111,250 |
| Renter-Occupied | 293 (36.2%) | $50,169 |
| Average | 809 (100.0%) | $73,870 |
Occupancy by Householder Income Bracket in Wallkill
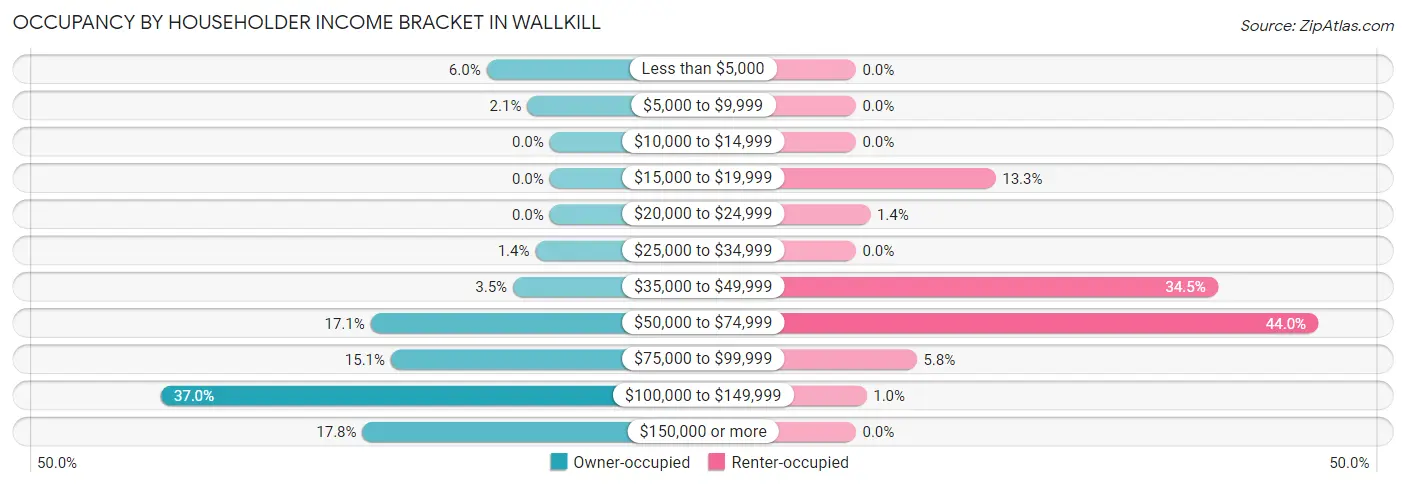
| Income Bracket | Owner-occupied | Renter-occupied |
| Less than $5,000 | 31 (6.0%) | 0 (0.0%) |
| $5,000 to $9,999 | 11 (2.1%) | 0 (0.0%) |
| $10,000 to $14,999 | 0 (0.0%) | 0 (0.0%) |
| $15,000 to $19,999 | 0 (0.0%) | 39 (13.3%) |
| $20,000 to $24,999 | 0 (0.0%) | 4 (1.4%) |
| $25,000 to $34,999 | 7 (1.4%) | 0 (0.0%) |
| $35,000 to $49,999 | 18 (3.5%) | 101 (34.5%) |
| $50,000 to $74,999 | 88 (17.1%) | 129 (44.0%) |
| $75,000 to $99,999 | 78 (15.1%) | 17 (5.8%) |
| $100,000 to $149,999 | 191 (37.0%) | 3 (1.0%) |
| $150,000 or more | 92 (17.8%) | 0 (0.0%) |
| Total | 516 (100.0%) | 293 (100.0%) |
Monthly Housing Cost Tiers in Wallkill
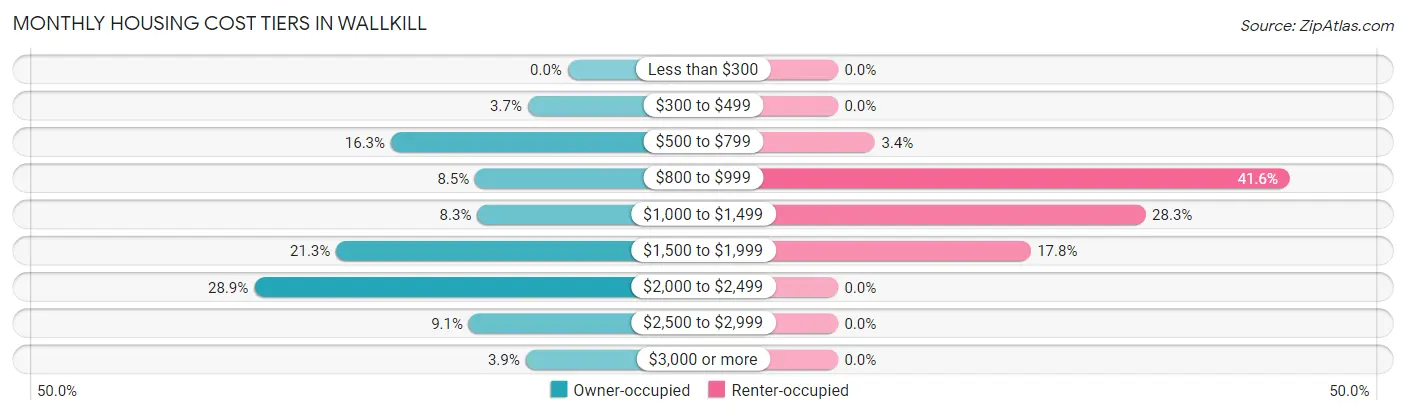
| Monthly Cost | Owner-occupied | Renter-occupied |
| Less than $300 | 0 (0.0%) | 0 (0.0%) |
| $300 to $499 | 19 (3.7%) | 0 (0.0%) |
| $500 to $799 | 84 (16.3%) | 10 (3.4%) |
| $800 to $999 | 44 (8.5%) | 122 (41.6%) |
| $1,000 to $1,499 | 43 (8.3%) | 83 (28.3%) |
| $1,500 to $1,999 | 110 (21.3%) | 52 (17.7%) |
| $2,000 to $2,499 | 149 (28.9%) | 0 (0.0%) |
| $2,500 to $2,999 | 47 (9.1%) | 0 (0.0%) |
| $3,000 or more | 20 (3.9%) | 0 (0.0%) |
| Total | 516 (100.0%) | 293 (100.0%) |
Physical Housing Characteristics in Wallkill
Housing Structures in Wallkill
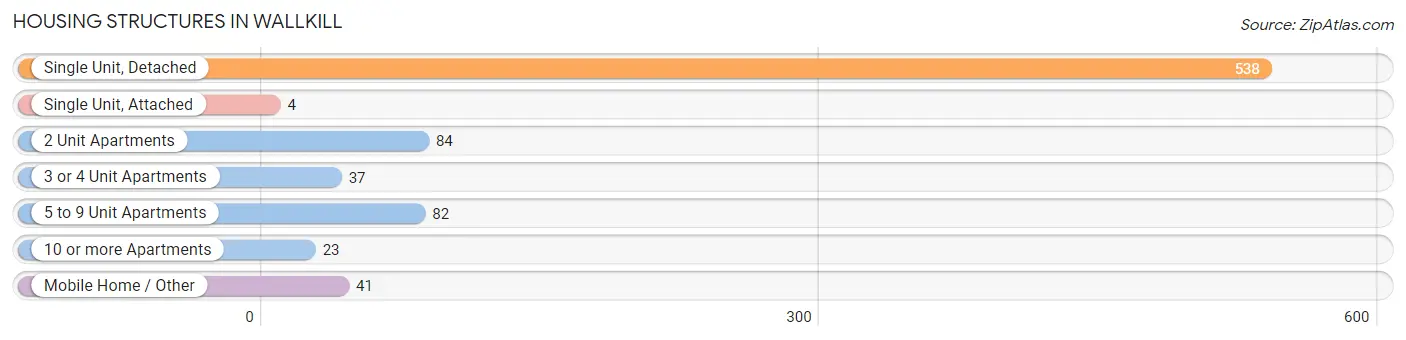
| Structure Type | # Housing Units | % Housing Units |
| Single Unit, Detached | 538 | 66.5% |
| Single Unit, Attached | 4 | 0.5% |
| 2 Unit Apartments | 84 | 10.4% |
| 3 or 4 Unit Apartments | 37 | 4.6% |
| 5 to 9 Unit Apartments | 82 | 10.1% |
| 10 or more Apartments | 23 | 2.8% |
| Mobile Home / Other | 41 | 5.1% |
| Total | 809 | 100.0% |
Housing Structures by Occupancy in Wallkill
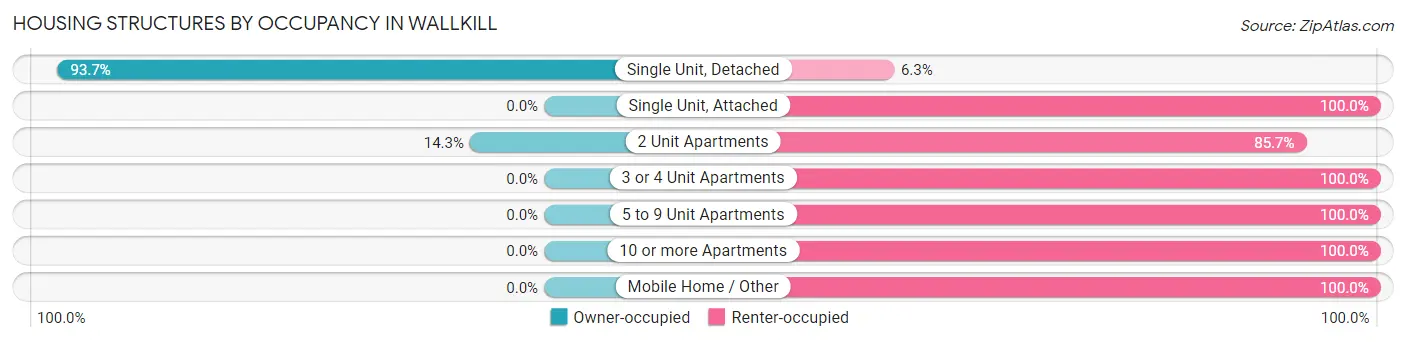
| Structure Type | Owner-occupied | Renter-occupied |
| Single Unit, Detached | 504 (93.7%) | 34 (6.3%) |
| Single Unit, Attached | 0 (0.0%) | 4 (100.0%) |
| 2 Unit Apartments | 12 (14.3%) | 72 (85.7%) |
| 3 or 4 Unit Apartments | 0 (0.0%) | 37 (100.0%) |
| 5 to 9 Unit Apartments | 0 (0.0%) | 82 (100.0%) |
| 10 or more Apartments | 0 (0.0%) | 23 (100.0%) |
| Mobile Home / Other | 0 (0.0%) | 41 (100.0%) |
| Total | 516 (63.8%) | 293 (36.2%) |
Housing Structures by Number of Rooms in Wallkill
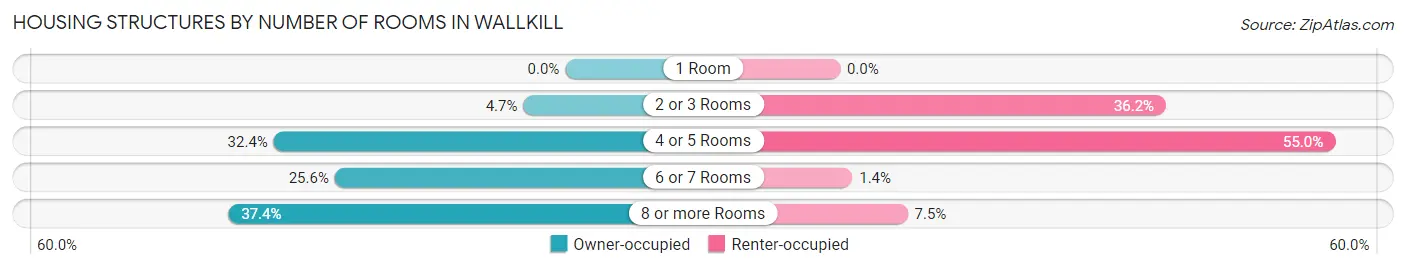
| Number of Rooms | Owner-occupied | Renter-occupied |
| 1 Room | 0 (0.0%) | 0 (0.0%) |
| 2 or 3 Rooms | 24 (4.6%) | 106 (36.2%) |
| 4 or 5 Rooms | 167 (32.4%) | 161 (54.9%) |
| 6 or 7 Rooms | 132 (25.6%) | 4 (1.4%) |
| 8 or more Rooms | 193 (37.4%) | 22 (7.5%) |
| Total | 516 (100.0%) | 293 (100.0%) |
Housing Structure by Heating Type in Wallkill
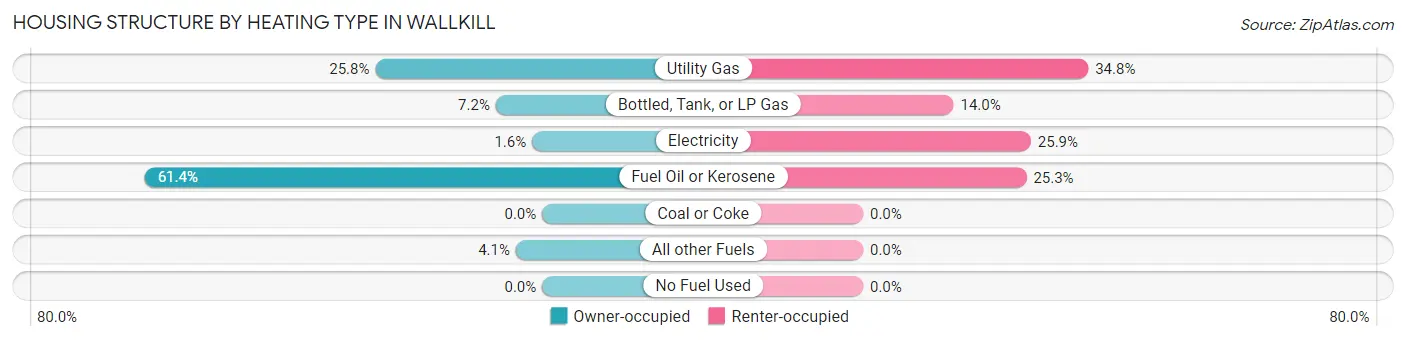
| Heating Type | Owner-occupied | Renter-occupied |
| Utility Gas | 133 (25.8%) | 102 (34.8%) |
| Bottled, Tank, or LP Gas | 37 (7.2%) | 41 (14.0%) |
| Electricity | 8 (1.5%) | 76 (25.9%) |
| Fuel Oil or Kerosene | 317 (61.4%) | 74 (25.3%) |
| Coal or Coke | 0 (0.0%) | 0 (0.0%) |
| All other Fuels | 21 (4.1%) | 0 (0.0%) |
| No Fuel Used | 0 (0.0%) | 0 (0.0%) |
| Total | 516 (100.0%) | 293 (100.0%) |
Household Vehicle Usage in Wallkill
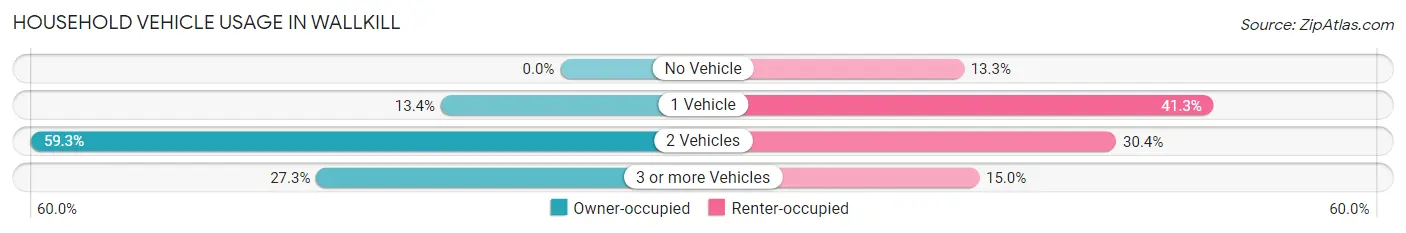
| Vehicles per Household | Owner-occupied | Renter-occupied |
| No Vehicle | 0 (0.0%) | 39 (13.3%) |
| 1 Vehicle | 69 (13.4%) | 121 (41.3%) |
| 2 Vehicles | 306 (59.3%) | 89 (30.4%) |
| 3 or more Vehicles | 141 (27.3%) | 44 (15.0%) |
| Total | 516 (100.0%) | 293 (100.0%) |
Real Estate & Mortgages in Wallkill
Real Estate and Mortgage Overview in Wallkill
| Characteristic | Without Mortgage | With Mortgage |
| Housing Units | 140 | 376 |
| Median Property Value | $228,700 | $269,700 |
| Median Household Income | $70,682 | $69 |
| Monthly Housing Costs | $744 | $20 |
| Real Estate Taxes | $4,786 | $0 |
Property Value by Mortgage Status in Wallkill
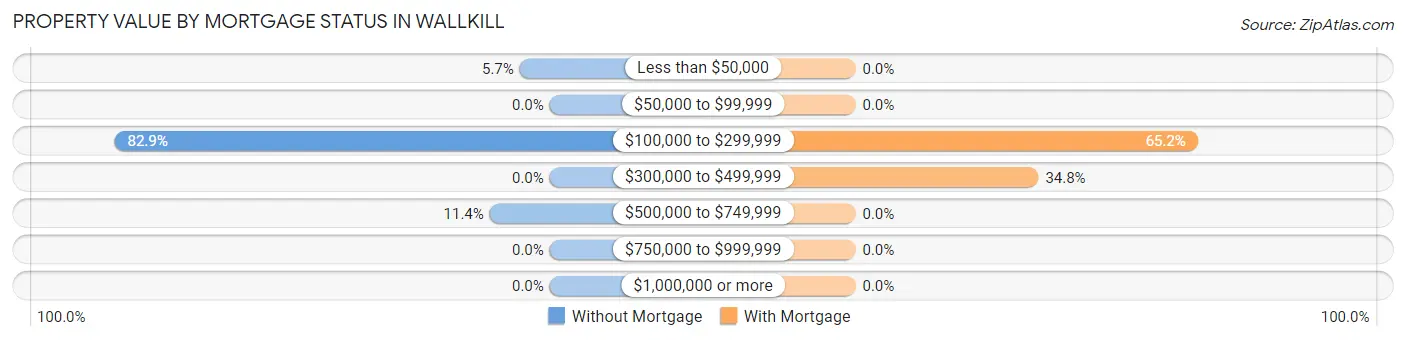
| Property Value | Without Mortgage | With Mortgage |
| Less than $50,000 | 8 (5.7%) | 0 (0.0%) |
| $50,000 to $99,999 | 0 (0.0%) | 0 (0.0%) |
| $100,000 to $299,999 | 116 (82.9%) | 245 (65.2%) |
| $300,000 to $499,999 | 0 (0.0%) | 131 (34.8%) |
| $500,000 to $749,999 | 16 (11.4%) | 0 (0.0%) |
| $750,000 to $999,999 | 0 (0.0%) | 0 (0.0%) |
| $1,000,000 or more | 0 (0.0%) | 0 (0.0%) |
| Total | 140 (100.0%) | 376 (100.0%) |
Household Income by Mortgage Status in Wallkill
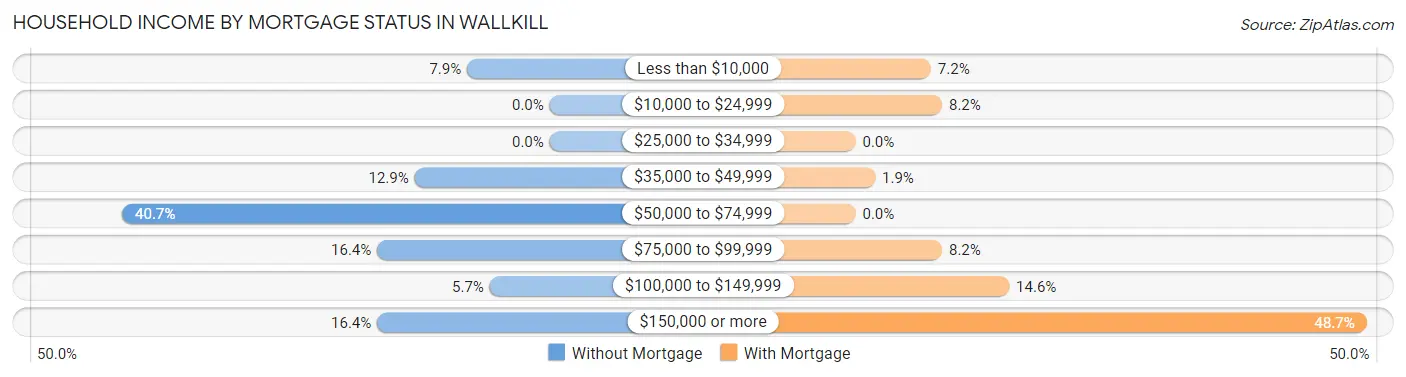
| Household Income | Without Mortgage | With Mortgage |
| Less than $10,000 | 11 (7.9%) | 27 (7.2%) |
| $10,000 to $24,999 | 0 (0.0%) | 31 (8.2%) |
| $25,000 to $34,999 | 0 (0.0%) | 0 (0.0%) |
| $35,000 to $49,999 | 18 (12.9%) | 7 (1.9%) |
| $50,000 to $74,999 | 57 (40.7%) | 0 (0.0%) |
| $75,000 to $99,999 | 23 (16.4%) | 31 (8.2%) |
| $100,000 to $149,999 | 8 (5.7%) | 55 (14.6%) |
| $150,000 or more | 23 (16.4%) | 183 (48.7%) |
| Total | 140 (100.0%) | 376 (100.0%) |
Property Value to Household Income Ratio in Wallkill
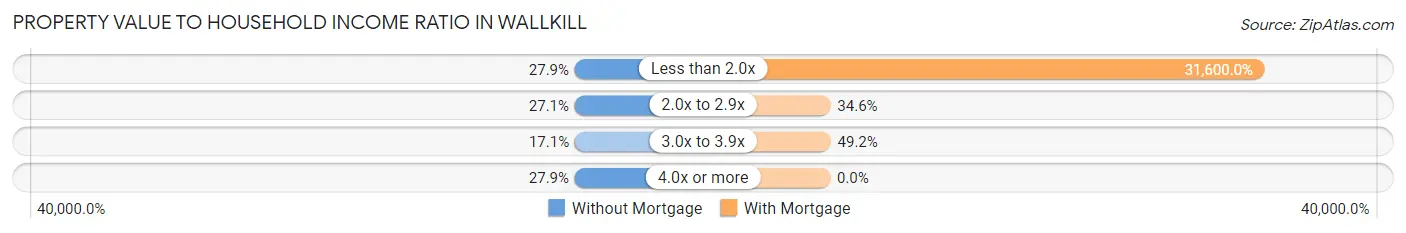
| Value-to-Income Ratio | Without Mortgage | With Mortgage |
| Less than 2.0x | 39 (27.9%) | 118,816 (31,600.0%) |
| 2.0x to 2.9x | 38 (27.1%) | 130 (34.6%) |
| 3.0x to 3.9x | 24 (17.1%) | 185 (49.2%) |
| 4.0x or more | 39 (27.9%) | 0 (0.0%) |
| Total | 140 (100.0%) | 376 (100.0%) |
Real Estate Taxes by Mortgage Status in Wallkill
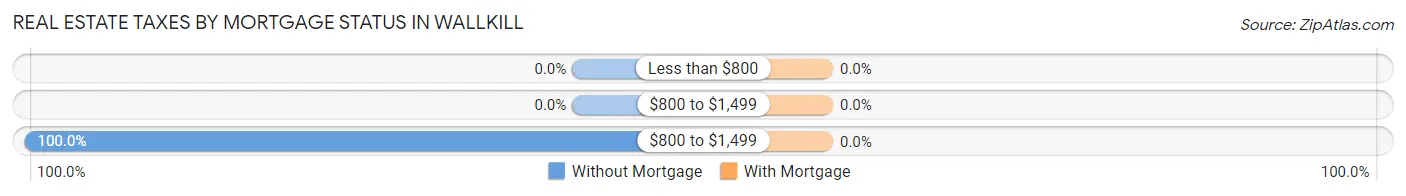
| Property Taxes | Without Mortgage | With Mortgage |
| Less than $800 | 0 (0.0%) | 0 (0.0%) |
| $800 to $1,499 | 0 (0.0%) | 0 (0.0%) |
| $800 to $1,499 | 140 (100.0%) | 0 (0.0%) |
| Total | 140 (100.0%) | 376 (100.0%) |
Health & Disability in Wallkill
Health Insurance Coverage by Age in Wallkill
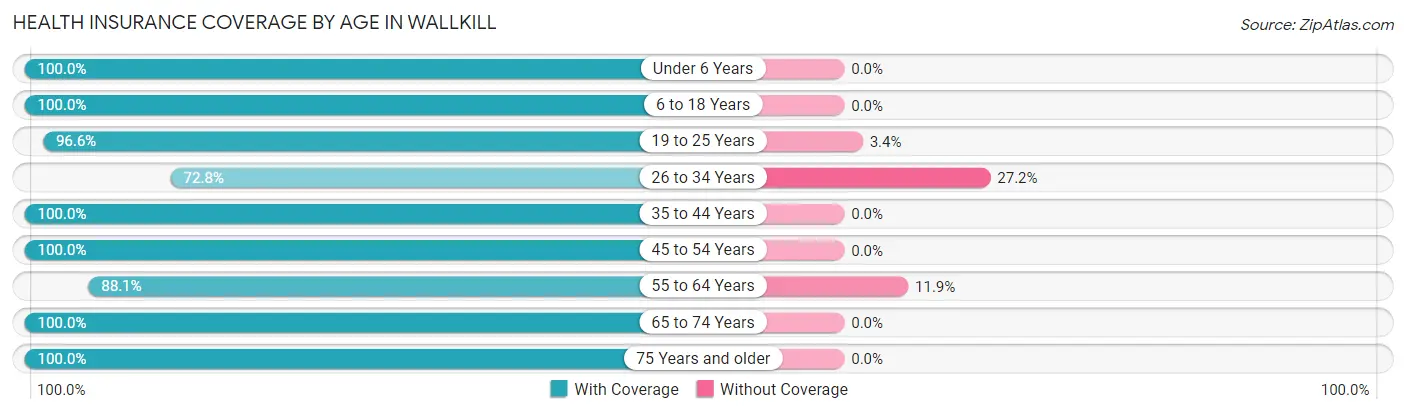
| Age Bracket | With Coverage | Without Coverage |
| Under 6 Years | 40 (100.0%) | 0 (0.0%) |
| 6 to 18 Years | 256 (100.0%) | 0 (0.0%) |
| 19 to 25 Years | 169 (96.6%) | 6 (3.4%) |
| 26 to 34 Years | 219 (72.8%) | 82 (27.2%) |
| 35 to 44 Years | 97 (100.0%) | 0 (0.0%) |
| 45 to 54 Years | 225 (100.0%) | 0 (0.0%) |
| 55 to 64 Years | 407 (88.1%) | 55 (11.9%) |
| 65 to 74 Years | 215 (100.0%) | 0 (0.0%) |
| 75 Years and older | 88 (100.0%) | 0 (0.0%) |
| Total | 1,716 (92.3%) | 143 (7.7%) |
Health Insurance Coverage by Citizenship Status in Wallkill
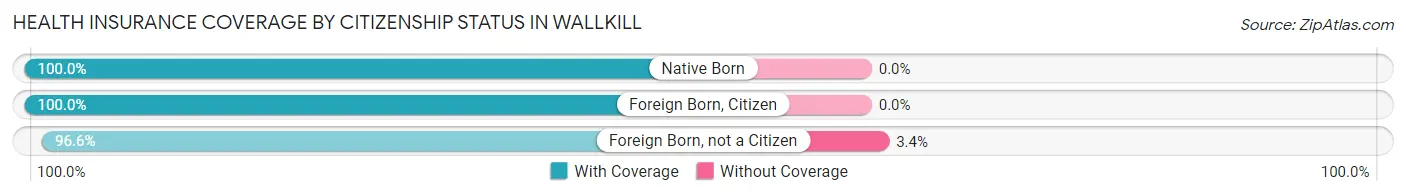
| Citizenship Status | With Coverage | Without Coverage |
| Native Born | 40 (100.0%) | 0 (0.0%) |
| Foreign Born, Citizen | 256 (100.0%) | 0 (0.0%) |
| Foreign Born, not a Citizen | 169 (96.6%) | 6 (3.4%) |
Health Insurance Coverage by Household Income in Wallkill
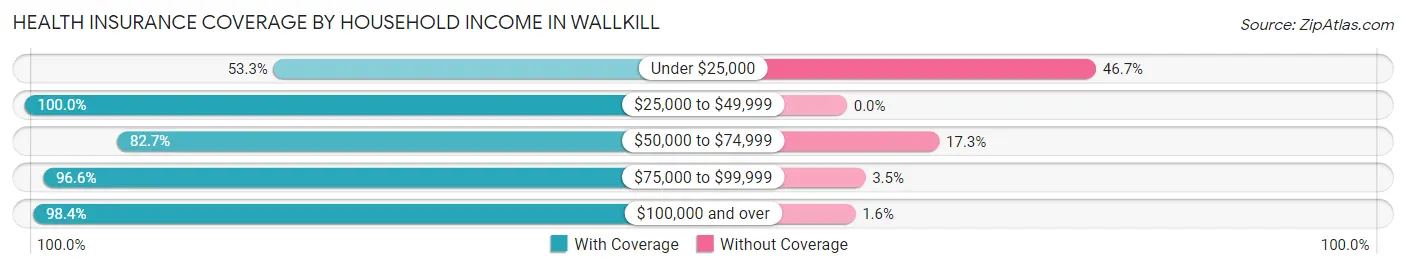
| Household Income | With Coverage | Without Coverage |
| Under $25,000 | 48 (53.3%) | 42 (46.7%) |
| $25,000 to $49,999 | 299 (100.0%) | 0 (0.0%) |
| $50,000 to $74,999 | 392 (82.7%) | 82 (17.3%) |
| $75,000 to $99,999 | 168 (96.6%) | 6 (3.5%) |
| $100,000 and over | 809 (98.4%) | 13 (1.6%) |
Public vs Private Health Insurance Coverage by Age in Wallkill
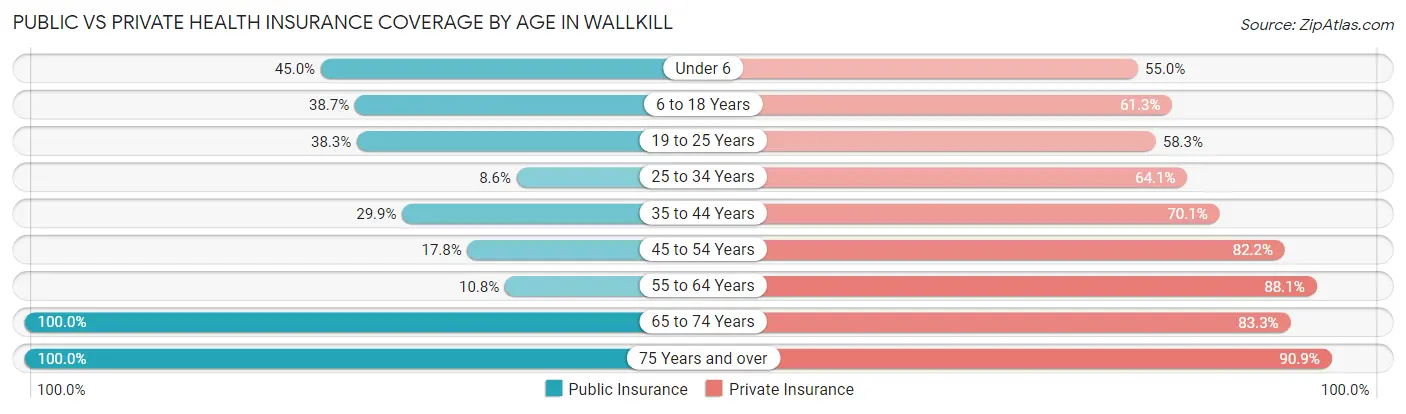
| Age Bracket | Public Insurance | Private Insurance |
| Under 6 | 18 (45.0%) | 22 (55.0%) |
| 6 to 18 Years | 99 (38.7%) | 157 (61.3%) |
| 19 to 25 Years | 67 (38.3%) | 102 (58.3%) |
| 25 to 34 Years | 26 (8.6%) | 193 (64.1%) |
| 35 to 44 Years | 29 (29.9%) | 68 (70.1%) |
| 45 to 54 Years | 40 (17.8%) | 185 (82.2%) |
| 55 to 64 Years | 50 (10.8%) | 407 (88.1%) |
| 65 to 74 Years | 215 (100.0%) | 179 (83.3%) |
| 75 Years and over | 88 (100.0%) | 80 (90.9%) |
| Total | 632 (34.0%) | 1,393 (74.9%) |
Disability Status by Sex by Age in Wallkill
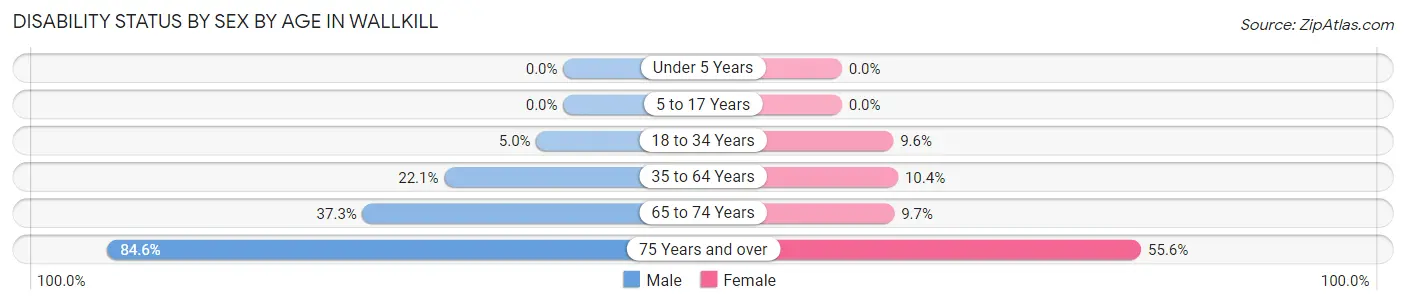
| Age Bracket | Male | Female |
| Under 5 Years | 0 (0.0%) | 0 (0.0%) |
| 5 to 17 Years | 0 (0.0%) | 0 (0.0%) |
| 18 to 34 Years | 16 (5.0%) | 19 (9.6%) |
| 35 to 64 Years | 80 (22.1%) | 44 (10.4%) |
| 65 to 74 Years | 38 (37.2%) | 11 (9.7%) |
| 75 Years and over | 44 (84.6%) | 20 (55.6%) |
Disability Class by Sex by Age in Wallkill
Disability Class: Hearing Difficulty
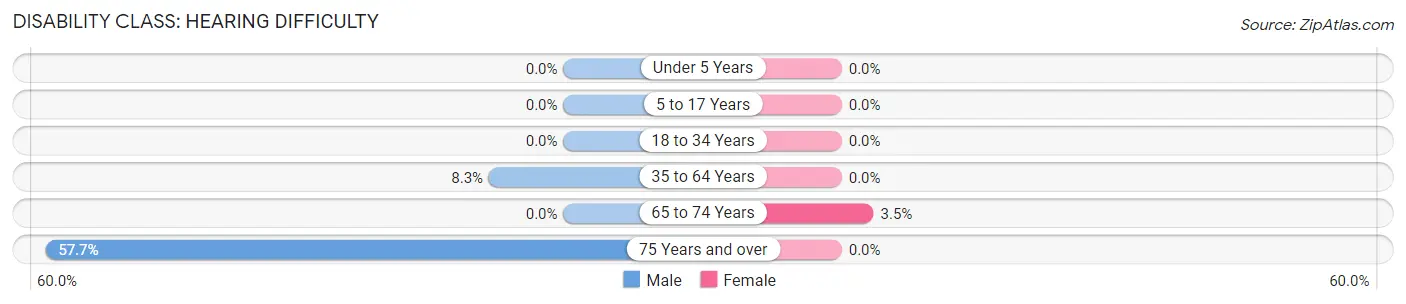
| Age Bracket | Male | Female |
| Under 5 Years | 0 (0.0%) | 0 (0.0%) |
| 5 to 17 Years | 0 (0.0%) | 0 (0.0%) |
| 18 to 34 Years | 0 (0.0%) | 0 (0.0%) |
| 35 to 64 Years | 30 (8.3%) | 0 (0.0%) |
| 65 to 74 Years | 0 (0.0%) | 4 (3.5%) |
| 75 Years and over | 30 (57.7%) | 0 (0.0%) |
Disability Class: Vision Difficulty
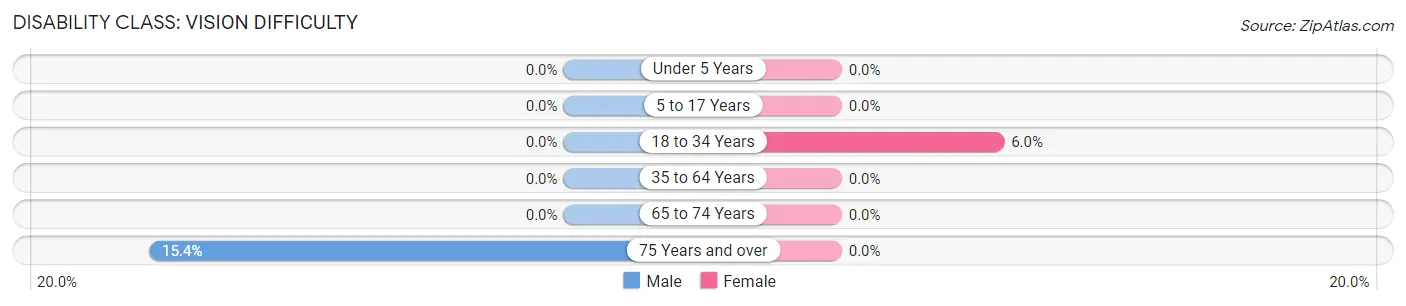
| Age Bracket | Male | Female |
| Under 5 Years | 0 (0.0%) | 0 (0.0%) |
| 5 to 17 Years | 0 (0.0%) | 0 (0.0%) |
| 18 to 34 Years | 0 (0.0%) | 12 (6.0%) |
| 35 to 64 Years | 0 (0.0%) | 0 (0.0%) |
| 65 to 74 Years | 0 (0.0%) | 0 (0.0%) |
| 75 Years and over | 8 (15.4%) | 0 (0.0%) |
Disability Class: Cognitive Difficulty
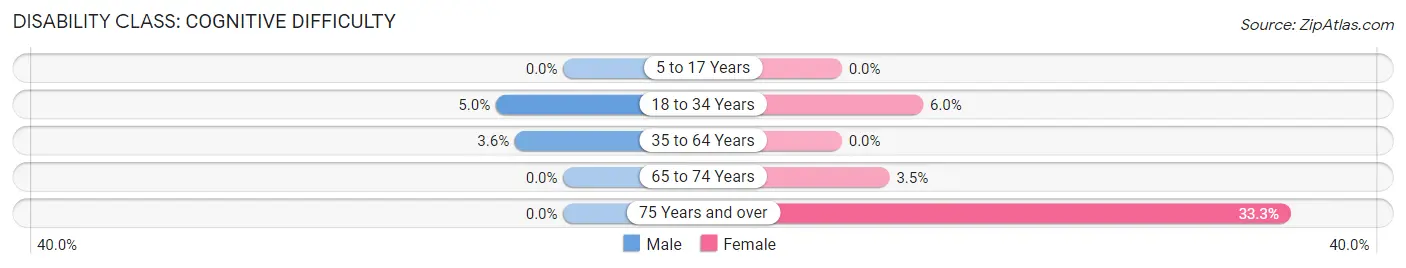
| Age Bracket | Male | Female |
| 5 to 17 Years | 0 (0.0%) | 0 (0.0%) |
| 18 to 34 Years | 16 (5.0%) | 12 (6.0%) |
| 35 to 64 Years | 13 (3.6%) | 0 (0.0%) |
| 65 to 74 Years | 0 (0.0%) | 4 (3.5%) |
| 75 Years and over | 0 (0.0%) | 12 (33.3%) |
Disability Class: Ambulatory Difficulty
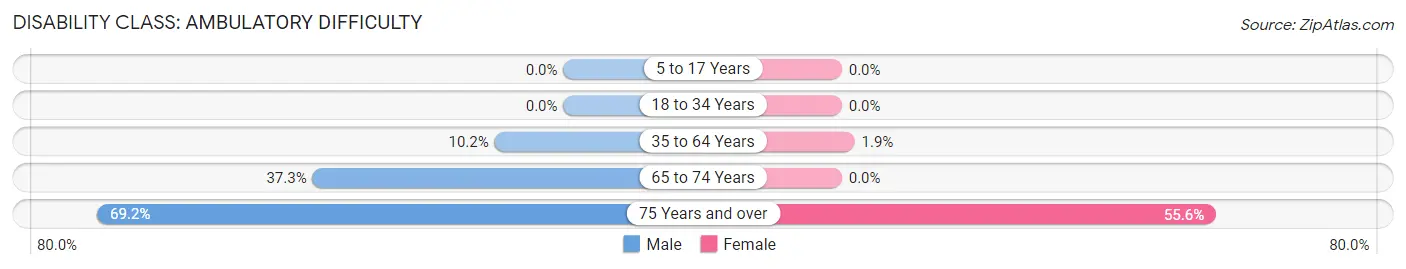
| Age Bracket | Male | Female |
| 5 to 17 Years | 0 (0.0%) | 0 (0.0%) |
| 18 to 34 Years | 0 (0.0%) | 0 (0.0%) |
| 35 to 64 Years | 37 (10.2%) | 8 (1.9%) |
| 65 to 74 Years | 38 (37.2%) | 0 (0.0%) |
| 75 Years and over | 36 (69.2%) | 20 (55.6%) |
Disability Class: Self-Care Difficulty
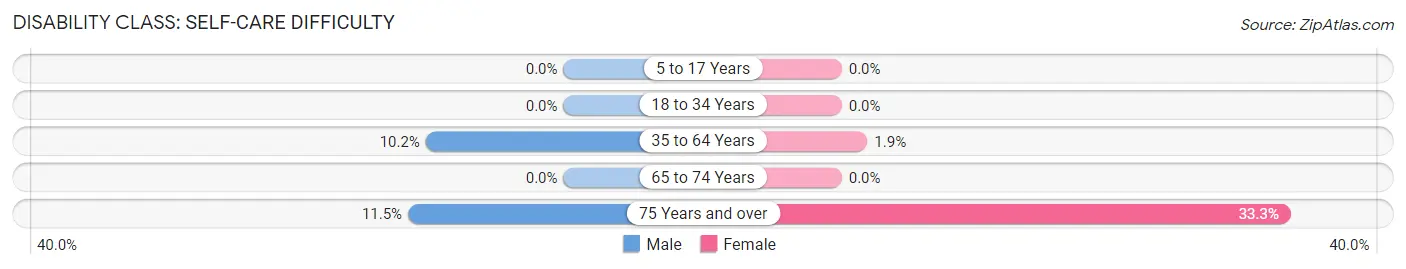
| Age Bracket | Male | Female |
| 5 to 17 Years | 0 (0.0%) | 0 (0.0%) |
| 18 to 34 Years | 0 (0.0%) | 0 (0.0%) |
| 35 to 64 Years | 37 (10.2%) | 8 (1.9%) |
| 65 to 74 Years | 0 (0.0%) | 0 (0.0%) |
| 75 Years and over | 6 (11.5%) | 12 (33.3%) |
Technology Access in Wallkill
Computing Device Access in Wallkill
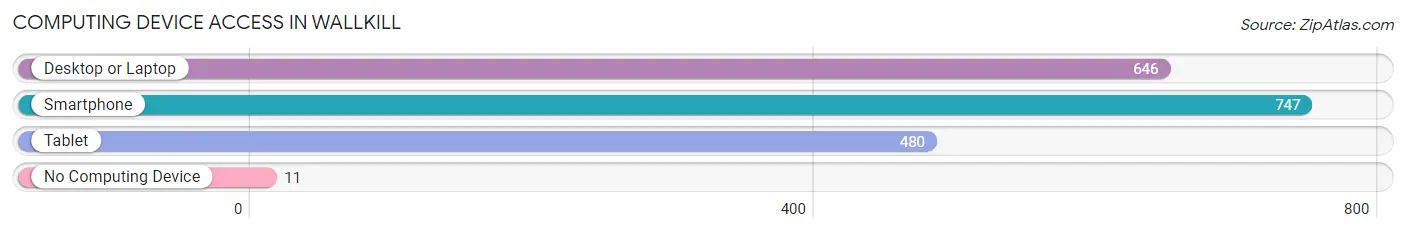
| Device Type | # Households | % Households |
| Desktop or Laptop | 646 | 79.8% |
| Smartphone | 747 | 92.3% |
| Tablet | 480 | 59.3% |
| No Computing Device | 11 | 1.4% |
| Total | 809 | 100.0% |
Internet Access in Wallkill
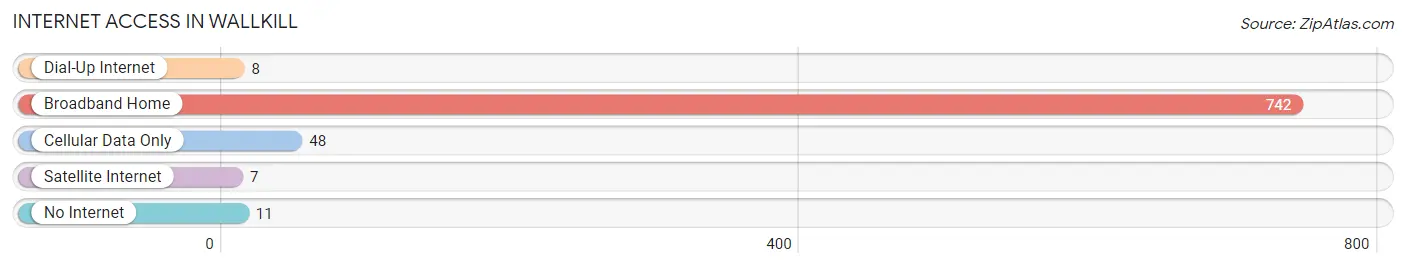
| Internet Type | # Households | % Households |
| Dial-Up Internet | 8 | 1.0% |
| Broadband Home | 742 | 91.7% |
| Cellular Data Only | 48 | 5.9% |
| Satellite Internet | 7 | 0.9% |
| No Internet | 11 | 1.4% |
| Total | 809 | 100.0% |
Wallkill Summary
Wallkill is a town located in Orange County, New York, United States. The population was estimated to be 11,845 in 2019. The town is located in the Hudson Valley region of the state and is part of the Poughkeepsie–Newburgh–Middletown Metropolitan Statistical Area.
History
The area that is now Wallkill was originally inhabited by the Munsee people, a branch of the Lenape. The first European settlers arrived in the area in the late 17th century. The town was established in 1772 as part of Ulster County. In 1798, it became part of Orange County.
The town was named after the Wallkill River, which flows through the town. The river was named by the Dutch settlers who arrived in the area in the 1650s. The name is derived from the Dutch word “walle”, which means “river”, and “kil”, which means “stream”.
Geography
Wallkill is located in the Hudson Valley region of New York. It is bordered by the towns of Shawangunk to the north, Montgomery to the east, Newburgh to the south, and Gardiner to the west. The town covers an area of approximately 33 square miles and is located approximately 60 miles north of New York City.
The Wallkill River flows through the town and is a major tributary of the Hudson River. The town is also home to several lakes, including Lake Awosting, Lake Minnewaska, and Lake Mohonk.
Economy
The economy of Wallkill is largely based on agriculture and tourism. The town is home to several farms, including dairy farms, vegetable farms, and apple orchards. The town is also home to several wineries and breweries.
Tourism is an important part of the local economy. The town is home to several state parks, including Minnewaska State Park, Mohonk Preserve, and Wallkill River National Wildlife Refuge. The town is also home to several historic sites, including the Wallkill Valley Railroad Museum and the Wallkill Valley Rail Trail.
Demographics
As of the 2010 census, the population of Wallkill was 11,541. The racial makeup of the town was 87.3% White, 5.7% African American, 0.3% Native American, 1.7% Asian, 0.1% Pacific Islander, 2.7% from other races, and 2.1% from two or more races. Hispanic or Latino of any race were 8.2% of the population.
The median household income in Wallkill was $63,917 in 2019. The per capita income was $30,945. About 8.3% of the population was below the poverty line.
Wallkill is served by the Wallkill Central School District. The town is home to several private schools, including Wallkill Christian School and Wallkill Valley Montessori School.
Common Questions
What is Per Capita Income in Wallkill?
Per Capita income in Wallkill is $38,472.
What is the Median Family Income in Wallkill?
Median Family Income in Wallkill is $82,386.
What is the Median Household income in Wallkill?
Median Household Income in Wallkill is $73,870.
What is Income or Wage Gap in Wallkill?
Income or Wage Gap in Wallkill is 16.0%.
Women in Wallkill earn 84.0 cents for every dollar earned by a man.
What is Inequality or Gini Index in Wallkill?
Inequality or Gini Index in Wallkill is 0.35.
What is the Total Population of Wallkill?
Total Population of Wallkill is 1,859.
What is the Total Male Population of Wallkill?
Total Male Population of Wallkill is 931.
What is the Total Female Population of Wallkill?
Total Female Population of Wallkill is 928.
What is the Ratio of Males per 100 Females in Wallkill?
There are 100.32 Males per 100 Females in Wallkill.
What is the Ratio of Females per 100 Males in Wallkill?
There are 99.68 Females per 100 Males in Wallkill.
What is the Median Population Age in Wallkill?
Median Population Age in Wallkill is 45.7 Years.
What is the Average Family Size in Wallkill
Average Family Size in Wallkill is 2.6 People.
What is the Average Household Size in Wallkill
Average Household Size in Wallkill is 2.3 People.
How Large is the Labor Force in Wallkill?
There are 938 People in the Labor Forcein in Wallkill.
What is the Percentage of People in the Labor Force in Wallkill?
58.1% of People are in the Labor Force in Wallkill.
What is the Unemployment Rate in Wallkill?
Unemployment Rate in Wallkill is 4.2%.