Saugerties, NY Map & Demographics
Saugerties Map
Saugerties Overview
$34,153
PER CAPITA INCOME
$89,336
AVG FAMILY INCOME
$52,703
AVG HOUSEHOLD INCOME
20.9%
WAGE / INCOME GAP [ % ]
79.1¢/ $1
WAGE / INCOME GAP [ $ ]
0.46
INEQUALITY / GINI INDEX
3,892
TOTAL POPULATION
1,741
MALE POPULATION
2,151
FEMALE POPULATION
80.94
MALES / 100 FEMALES
123.55
FEMALES / 100 MALES
45.2
MEDIAN AGE
3.5
AVG FAMILY SIZE
2.1
AVG HOUSEHOLD SIZE
1,910
LABOR FORCE [ PEOPLE ]
59.2%
PERCENT IN LABOR FORCE
3.4%
UNEMPLOYMENT RATE
Saugerties Zip Codes
Saugerties Area Codes
Income in Saugerties
Income Overview in Saugerties
Per Capita Income in Saugerties is $34,153, while median incomes of families and households are $89,336 and $52,703 respectively.
| Characteristic | Number | Measure |
| Per Capita Income | 3,892 | $34,153 |
| Median Family Income | 689 | $89,336 |
| Mean Family Income | 689 | $108,393 |
| Median Household Income | 1,832 | $52,703 |
| Mean Household Income | 1,832 | $69,682 |
| Income Deficit | 689 | $0 |
| Wage / Income Gap (%) | 3,892 | 20.92% |
| Wage / Income Gap ($) | 3,892 | 79.08¢ per $1 |
| Gini / Inequality Index | 3,892 | 0.46 |
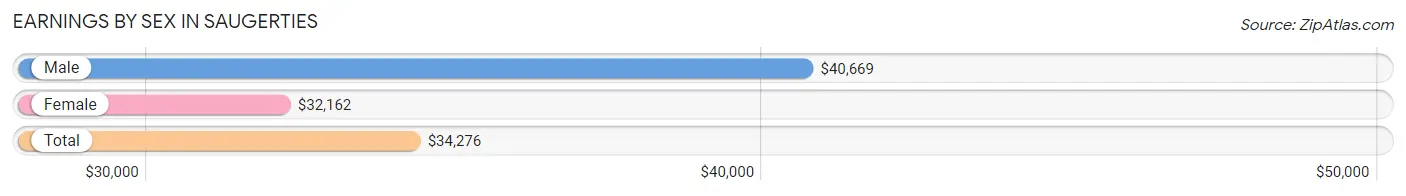
Earnings by Sex in Saugerties
Average Earnings in Saugerties are $34,276, $40,669 for men and $32,162 for women, a difference of 20.9%.
| Sex | Number | Average Earnings |
| Male | 993 (50.0%) | $40,669 |
| Female | 992 (50.0%) | $32,162 |
| Total | 1,985 (100.0%) | $34,276 |
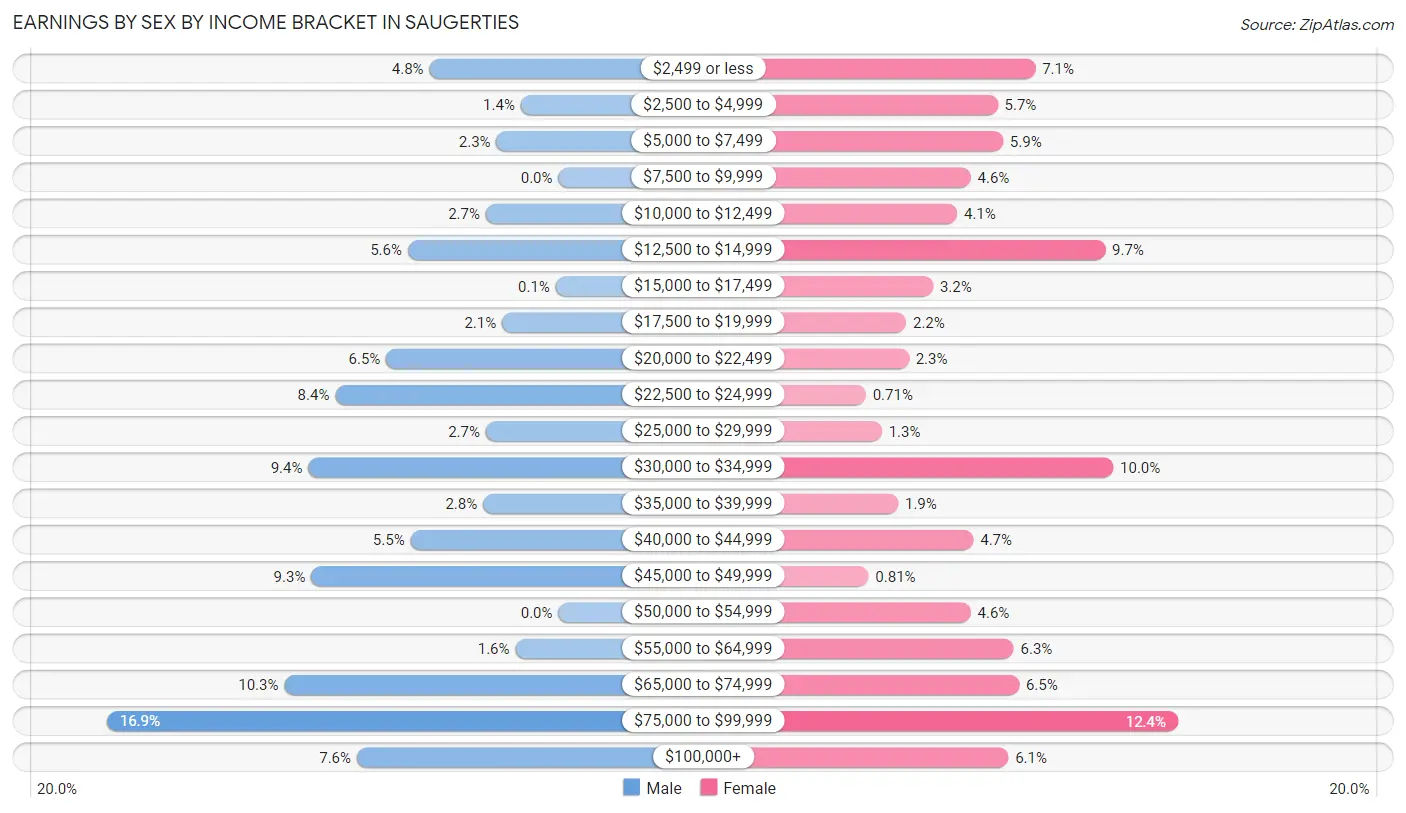
Earnings by Sex by Income Bracket in Saugerties
The most common earnings brackets in Saugerties are $75,000 to $99,999 for men (168 | 16.9%) and $75,000 to $99,999 for women (123 | 12.4%).
| Income | Male | Female |
| $2,499 or less | 48 (4.8%) | 70 (7.1%) |
| $2,500 to $4,999 | 14 (1.4%) | 56 (5.7%) |
| $5,000 to $7,499 | 23 (2.3%) | 58 (5.9%) |
| $7,500 to $9,999 | 0 (0.0%) | 46 (4.6%) |
| $10,000 to $12,499 | 27 (2.7%) | 41 (4.1%) |
| $12,500 to $14,999 | 56 (5.6%) | 96 (9.7%) |
| $15,000 to $17,499 | 1 (0.1%) | 32 (3.2%) |
| $17,500 to $19,999 | 21 (2.1%) | 22 (2.2%) |
| $20,000 to $22,499 | 64 (6.5%) | 23 (2.3%) |
| $22,500 to $24,999 | 83 (8.4%) | 7 (0.7%) |
| $25,000 to $29,999 | 27 (2.7%) | 13 (1.3%) |
| $30,000 to $34,999 | 93 (9.4%) | 99 (10.0%) |
| $35,000 to $39,999 | 28 (2.8%) | 19 (1.9%) |
| $40,000 to $44,999 | 55 (5.5%) | 47 (4.7%) |
| $45,000 to $49,999 | 92 (9.3%) | 8 (0.8%) |
| $50,000 to $54,999 | 0 (0.0%) | 46 (4.6%) |
| $55,000 to $64,999 | 16 (1.6%) | 62 (6.2%) |
| $65,000 to $74,999 | 102 (10.3%) | 64 (6.5%) |
| $75,000 to $99,999 | 168 (16.9%) | 123 (12.4%) |
| $100,000+ | 75 (7.5%) | 60 (6.0%) |
| Total | 993 (100.0%) | 992 (100.0%) |
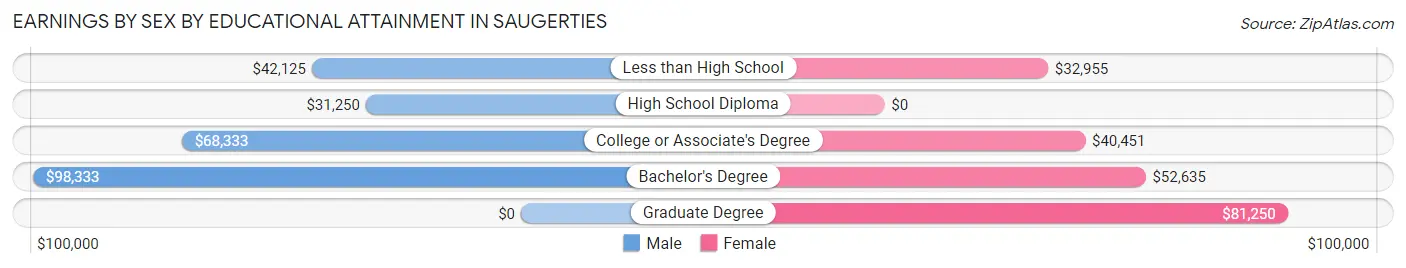
Earnings by Sex by Educational Attainment in Saugerties
Average earnings in Saugerties are $48,472 for men and $34,214 for women, a difference of 29.4%. Men with an educational attainment of bachelor's degree enjoy the highest average annual earnings of $98,333, while those with high school diploma education earn the least with $31,250. Women with an educational attainment of graduate degree earn the most with the average annual earnings of $81,250, while those with less than high school education have the smallest earnings of $32,955.
| Educational Attainment | Male Income | Female Income |
| Less than High School | $42,125 | $32,955 |
| High School Diploma | $31,250 | $0 |
| College or Associate's Degree | $68,333 | $40,451 |
| Bachelor's Degree | $98,333 | $52,635 |
| Graduate Degree | - | - |
| Total | $48,472 | $34,214 |
Family Income in Saugerties
Family Income Brackets in Saugerties
According to the Saugerties family income data, there are 169 families falling into the $100,000 to $149,999 income range, which is the most common income bracket and makes up 24.5% of all families. Conversely, the $10,000 to $14,999 income bracket is the least frequent group with only 3 families (0.4%) belonging to this category.
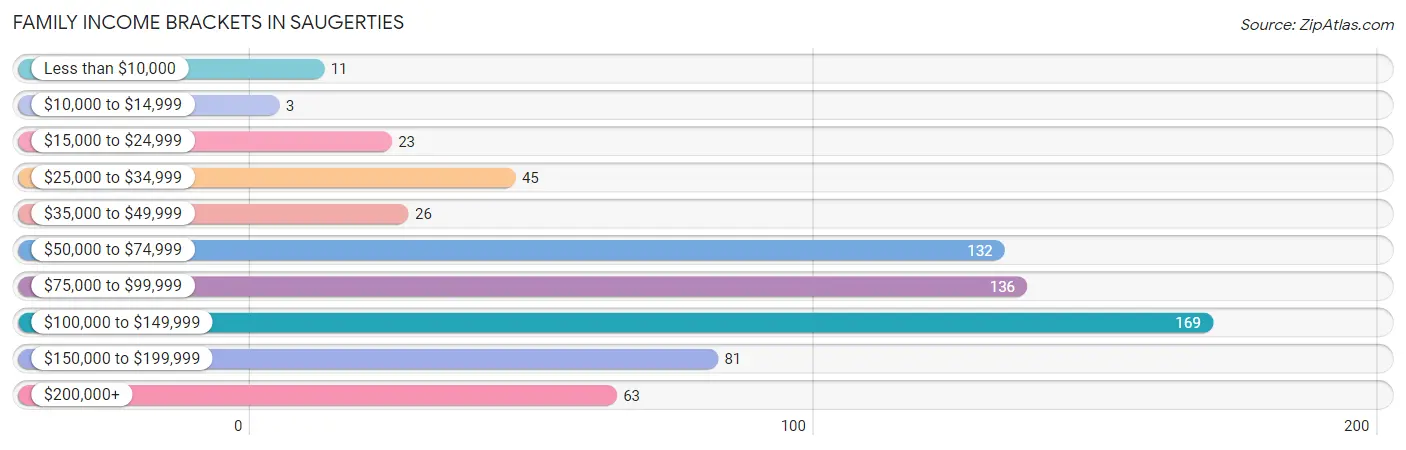
| Income Bracket | # Families | % Families |
| Less than $10,000 | 11 | 1.6% |
| $10,000 to $14,999 | 3 | 0.4% |
| $15,000 to $24,999 | 23 | 3.3% |
| $25,000 to $34,999 | 45 | 6.5% |
| $35,000 to $49,999 | 26 | 3.8% |
| $50,000 to $74,999 | 132 | 19.2% |
| $75,000 to $99,999 | 136 | 19.7% |
| $100,000 to $149,999 | 169 | 24.5% |
| $150,000 to $199,999 | 81 | 11.8% |
| $200,000+ | 63 | 9.1% |
Family Income by Famaliy Size in Saugerties
4-person families (158 | 22.9%) account for the highest median family income in Saugerties with $101,957 per family, while 2-person families (274 | 39.8%) have the highest median income of $39,286 per family member.
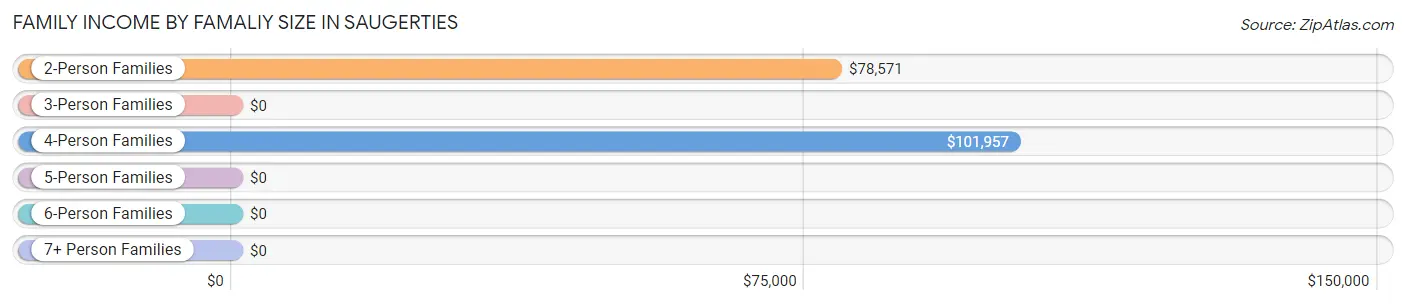
| Income Bracket | # Families | Median Income |
| 2-Person Families | 274 (39.8%) | $78,571 |
| 3-Person Families | 180 (26.1%) | $0 |
| 4-Person Families | 158 (22.9%) | $101,957 |
| 5-Person Families | 50 (7.3%) | $0 |
| 6-Person Families | 16 (2.3%) | $0 |
| 7+ Person Families | 11 (1.6%) | $0 |
| Total | 689 (100.0%) | $89,336 |
Family Income by Number of Earners in Saugerties
The median family income in Saugerties is $89,336, with families comprising 3+ earners (95) having the highest median family income of $135,938, while families with no earners (150) have the lowest median family income of $51,250, accounting for 13.8% and 21.8% of families, respectively.
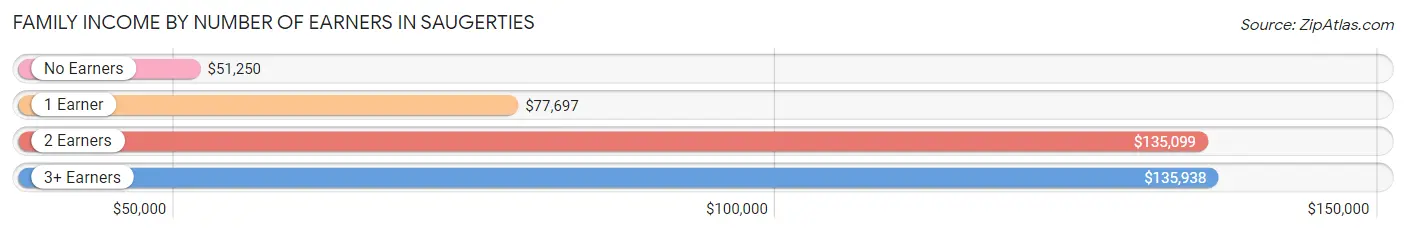
| Number of Earners | # Families | Median Income |
| No Earners | 150 (21.8%) | $51,250 |
| 1 Earner | 127 (18.4%) | $77,697 |
| 2 Earners | 317 (46.0%) | $135,099 |
| 3+ Earners | 95 (13.8%) | $135,938 |
| Total | 689 (100.0%) | $89,336 |
Household Income in Saugerties
Household Income Brackets in Saugerties
With 300 households falling in the category, the $15,000 to $24,999 income range is the most frequent in Saugerties, accounting for 16.4% of all households. In contrast, only 71 households (3.9%) fall into the $150,000 to $199,999 income bracket, making it the least populous group.
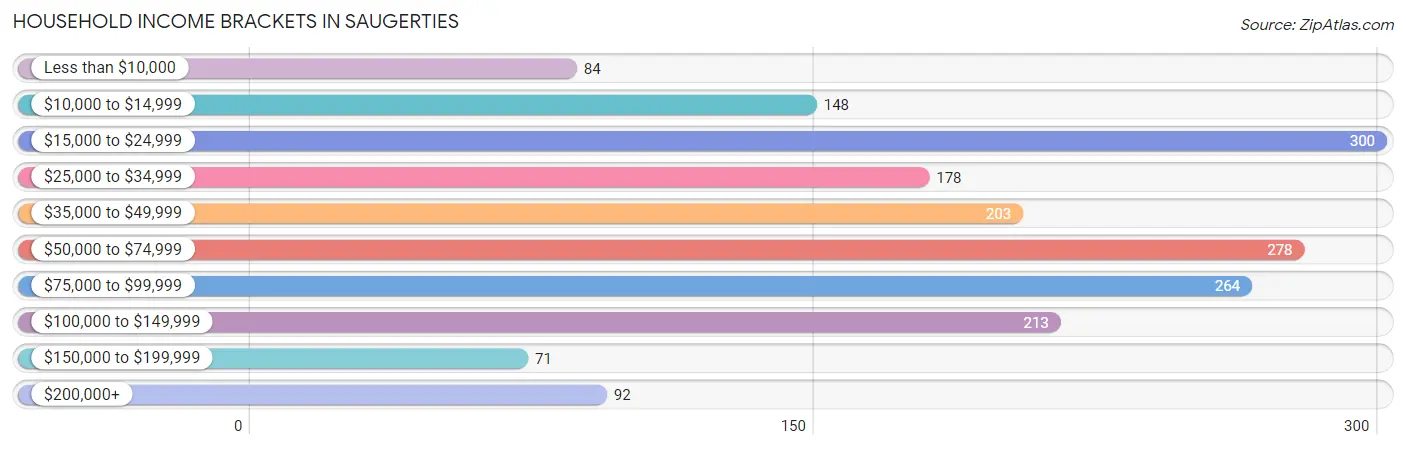
| Income Bracket | # Households | % Households |
| Less than $10,000 | 84 | 4.6% |
| $10,000 to $14,999 | 148 | 8.1% |
| $15,000 to $24,999 | 300 | 16.4% |
| $25,000 to $34,999 | 178 | 9.7% |
| $35,000 to $49,999 | 203 | 11.1% |
| $50,000 to $74,999 | 278 | 15.2% |
| $75,000 to $99,999 | 264 | 14.4% |
| $100,000 to $149,999 | 213 | 11.6% |
| $150,000 to $199,999 | 71 | 3.9% |
| $200,000+ | 92 | 5.0% |
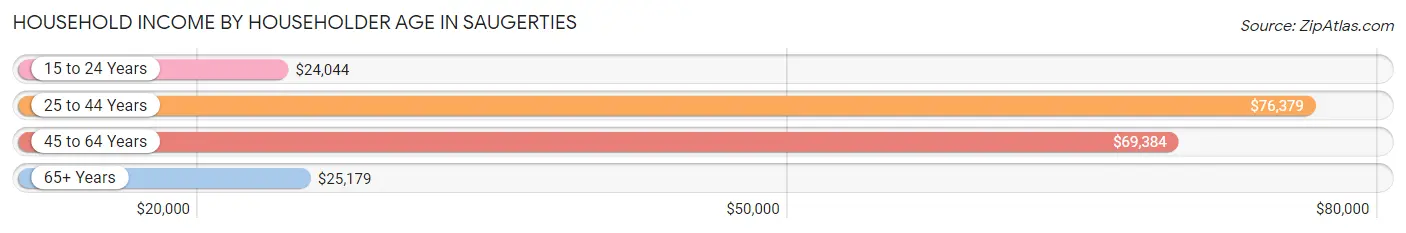
Household Income by Householder Age in Saugerties
The median household income in Saugerties is $52,703, with the highest median household income of $76,379 found in the 25 to 44 years age bracket for the primary householder. A total of 452 households (24.7%) fall into this category. Meanwhile, the 15 to 24 years age bracket for the primary householder has the lowest median household income of $24,044, with 48 households (2.6%) in this group.
| Income Bracket | # Households | Median Income |
| 15 to 24 Years | 48 (2.6%) | $24,044 |
| 25 to 44 Years | 452 (24.7%) | $76,379 |
| 45 to 64 Years | 605 (33.0%) | $69,384 |
| 65+ Years | 727 (39.7%) | $25,179 |
| Total | 1,832 (100.0%) | $52,703 |
Poverty in Saugerties
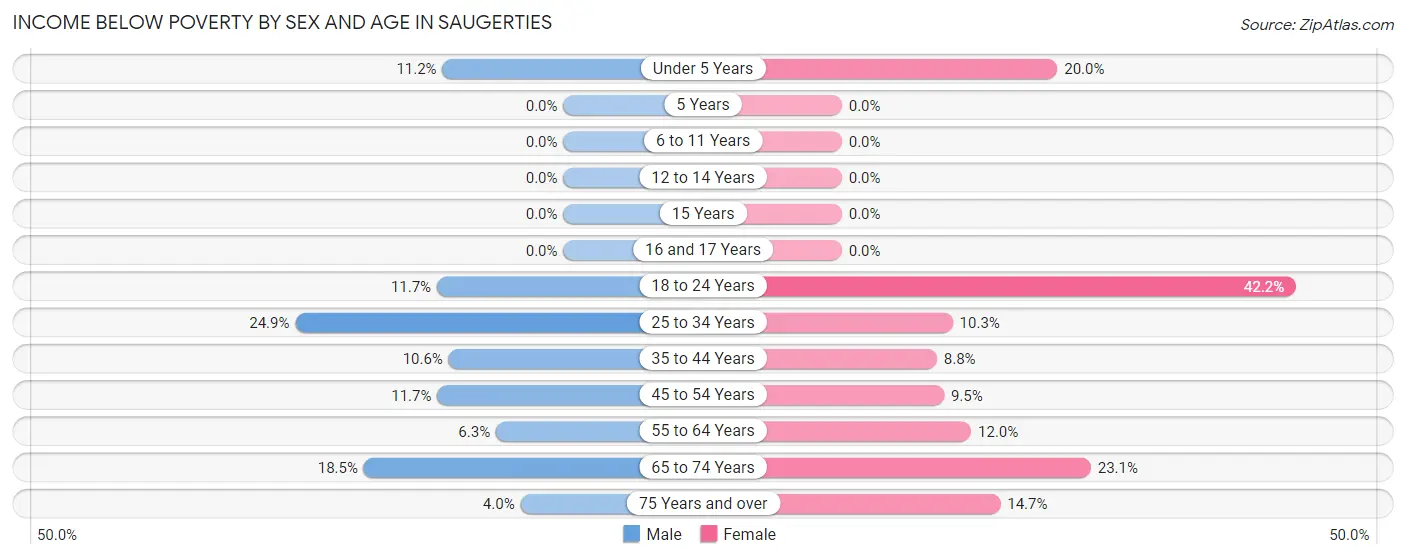
Income Below Poverty by Sex and Age in Saugerties
With 11.5% poverty level for males and 11.7% for females among the residents of Saugerties, 25 to 34 year old males and 18 to 24 year old females are the most vulnerable to poverty, with 51 males (24.9%) and 43 females (42.2%) in their respective age groups living below the poverty level.
| Age Bracket | Male | Female |
| Under 5 Years | 11 (11.2%) | 9 (20.0%) |
| 5 Years | 0 (0.0%) | 0 (0.0%) |
| 6 to 11 Years | 0 (0.0%) | 0 (0.0%) |
| 12 to 14 Years | 0 (0.0%) | 0 (0.0%) |
| 15 Years | 0 (0.0%) | 0 (0.0%) |
| 16 and 17 Years | 0 (0.0%) | 0 (0.0%) |
| 18 to 24 Years | 19 (11.7%) | 43 (42.2%) |
| 25 to 34 Years | 51 (24.9%) | 18 (10.3%) |
| 35 to 44 Years | 20 (10.6%) | 27 (8.8%) |
| 45 to 54 Years | 33 (11.7%) | 20 (9.5%) |
| 55 to 64 Years | 12 (6.2%) | 39 (12.0%) |
| 65 to 74 Years | 45 (18.5%) | 58 (23.1%) |
| 75 Years and over | 8 (4.0%) | 35 (14.7%) |
| Total | 199 (11.5%) | 249 (11.7%) |
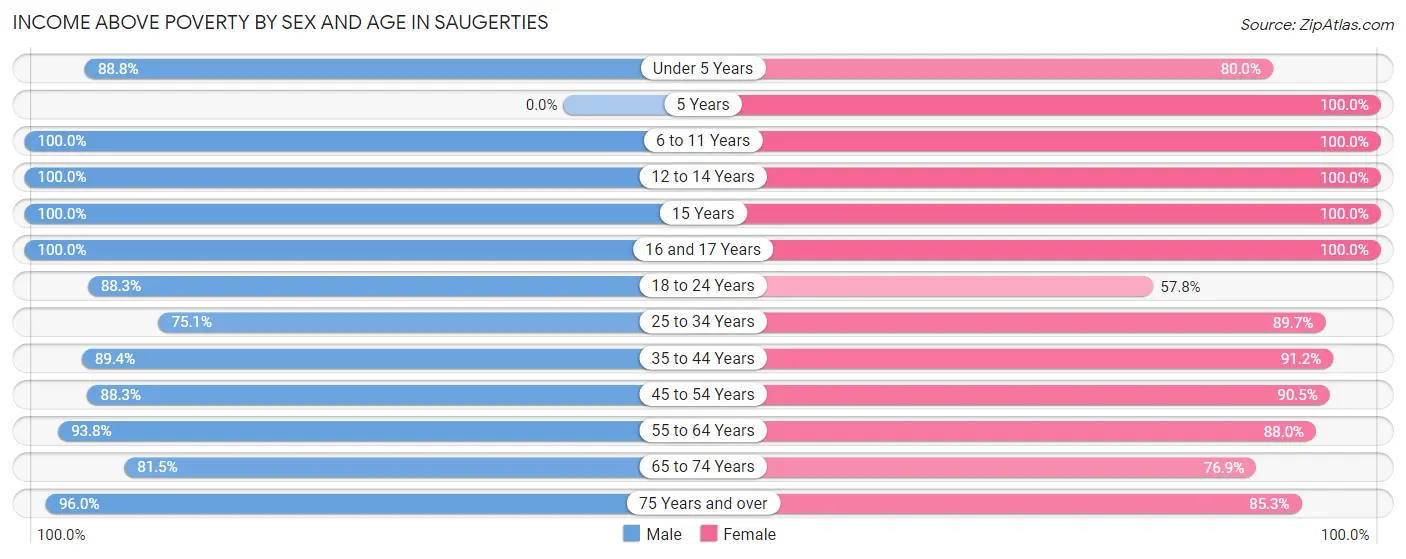
Income Above Poverty by Sex and Age in Saugerties
According to the poverty statistics in Saugerties, males aged 6 to 11 years and females aged 5 years are the age groups that are most secure financially, with 100.0% of males and 100.0% of females in these age groups living above the poverty line.
| Age Bracket | Male | Female |
| Under 5 Years | 87 (88.8%) | 36 (80.0%) |
| 5 Years | 0 (0.0%) | 38 (100.0%) |
| 6 to 11 Years | 63 (100.0%) | 86 (100.0%) |
| 12 to 14 Years | 51 (100.0%) | 152 (100.0%) |
| 15 Years | 17 (100.0%) | 115 (100.0%) |
| 16 and 17 Years | 36 (100.0%) | 85 (100.0%) |
| 18 to 24 Years | 143 (88.3%) | 59 (57.8%) |
| 25 to 34 Years | 154 (75.1%) | 157 (89.7%) |
| 35 to 44 Years | 168 (89.4%) | 279 (91.2%) |
| 45 to 54 Years | 249 (88.3%) | 191 (90.5%) |
| 55 to 64 Years | 180 (93.8%) | 286 (88.0%) |
| 65 to 74 Years | 198 (81.5%) | 193 (76.9%) |
| 75 Years and over | 193 (96.0%) | 203 (85.3%) |
| Total | 1,539 (88.5%) | 1,880 (88.3%) |
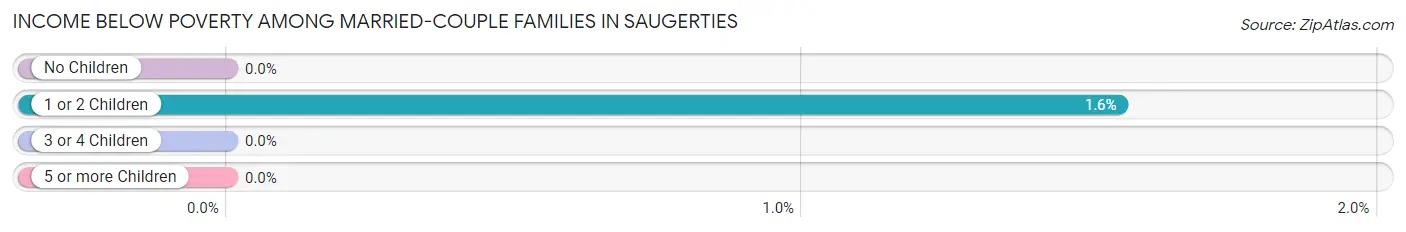
Income Below Poverty Among Married-Couple Families in Saugerties
The poverty statistics for married-couple families in Saugerties show that 0.6% or 3 of the total 485 families live below the poverty line. Families with 1 or 2 children have the highest poverty rate of 1.5%, comprising of 3 families. On the other hand, families with no children have the lowest poverty rate of 0.0%, which includes 0 families.
| Children | Above Poverty | Below Poverty |
| No Children | 230 (100.0%) | 0 (0.0%) |
| 1 or 2 Children | 191 (98.5%) | 3 (1.5%) |
| 3 or 4 Children | 50 (100.0%) | 0 (0.0%) |
| 5 or more Children | 11 (100.0%) | 0 (0.0%) |
| Total | 482 (99.4%) | 3 (0.6%) |
Income Below Poverty Among Single-Parent Households in Saugerties
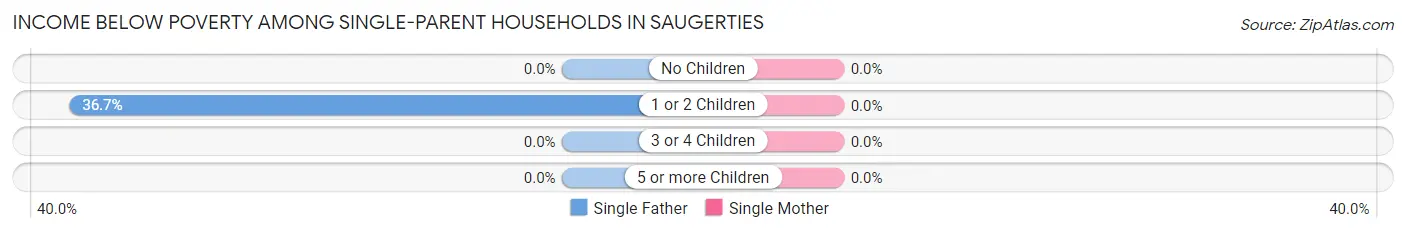
| Children | Single Father | Single Mother |
| No Children | 0 (0.0%) | 0 (0.0%) |
| 1 or 2 Children | 11 (36.7%) | 0 (0.0%) |
| 3 or 4 Children | 0 (0.0%) | 0 (0.0%) |
| 5 or more Children | 0 (0.0%) | 0 (0.0%) |
| Total | 11 (20.4%) | 0 (0.0%) |
Income Below Poverty Among Married-Couple vs Single-Parent Households in Saugerties
The poverty data for Saugerties shows that 3 of the married-couple family households (0.6%) and 11 of the single-parent households (5.4%) are living below the poverty level. Within the married-couple family households, those with 1 or 2 children have the highest poverty rate, with 3 households (1.5%) falling below the poverty line. Among the single-parent households, those with 1 or 2 children have the highest poverty rate, with 11 household (15.5%) living below poverty.
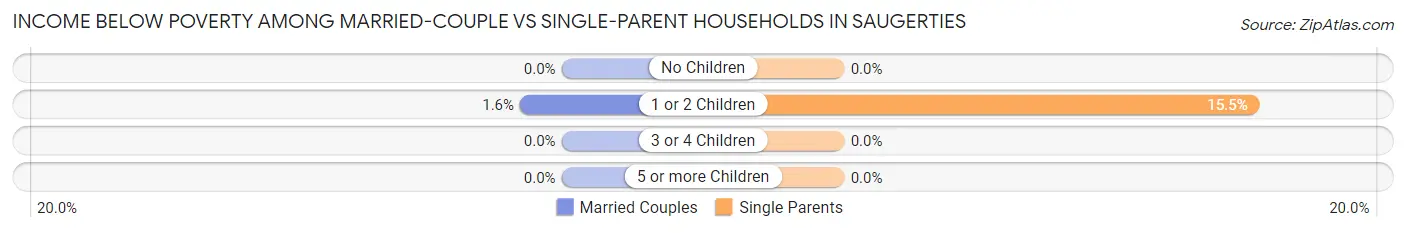
| Children | Married-Couple Families | Single-Parent Households |
| No Children | 0 (0.0%) | 0 (0.0%) |
| 1 or 2 Children | 3 (1.5%) | 11 (15.5%) |
| 3 or 4 Children | 0 (0.0%) | 0 (0.0%) |
| 5 or more Children | 0 (0.0%) | 0 (0.0%) |
| Total | 3 (0.6%) | 11 (5.4%) |
Race in Saugerties
The most populous races in Saugerties are White / Caucasian (3,363 | 86.4%), Two or more Races (415 | 10.7%), and Hispanic or Latino (232 | 6.0%).
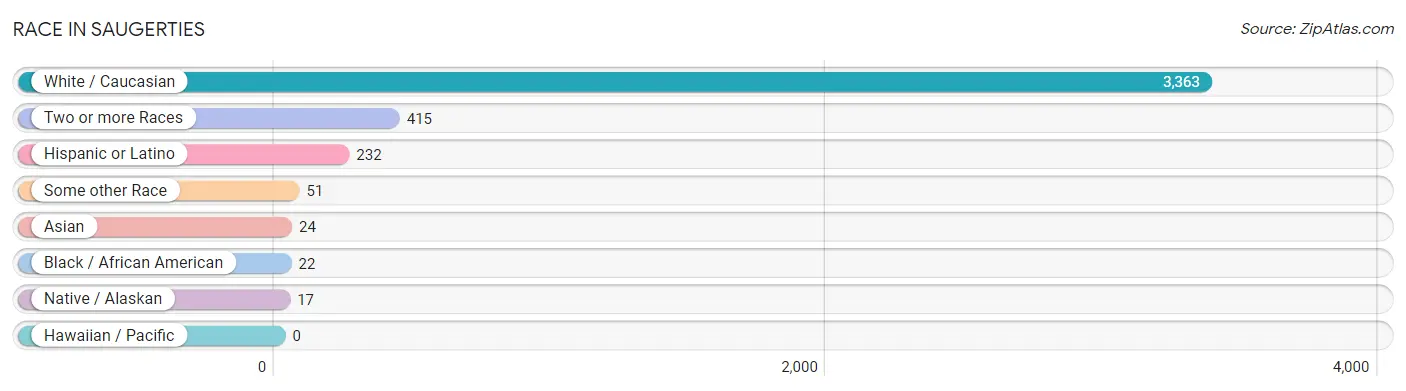
| Race | # Population | % Population |
| Asian | 24 | 0.6% |
| Black / African American | 22 | 0.6% |
| Hawaiian / Pacific | 0 | 0.0% |
| Hispanic or Latino | 232 | 6.0% |
| Native / Alaskan | 17 | 0.4% |
| White / Caucasian | 3,363 | 86.4% |
| Two or more Races | 415 | 10.7% |
| Some other Race | 51 | 1.3% |
| Total | 3,892 | 100.0% |
Ancestry in Saugerties
The most populous ancestries reported in Saugerties are German (899 | 23.1%), Irish (894 | 23.0%), Italian (677 | 17.4%), English (420 | 10.8%), and Polish (234 | 6.0%), together accounting for 80.3% of all Saugerties residents.
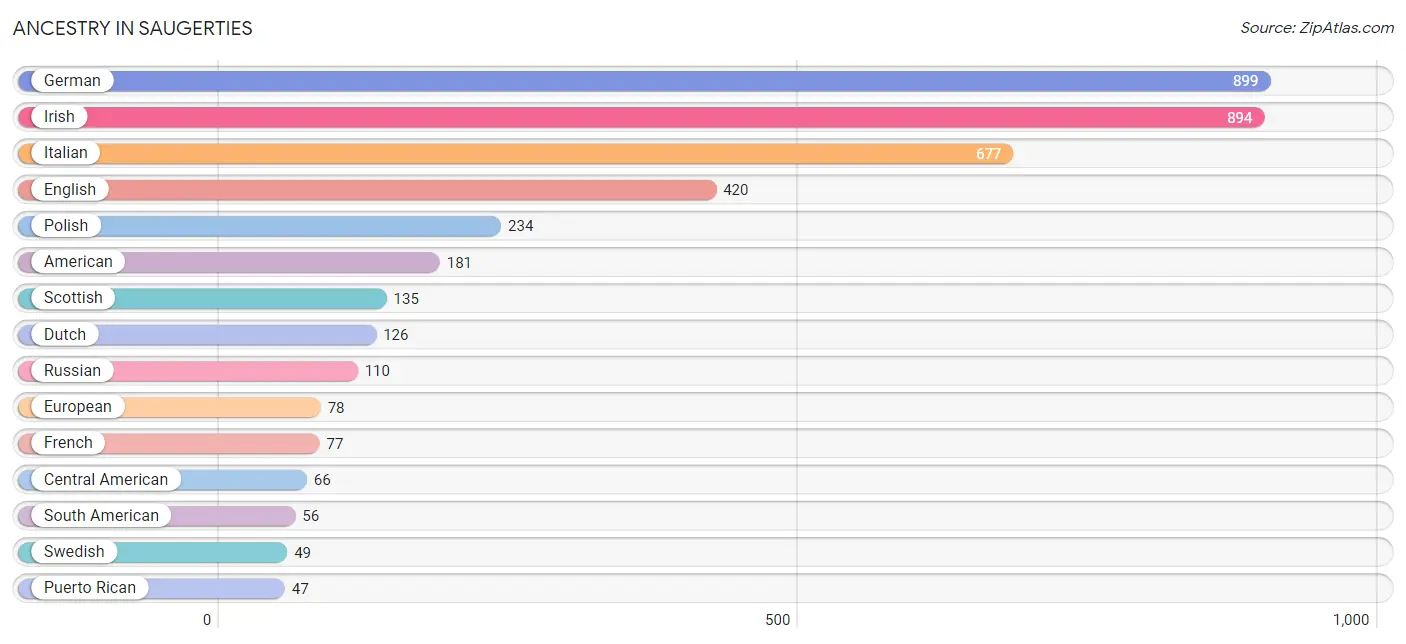
| Ancestry | # Population | % Population |
| American | 181 | 4.6% |
| Arab | 14 | 0.4% |
| Austrian | 18 | 0.5% |
| Bhutanese | 11 | 0.3% |
| Central American | 66 | 1.7% |
| Colombian | 29 | 0.7% |
| Croatian | 19 | 0.5% |
| Czech | 11 | 0.3% |
| Delaware | 14 | 0.4% |
| Dominican | 34 | 0.9% |
| Dutch | 126 | 3.2% |
| English | 420 | 10.8% |
| European | 78 | 2.0% |
| Filipino | 12 | 0.3% |
| French | 77 | 2.0% |
| French Canadian | 15 | 0.4% |
| German | 899 | 23.1% |
| Guatemalan | 36 | 0.9% |
| Hungarian | 31 | 0.8% |
| Indian (Asian) | 10 | 0.3% |
| Irish | 894 | 23.0% |
| Iroquois | 24 | 0.6% |
| Italian | 677 | 17.4% |
| Jamaican | 37 | 0.9% |
| Mexican | 18 | 0.5% |
| Norwegian | 22 | 0.6% |
| Polish | 234 | 6.0% |
| Portuguese | 15 | 0.4% |
| Puerto Rican | 47 | 1.2% |
| Russian | 110 | 2.8% |
| Salvadoran | 30 | 0.8% |
| Scottish | 135 | 3.5% |
| South American | 56 | 1.4% |
| Spaniard | 11 | 0.3% |
| Swedish | 49 | 1.3% |
| Swiss | 8 | 0.2% |
| Thai | 27 | 0.7% |
| Venezuelan | 27 | 0.7% |
| Welsh | 8 | 0.2% | View All 39 Rows |
Immigrants in Saugerties
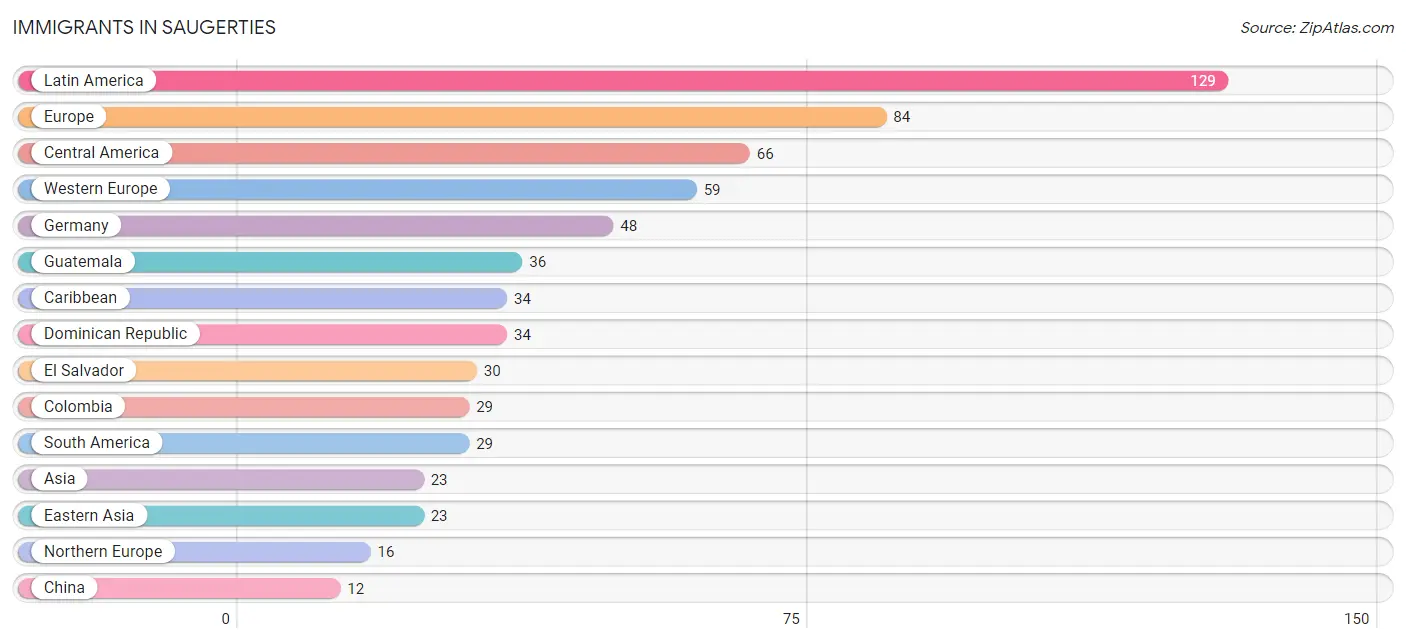
The most numerous immigrant groups reported in Saugerties came from Latin America (129 | 3.3%), Europe (84 | 2.2%), Central America (66 | 1.7%), Western Europe (59 | 1.5%), and Germany (48 | 1.2%), together accounting for 9.9% of all Saugerties residents.
| Immigration Origin | # Population | % Population |
| Asia | 23 | 0.6% |
| Belgium | 11 | 0.3% |
| Caribbean | 34 | 0.9% |
| Central America | 66 | 1.7% |
| China | 12 | 0.3% |
| Colombia | 29 | 0.7% |
| Dominican Republic | 34 | 0.9% |
| Eastern Asia | 23 | 0.6% |
| Eastern Europe | 9 | 0.2% |
| El Salvador | 30 | 0.8% |
| Europe | 84 | 2.2% |
| Germany | 48 | 1.2% |
| Guatemala | 36 | 0.9% |
| Hong Kong | 9 | 0.2% |
| Hungary | 9 | 0.2% |
| Japan | 11 | 0.3% |
| Latin America | 129 | 3.3% |
| Northern Europe | 16 | 0.4% |
| South America | 29 | 0.7% |
| Taiwan | 3 | 0.1% |
| Western Europe | 59 | 1.5% | View All 21 Rows |
Sex and Age in Saugerties
Sex and Age in Saugerties
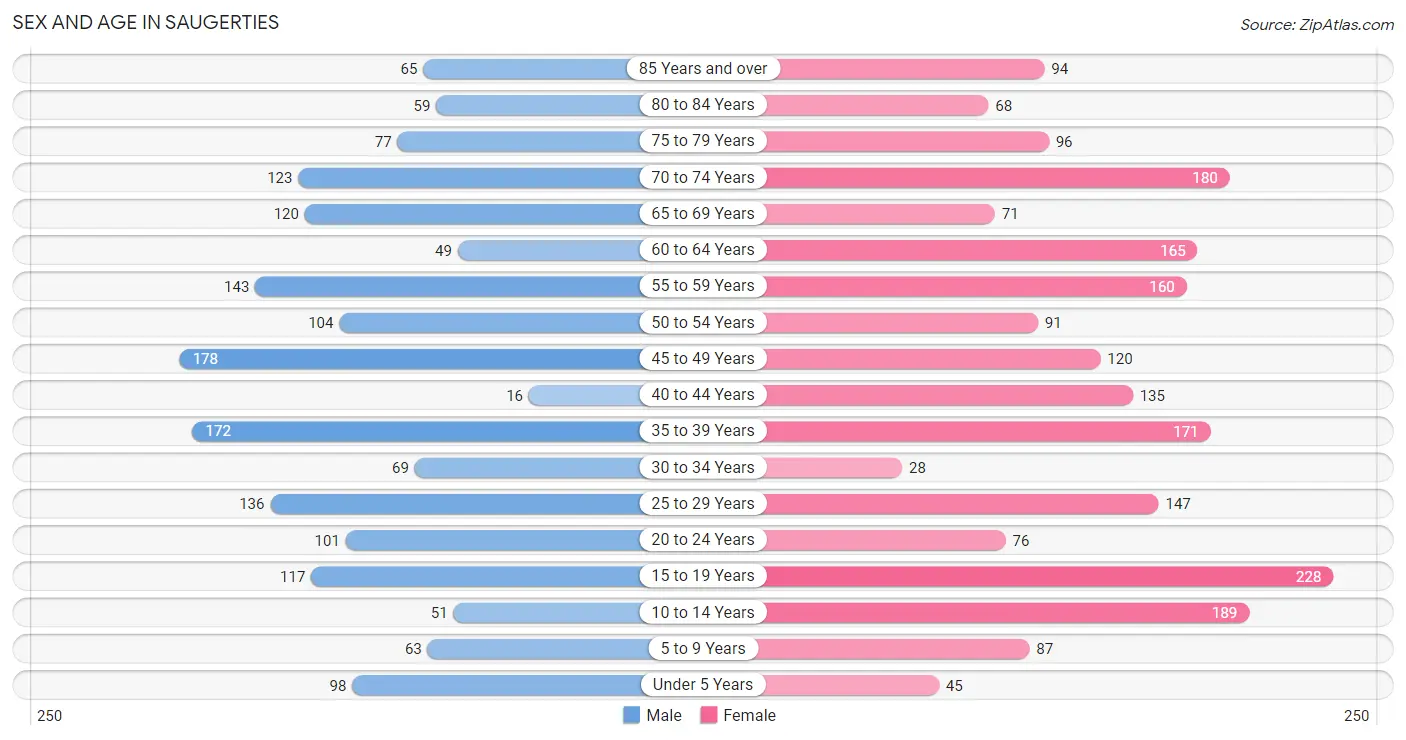
The most populous age groups in Saugerties are 45 to 49 Years (178 | 10.2%) for men and 15 to 19 Years (228 | 10.6%) for women.
| Age Bracket | Male | Female |
| Under 5 Years | 98 (5.6%) | 45 (2.1%) |
| 5 to 9 Years | 63 (3.6%) | 87 (4.0%) |
| 10 to 14 Years | 51 (2.9%) | 189 (8.8%) |
| 15 to 19 Years | 117 (6.7%) | 228 (10.6%) |
| 20 to 24 Years | 101 (5.8%) | 76 (3.5%) |
| 25 to 29 Years | 136 (7.8%) | 147 (6.8%) |
| 30 to 34 Years | 69 (4.0%) | 28 (1.3%) |
| 35 to 39 Years | 172 (9.9%) | 171 (8.0%) |
| 40 to 44 Years | 16 (0.9%) | 135 (6.3%) |
| 45 to 49 Years | 178 (10.2%) | 120 (5.6%) |
| 50 to 54 Years | 104 (6.0%) | 91 (4.2%) |
| 55 to 59 Years | 143 (8.2%) | 160 (7.4%) |
| 60 to 64 Years | 49 (2.8%) | 165 (7.7%) |
| 65 to 69 Years | 120 (6.9%) | 71 (3.3%) |
| 70 to 74 Years | 123 (7.1%) | 180 (8.4%) |
| 75 to 79 Years | 77 (4.4%) | 96 (4.5%) |
| 80 to 84 Years | 59 (3.4%) | 68 (3.2%) |
| 85 Years and over | 65 (3.7%) | 94 (4.4%) |
| Total | 1,741 (100.0%) | 2,151 (100.0%) |
Families and Households in Saugerties
Median Family Size in Saugerties
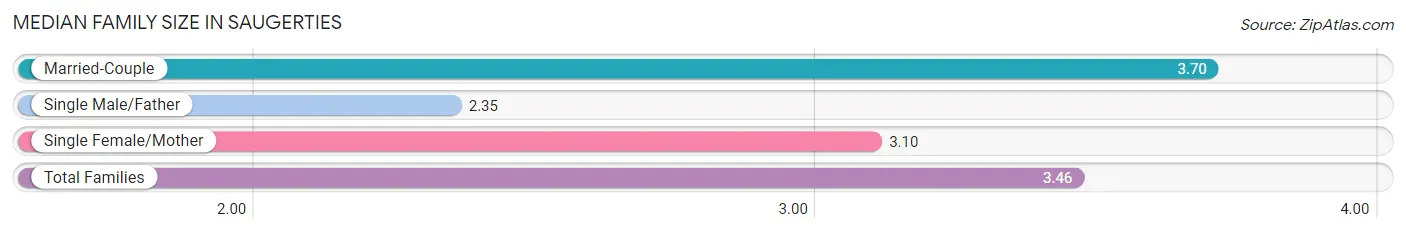
The median family size in Saugerties is 3.46 persons per family, with married-couple families (485 | 70.4%) accounting for the largest median family size of 3.7 persons per family. On the other hand, single male/father families (54 | 7.8%) represent the smallest median family size with 2.35 persons per family.
| Family Type | # Families | Family Size |
| Married-Couple | 485 (70.4%) | 3.70 |
| Single Male/Father | 54 (7.8%) | 2.35 |
| Single Female/Mother | 150 (21.8%) | 3.10 |
| Total Families | 689 (100.0%) | 3.46 |
Median Household Size in Saugerties
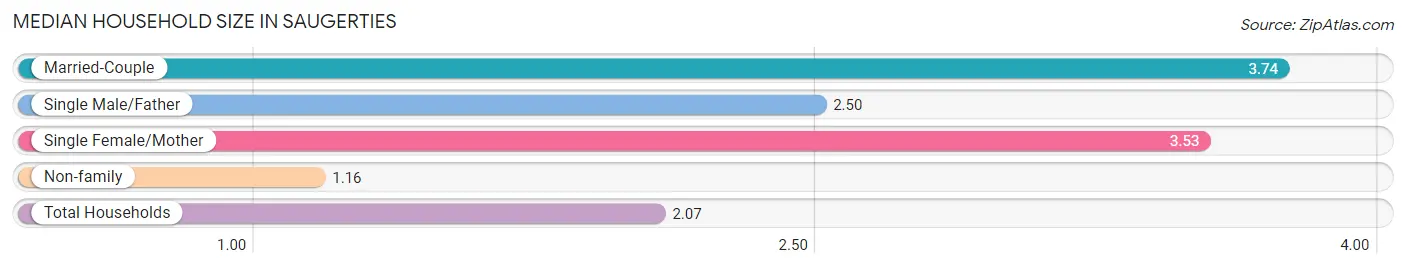
The median household size in Saugerties is 2.07 persons per household, with married-couple households (485 | 26.5%) accounting for the largest median household size of 3.74 persons per household. non-family households (1,143 | 62.4%) represent the smallest median household size with 1.16 persons per household.
| Household Type | # Households | Household Size |
| Married-Couple | 485 (26.5%) | 3.74 |
| Single Male/Father | 54 (2.9%) | 2.50 |
| Single Female/Mother | 150 (8.2%) | 3.53 |
| Non-family | 1,143 (62.4%) | 1.16 |
| Total Households | 1,832 (100.0%) | 2.07 |
Household Size by Marriage Status in Saugerties
Out of a total of 1,832 households in Saugerties, 689 (37.6%) are family households, while 1,143 (62.4%) are nonfamily households. The most numerous type of family households are 2-person households, comprising 266, and the most common type of nonfamily households are 1-person households, comprising 967.
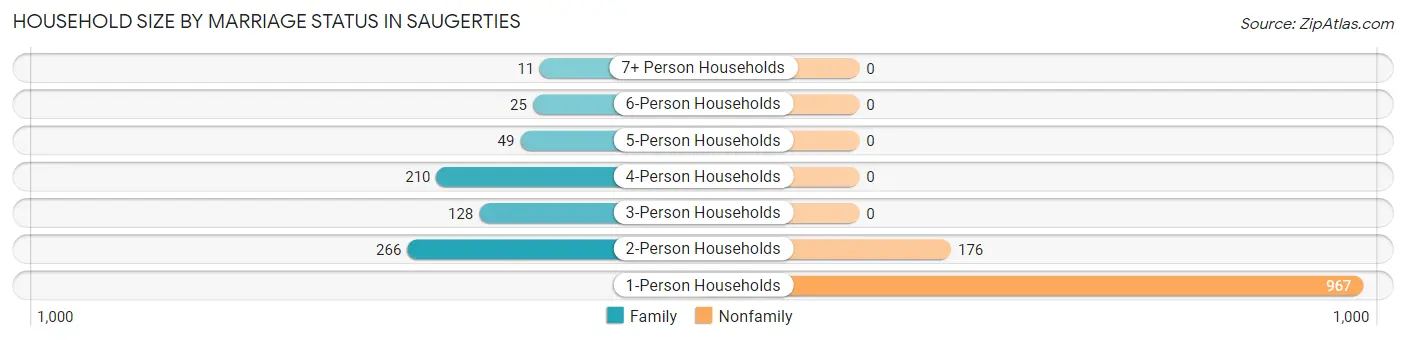
| Household Size | Family Households | Nonfamily Households |
| 1-Person Households | - | 967 (52.8%) |
| 2-Person Households | 266 (14.5%) | 176 (9.6%) |
| 3-Person Households | 128 (7.0%) | 0 (0.0%) |
| 4-Person Households | 210 (11.5%) | 0 (0.0%) |
| 5-Person Households | 49 (2.7%) | 0 (0.0%) |
| 6-Person Households | 25 (1.4%) | 0 (0.0%) |
| 7+ Person Households | 11 (0.6%) | 0 (0.0%) |
| Total | 689 (37.6%) | 1,143 (62.4%) |
Female Fertility in Saugerties
Fertility by Age in Saugerties
Average fertility rate in Saugerties is 74.0 births per 1,000 women. Women in the age bracket of 35 to 50 years have the highest fertility rate with 100.0 births per 1,000 women. Women in the age bracket of 35 to 50 years acount for 64.7% of all women with births.
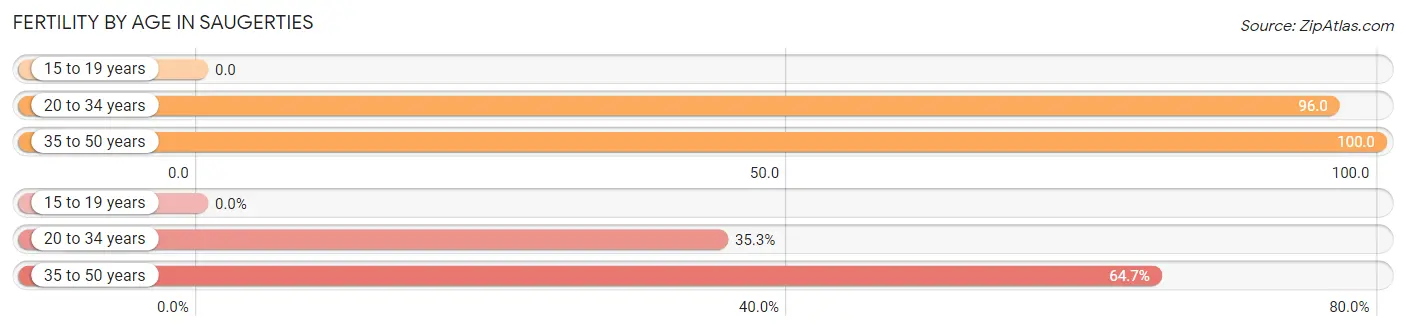
| Age Bracket | Women with Births | Births / 1,000 Women |
| 15 to 19 years | 0 (0.0%) | 0.0 |
| 20 to 34 years | 24 (35.3%) | 96.0 |
| 35 to 50 years | 44 (64.7%) | 100.0 |
| Total | 68 (100.0%) | 74.0 |
Fertility by Age by Marriage Status in Saugerties
88.2% of women with births (68) in Saugerties are married. The highest percentage of unmarried women with births falls into 20 to 34 years age bracket with 33.3% of them unmarried at the time of birth, while the lowest percentage of unmarried women with births belong to 35 to 50 years age bracket with 0.0% of them unmarried.
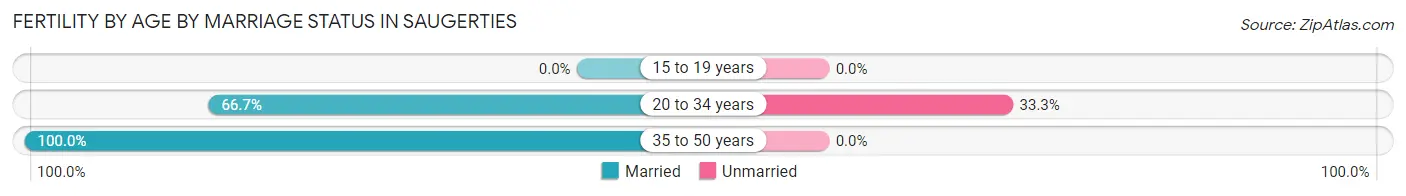
| Age Bracket | Married | Unmarried |
| 15 to 19 years | 0 (0.0%) | 0 (0.0%) |
| 20 to 34 years | 16 (66.7%) | 8 (33.3%) |
| 35 to 50 years | 44 (100.0%) | 0 (0.0%) |
| Total | 60 (88.2%) | 8 (11.8%) |
Fertility by Education in Saugerties
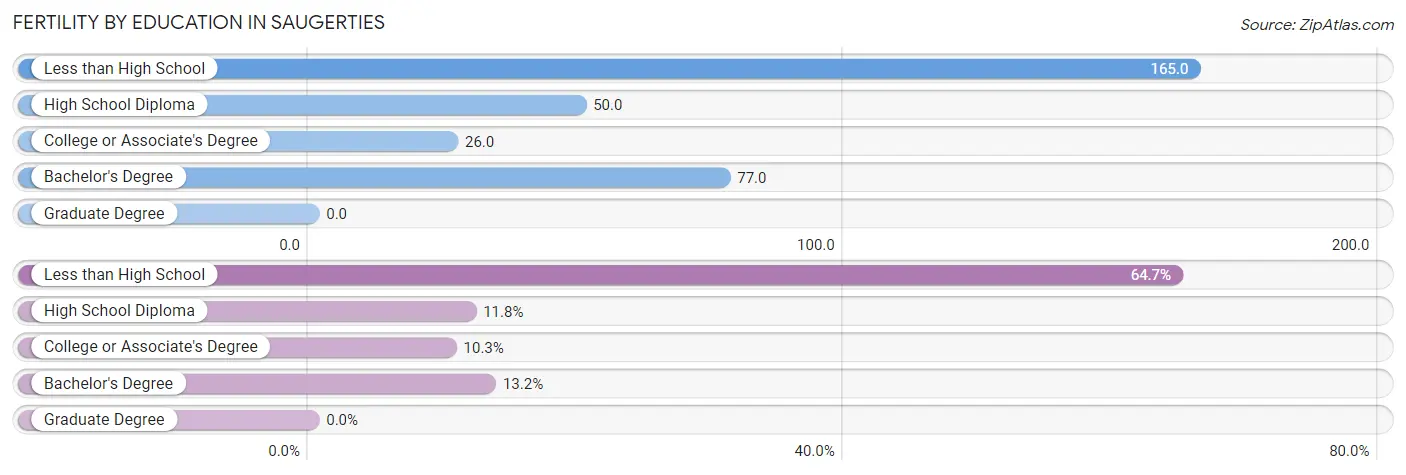
| Educational Attainment | Women with Births | Births / 1,000 Women |
| Less than High School | 44 (64.7%) | 165.0 |
| High School Diploma | 8 (11.8%) | 50.0 |
| College or Associate's Degree | 7 (10.3%) | 26.0 |
| Bachelor's Degree | 9 (13.2%) | 77.0 |
| Graduate Degree | 0 (0.0%) | 0.0 |
| Total | 68 (100.0%) | 74.0 |
Fertility by Education by Marriage Status in Saugerties
11.8% of women with births in Saugerties are unmarried. Women with the educational attainment of less than high school are most likely to be married with 100.0% of them married at childbirth, while women with the educational attainment of high school diploma are least likely to be married with 100.0% of them unmarried at childbirth.
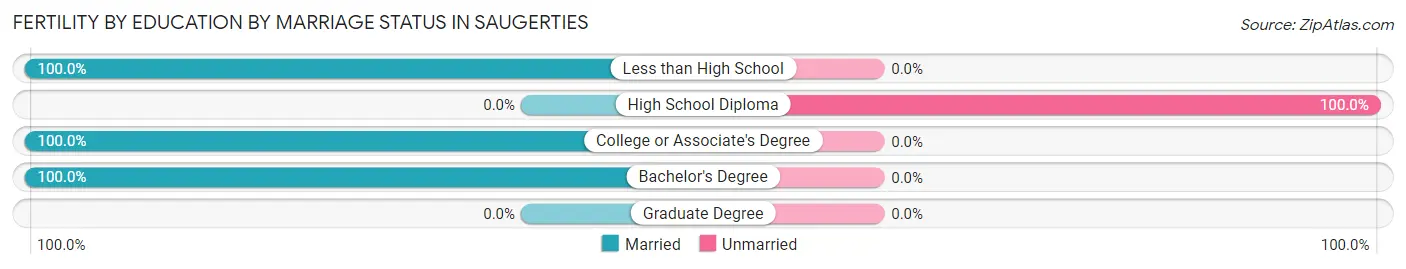
| Educational Attainment | Married | Unmarried |
| Less than High School | 44 (100.0%) | 0 (0.0%) |
| High School Diploma | 0 (0.0%) | 8 (100.0%) |
| College or Associate's Degree | 7 (100.0%) | 0 (0.0%) |
| Bachelor's Degree | 9 (100.0%) | 0 (0.0%) |
| Graduate Degree | 0 (0.0%) | 0 (0.0%) |
| Total | 60 (88.2%) | 8 (11.8%) |
Employment Characteristics in Saugerties
Employment by Class of Employer in Saugerties
Among the 1,761 employed individuals in Saugerties, private company employees (1,055 | 59.9%), not-for-profit organizations (232 | 13.2%), and local government employees (146 | 8.3%) make up the most common classes of employment.
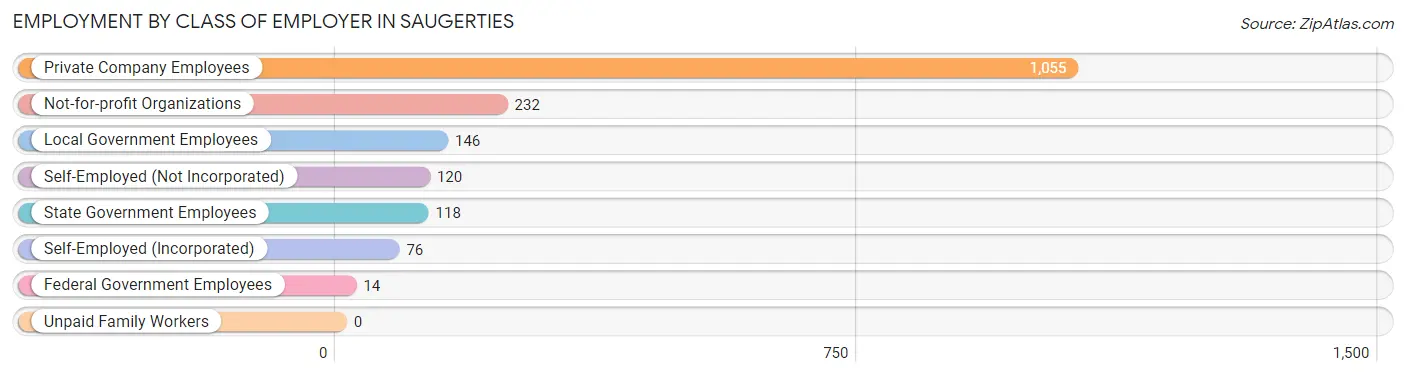
| Employer Class | # Employees | % Employees |
| Private Company Employees | 1,055 | 59.9% |
| Self-Employed (Incorporated) | 76 | 4.3% |
| Self-Employed (Not Incorporated) | 120 | 6.8% |
| Not-for-profit Organizations | 232 | 13.2% |
| Local Government Employees | 146 | 8.3% |
| State Government Employees | 118 | 6.7% |
| Federal Government Employees | 14 | 0.8% |
| Unpaid Family Workers | 0 | 0.0% |
| Total | 1,761 | 100.0% |
Employment Status by Age in Saugerties
According to the labor force statistics for Saugerties, out of the total population over 16 years of age (3,227), 59.2% or 1,910 individuals are in the labor force, with 3.4% or 65 of them unemployed. The age group with the highest labor force participation rate is 30 to 34 years, with 96.9% or 94 individuals in the labor force. Within the labor force, the 45 to 54 years age range has the highest percentage of unemployed individuals, with 9.8% or 39 of them being unemployed.
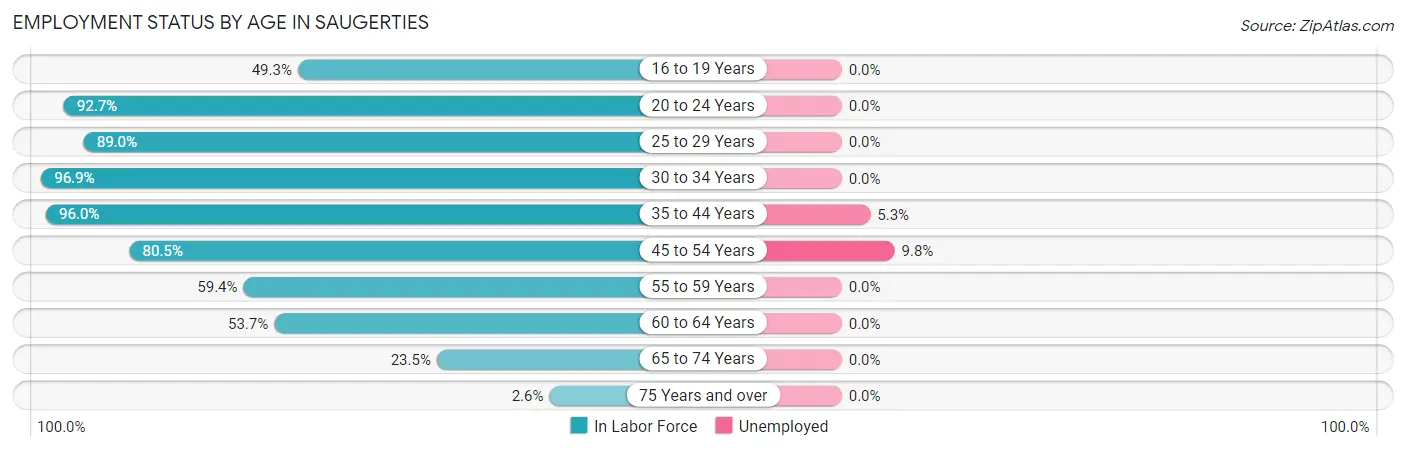
| Age Bracket | In Labor Force | Unemployed |
| 16 to 19 Years | 105 (49.3%) | 0 (0.0%) |
| 20 to 24 Years | 164 (92.7%) | 0 (0.0%) |
| 25 to 29 Years | 252 (89.0%) | 0 (0.0%) |
| 30 to 34 Years | 94 (96.9%) | 0 (0.0%) |
| 35 to 44 Years | 474 (96.0%) | 25 (5.3%) |
| 45 to 54 Years | 397 (80.5%) | 39 (9.8%) |
| 55 to 59 Years | 180 (59.4%) | 0 (0.0%) |
| 60 to 64 Years | 115 (53.7%) | 0 (0.0%) |
| 65 to 74 Years | 116 (23.5%) | 0 (0.0%) |
| 75 Years and over | 12 (2.6%) | 0 (0.0%) |
| Total | 1,910 (59.2%) | 65 (3.4%) |
Employment Status by Educational Attainment in Saugerties
According to labor force statistics for Saugerties, 80.3% of individuals (1,513) out of the total population between 25 and 64 years of age (1,884) are in the labor force, with 4.2% or 64 of them being unemployed. The group with the highest labor force participation rate are those with the educational attainment of bachelor's degree or higher, with 90.9% or 437 individuals in the labor force. Within the labor force, individuals with high school diploma education have the highest percentage of unemployment, with 11.6% or 33 of them being unemployed.
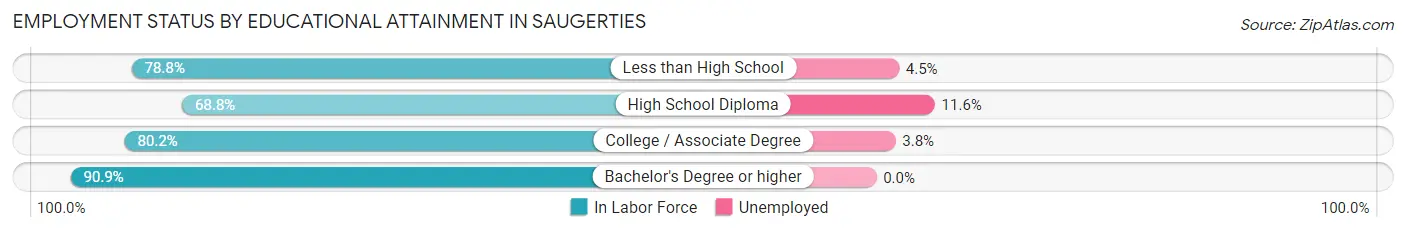
| Educational Attainment | In Labor Force | Unemployed |
| Less than High School | 178 (78.8%) | 10 (4.5%) |
| High School Diploma | 284 (68.8%) | 48 (11.6%) |
| College / Associate Degree | 613 (80.2%) | 29 (3.8%) |
| Bachelor's Degree or higher | 437 (90.9%) | 0 (0.0%) |
| Total | 1,513 (80.3%) | 79 (4.2%) |
Employment Occupations by Sex in Saugerties
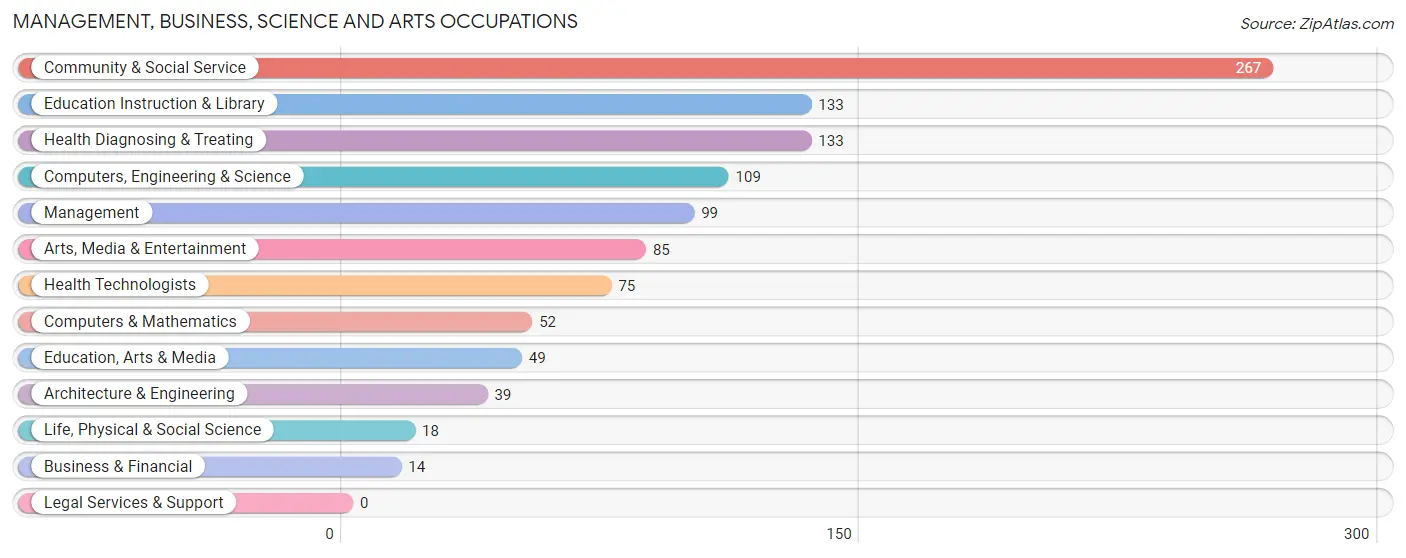
Management, Business, Science and Arts Occupations
The most common Management, Business, Science and Arts occupations in Saugerties are Community & Social Service (267 | 14.5%), Education Instruction & Library (133 | 7.2%), Health Diagnosing & Treating (133 | 7.2%), Computers, Engineering & Science (109 | 5.9%), and Management (99 | 5.4%).
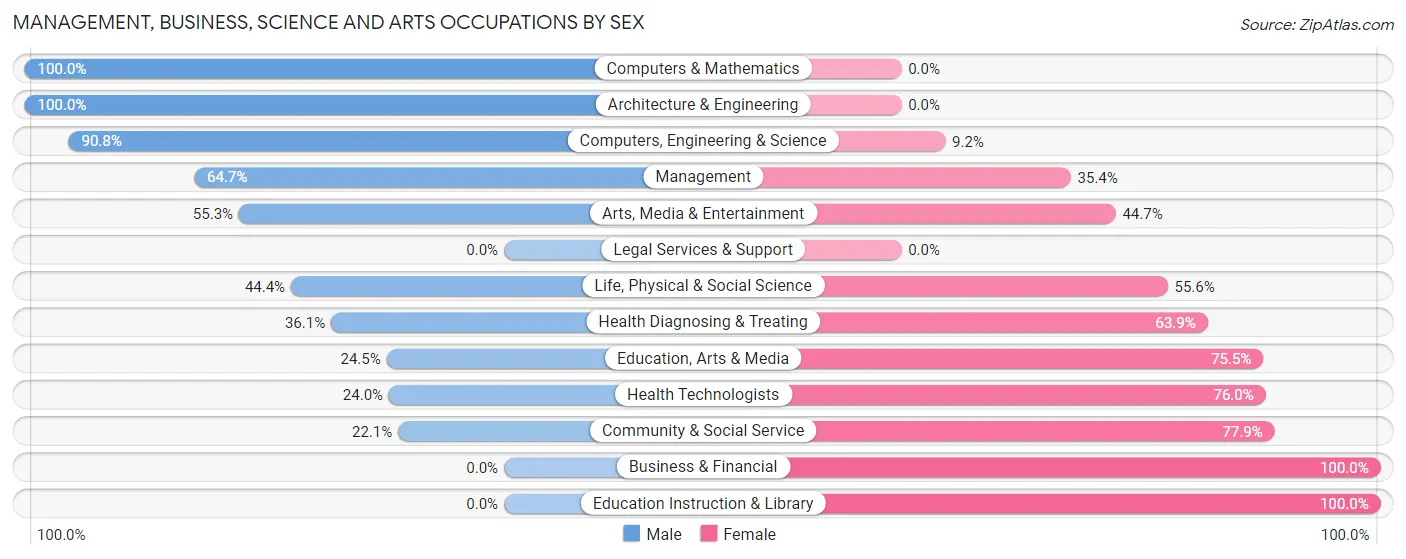
Management, Business, Science and Arts Occupations by Sex
Within the Management, Business, Science and Arts occupations in Saugerties, the most male-oriented occupations are Computers & Mathematics (100.0%), Architecture & Engineering (100.0%), and Computers, Engineering & Science (90.8%), while the most female-oriented occupations are Business & Financial (100.0%), Education Instruction & Library (100.0%), and Community & Social Service (77.9%).
| Occupation | Male | Female |
| Management | 64 (64.6%) | 35 (35.3%) |
| Business & Financial | 0 (0.0%) | 14 (100.0%) |
| Computers, Engineering & Science | 99 (90.8%) | 10 (9.2%) |
| Computers & Mathematics | 52 (100.0%) | 0 (0.0%) |
| Architecture & Engineering | 39 (100.0%) | 0 (0.0%) |
| Life, Physical & Social Science | 8 (44.4%) | 10 (55.6%) |
| Community & Social Service | 59 (22.1%) | 208 (77.9%) |
| Education, Arts & Media | 12 (24.5%) | 37 (75.5%) |
| Legal Services & Support | 0 (0.0%) | 0 (0.0%) |
| Education Instruction & Library | 0 (0.0%) | 133 (100.0%) |
| Arts, Media & Entertainment | 47 (55.3%) | 38 (44.7%) |
| Health Diagnosing & Treating | 48 (36.1%) | 85 (63.9%) |
| Health Technologists | 18 (24.0%) | 57 (76.0%) |
| Total (Category) | 270 (43.4%) | 352 (56.6%) |
| Total (Overall) | 942 (51.1%) | 902 (48.9%) |
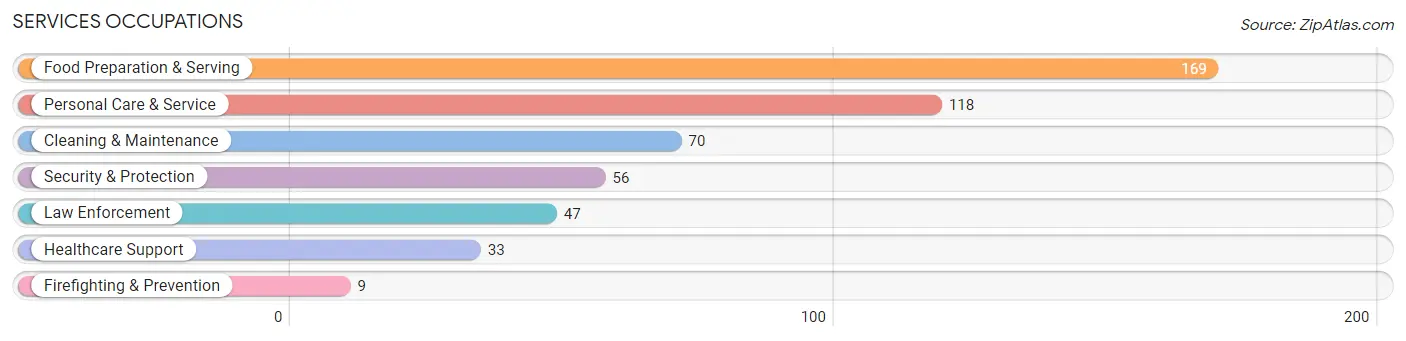
Services Occupations
The most common Services occupations in Saugerties are Food Preparation & Serving (169 | 9.2%), Personal Care & Service (118 | 6.4%), Cleaning & Maintenance (70 | 3.8%), Security & Protection (56 | 3.0%), and Law Enforcement (47 | 2.5%).
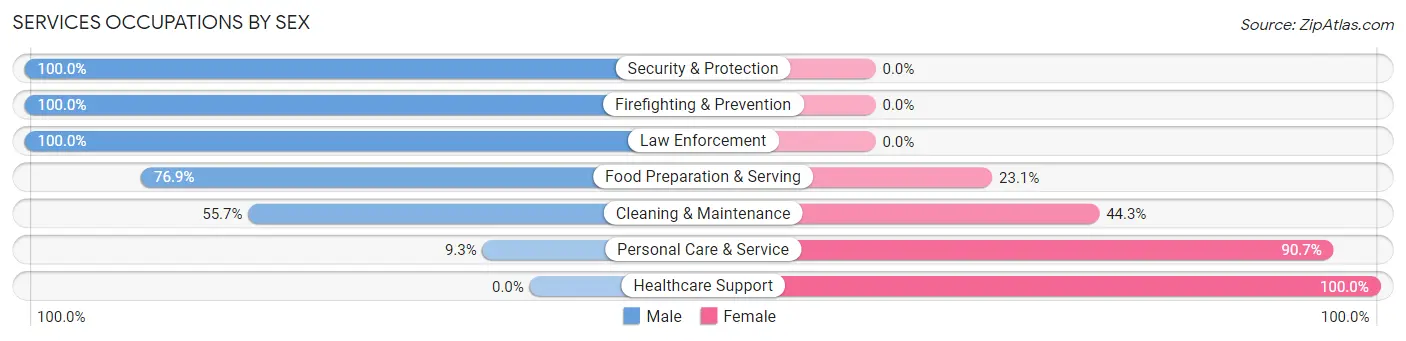
Services Occupations by Sex
Within the Services occupations in Saugerties, the most male-oriented occupations are Security & Protection (100.0%), Firefighting & Prevention (100.0%), and Law Enforcement (100.0%), while the most female-oriented occupations are Healthcare Support (100.0%), Personal Care & Service (90.7%), and Cleaning & Maintenance (44.3%).
| Occupation | Male | Female |
| Healthcare Support | 0 (0.0%) | 33 (100.0%) |
| Security & Protection | 56 (100.0%) | 0 (0.0%) |
| Firefighting & Prevention | 9 (100.0%) | 0 (0.0%) |
| Law Enforcement | 47 (100.0%) | 0 (0.0%) |
| Food Preparation & Serving | 130 (76.9%) | 39 (23.1%) |
| Cleaning & Maintenance | 39 (55.7%) | 31 (44.3%) |
| Personal Care & Service | 11 (9.3%) | 107 (90.7%) |
| Total (Category) | 236 (52.9%) | 210 (47.1%) |
| Total (Overall) | 942 (51.1%) | 902 (48.9%) |
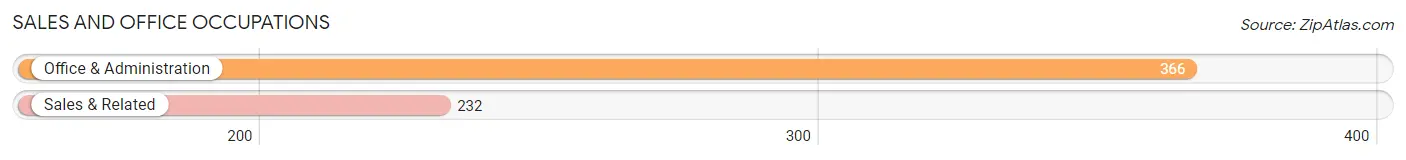
Sales and Office Occupations
The most common Sales and Office occupations in Saugerties are Office & Administration (366 | 19.9%), and Sales & Related (232 | 12.6%).
Sales and Office Occupations by Sex
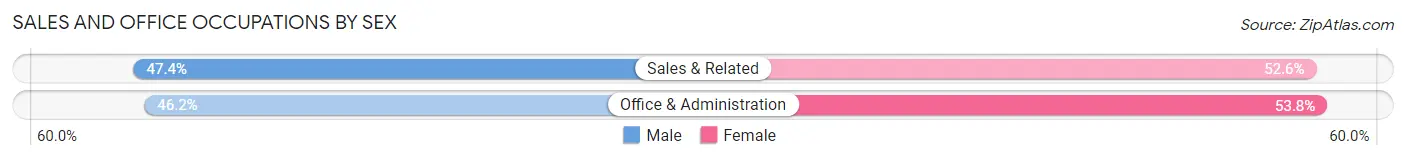
| Occupation | Male | Female |
| Sales & Related | 110 (47.4%) | 122 (52.6%) |
| Office & Administration | 169 (46.2%) | 197 (53.8%) |
| Total (Category) | 279 (46.7%) | 319 (53.3%) |
| Total (Overall) | 942 (51.1%) | 902 (48.9%) |
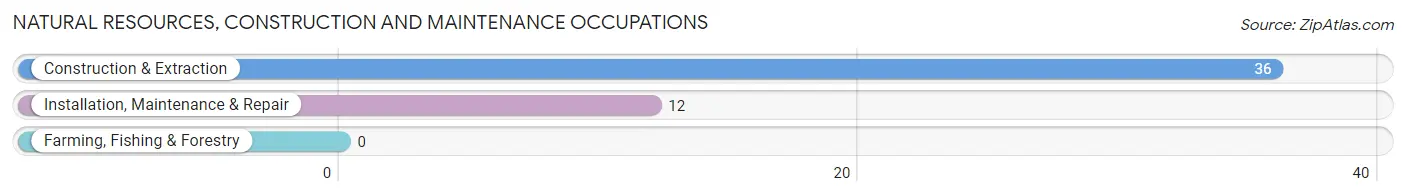
Natural Resources, Construction and Maintenance Occupations
The most common Natural Resources, Construction and Maintenance occupations in Saugerties are Construction & Extraction (36 | 1.9%), and Installation, Maintenance & Repair (12 | 0.6%).
Natural Resources, Construction and Maintenance Occupations by Sex
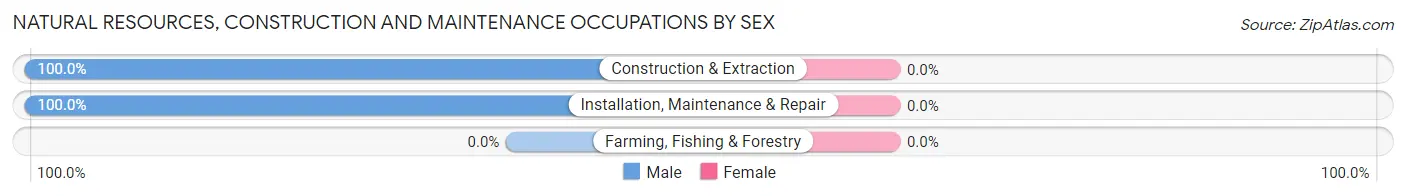
| Occupation | Male | Female |
| Farming, Fishing & Forestry | 0 (0.0%) | 0 (0.0%) |
| Construction & Extraction | 36 (100.0%) | 0 (0.0%) |
| Installation, Maintenance & Repair | 12 (100.0%) | 0 (0.0%) |
| Total (Category) | 48 (100.0%) | 0 (0.0%) |
| Total (Overall) | 942 (51.1%) | 902 (48.9%) |
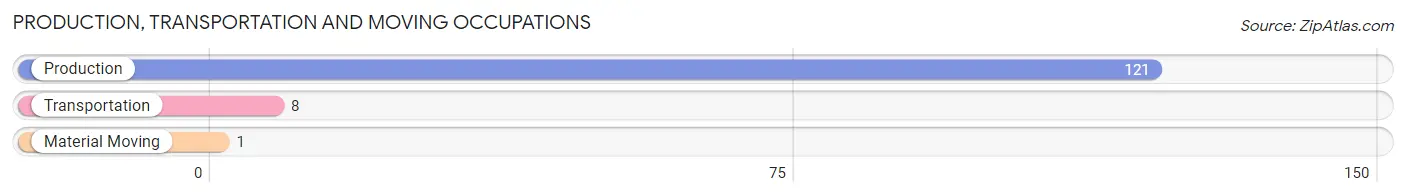
Production, Transportation and Moving Occupations
The most common Production, Transportation and Moving occupations in Saugerties are Production (121 | 6.6%), Transportation (8 | 0.4%), and Material Moving (1 | 0.1%).
Production, Transportation and Moving Occupations by Sex
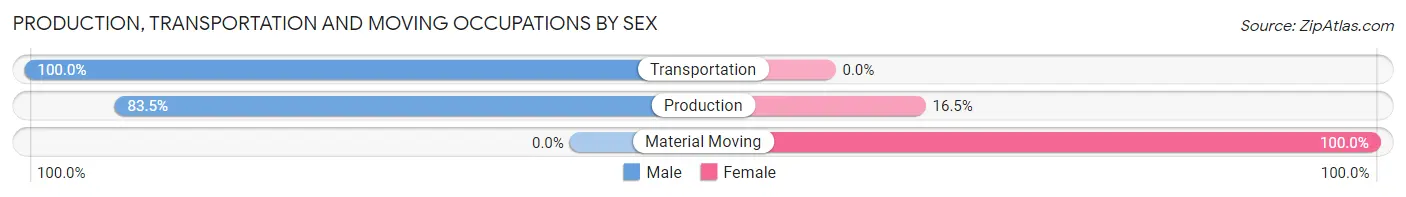
| Occupation | Male | Female |
| Production | 101 (83.5%) | 20 (16.5%) |
| Transportation | 8 (100.0%) | 0 (0.0%) |
| Material Moving | 0 (0.0%) | 1 (100.0%) |
| Total (Category) | 109 (83.9%) | 21 (16.2%) |
| Total (Overall) | 942 (51.1%) | 902 (48.9%) |
Employment Industries by Sex in Saugerties
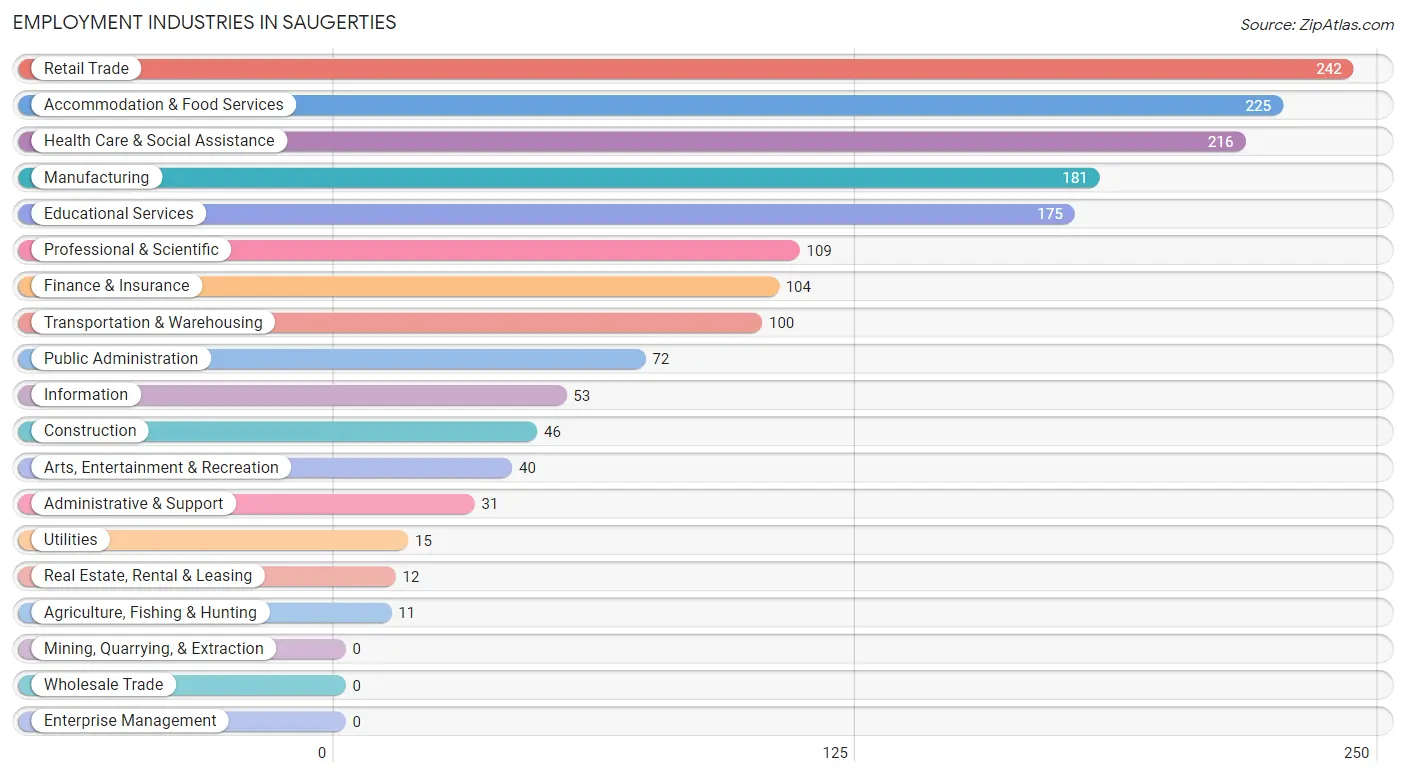
Employment Industries in Saugerties
The major employment industries in Saugerties include Retail Trade (242 | 13.1%), Accommodation & Food Services (225 | 12.2%), Health Care & Social Assistance (216 | 11.7%), Manufacturing (181 | 9.8%), and Educational Services (175 | 9.5%).
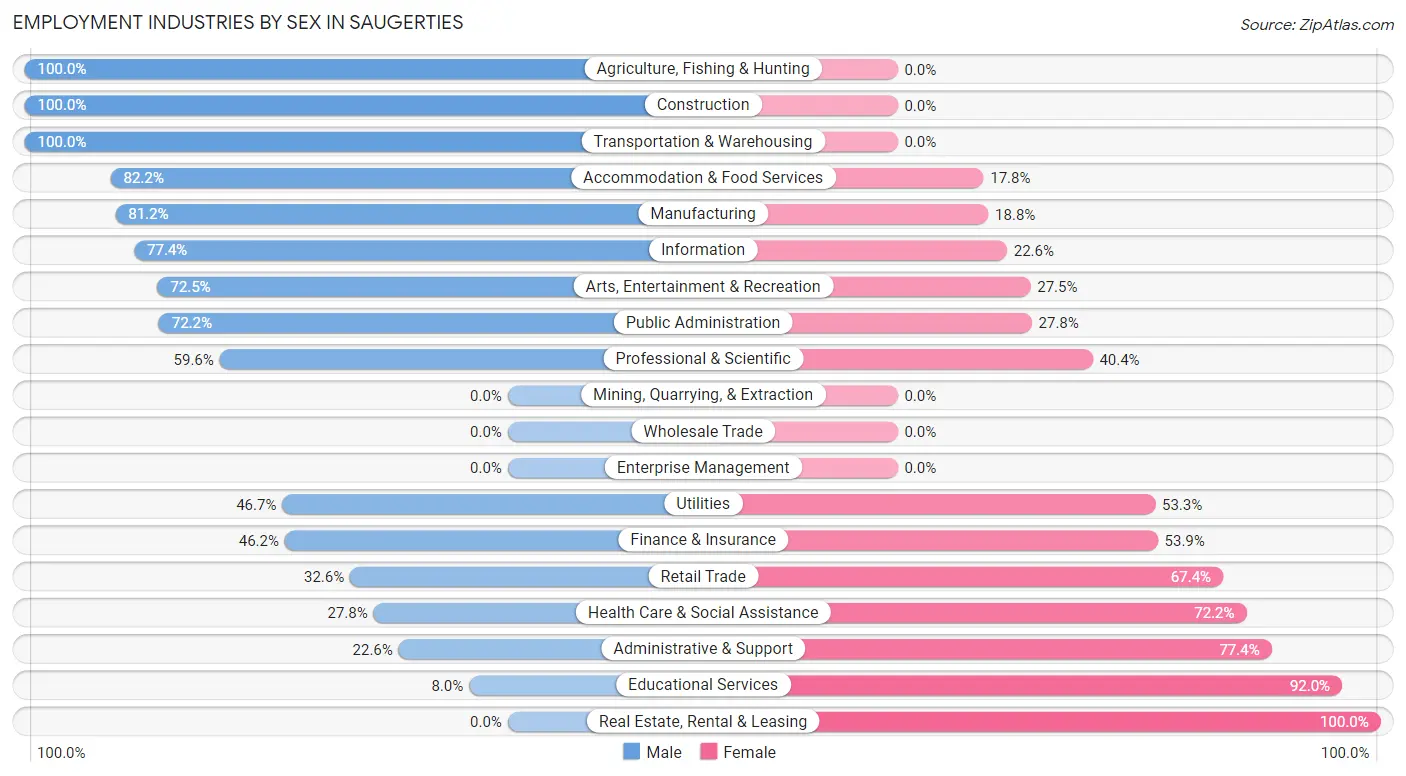
Employment Industries by Sex in Saugerties
The Saugerties industries that see more men than women are Agriculture, Fishing & Hunting (100.0%), Construction (100.0%), and Transportation & Warehousing (100.0%), whereas the industries that tend to have a higher number of women are Real Estate, Rental & Leasing (100.0%), Educational Services (92.0%), and Administrative & Support (77.4%).
| Industry | Male | Female |
| Agriculture, Fishing & Hunting | 11 (100.0%) | 0 (0.0%) |
| Mining, Quarrying, & Extraction | 0 (0.0%) | 0 (0.0%) |
| Construction | 46 (100.0%) | 0 (0.0%) |
| Manufacturing | 147 (81.2%) | 34 (18.8%) |
| Wholesale Trade | 0 (0.0%) | 0 (0.0%) |
| Retail Trade | 79 (32.6%) | 163 (67.4%) |
| Transportation & Warehousing | 100 (100.0%) | 0 (0.0%) |
| Utilities | 7 (46.7%) | 8 (53.3%) |
| Information | 41 (77.4%) | 12 (22.6%) |
| Finance & Insurance | 48 (46.2%) | 56 (53.8%) |
| Real Estate, Rental & Leasing | 0 (0.0%) | 12 (100.0%) |
| Professional & Scientific | 65 (59.6%) | 44 (40.4%) |
| Enterprise Management | 0 (0.0%) | 0 (0.0%) |
| Administrative & Support | 7 (22.6%) | 24 (77.4%) |
| Educational Services | 14 (8.0%) | 161 (92.0%) |
| Health Care & Social Assistance | 60 (27.8%) | 156 (72.2%) |
| Arts, Entertainment & Recreation | 29 (72.5%) | 11 (27.5%) |
| Accommodation & Food Services | 185 (82.2%) | 40 (17.8%) |
| Public Administration | 52 (72.2%) | 20 (27.8%) |
| Total | 942 (51.1%) | 902 (48.9%) |
Education in Saugerties
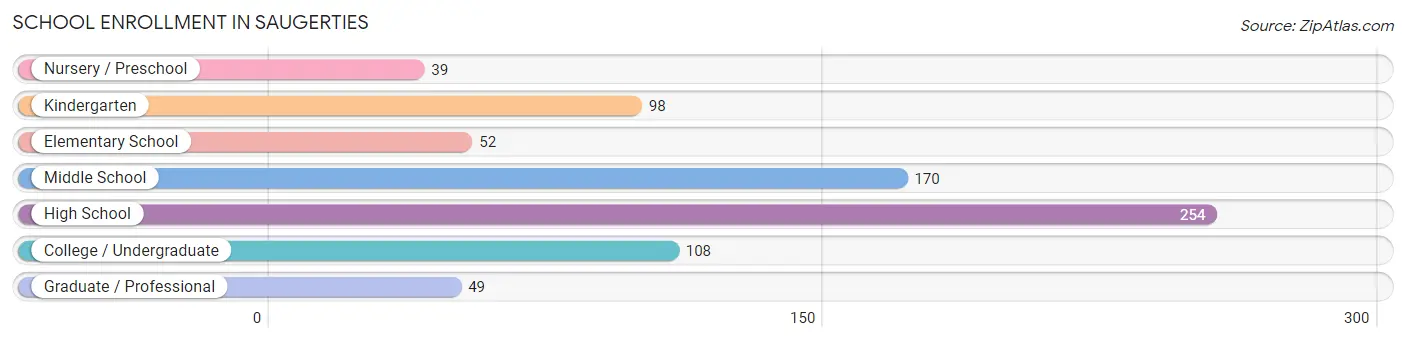
School Enrollment in Saugerties
The most common levels of schooling among the 770 students in Saugerties are high school (254 | 33.0%), middle school (170 | 22.1%), and college / undergraduate (108 | 14.0%).
| School Level | # Students | % Students |
| Nursery / Preschool | 39 | 5.1% |
| Kindergarten | 98 | 12.7% |
| Elementary School | 52 | 6.8% |
| Middle School | 170 | 22.1% |
| High School | 254 | 33.0% |
| College / Undergraduate | 108 | 14.0% |
| Graduate / Professional | 49 | 6.4% |
| Total | 770 | 100.0% |
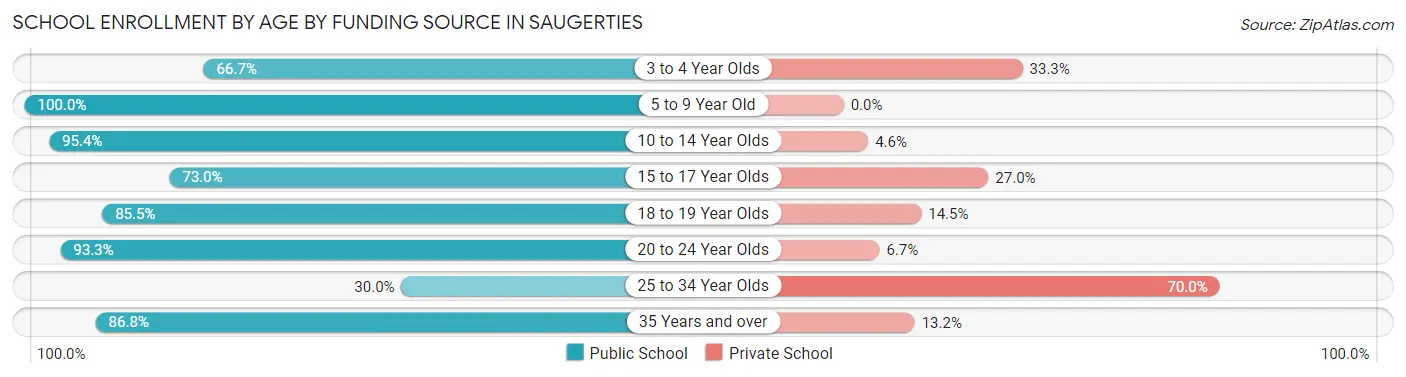
School Enrollment by Age by Funding Source in Saugerties
Out of a total of 770 students who are enrolled in schools in Saugerties, 100 (13.0%) attend a private institution, while the remaining 670 (87.0%) are enrolled in public schools. The age group of 25 to 34 year olds has the highest likelihood of being enrolled in private schools, with 21 (70.0% in the age bracket) enrolled. Conversely, the age group of 5 to 9 year old has the lowest likelihood of being enrolled in a private school, with 150 (100.0% in the age bracket) attending a public institution.
| Age Bracket | Public School | Private School |
| 3 to 4 Year Olds | 26 (66.7%) | 13 (33.3%) |
| 5 to 9 Year Old | 150 (100.0%) | 0 (0.0%) |
| 10 to 14 Year Olds | 229 (95.4%) | 11 (4.6%) |
| 15 to 17 Year Olds | 84 (73.0%) | 31 (27.0%) |
| 18 to 19 Year Olds | 71 (85.5%) | 12 (14.5%) |
| 20 to 24 Year Olds | 42 (93.3%) | 3 (6.7%) |
| 25 to 34 Year Olds | 9 (30.0%) | 21 (70.0%) |
| 35 Years and over | 59 (86.8%) | 9 (13.2%) |
| Total | 670 (87.0%) | 100 (13.0%) |
Educational Attainment by Field of Study in Saugerties
Education (128 | 16.4%), literature & languages (118 | 15.1%), social sciences (91 | 11.6%), science & technology (89 | 11.4%), and business (76 | 9.7%) are the most common fields of study among 783 individuals in Saugerties who have obtained a bachelor's degree or higher.
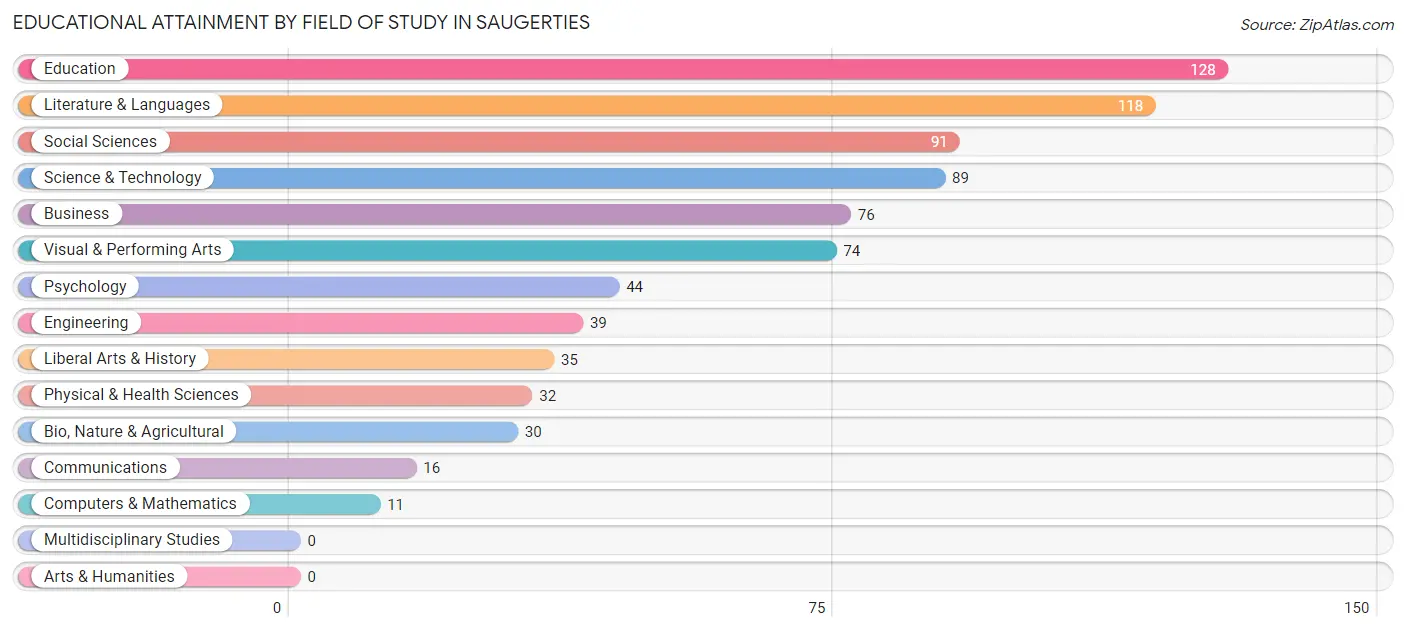
| Field of Study | # Graduates | % Graduates |
| Computers & Mathematics | 11 | 1.4% |
| Bio, Nature & Agricultural | 30 | 3.8% |
| Physical & Health Sciences | 32 | 4.1% |
| Psychology | 44 | 5.6% |
| Social Sciences | 91 | 11.6% |
| Engineering | 39 | 5.0% |
| Multidisciplinary Studies | 0 | 0.0% |
| Science & Technology | 89 | 11.4% |
| Business | 76 | 9.7% |
| Education | 128 | 16.4% |
| Literature & Languages | 118 | 15.1% |
| Liberal Arts & History | 35 | 4.5% |
| Visual & Performing Arts | 74 | 9.5% |
| Communications | 16 | 2.0% |
| Arts & Humanities | 0 | 0.0% |
| Total | 783 | 100.0% |
Transportation & Commute in Saugerties
Vehicle Availability by Sex in Saugerties
The most prevalent vehicle ownership categories in Saugerties are males with 2 vehicles (344, accounting for 36.9%) and females with 2 vehicles (328, making up 41.7%).
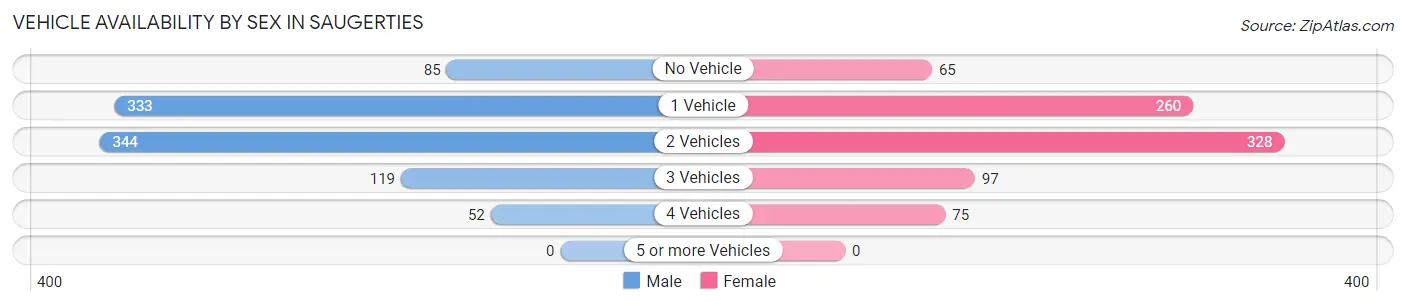
| Vehicles Available | Male | Female |
| No Vehicle | 85 (9.1%) | 65 (7.9%) |
| 1 Vehicle | 333 (35.7%) | 260 (31.5%) |
| 2 Vehicles | 344 (36.9%) | 328 (39.8%) |
| 3 Vehicles | 119 (12.8%) | 97 (11.8%) |
| 4 Vehicles | 52 (5.6%) | 75 (9.1%) |
| 5 or more Vehicles | 0 (0.0%) | 0 (0.0%) |
| Total | 933 (100.0%) | 825 (100.0%) |
Commute Time in Saugerties
The most frequently occuring commute durations in Saugerties are 20 to 24 minutes (288 commuters, 17.3%), 5 to 9 minutes (270 commuters, 16.2%), and 30 to 34 minutes (222 commuters, 13.4%).
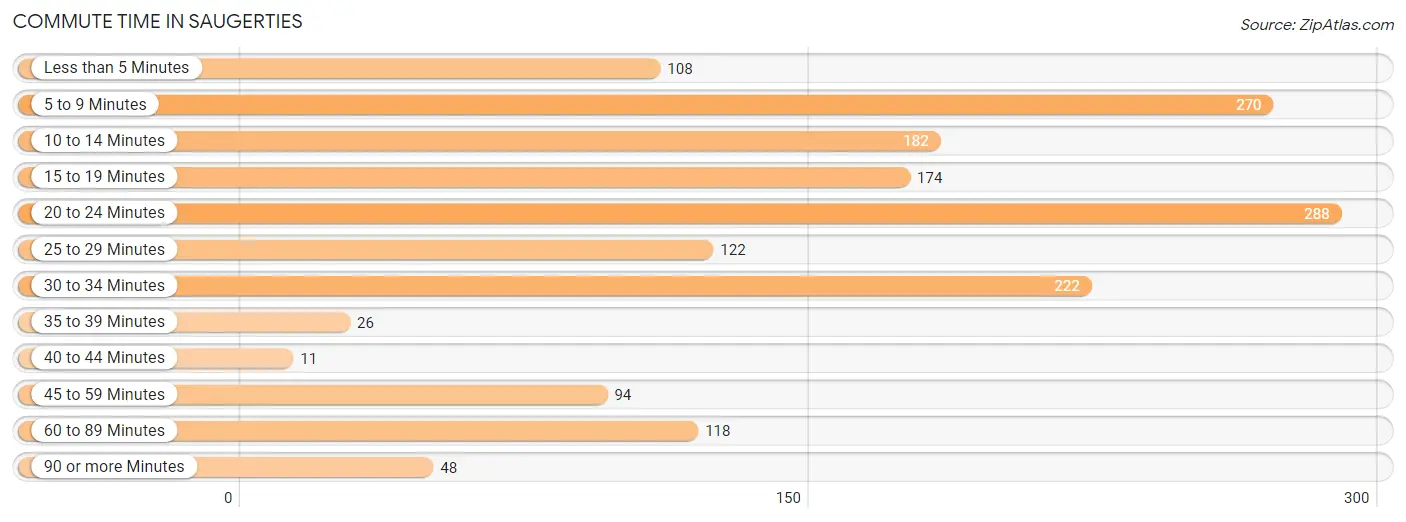
| Commute Time | # Commuters | % Commuters |
| Less than 5 Minutes | 108 | 6.5% |
| 5 to 9 Minutes | 270 | 16.2% |
| 10 to 14 Minutes | 182 | 10.9% |
| 15 to 19 Minutes | 174 | 10.5% |
| 20 to 24 Minutes | 288 | 17.3% |
| 25 to 29 Minutes | 122 | 7.3% |
| 30 to 34 Minutes | 222 | 13.4% |
| 35 to 39 Minutes | 26 | 1.6% |
| 40 to 44 Minutes | 11 | 0.7% |
| 45 to 59 Minutes | 94 | 5.7% |
| 60 to 89 Minutes | 118 | 7.1% |
| 90 or more Minutes | 48 | 2.9% |
Commute Time by Sex in Saugerties
The most common commute times in Saugerties are 5 to 9 minutes (149 commuters, 17.0%) for males and 20 to 24 minutes (139 commuters, 17.7%) for females.
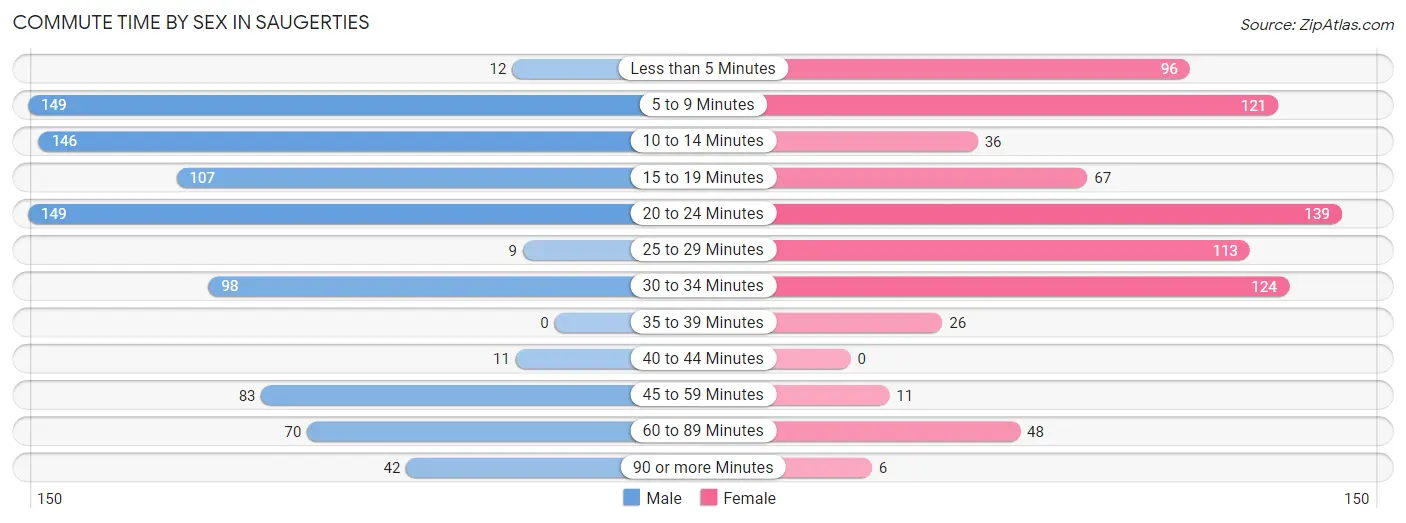
| Commute Time | Male | Female |
| Less than 5 Minutes | 12 (1.4%) | 96 (12.2%) |
| 5 to 9 Minutes | 149 (17.0%) | 121 (15.4%) |
| 10 to 14 Minutes | 146 (16.7%) | 36 (4.6%) |
| 15 to 19 Minutes | 107 (12.2%) | 67 (8.5%) |
| 20 to 24 Minutes | 149 (17.0%) | 139 (17.7%) |
| 25 to 29 Minutes | 9 (1.0%) | 113 (14.4%) |
| 30 to 34 Minutes | 98 (11.2%) | 124 (15.8%) |
| 35 to 39 Minutes | 0 (0.0%) | 26 (3.3%) |
| 40 to 44 Minutes | 11 (1.3%) | 0 (0.0%) |
| 45 to 59 Minutes | 83 (9.5%) | 11 (1.4%) |
| 60 to 89 Minutes | 70 (8.0%) | 48 (6.1%) |
| 90 or more Minutes | 42 (4.8%) | 6 (0.8%) |
Time of Departure to Work by Sex in Saugerties
The most frequent times of departure to work in Saugerties are 12:00 PM to 3:59 PM (133, 15.2%) for males and 9:00 AM to 9:59 AM (205, 26.1%) for females.
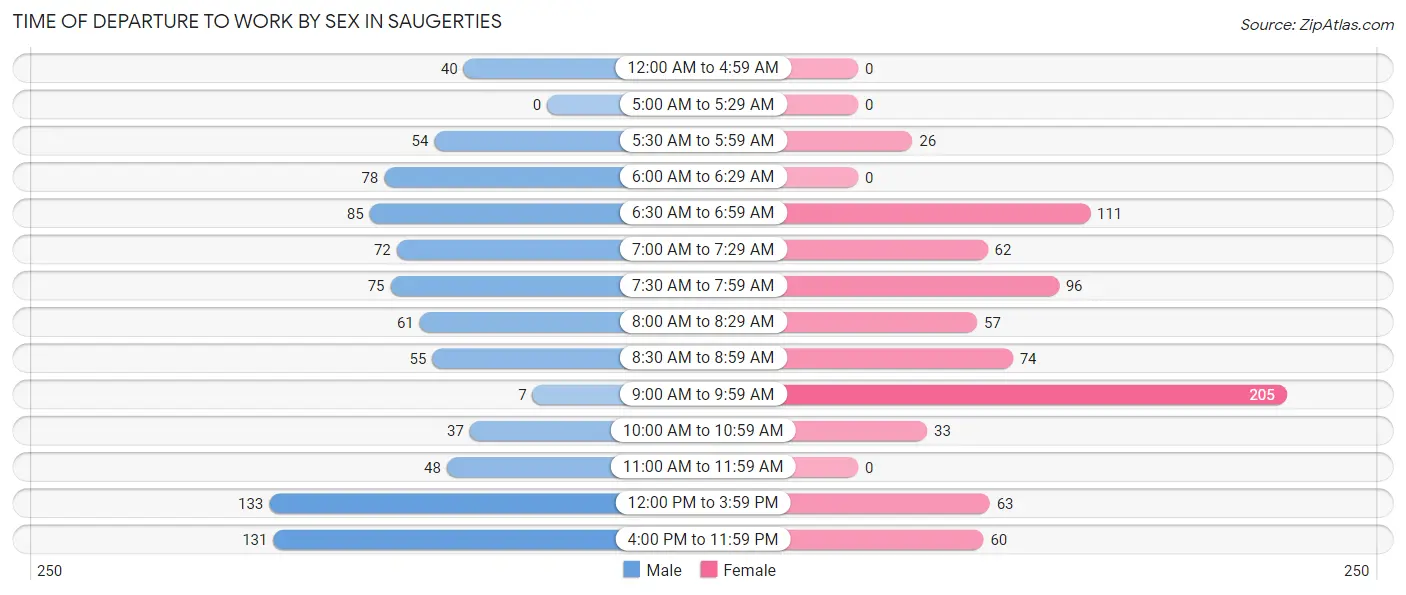
| Time of Departure | Male | Female |
| 12:00 AM to 4:59 AM | 40 (4.6%) | 0 (0.0%) |
| 5:00 AM to 5:29 AM | 0 (0.0%) | 0 (0.0%) |
| 5:30 AM to 5:59 AM | 54 (6.2%) | 26 (3.3%) |
| 6:00 AM to 6:29 AM | 78 (8.9%) | 0 (0.0%) |
| 6:30 AM to 6:59 AM | 85 (9.7%) | 111 (14.1%) |
| 7:00 AM to 7:29 AM | 72 (8.2%) | 62 (7.9%) |
| 7:30 AM to 7:59 AM | 75 (8.6%) | 96 (12.2%) |
| 8:00 AM to 8:29 AM | 61 (7.0%) | 57 (7.2%) |
| 8:30 AM to 8:59 AM | 55 (6.3%) | 74 (9.4%) |
| 9:00 AM to 9:59 AM | 7 (0.8%) | 205 (26.1%) |
| 10:00 AM to 10:59 AM | 37 (4.2%) | 33 (4.2%) |
| 11:00 AM to 11:59 AM | 48 (5.5%) | 0 (0.0%) |
| 12:00 PM to 3:59 PM | 133 (15.2%) | 63 (8.0%) |
| 4:00 PM to 11:59 PM | 131 (14.9%) | 60 (7.6%) |
| Total | 876 (100.0%) | 787 (100.0%) |
Housing Occupancy in Saugerties
Occupancy by Ownership in Saugerties
Of the total 1,832 dwellings in Saugerties, owner-occupied units account for 790 (43.1%), while renter-occupied units make up 1,042 (56.9%).
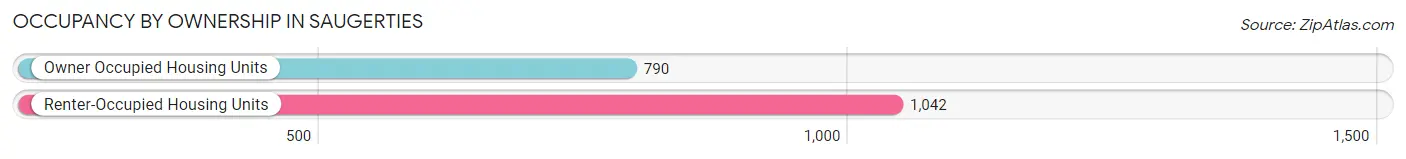
| Occupancy | # Housing Units | % Housing Units |
| Owner Occupied Housing Units | 790 | 43.1% |
| Renter-Occupied Housing Units | 1,042 | 56.9% |
| Total Occupied Housing Units | 1,832 | 100.0% |
Occupancy by Household Size in Saugerties
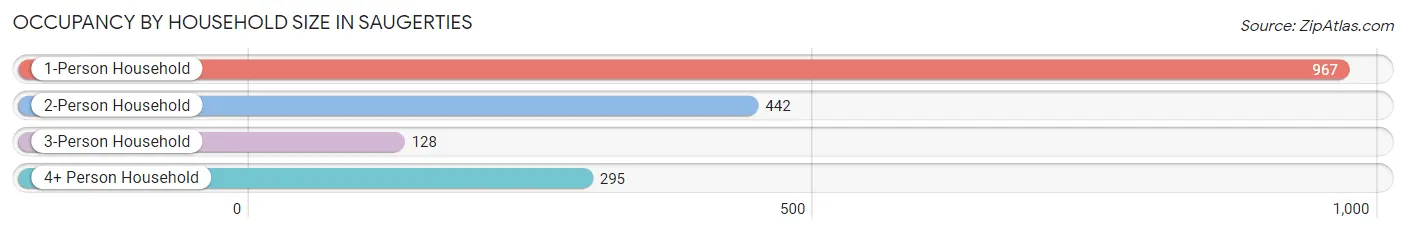
| Household Size | # Housing Units | % Housing Units |
| 1-Person Household | 967 | 52.8% |
| 2-Person Household | 442 | 24.1% |
| 3-Person Household | 128 | 7.0% |
| 4+ Person Household | 295 | 16.1% |
| Total Housing Units | 1,832 | 100.0% |
Occupancy by Ownership by Household Size in Saugerties
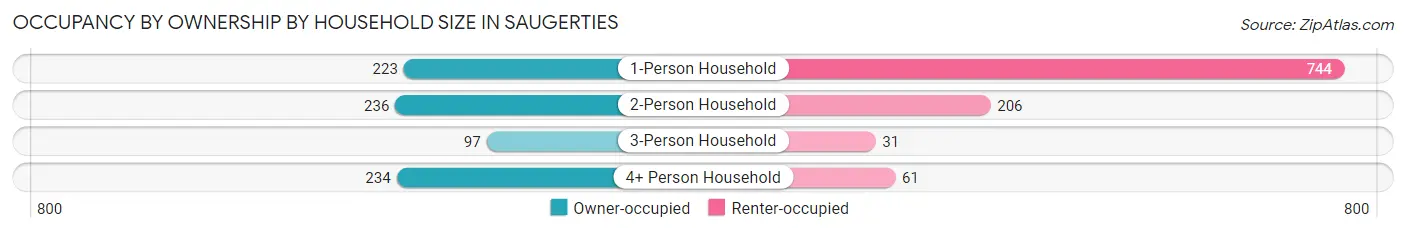
| Household Size | Owner-occupied | Renter-occupied |
| 1-Person Household | 223 (23.1%) | 744 (76.9%) |
| 2-Person Household | 236 (53.4%) | 206 (46.6%) |
| 3-Person Household | 97 (75.8%) | 31 (24.2%) |
| 4+ Person Household | 234 (79.3%) | 61 (20.7%) |
| Total Housing Units | 790 (43.1%) | 1,042 (56.9%) |
Occupancy by Educational Attainment in Saugerties
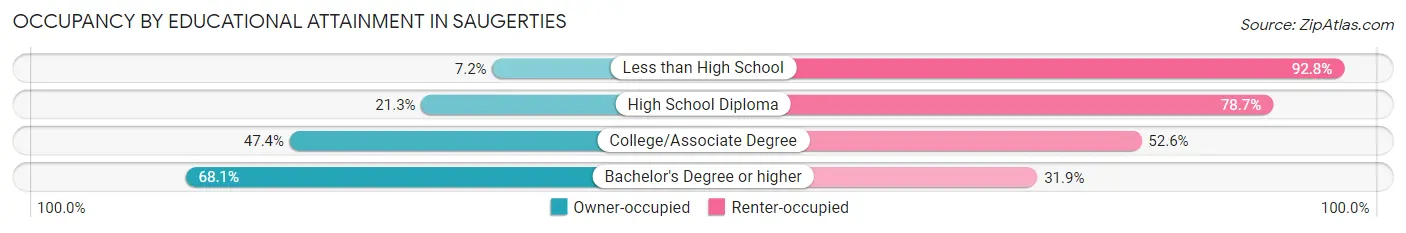
| Household Size | Owner-occupied | Renter-occupied |
| Less than High School | 16 (7.2%) | 205 (92.8%) |
| High School Diploma | 80 (21.3%) | 295 (78.7%) |
| College/Associate Degree | 338 (47.4%) | 375 (52.6%) |
| Bachelor's Degree or higher | 356 (68.1%) | 167 (31.9%) |
Occupancy by Age of Householder in Saugerties
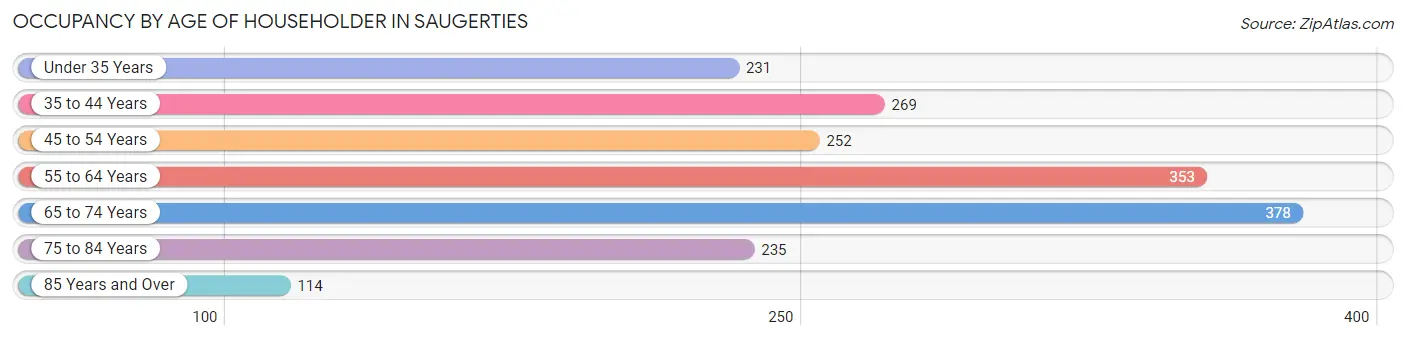
| Age Bracket | # Households | % Households |
| Under 35 Years | 231 | 12.6% |
| 35 to 44 Years | 269 | 14.7% |
| 45 to 54 Years | 252 | 13.8% |
| 55 to 64 Years | 353 | 19.3% |
| 65 to 74 Years | 378 | 20.6% |
| 75 to 84 Years | 235 | 12.8% |
| 85 Years and Over | 114 | 6.2% |
| Total | 1,832 | 100.0% |
Housing Finances in Saugerties
Median Income by Occupancy in Saugerties
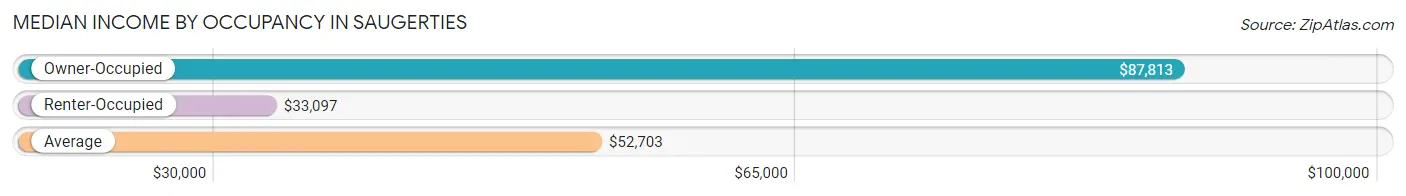
| Occupancy Type | # Households | Median Income |
| Owner-Occupied | 790 (43.1%) | $87,813 |
| Renter-Occupied | 1,042 (56.9%) | $33,097 |
| Average | 1,832 (100.0%) | $52,703 |
Occupancy by Householder Income Bracket in Saugerties
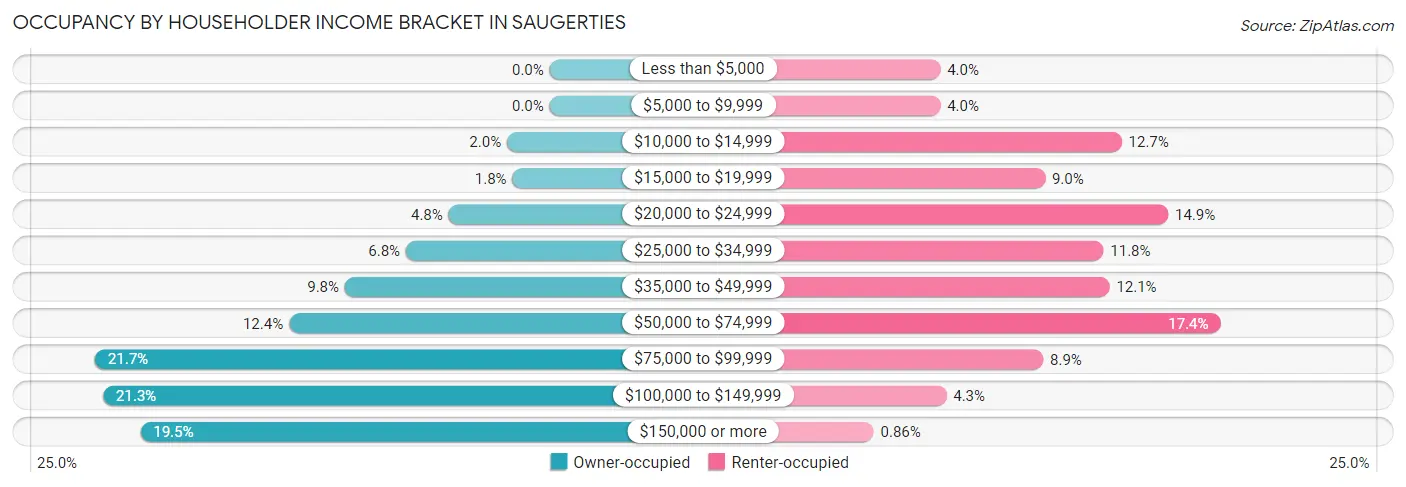
| Income Bracket | Owner-occupied | Renter-occupied |
| Less than $5,000 | 0 (0.0%) | 42 (4.0%) |
| $5,000 to $9,999 | 0 (0.0%) | 42 (4.0%) |
| $10,000 to $14,999 | 16 (2.0%) | 132 (12.7%) |
| $15,000 to $19,999 | 14 (1.8%) | 94 (9.0%) |
| $20,000 to $24,999 | 38 (4.8%) | 155 (14.9%) |
| $25,000 to $34,999 | 54 (6.8%) | 123 (11.8%) |
| $35,000 to $49,999 | 77 (9.8%) | 126 (12.1%) |
| $50,000 to $74,999 | 98 (12.4%) | 181 (17.4%) |
| $75,000 to $99,999 | 171 (21.6%) | 93 (8.9%) |
| $100,000 to $149,999 | 168 (21.3%) | 45 (4.3%) |
| $150,000 or more | 154 (19.5%) | 9 (0.9%) |
| Total | 790 (100.0%) | 1,042 (100.0%) |
Monthly Housing Cost Tiers in Saugerties
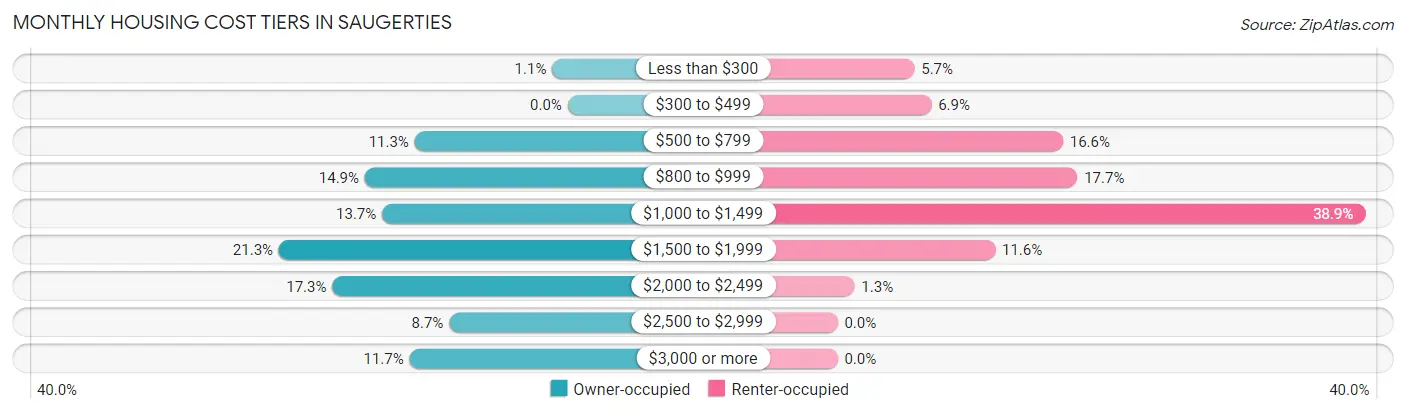
| Monthly Cost | Owner-occupied | Renter-occupied |
| Less than $300 | 9 (1.1%) | 59 (5.7%) |
| $300 to $499 | 0 (0.0%) | 72 (6.9%) |
| $500 to $799 | 89 (11.3%) | 173 (16.6%) |
| $800 to $999 | 118 (14.9%) | 184 (17.7%) |
| $1,000 to $1,499 | 108 (13.7%) | 405 (38.9%) |
| $1,500 to $1,999 | 168 (21.3%) | 121 (11.6%) |
| $2,000 to $2,499 | 137 (17.3%) | 13 (1.3%) |
| $2,500 to $2,999 | 69 (8.7%) | 0 (0.0%) |
| $3,000 or more | 92 (11.7%) | 0 (0.0%) |
| Total | 790 (100.0%) | 1,042 (100.0%) |
Physical Housing Characteristics in Saugerties
Housing Structures in Saugerties
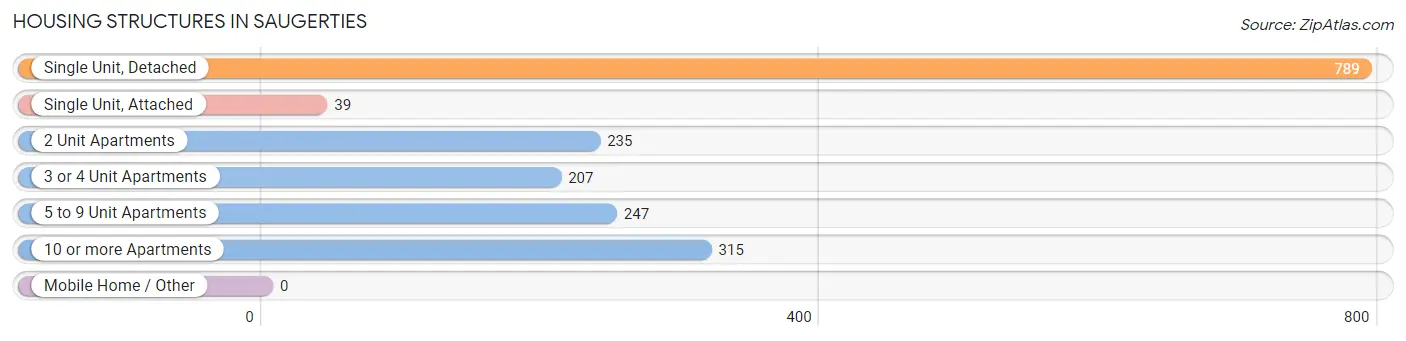
| Structure Type | # Housing Units | % Housing Units |
| Single Unit, Detached | 789 | 43.1% |
| Single Unit, Attached | 39 | 2.1% |
| 2 Unit Apartments | 235 | 12.8% |
| 3 or 4 Unit Apartments | 207 | 11.3% |
| 5 to 9 Unit Apartments | 247 | 13.5% |
| 10 or more Apartments | 315 | 17.2% |
| Mobile Home / Other | 0 | 0.0% |
| Total | 1,832 | 100.0% |
Housing Structures by Occupancy in Saugerties
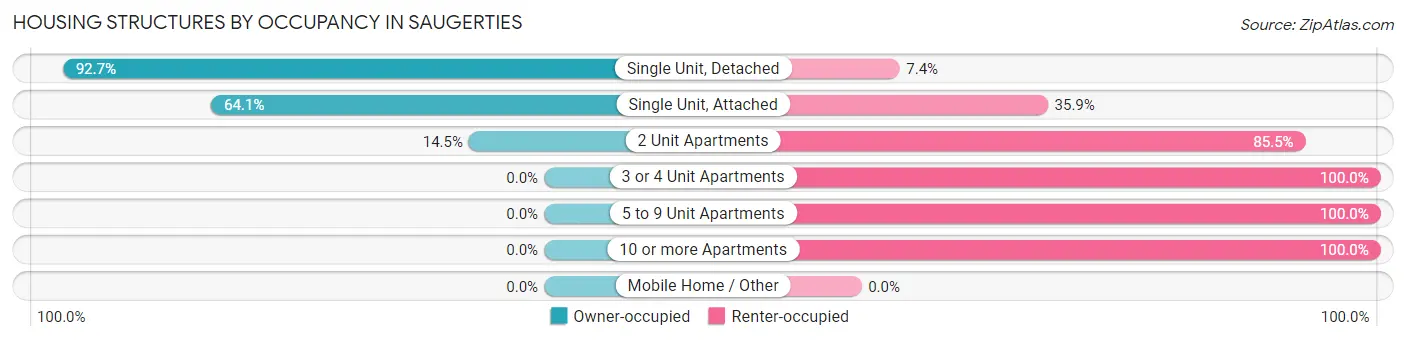
| Structure Type | Owner-occupied | Renter-occupied |
| Single Unit, Detached | 731 (92.6%) | 58 (7.3%) |
| Single Unit, Attached | 25 (64.1%) | 14 (35.9%) |
| 2 Unit Apartments | 34 (14.5%) | 201 (85.5%) |
| 3 or 4 Unit Apartments | 0 (0.0%) | 207 (100.0%) |
| 5 to 9 Unit Apartments | 0 (0.0%) | 247 (100.0%) |
| 10 or more Apartments | 0 (0.0%) | 315 (100.0%) |
| Mobile Home / Other | 0 (0.0%) | 0 (0.0%) |
| Total | 790 (43.1%) | 1,042 (56.9%) |
Housing Structures by Number of Rooms in Saugerties
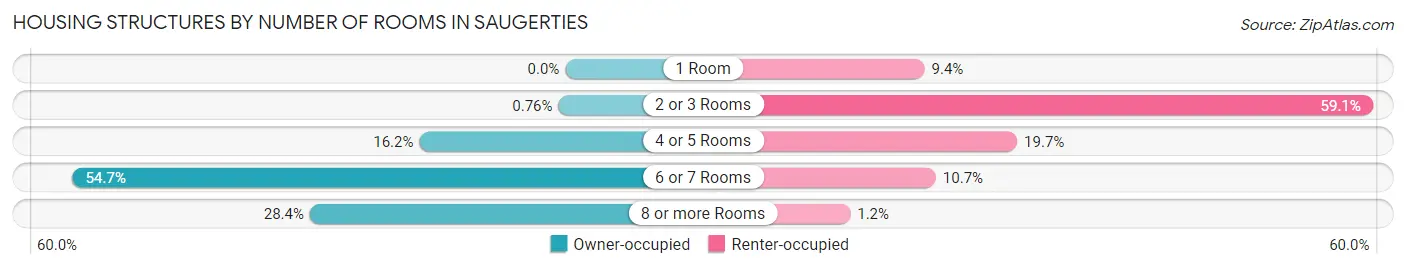
| Number of Rooms | Owner-occupied | Renter-occupied |
| 1 Room | 0 (0.0%) | 98 (9.4%) |
| 2 or 3 Rooms | 6 (0.8%) | 616 (59.1%) |
| 4 or 5 Rooms | 128 (16.2%) | 205 (19.7%) |
| 6 or 7 Rooms | 432 (54.7%) | 111 (10.6%) |
| 8 or more Rooms | 224 (28.3%) | 12 (1.1%) |
| Total | 790 (100.0%) | 1,042 (100.0%) |
Housing Structure by Heating Type in Saugerties
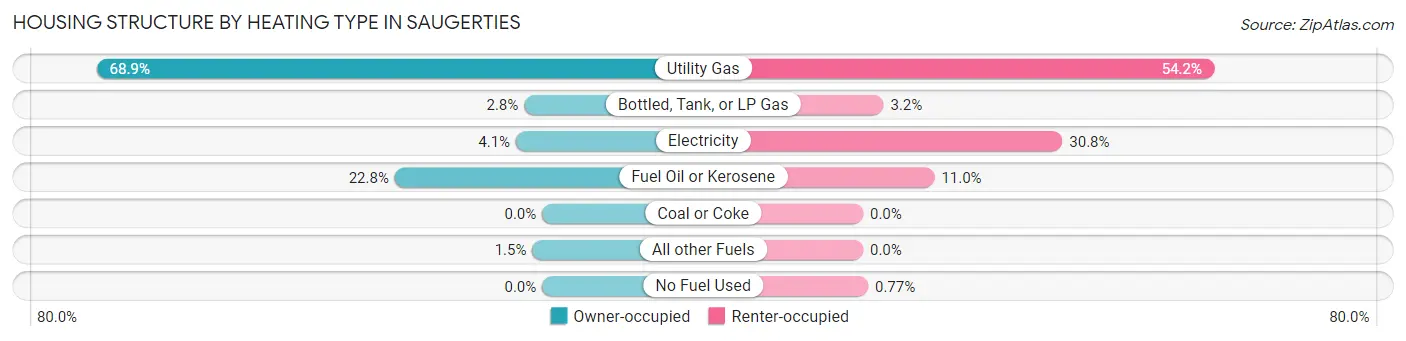
| Heating Type | Owner-occupied | Renter-occupied |
| Utility Gas | 544 (68.9%) | 565 (54.2%) |
| Bottled, Tank, or LP Gas | 22 (2.8%) | 33 (3.2%) |
| Electricity | 32 (4.1%) | 321 (30.8%) |
| Fuel Oil or Kerosene | 180 (22.8%) | 115 (11.0%) |
| Coal or Coke | 0 (0.0%) | 0 (0.0%) |
| All other Fuels | 12 (1.5%) | 0 (0.0%) |
| No Fuel Used | 0 (0.0%) | 8 (0.8%) |
| Total | 790 (100.0%) | 1,042 (100.0%) |
Household Vehicle Usage in Saugerties
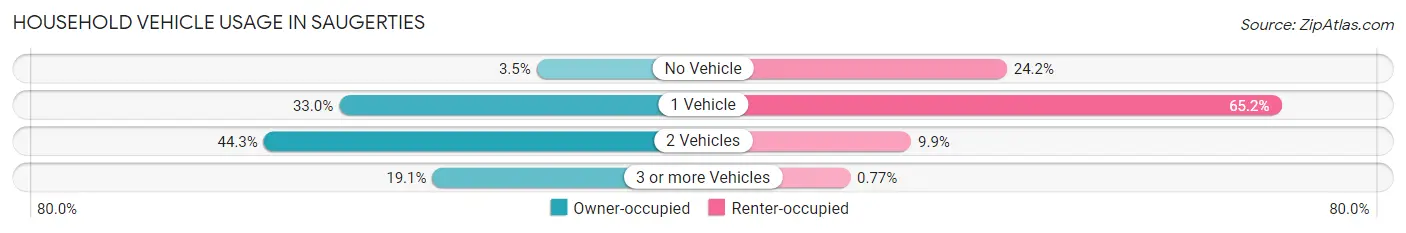
| Vehicles per Household | Owner-occupied | Renter-occupied |
| No Vehicle | 28 (3.5%) | 252 (24.2%) |
| 1 Vehicle | 261 (33.0%) | 679 (65.2%) |
| 2 Vehicles | 350 (44.3%) | 103 (9.9%) |
| 3 or more Vehicles | 151 (19.1%) | 8 (0.8%) |
| Total | 790 (100.0%) | 1,042 (100.0%) |
Real Estate & Mortgages in Saugerties
Real Estate and Mortgage Overview in Saugerties
| Characteristic | Without Mortgage | With Mortgage |
| Housing Units | 349 | 441 |
| Median Property Value | $330,400 | $289,300 |
| Median Household Income | $69,886 | $104 |
| Monthly Housing Costs | $946 | $76 |
| Real Estate Taxes | $6,223 | $0 |
Property Value by Mortgage Status in Saugerties
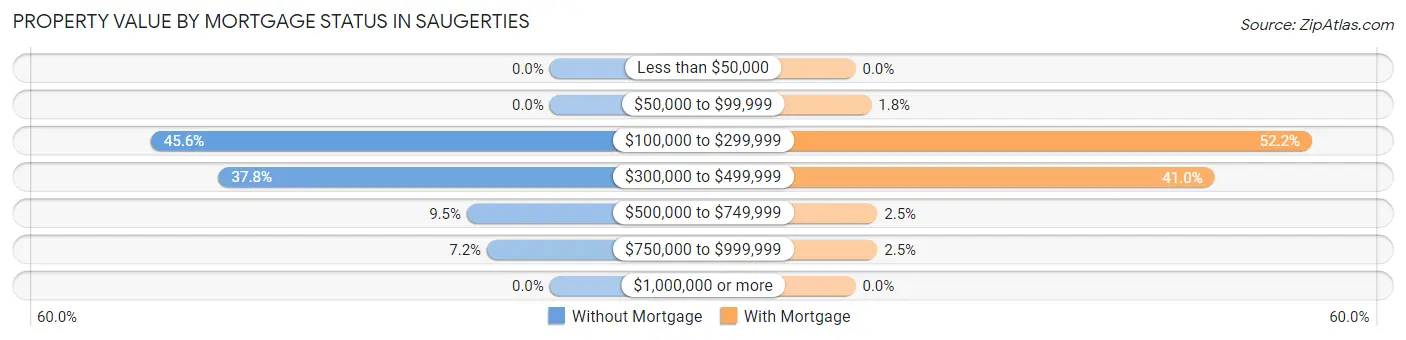
| Property Value | Without Mortgage | With Mortgage |
| Less than $50,000 | 0 (0.0%) | 0 (0.0%) |
| $50,000 to $99,999 | 0 (0.0%) | 8 (1.8%) |
| $100,000 to $299,999 | 159 (45.6%) | 230 (52.1%) |
| $300,000 to $499,999 | 132 (37.8%) | 181 (41.0%) |
| $500,000 to $749,999 | 33 (9.5%) | 11 (2.5%) |
| $750,000 to $999,999 | 25 (7.2%) | 11 (2.5%) |
| $1,000,000 or more | 0 (0.0%) | 0 (0.0%) |
| Total | 349 (100.0%) | 441 (100.0%) |
Household Income by Mortgage Status in Saugerties
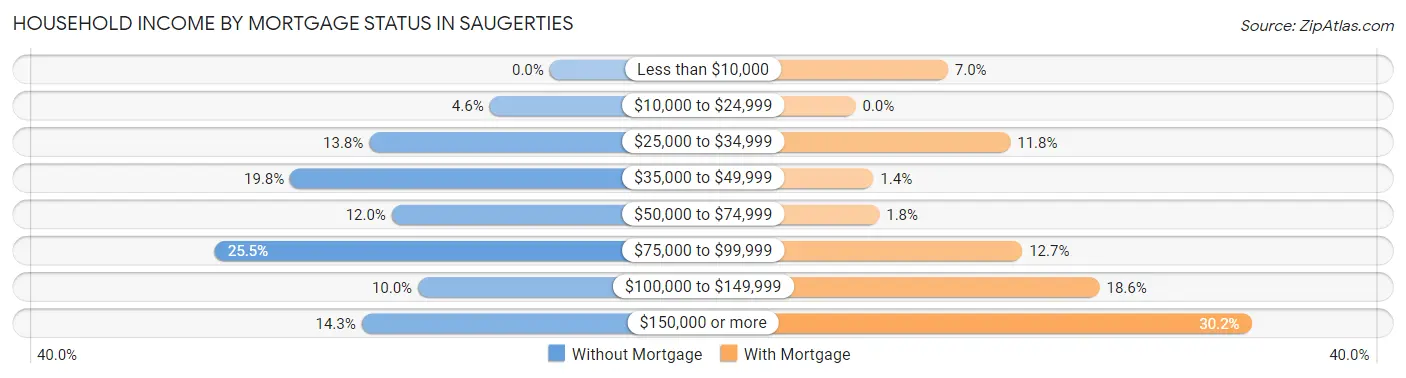
| Household Income | Without Mortgage | With Mortgage |
| Less than $10,000 | 0 (0.0%) | 31 (7.0%) |
| $10,000 to $24,999 | 16 (4.6%) | 0 (0.0%) |
| $25,000 to $34,999 | 48 (13.8%) | 52 (11.8%) |
| $35,000 to $49,999 | 69 (19.8%) | 6 (1.4%) |
| $50,000 to $74,999 | 42 (12.0%) | 8 (1.8%) |
| $75,000 to $99,999 | 89 (25.5%) | 56 (12.7%) |
| $100,000 to $149,999 | 35 (10.0%) | 82 (18.6%) |
| $150,000 or more | 50 (14.3%) | 133 (30.2%) |
| Total | 349 (100.0%) | 441 (100.0%) |
Property Value to Household Income Ratio in Saugerties
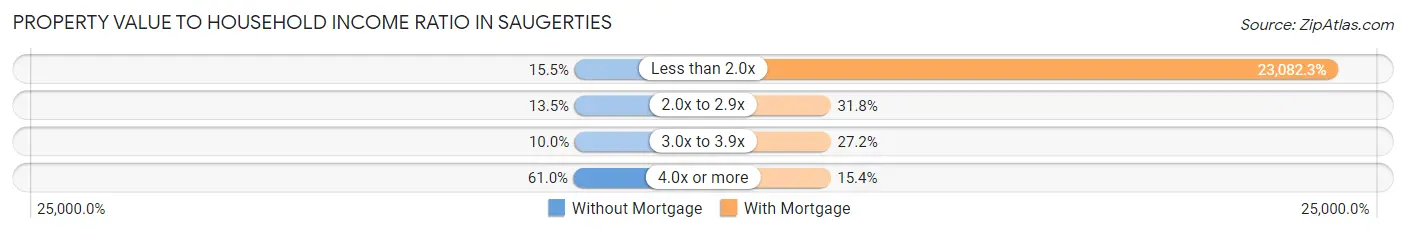
| Value-to-Income Ratio | Without Mortgage | With Mortgage |
| Less than 2.0x | 54 (15.5%) | 101,793 (23,082.3%) |
| 2.0x to 2.9x | 47 (13.5%) | 140 (31.8%) |
| 3.0x to 3.9x | 35 (10.0%) | 120 (27.2%) |
| 4.0x or more | 213 (61.0%) | 68 (15.4%) |
| Total | 349 (100.0%) | 441 (100.0%) |
Real Estate Taxes by Mortgage Status in Saugerties
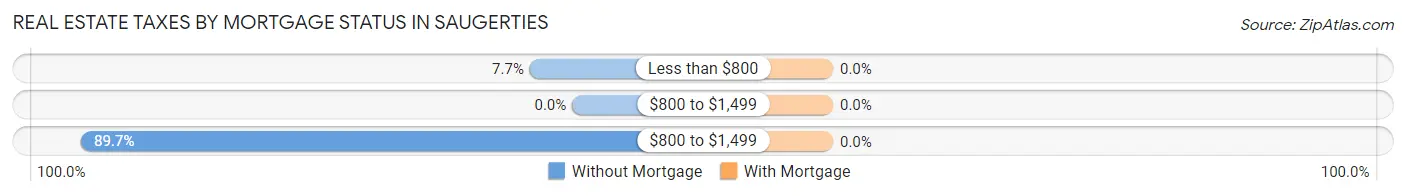
| Property Taxes | Without Mortgage | With Mortgage |
| Less than $800 | 27 (7.7%) | 0 (0.0%) |
| $800 to $1,499 | 0 (0.0%) | 0 (0.0%) |
| $800 to $1,499 | 313 (89.7%) | 0 (0.0%) |
| Total | 349 (100.0%) | 441 (100.0%) |
Health & Disability in Saugerties
Health Insurance Coverage by Age in Saugerties
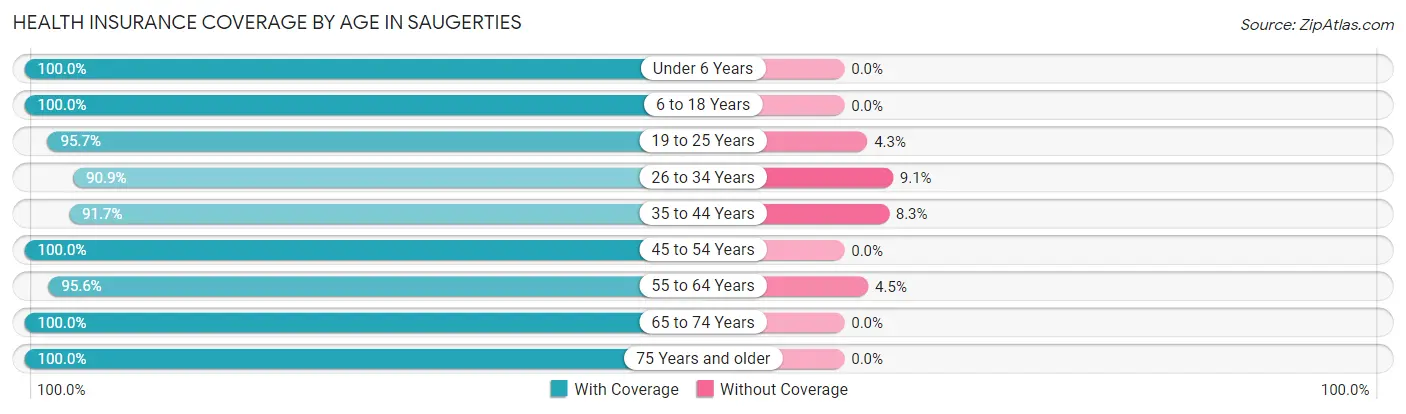
| Age Bracket | With Coverage | Without Coverage |
| Under 6 Years | 181 (100.0%) | 0 (0.0%) |
| 6 to 18 Years | 661 (100.0%) | 0 (0.0%) |
| 19 to 25 Years | 246 (95.7%) | 11 (4.3%) |
| 26 to 34 Years | 301 (90.9%) | 30 (9.1%) |
| 35 to 44 Years | 453 (91.7%) | 41 (8.3%) |
| 45 to 54 Years | 493 (100.0%) | 0 (0.0%) |
| 55 to 64 Years | 494 (95.6%) | 23 (4.4%) |
| 65 to 74 Years | 494 (100.0%) | 0 (0.0%) |
| 75 Years and older | 439 (100.0%) | 0 (0.0%) |
| Total | 3,762 (97.3%) | 105 (2.7%) |
Health Insurance Coverage by Citizenship Status in Saugerties
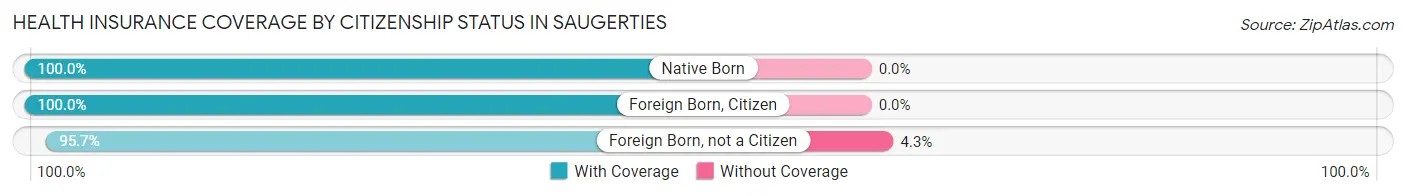
| Citizenship Status | With Coverage | Without Coverage |
| Native Born | 181 (100.0%) | 0 (0.0%) |
| Foreign Born, Citizen | 661 (100.0%) | 0 (0.0%) |
| Foreign Born, not a Citizen | 246 (95.7%) | 11 (4.3%) |
Health Insurance Coverage by Household Income in Saugerties
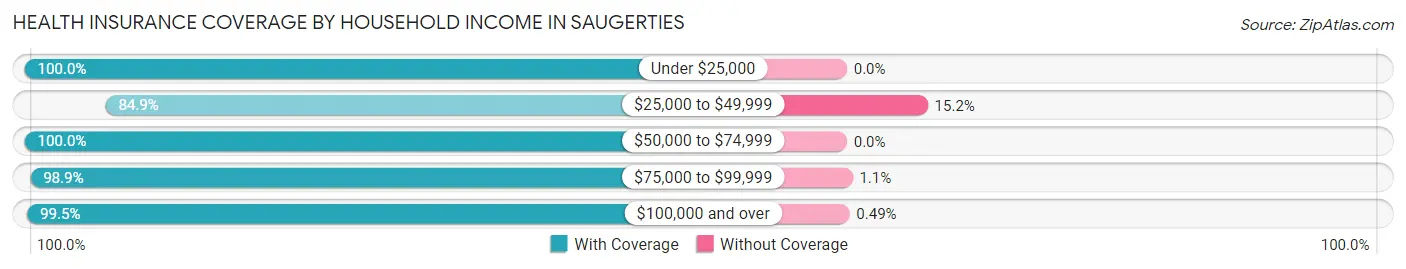
| Household Income | With Coverage | Without Coverage |
| Under $25,000 | 626 (100.0%) | 0 (0.0%) |
| $25,000 to $49,999 | 521 (84.9%) | 93 (15.1%) |
| $50,000 to $74,999 | 656 (100.0%) | 0 (0.0%) |
| $75,000 to $99,999 | 467 (98.9%) | 5 (1.1%) |
| $100,000 and over | 1,423 (99.5%) | 7 (0.5%) |
Public vs Private Health Insurance Coverage by Age in Saugerties
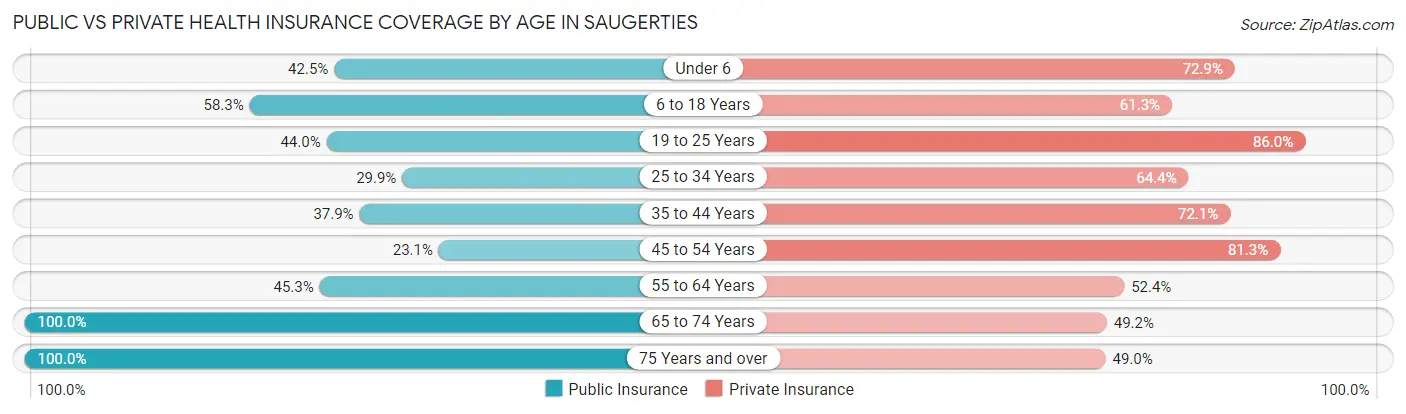
| Age Bracket | Public Insurance | Private Insurance |
| Under 6 | 77 (42.5%) | 132 (72.9%) |
| 6 to 18 Years | 385 (58.3%) | 405 (61.3%) |
| 19 to 25 Years | 113 (44.0%) | 221 (86.0%) |
| 25 to 34 Years | 99 (29.9%) | 213 (64.3%) |
| 35 to 44 Years | 187 (37.9%) | 356 (72.1%) |
| 45 to 54 Years | 114 (23.1%) | 401 (81.3%) |
| 55 to 64 Years | 234 (45.3%) | 271 (52.4%) |
| 65 to 74 Years | 494 (100.0%) | 243 (49.2%) |
| 75 Years and over | 439 (100.0%) | 215 (49.0%) |
| Total | 2,142 (55.4%) | 2,457 (63.5%) |
Disability Status by Sex by Age in Saugerties
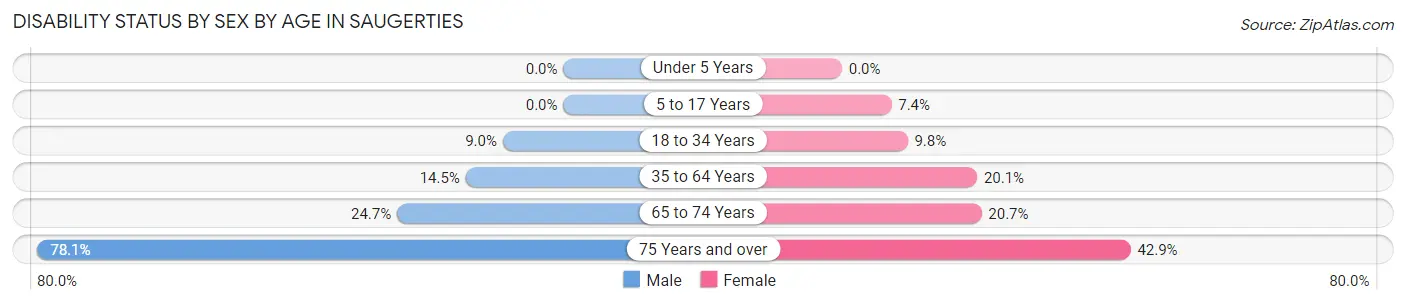
| Age Bracket | Male | Female |
| Under 5 Years | 0 (0.0%) | 0 (0.0%) |
| 5 to 17 Years | 0 (0.0%) | 35 (7.3%) |
| 18 to 34 Years | 33 (9.0%) | 27 (9.8%) |
| 35 to 64 Years | 96 (14.5%) | 169 (20.1%) |
| 65 to 74 Years | 60 (24.7%) | 52 (20.7%) |
| 75 Years and over | 157 (78.1%) | 102 (42.9%) |
Disability Class by Sex by Age in Saugerties
Disability Class: Hearing Difficulty
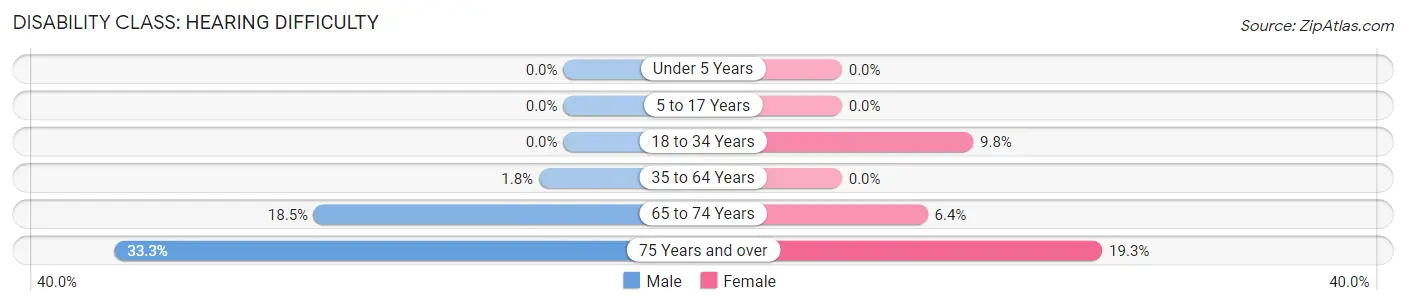
| Age Bracket | Male | Female |
| Under 5 Years | 0 (0.0%) | 0 (0.0%) |
| 5 to 17 Years | 0 (0.0%) | 0 (0.0%) |
| 18 to 34 Years | 0 (0.0%) | 27 (9.8%) |
| 35 to 64 Years | 12 (1.8%) | 0 (0.0%) |
| 65 to 74 Years | 45 (18.5%) | 16 (6.4%) |
| 75 Years and over | 67 (33.3%) | 46 (19.3%) |
Disability Class: Vision Difficulty
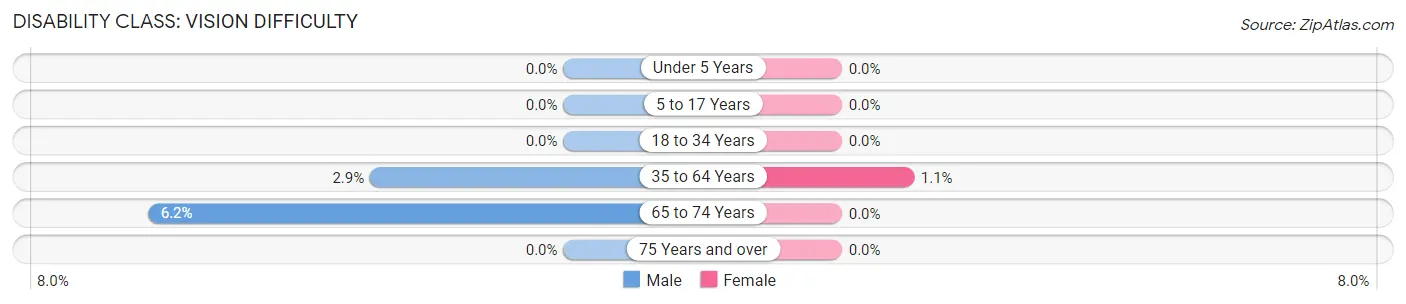
| Age Bracket | Male | Female |
| Under 5 Years | 0 (0.0%) | 0 (0.0%) |
| 5 to 17 Years | 0 (0.0%) | 0 (0.0%) |
| 18 to 34 Years | 0 (0.0%) | 0 (0.0%) |
| 35 to 64 Years | 19 (2.9%) | 9 (1.1%) |
| 65 to 74 Years | 15 (6.2%) | 0 (0.0%) |
| 75 Years and over | 0 (0.0%) | 0 (0.0%) |
Disability Class: Cognitive Difficulty
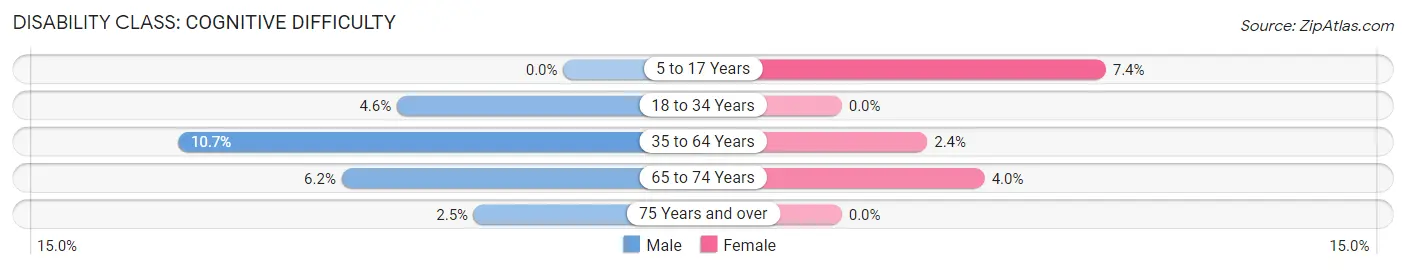
| Age Bracket | Male | Female |
| 5 to 17 Years | 0 (0.0%) | 35 (7.3%) |
| 18 to 34 Years | 17 (4.6%) | 0 (0.0%) |
| 35 to 64 Years | 71 (10.7%) | 20 (2.4%) |
| 65 to 74 Years | 15 (6.2%) | 10 (4.0%) |
| 75 Years and over | 5 (2.5%) | 0 (0.0%) |
Disability Class: Ambulatory Difficulty
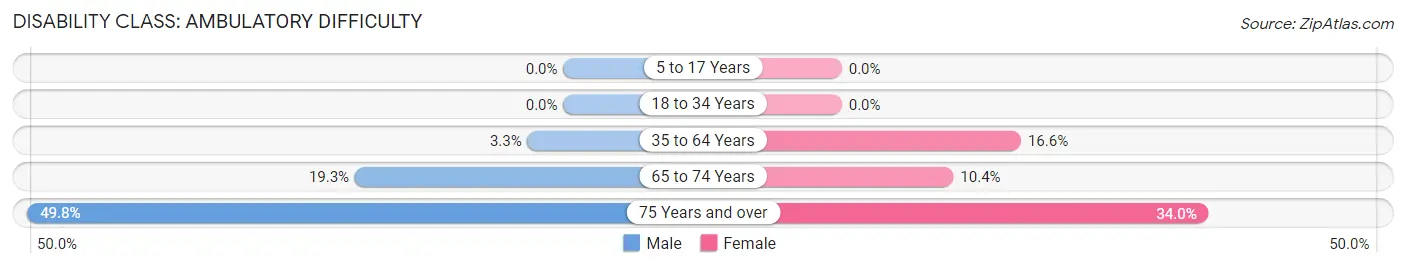
| Age Bracket | Male | Female |
| 5 to 17 Years | 0 (0.0%) | 0 (0.0%) |
| 18 to 34 Years | 0 (0.0%) | 0 (0.0%) |
| 35 to 64 Years | 22 (3.3%) | 140 (16.6%) |
| 65 to 74 Years | 47 (19.3%) | 26 (10.4%) |
| 75 Years and over | 100 (49.7%) | 81 (34.0%) |
Disability Class: Self-Care Difficulty
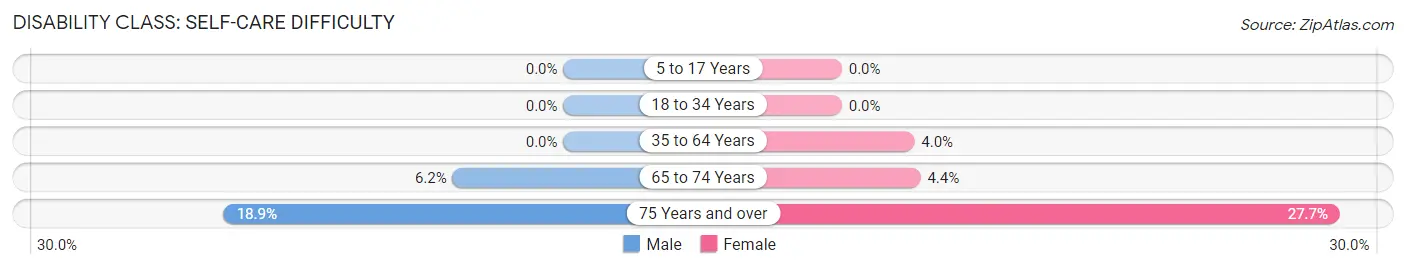
| Age Bracket | Male | Female |
| 5 to 17 Years | 0 (0.0%) | 0 (0.0%) |
| 18 to 34 Years | 0 (0.0%) | 0 (0.0%) |
| 35 to 64 Years | 0 (0.0%) | 34 (4.0%) |
| 65 to 74 Years | 15 (6.2%) | 11 (4.4%) |
| 75 Years and over | 38 (18.9%) | 66 (27.7%) |
Technology Access in Saugerties
Computing Device Access in Saugerties
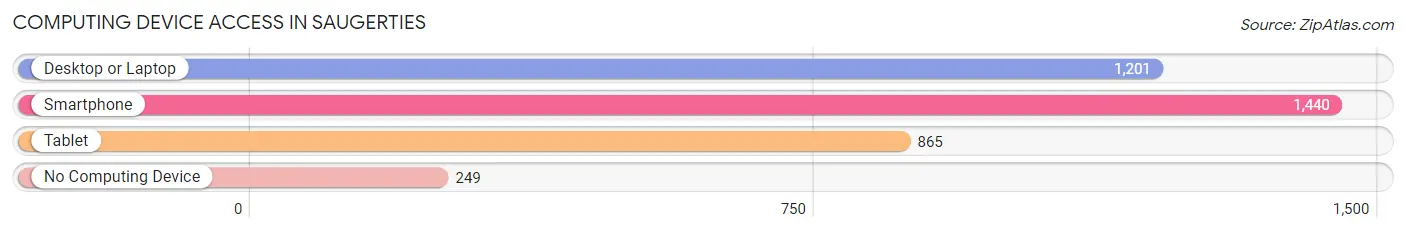
| Device Type | # Households | % Households |
| Desktop or Laptop | 1,201 | 65.6% |
| Smartphone | 1,440 | 78.6% |
| Tablet | 865 | 47.2% |
| No Computing Device | 249 | 13.6% |
| Total | 1,832 | 100.0% |
Internet Access in Saugerties
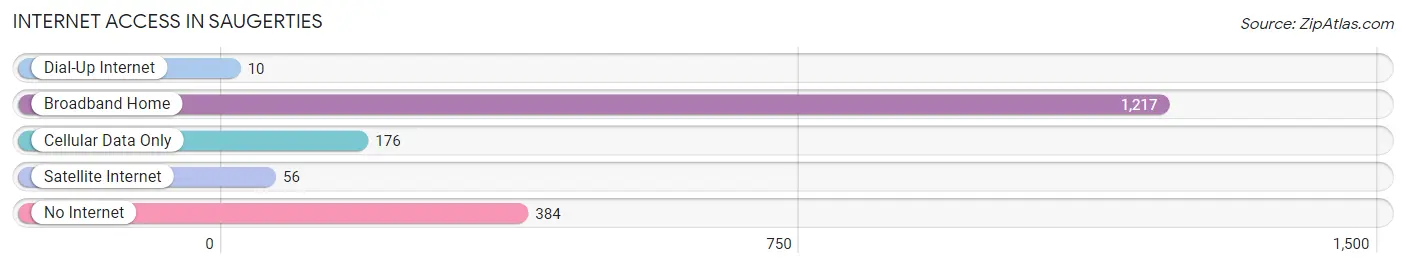
| Internet Type | # Households | % Households |
| Dial-Up Internet | 10 | 0.5% |
| Broadband Home | 1,217 | 66.4% |
| Cellular Data Only | 176 | 9.6% |
| Satellite Internet | 56 | 3.1% |
| No Internet | 384 | 21.0% |
| Total | 1,832 | 100.0% |
Saugerties Summary
Saugerties is a town located in Ulster County, New York, United States. It is situated on the Hudson River, about 90 miles north of New York City. The town is part of the Catskill Mountains region and is home to a variety of outdoor activities, including hiking, fishing, and camping. The town has a population of approximately 19,000 people and covers an area of approximately 50 square miles.
History
The area that is now Saugerties was originally inhabited by the Esopus Indians, who were part of the larger Iroquois Confederacy. The first European settlers arrived in the area in the late 17th century, and the town was officially established in 1797. The town was named after the Dutch word for “salt marsh”, and the area was known for its salt production.
In the 19th century, the town became a popular destination for wealthy New Yorkers looking to escape the hustle and bustle of the city. The town was home to several large estates, including the estate of William B. Astor, which is now the site of the Astor Historic District.
Geography
Saugerties is located in the Hudson Valley region of New York, about 90 miles north of New York City. The town is situated on the Hudson River, and is bordered by the towns of Woodstock to the north, Kingston to the east, and Catskill to the south. The town is part of the Catskill Mountains region, and is home to a variety of outdoor activities, including hiking, fishing, and camping.
The town has a total area of 50.2 square miles, of which 49.7 square miles is land and 0.5 square miles is water. The town is home to several small lakes, including Lake Katrine, Lake Minnewaska, and Lake Mohonk.
Economy
The economy of Saugerties is largely based on tourism and agriculture. The town is home to several popular tourist attractions, including the Astor Historic District, the Saugerties Lighthouse, and the Catskill Mountain Railroad. The town is also home to several wineries and breweries, as well as a variety of outdoor activities, such as hiking, fishing, and camping.
Agriculture is also an important part of the local economy. The town is home to several farms, which produce a variety of crops, including apples, peaches, and strawberries.
Demographics
As of the 2010 census, the town had a population of 19,224 people. The racial makeup of the town was 94.2% White, 2.2% African American, 0.4% Native American, 0.9% Asian, 0.1% Pacific Islander, 0.7% from other races, and 1.5% from two or more races. Hispanic or Latino of any race were 3.2% of the population.
The median household income in the town was $50,945, and the median family income was $60,945. The per capita income for the town was $25,945. About 8.2% of families and 10.7% of the population were below the poverty line, including 15.2% of those under age 18 and 6.2% of those age 65 or over.
Common Questions
What is Per Capita Income in Saugerties?
Per Capita income in Saugerties is $34,153.
What is the Median Family Income in Saugerties?
Median Family Income in Saugerties is $89,336.
What is the Median Household income in Saugerties?
Median Household Income in Saugerties is $52,703.
What is Income or Wage Gap in Saugerties?
Income or Wage Gap in Saugerties is 20.9%.
Women in Saugerties earn 79.1 cents for every dollar earned by a man.
What is Inequality or Gini Index in Saugerties?
Inequality or Gini Index in Saugerties is 0.46.
What is the Total Population of Saugerties?
Total Population of Saugerties is 3,892.
What is the Total Male Population of Saugerties?
Total Male Population of Saugerties is 1,741.
What is the Total Female Population of Saugerties?
Total Female Population of Saugerties is 2,151.
What is the Ratio of Males per 100 Females in Saugerties?
There are 80.94 Males per 100 Females in Saugerties.
What is the Ratio of Females per 100 Males in Saugerties?
There are 123.55 Females per 100 Males in Saugerties.
What is the Median Population Age in Saugerties?
Median Population Age in Saugerties is 45.2 Years.
What is the Average Family Size in Saugerties
Average Family Size in Saugerties is 3.5 People.
What is the Average Household Size in Saugerties
Average Household Size in Saugerties is 2.1 People.
How Large is the Labor Force in Saugerties?
There are 1,910 People in the Labor Forcein in Saugerties.
What is the Percentage of People in the Labor Force in Saugerties?
59.2% of People are in the Labor Force in Saugerties.
What is the Unemployment Rate in Saugerties?
Unemployment Rate in Saugerties is 3.4%.