Rock Hill, NY Map & Demographics
Rock Hill Map
Rock Hill Overview
$86,009
PER CAPITA INCOME
$152,865
AVG FAMILY INCOME
$108,333
AVG HOUSEHOLD INCOME
53.2%
WAGE / INCOME GAP [ % ]
46.8¢/ $1
WAGE / INCOME GAP [ $ ]
0.55
INEQUALITY / GINI INDEX
2,384
TOTAL POPULATION
1,231
MALE POPULATION
1,153
FEMALE POPULATION
106.76
MALES / 100 FEMALES
93.66
FEMALES / 100 MALES
50.5
MEDIAN AGE
3.1
AVG FAMILY SIZE
2.6
AVG HOUSEHOLD SIZE
1,049
LABOR FORCE [ PEOPLE ]
52.7%
PERCENT IN LABOR FORCE
8.2%
UNEMPLOYMENT RATE
Rock Hill Zip Codes
Rock Hill Area Codes
Income in Rock Hill
Income Overview in Rock Hill
Per Capita Income in Rock Hill is $86,009, while median incomes of families and households are $152,865 and $108,333 respectively.
| Characteristic | Number | Measure |
| Per Capita Income | 2,384 | $86,009 |
| Median Family Income | 631 | $152,865 |
| Mean Family Income | 631 | $259,775 |
| Median Household Income | 910 | $108,333 |
| Mean Household Income | 910 | $210,662 |
| Income Deficit | 631 | $0 |
| Wage / Income Gap (%) | 2,384 | 53.23% |
| Wage / Income Gap ($) | 2,384 | 46.77¢ per $1 |
| Gini / Inequality Index | 2,384 | 0.55 |
Earnings by Sex in Rock Hill
Average Earnings in Rock Hill are $55,179, $76,875 for men and $35,956 for women, a difference of 53.2%.

| Sex | Number | Average Earnings |
| Male | 597 (50.5%) | $76,875 |
| Female | 585 (49.5%) | $35,956 |
| Total | 1,182 (100.0%) | $55,179 |
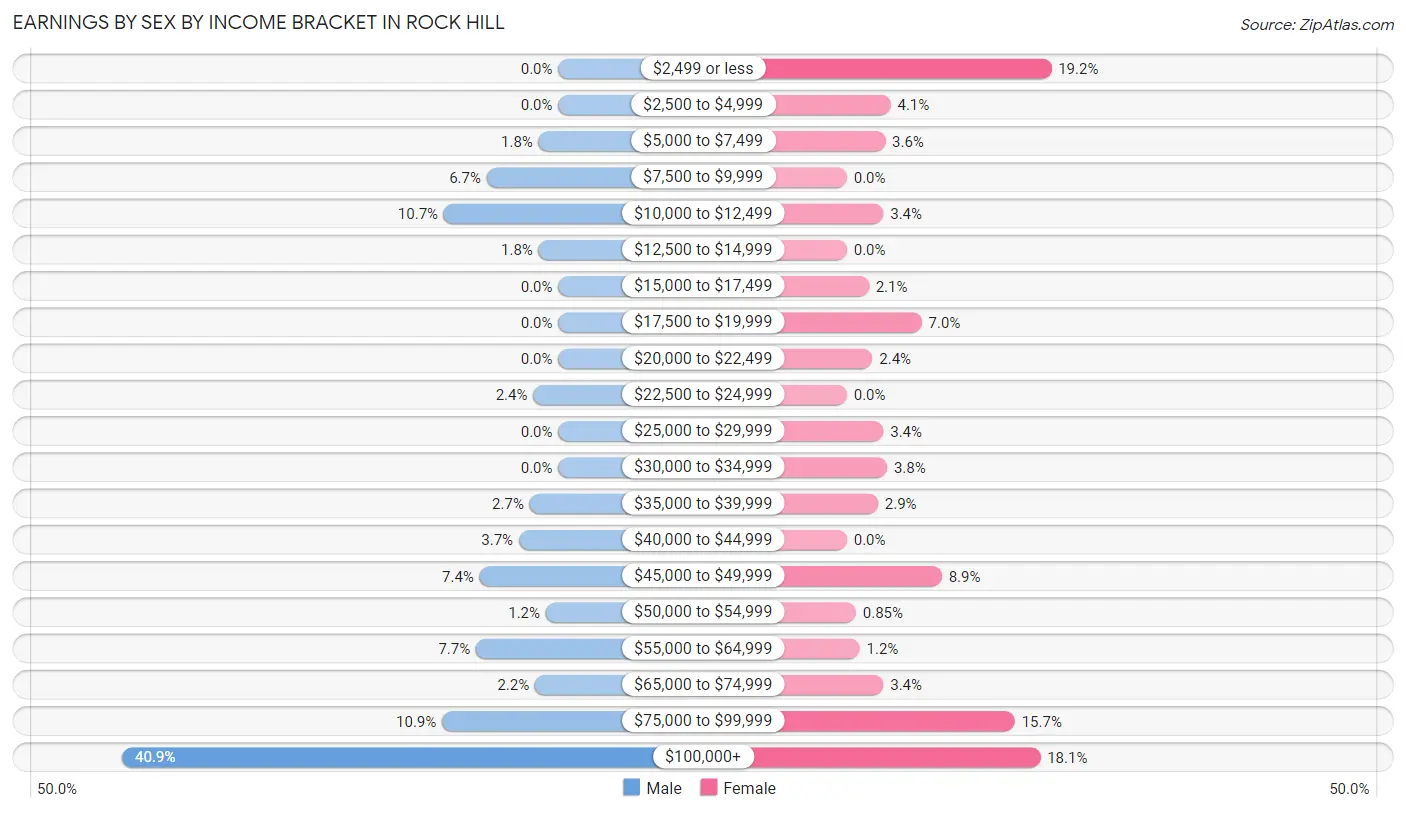
Earnings by Sex by Income Bracket in Rock Hill
The most common earnings brackets in Rock Hill are $100,000+ for men (244 | 40.9%) and $2,499 or less for women (112 | 19.2%).
| Income | Male | Female |
| $2,499 or less | 0 (0.0%) | 112 (19.2%) |
| $2,500 to $4,999 | 0 (0.0%) | 24 (4.1%) |
| $5,000 to $7,499 | 11 (1.8%) | 21 (3.6%) |
| $7,500 to $9,999 | 40 (6.7%) | 0 (0.0%) |
| $10,000 to $12,499 | 64 (10.7%) | 20 (3.4%) |
| $12,500 to $14,999 | 11 (1.8%) | 0 (0.0%) |
| $15,000 to $17,499 | 0 (0.0%) | 12 (2.1%) |
| $17,500 to $19,999 | 0 (0.0%) | 41 (7.0%) |
| $20,000 to $22,499 | 0 (0.0%) | 14 (2.4%) |
| $22,500 to $24,999 | 14 (2.4%) | 0 (0.0%) |
| $25,000 to $29,999 | 0 (0.0%) | 20 (3.4%) |
| $30,000 to $34,999 | 0 (0.0%) | 22 (3.8%) |
| $35,000 to $39,999 | 16 (2.7%) | 17 (2.9%) |
| $40,000 to $44,999 | 22 (3.7%) | 0 (0.0%) |
| $45,000 to $49,999 | 44 (7.4%) | 52 (8.9%) |
| $50,000 to $54,999 | 7 (1.2%) | 5 (0.9%) |
| $55,000 to $64,999 | 46 (7.7%) | 7 (1.2%) |
| $65,000 to $74,999 | 13 (2.2%) | 20 (3.4%) |
| $75,000 to $99,999 | 65 (10.9%) | 92 (15.7%) |
| $100,000+ | 244 (40.9%) | 106 (18.1%) |
| Total | 597 (100.0%) | 585 (100.0%) |
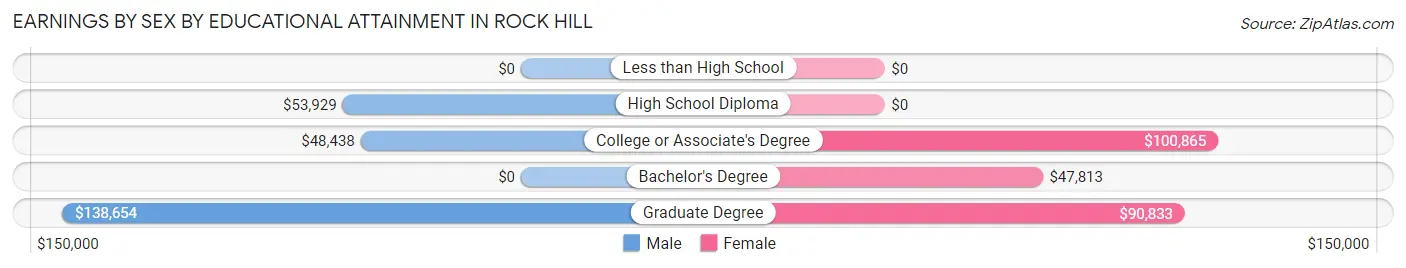
Earnings by Sex by Educational Attainment in Rock Hill
Average earnings in Rock Hill are $80,357 for men and $48,854 for women, a difference of 39.2%. Men with an educational attainment of graduate degree enjoy the highest average annual earnings of $138,654, while those with college or associate's degree education earn the least with $48,438. Women with an educational attainment of college or associate's degree earn the most with the average annual earnings of $100,865, while those with bachelor's degree education have the smallest earnings of $47,813.
| Educational Attainment | Male Income | Female Income |
| Less than High School | - | - |
| High School Diploma | $53,929 | $0 |
| College or Associate's Degree | $48,438 | $100,865 |
| Bachelor's Degree | - | - |
| Graduate Degree | $138,654 | $90,833 |
| Total | $80,357 | $48,854 |
Family Income in Rock Hill
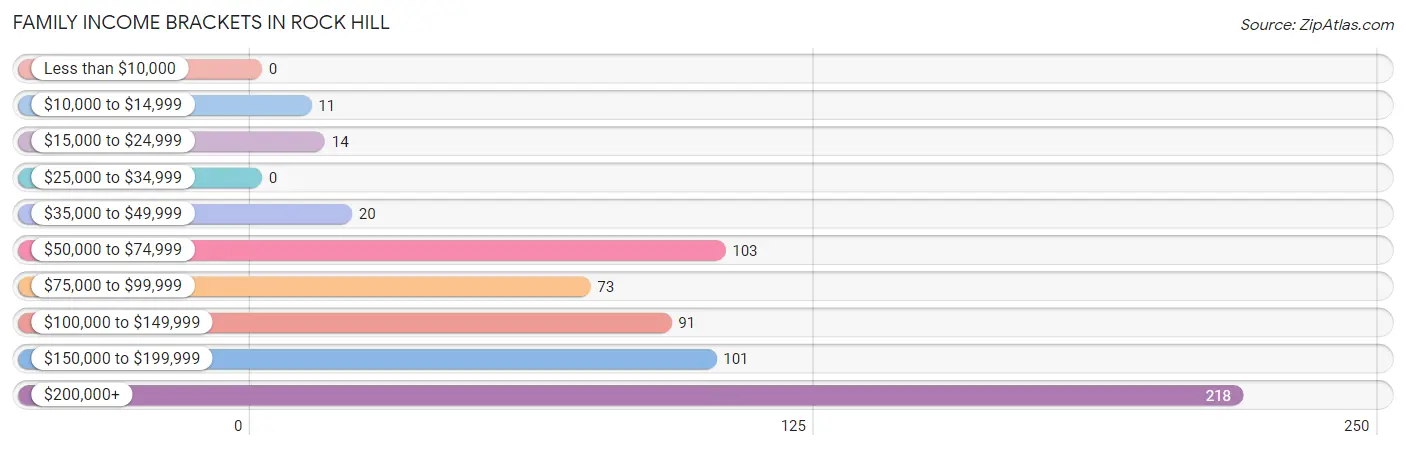
Family Income Brackets in Rock Hill
According to the Rock Hill family income data, there are 218 families falling into the $200,000+ income range, which is the most common income bracket and makes up 34.5% of all families.
| Income Bracket | # Families | % Families |
| Less than $10,000 | 0 | 0.0% |
| $10,000 to $14,999 | 11 | 1.7% |
| $15,000 to $24,999 | 14 | 2.2% |
| $25,000 to $34,999 | 0 | 0.0% |
| $35,000 to $49,999 | 20 | 3.2% |
| $50,000 to $74,999 | 103 | 16.3% |
| $75,000 to $99,999 | 73 | 11.6% |
| $100,000 to $149,999 | 91 | 14.4% |
| $150,000 to $199,999 | 101 | 16.0% |
| $200,000+ | 218 | 34.5% |
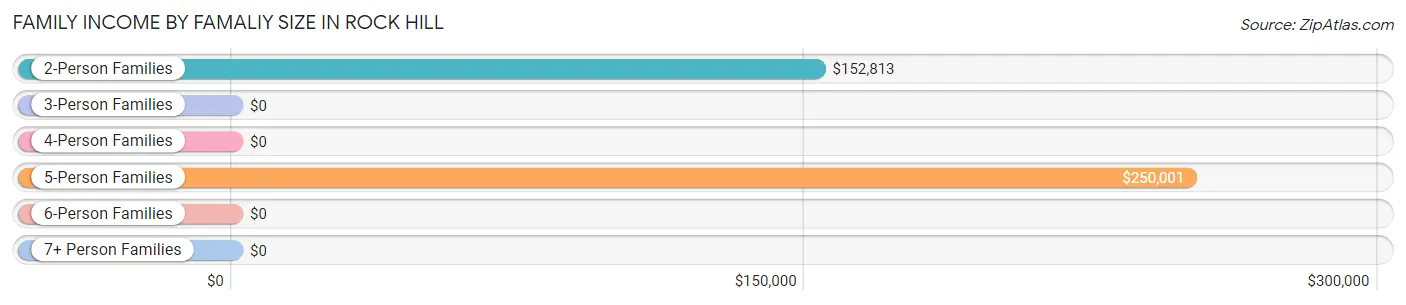
Family Income by Famaliy Size in Rock Hill
5-person families (33 | 5.2%) account for the highest median family income in Rock Hill with $250,001 per family, while 2-person families (316 | 50.1%) have the highest median income of $76,406 per family member.
| Income Bracket | # Families | Median Income |
| 2-Person Families | 316 (50.1%) | $152,813 |
| 3-Person Families | 98 (15.5%) | $0 |
| 4-Person Families | 171 (27.1%) | $0 |
| 5-Person Families | 33 (5.2%) | $250,001 |
| 6-Person Families | 13 (2.1%) | $0 |
| 7+ Person Families | 0 (0.0%) | $0 |
| Total | 631 (100.0%) | $152,865 |
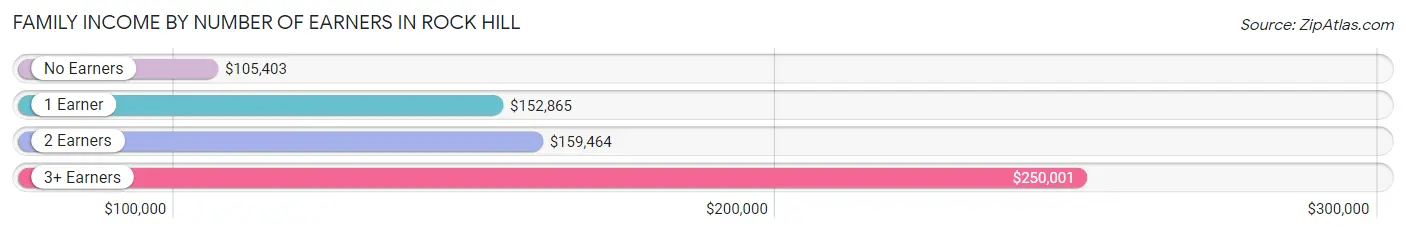
Family Income by Number of Earners in Rock Hill
The median family income in Rock Hill is $152,865, with families comprising 3+ earners (82) having the highest median family income of $250,001, while families with no earners (94) have the lowest median family income of $105,403, accounting for 13.0% and 14.9% of families, respectively.
| Number of Earners | # Families | Median Income |
| No Earners | 94 (14.9%) | $105,403 |
| 1 Earner | 191 (30.3%) | $152,865 |
| 2 Earners | 264 (41.8%) | $159,464 |
| 3+ Earners | 82 (13.0%) | $250,001 |
| Total | 631 (100.0%) | $152,865 |
Household Income in Rock Hill
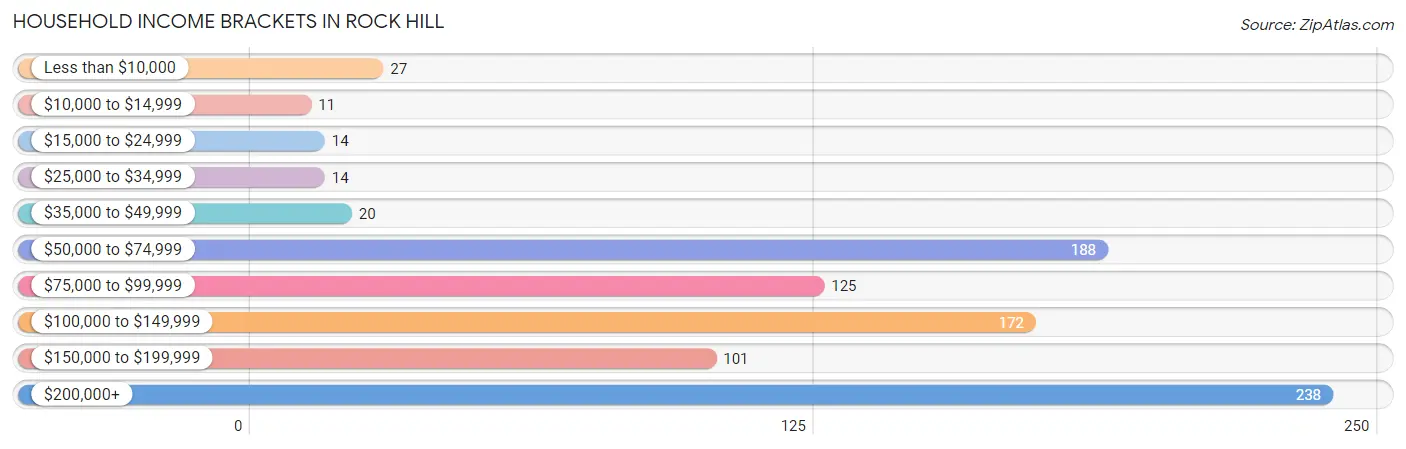
Household Income Brackets in Rock Hill
With 238 households falling in the category, the $200,000+ income range is the most frequent in Rock Hill, accounting for 26.2% of all households. In contrast, only 11 households (1.2%) fall into the $10,000 to $14,999 income bracket, making it the least populous group.
| Income Bracket | # Households | % Households |
| Less than $10,000 | 27 | 3.0% |
| $10,000 to $14,999 | 11 | 1.2% |
| $15,000 to $24,999 | 14 | 1.5% |
| $25,000 to $34,999 | 14 | 1.5% |
| $35,000 to $49,999 | 20 | 2.2% |
| $50,000 to $74,999 | 188 | 20.7% |
| $75,000 to $99,999 | 125 | 13.7% |
| $100,000 to $149,999 | 172 | 18.9% |
| $150,000 to $199,999 | 101 | 11.1% |
| $200,000+ | 238 | 26.2% |
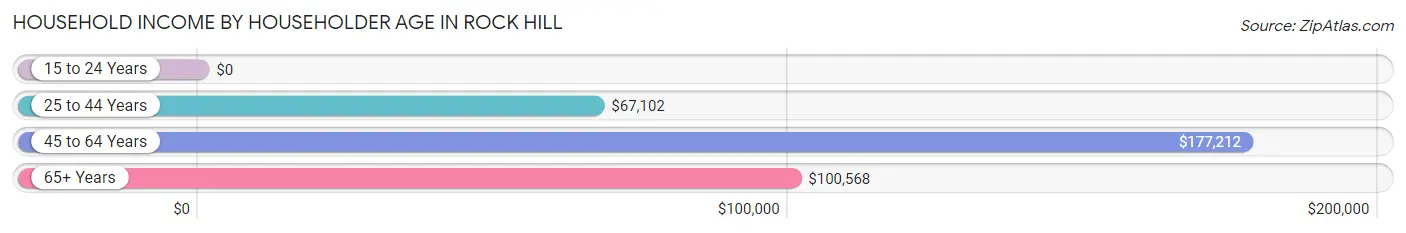
Household Income by Householder Age in Rock Hill
The median household income in Rock Hill is $108,333, with the highest median household income of $177,212 found in the 45 to 64 years age bracket for the primary householder. A total of 295 households (32.4%) fall into this category.
| Income Bracket | # Households | Median Income |
| 15 to 24 Years | 0 (0.0%) | $0 |
| 25 to 44 Years | 198 (21.8%) | $67,102 |
| 45 to 64 Years | 295 (32.4%) | $177,212 |
| 65+ Years | 417 (45.8%) | $100,568 |
| Total | 910 (100.0%) | $108,333 |
Poverty in Rock Hill
Income Below Poverty by Sex and Age in Rock Hill
With 3.0% poverty level for males and 5.6% for females among the residents of Rock Hill, under 5 year old males and under 5 year old females are the most vulnerable to poverty, with 12 males (13.8%) and 13 females (23.2%) in their respective age groups living below the poverty level.
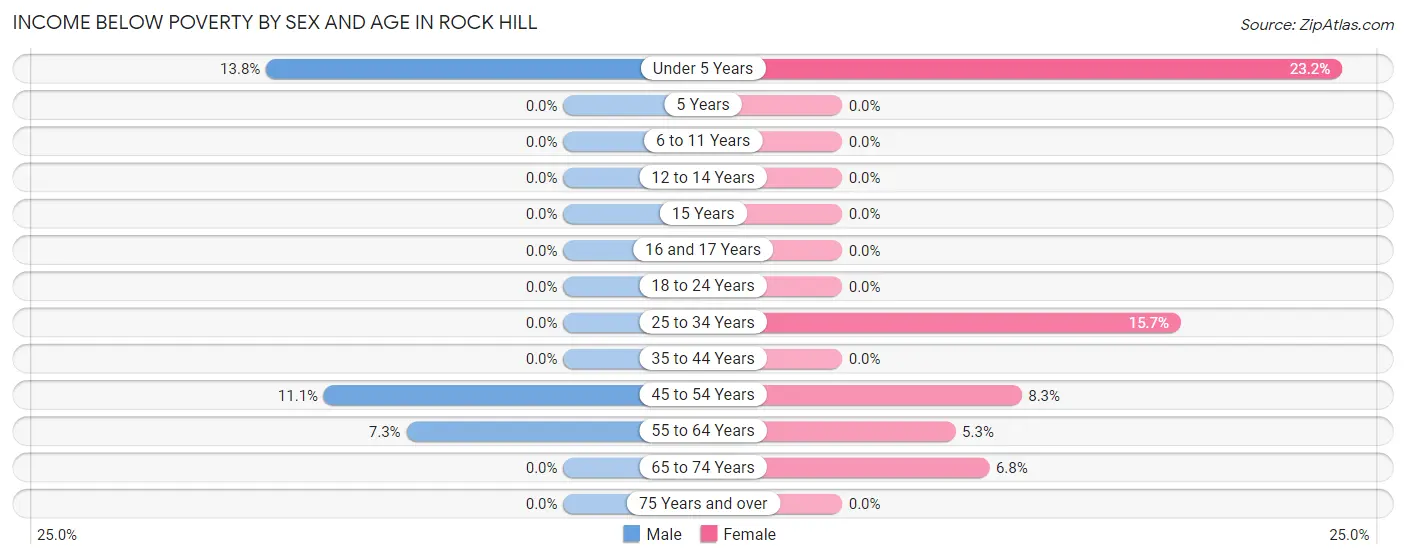
| Age Bracket | Male | Female |
| Under 5 Years | 12 (13.8%) | 13 (23.2%) |
| 5 Years | 0 (0.0%) | 0 (0.0%) |
| 6 to 11 Years | 0 (0.0%) | 0 (0.0%) |
| 12 to 14 Years | 0 (0.0%) | 0 (0.0%) |
| 15 Years | 0 (0.0%) | 0 (0.0%) |
| 16 and 17 Years | 0 (0.0%) | 0 (0.0%) |
| 18 to 24 Years | 0 (0.0%) | 0 (0.0%) |
| 25 to 34 Years | 0 (0.0%) | 14 (15.7%) |
| 35 to 44 Years | 0 (0.0%) | 0 (0.0%) |
| 45 to 54 Years | 14 (11.1%) | 17 (8.3%) |
| 55 to 64 Years | 11 (7.3%) | 10 (5.3%) |
| 65 to 74 Years | 0 (0.0%) | 11 (6.8%) |
| 75 Years and over | 0 (0.0%) | 0 (0.0%) |
| Total | 37 (3.0%) | 65 (5.6%) |
Income Above Poverty by Sex and Age in Rock Hill
According to the poverty statistics in Rock Hill, males aged 5 years and females aged 6 to 11 years are the age groups that are most secure financially, with 100.0% of males and 100.0% of females in these age groups living above the poverty line.
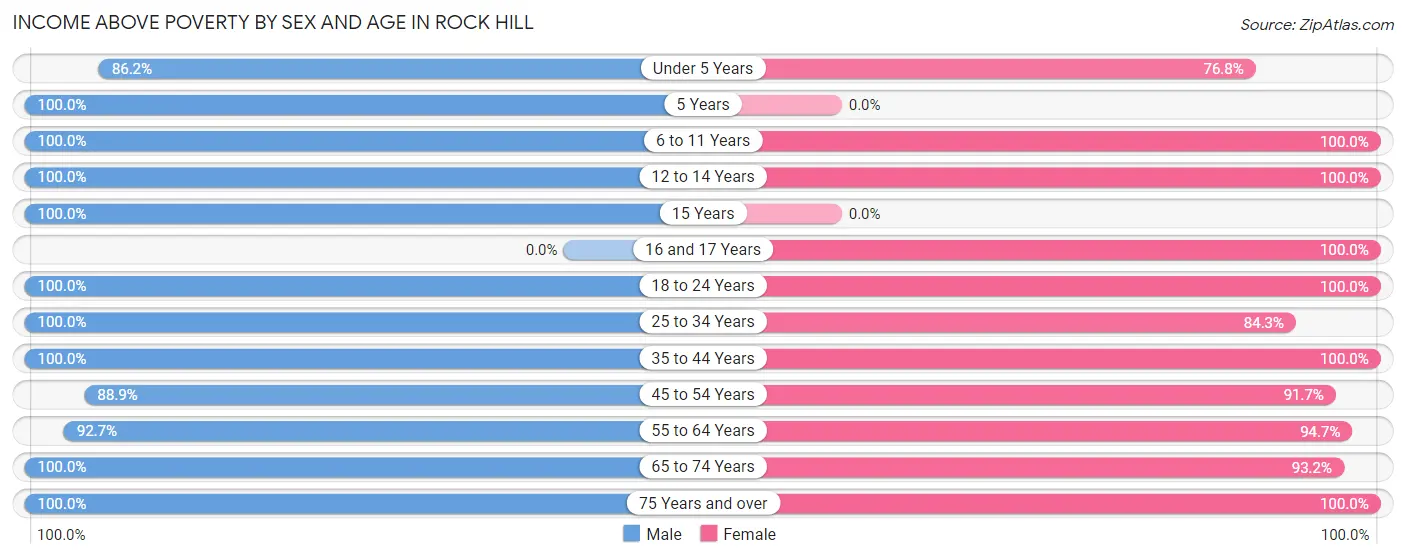
| Age Bracket | Male | Female |
| Under 5 Years | 75 (86.2%) | 43 (76.8%) |
| 5 Years | 11 (100.0%) | 0 (0.0%) |
| 6 to 11 Years | 34 (100.0%) | 71 (100.0%) |
| 12 to 14 Years | 11 (100.0%) | 39 (100.0%) |
| 15 Years | 81 (100.0%) | 0 (0.0%) |
| 16 and 17 Years | 0 (0.0%) | 48 (100.0%) |
| 18 to 24 Years | 11 (100.0%) | 55 (100.0%) |
| 25 to 34 Years | 176 (100.0%) | 75 (84.3%) |
| 35 to 44 Years | 148 (100.0%) | 83 (100.0%) |
| 45 to 54 Years | 112 (88.9%) | 187 (91.7%) |
| 55 to 64 Years | 140 (92.7%) | 180 (94.7%) |
| 65 to 74 Years | 224 (100.0%) | 150 (93.2%) |
| 75 Years and over | 162 (100.0%) | 157 (100.0%) |
| Total | 1,185 (97.0%) | 1,088 (94.4%) |
Income Below Poverty Among Married-Couple Families in Rock Hill
The poverty statistics for married-couple families in Rock Hill show that 2.0% or 11 of the total 548 families live below the poverty line. Families with no children have the highest poverty rate of 3.1%, comprising of 11 families. On the other hand, families with 1 or 2 children have the lowest poverty rate of 0.0%, which includes 0 families.
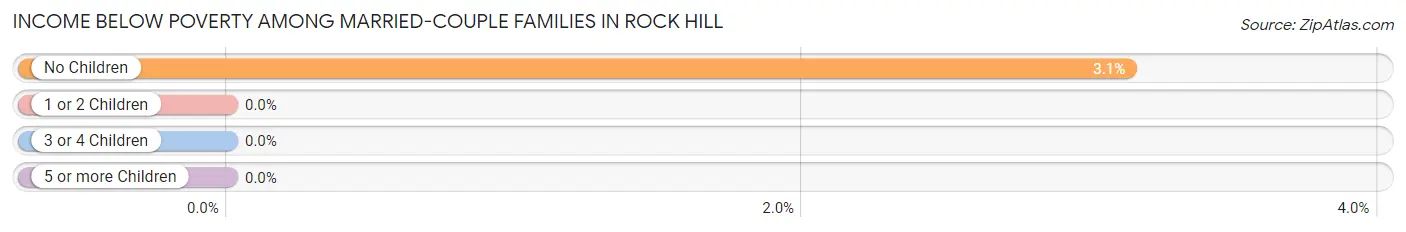
| Children | Above Poverty | Below Poverty |
| No Children | 340 (96.9%) | 11 (3.1%) |
| 1 or 2 Children | 184 (100.0%) | 0 (0.0%) |
| 3 or 4 Children | 13 (100.0%) | 0 (0.0%) |
| 5 or more Children | 0 (0.0%) | 0 (0.0%) |
| Total | 537 (98.0%) | 11 (2.0%) |
Income Below Poverty Among Single-Parent Households in Rock Hill
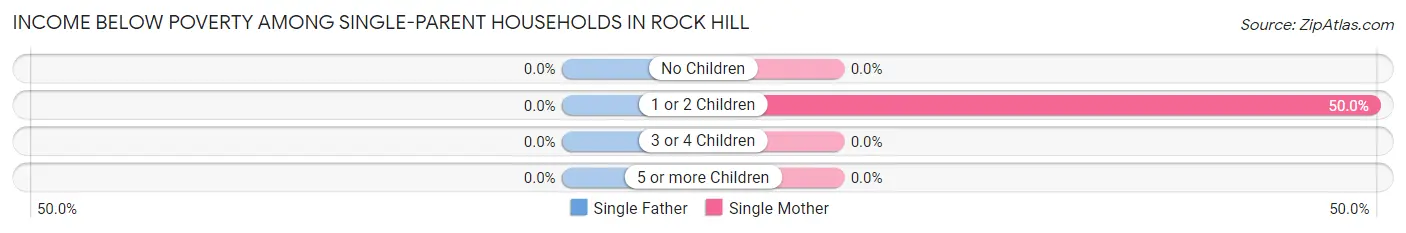
| Children | Single Father | Single Mother |
| No Children | 0 (0.0%) | 0 (0.0%) |
| 1 or 2 Children | 0 (0.0%) | 14 (50.0%) |
| 3 or 4 Children | 0 (0.0%) | 0 (0.0%) |
| 5 or more Children | 0 (0.0%) | 0 (0.0%) |
| Total | 0 (0.0%) | 14 (20.0%) |
Income Below Poverty Among Married-Couple vs Single-Parent Households in Rock Hill
The poverty data for Rock Hill shows that 11 of the married-couple family households (2.0%) and 14 of the single-parent households (16.9%) are living below the poverty level. Within the married-couple family households, those with no children have the highest poverty rate, with 11 households (3.1%) falling below the poverty line. Among the single-parent households, those with 1 or 2 children have the highest poverty rate, with 14 household (50.0%) living below poverty.
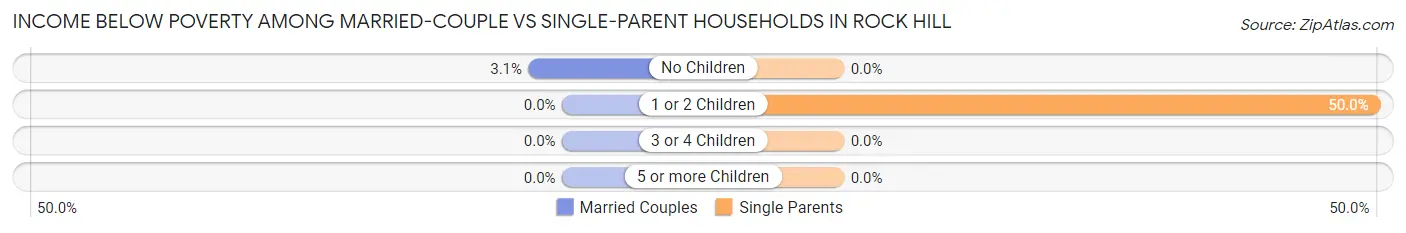
| Children | Married-Couple Families | Single-Parent Households |
| No Children | 11 (3.1%) | 0 (0.0%) |
| 1 or 2 Children | 0 (0.0%) | 14 (50.0%) |
| 3 or 4 Children | 0 (0.0%) | 0 (0.0%) |
| 5 or more Children | 0 (0.0%) | 0 (0.0%) |
| Total | 11 (2.0%) | 14 (16.9%) |
Race in Rock Hill
The most populous races in Rock Hill are White / Caucasian (1,864 | 78.2%), Hispanic or Latino (429 | 18.0%), and Some other Race (213 | 8.9%).
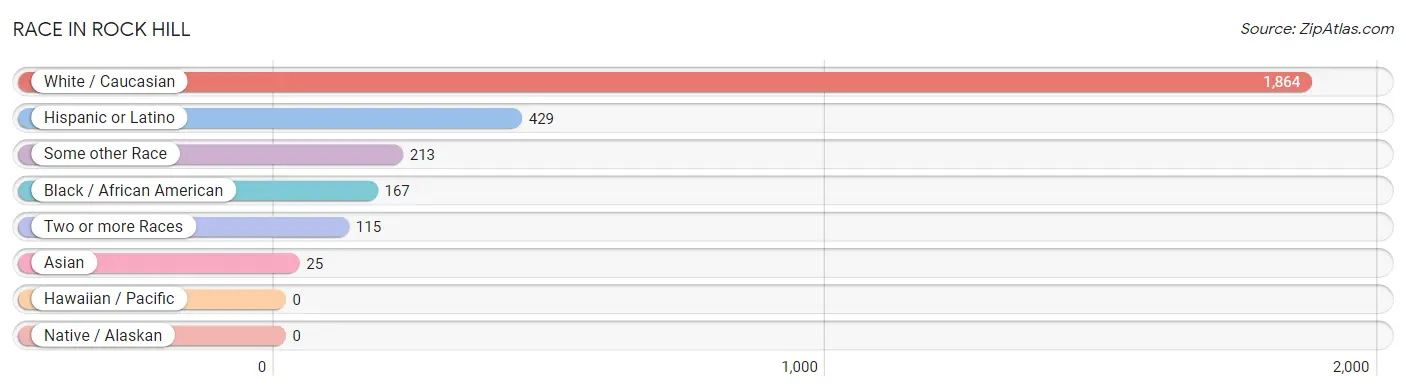
| Race | # Population | % Population |
| Asian | 25 | 1.1% |
| Black / African American | 167 | 7.0% |
| Hawaiian / Pacific | 0 | 0.0% |
| Hispanic or Latino | 429 | 18.0% |
| Native / Alaskan | 0 | 0.0% |
| White / Caucasian | 1,864 | 78.2% |
| Two or more Races | 115 | 4.8% |
| Some other Race | 213 | 8.9% |
| Total | 2,384 | 100.0% |
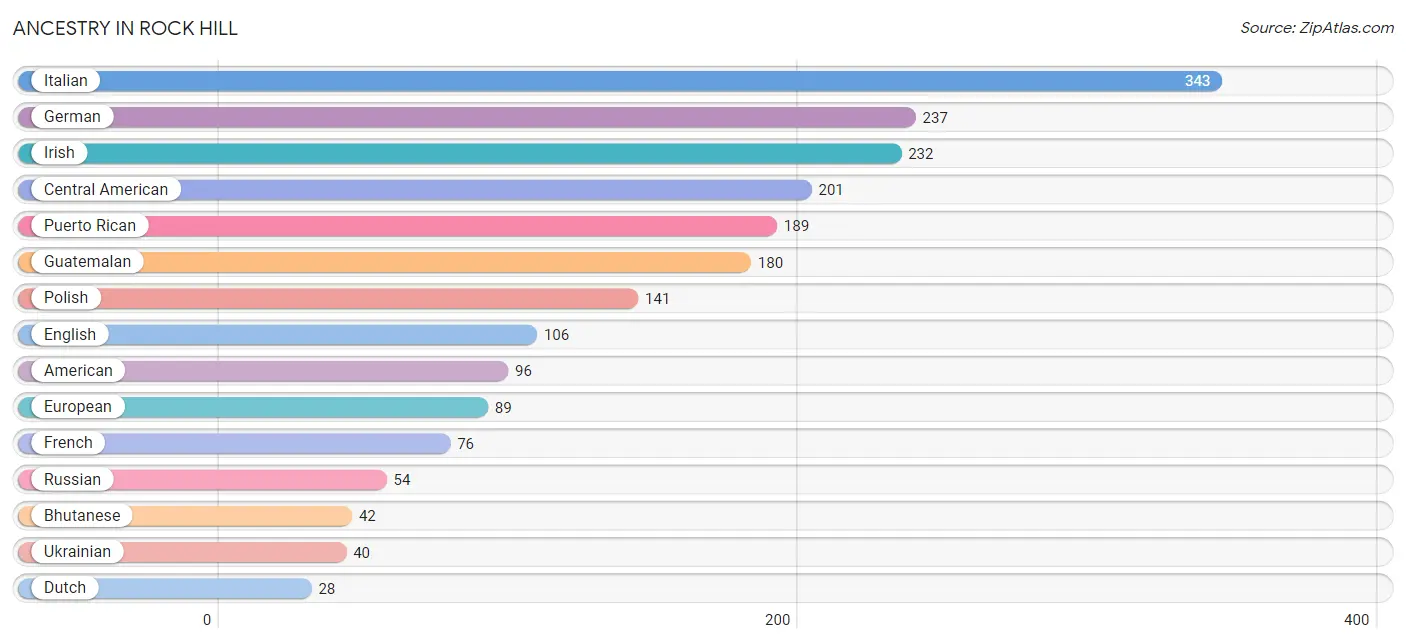
Ancestry in Rock Hill
The most populous ancestries reported in Rock Hill are Italian (343 | 14.4%), German (237 | 9.9%), Irish (232 | 9.7%), Central American (201 | 8.4%), and Puerto Rican (189 | 7.9%), together accounting for 50.4% of all Rock Hill residents.
| Ancestry | # Population | % Population |
| African | 8 | 0.3% |
| American | 96 | 4.0% |
| Bhutanese | 42 | 1.8% |
| Blackfeet | 12 | 0.5% |
| British | 12 | 0.5% |
| Central American | 201 | 8.4% |
| Danish | 14 | 0.6% |
| Dutch | 28 | 1.2% |
| Ecuadorian | 11 | 0.5% |
| English | 106 | 4.4% |
| European | 89 | 3.7% |
| French | 76 | 3.2% |
| German | 237 | 9.9% |
| Greek | 8 | 0.3% |
| Guatemalan | 180 | 7.5% |
| Hungarian | 26 | 1.1% |
| Indian (Asian) | 6 | 0.3% |
| Irish | 232 | 9.7% |
| Italian | 343 | 14.4% |
| Jamaican | 16 | 0.7% |
| Native Hawaiian | 5 | 0.2% |
| Polish | 141 | 5.9% |
| Puerto Rican | 189 | 7.9% |
| Russian | 54 | 2.3% |
| Salvadoran | 21 | 0.9% |
| Scottish | 26 | 1.1% |
| South American | 11 | 0.5% |
| Spaniard | 26 | 1.1% |
| Subsaharan African | 8 | 0.3% |
| Swiss | 13 | 0.5% |
| Trinidadian and Tobagonian | 14 | 0.6% |
| Ukrainian | 40 | 1.7% |
| Welsh | 7 | 0.3% | View All 33 Rows |
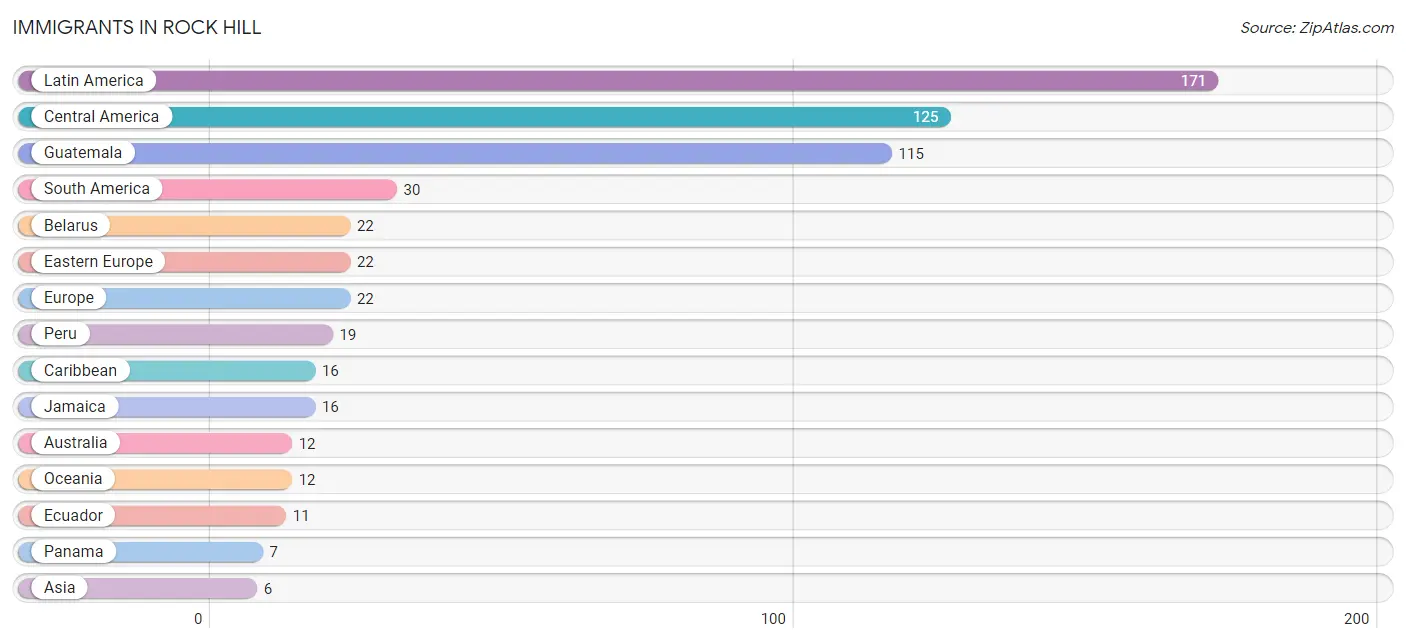
Immigrants in Rock Hill
The most numerous immigrant groups reported in Rock Hill came from Latin America (171 | 7.2%), Central America (125 | 5.2%), Guatemala (115 | 4.8%), South America (30 | 1.3%), and Belarus (22 | 0.9%), together accounting for 19.4% of all Rock Hill residents.
| Immigration Origin | # Population | % Population |
| Asia | 6 | 0.3% |
| Australia | 12 | 0.5% |
| Belarus | 22 | 0.9% |
| Caribbean | 16 | 0.7% |
| Central America | 125 | 5.2% |
| China | 6 | 0.3% |
| Eastern Asia | 6 | 0.3% |
| Eastern Europe | 22 | 0.9% |
| Ecuador | 11 | 0.5% |
| El Salvador | 3 | 0.1% |
| Europe | 22 | 0.9% |
| Guatemala | 115 | 4.8% |
| Jamaica | 16 | 0.7% |
| Latin America | 171 | 7.2% |
| Oceania | 12 | 0.5% |
| Panama | 7 | 0.3% |
| Peru | 19 | 0.8% |
| South America | 30 | 1.3% | View All 18 Rows |
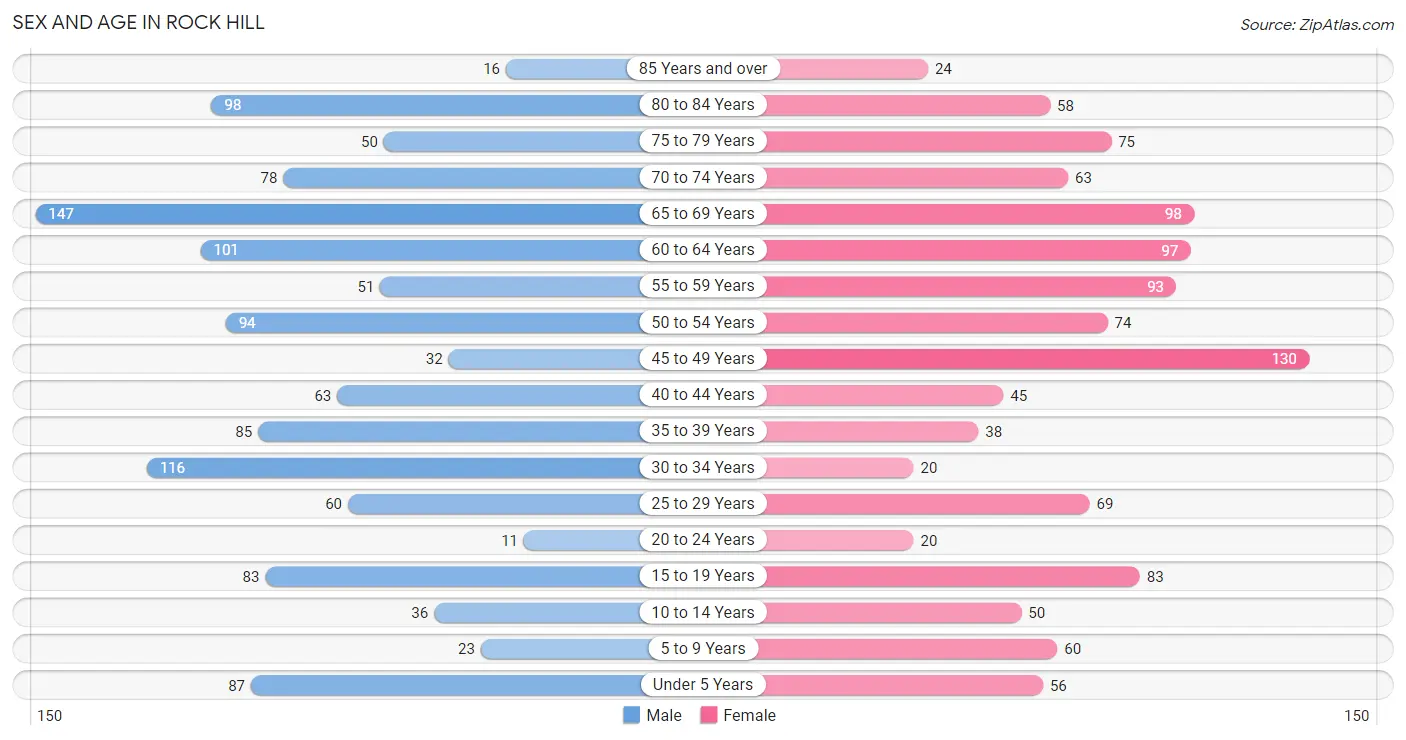
Sex and Age in Rock Hill
Sex and Age in Rock Hill
The most populous age groups in Rock Hill are 65 to 69 Years (147 | 11.9%) for men and 45 to 49 Years (130 | 11.3%) for women.
| Age Bracket | Male | Female |
| Under 5 Years | 87 (7.1%) | 56 (4.9%) |
| 5 to 9 Years | 23 (1.9%) | 60 (5.2%) |
| 10 to 14 Years | 36 (2.9%) | 50 (4.3%) |
| 15 to 19 Years | 83 (6.7%) | 83 (7.2%) |
| 20 to 24 Years | 11 (0.9%) | 20 (1.7%) |
| 25 to 29 Years | 60 (4.9%) | 69 (6.0%) |
| 30 to 34 Years | 116 (9.4%) | 20 (1.7%) |
| 35 to 39 Years | 85 (6.9%) | 38 (3.3%) |
| 40 to 44 Years | 63 (5.1%) | 45 (3.9%) |
| 45 to 49 Years | 32 (2.6%) | 130 (11.3%) |
| 50 to 54 Years | 94 (7.6%) | 74 (6.4%) |
| 55 to 59 Years | 51 (4.1%) | 93 (8.1%) |
| 60 to 64 Years | 101 (8.2%) | 97 (8.4%) |
| 65 to 69 Years | 147 (11.9%) | 98 (8.5%) |
| 70 to 74 Years | 78 (6.3%) | 63 (5.5%) |
| 75 to 79 Years | 50 (4.1%) | 75 (6.5%) |
| 80 to 84 Years | 98 (8.0%) | 58 (5.0%) |
| 85 Years and over | 16 (1.3%) | 24 (2.1%) |
| Total | 1,231 (100.0%) | 1,153 (100.0%) |
Families and Households in Rock Hill
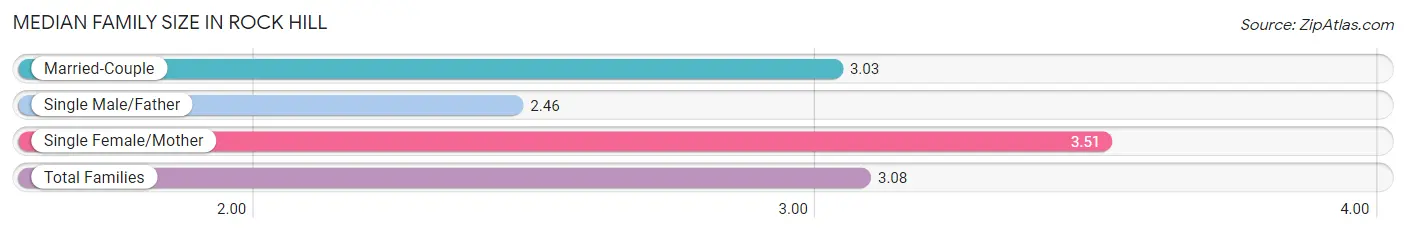
Median Family Size in Rock Hill
The median family size in Rock Hill is 3.08 persons per family, with single female/mother families (70 | 11.1%) accounting for the largest median family size of 3.51 persons per family. On the other hand, single male/father families (13 | 2.1%) represent the smallest median family size with 2.46 persons per family.
| Family Type | # Families | Family Size |
| Married-Couple | 548 (86.9%) | 3.03 |
| Single Male/Father | 13 (2.1%) | 2.46 |
| Single Female/Mother | 70 (11.1%) | 3.51 |
| Total Families | 631 (100.0%) | 3.08 |
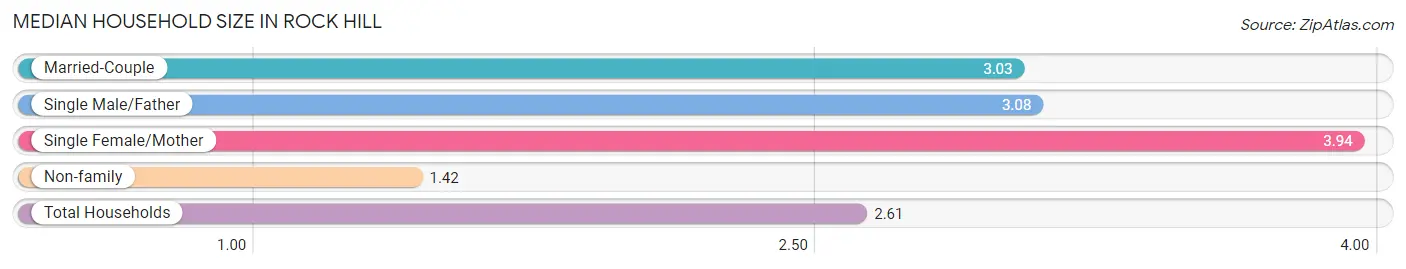
Median Household Size in Rock Hill
The median household size in Rock Hill is 2.61 persons per household, with single female/mother households (70 | 7.7%) accounting for the largest median household size of 3.94 persons per household. non-family households (279 | 30.7%) represent the smallest median household size with 1.42 persons per household.
| Household Type | # Households | Household Size |
| Married-Couple | 548 (60.2%) | 3.03 |
| Single Male/Father | 13 (1.4%) | 3.08 |
| Single Female/Mother | 70 (7.7%) | 3.94 |
| Non-family | 279 (30.7%) | 1.42 |
| Total Households | 910 (100.0%) | 2.61 |
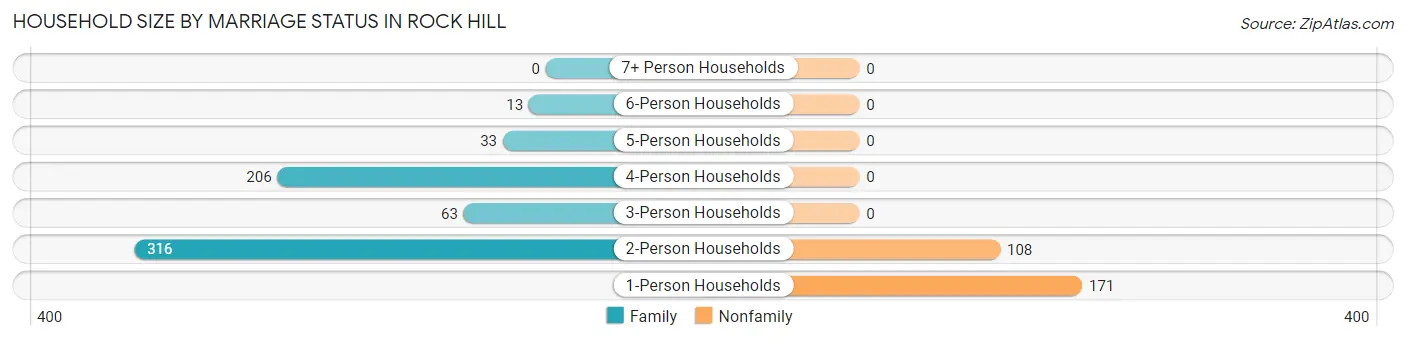
Household Size by Marriage Status in Rock Hill
Out of a total of 910 households in Rock Hill, 631 (69.3%) are family households, while 279 (30.7%) are nonfamily households. The most numerous type of family households are 2-person households, comprising 316, and the most common type of nonfamily households are 1-person households, comprising 171.
| Household Size | Family Households | Nonfamily Households |
| 1-Person Households | - | 171 (18.8%) |
| 2-Person Households | 316 (34.7%) | 108 (11.9%) |
| 3-Person Households | 63 (6.9%) | 0 (0.0%) |
| 4-Person Households | 206 (22.6%) | 0 (0.0%) |
| 5-Person Households | 33 (3.6%) | 0 (0.0%) |
| 6-Person Households | 13 (1.4%) | 0 (0.0%) |
| 7+ Person Households | 0 (0.0%) | 0 (0.0%) |
| Total | 631 (69.3%) | 279 (30.7%) |
Female Fertility in Rock Hill
Fertility by Age in Rock Hill
| Age Bracket | Women with Births | Births / 1,000 Women |
| 15 to 19 years | 0 (0.0%) | 0.0 |
| 20 to 34 years | 0 (0.0%) | 0.0 |
| 35 to 50 years | 0 (0.0%) | 0.0 |
| Total | 0 (0.0%) | 0.0 |
Fertility by Age by Marriage Status in Rock Hill
| Age Bracket | Married | Unmarried |
| 15 to 19 years | 0 (0.0%) | 0 (0.0%) |
| 20 to 34 years | 0 (0.0%) | 0 (0.0%) |
| 35 to 50 years | 0 (0.0%) | 0 (0.0%) |
| Total | 0 (0.0%) | 0 (0.0%) |
Fertility by Education in Rock Hill
| Educational Attainment | Women with Births | Births / 1,000 Women |
| Less than High School | 0 (0.0%) | 0.0 |
| High School Diploma | 0 (0.0%) | 0.0 |
| College or Associate's Degree | 0 (0.0%) | 0.0 |
| Bachelor's Degree | 0 (0.0%) | 0.0 |
| Graduate Degree | 0 (0.0%) | 0.0 |
| Total | 0 (0.0%) | 0.0 |
Fertility by Education by Marriage Status in Rock Hill
| Educational Attainment | Married | Unmarried |
| Less than High School | 0 (0.0%) | 0 (0.0%) |
| High School Diploma | 0 (0.0%) | 0 (0.0%) |
| College or Associate's Degree | 0 (0.0%) | 0 (0.0%) |
| Bachelor's Degree | 0 (0.0%) | 0 (0.0%) |
| Graduate Degree | 0 (0.0%) | 0 (0.0%) |
| Total | 0 (0.0%) | 0 (0.0%) |
Employment Characteristics in Rock Hill
Employment by Class of Employer in Rock Hill
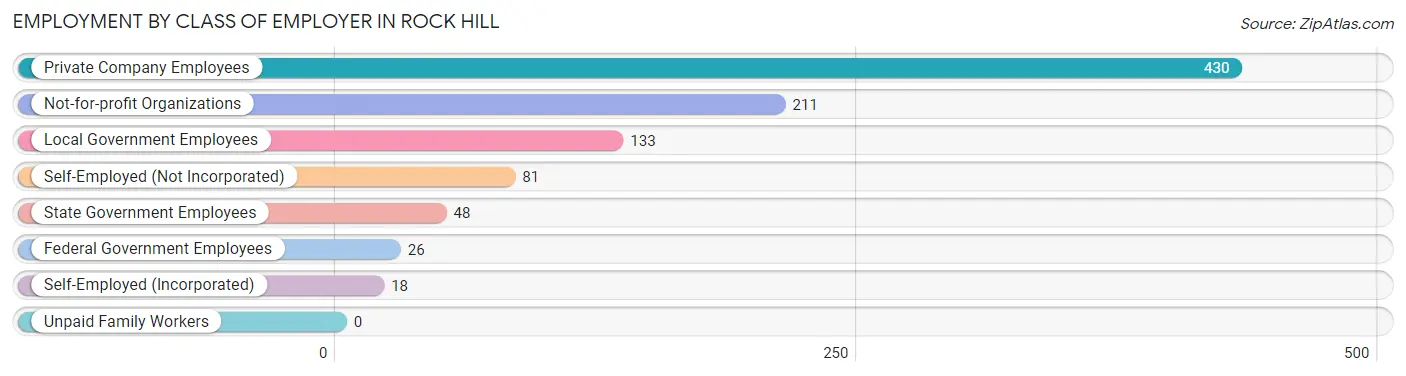
Among the 947 employed individuals in Rock Hill, private company employees (430 | 45.4%), not-for-profit organizations (211 | 22.3%), and local government employees (133 | 14.0%) make up the most common classes of employment.
| Employer Class | # Employees | % Employees |
| Private Company Employees | 430 | 45.4% |
| Self-Employed (Incorporated) | 18 | 1.9% |
| Self-Employed (Not Incorporated) | 81 | 8.6% |
| Not-for-profit Organizations | 211 | 22.3% |
| Local Government Employees | 133 | 14.0% |
| State Government Employees | 48 | 5.1% |
| Federal Government Employees | 26 | 2.8% |
| Unpaid Family Workers | 0 | 0.0% |
| Total | 947 | 100.0% |
Employment Status by Age in Rock Hill
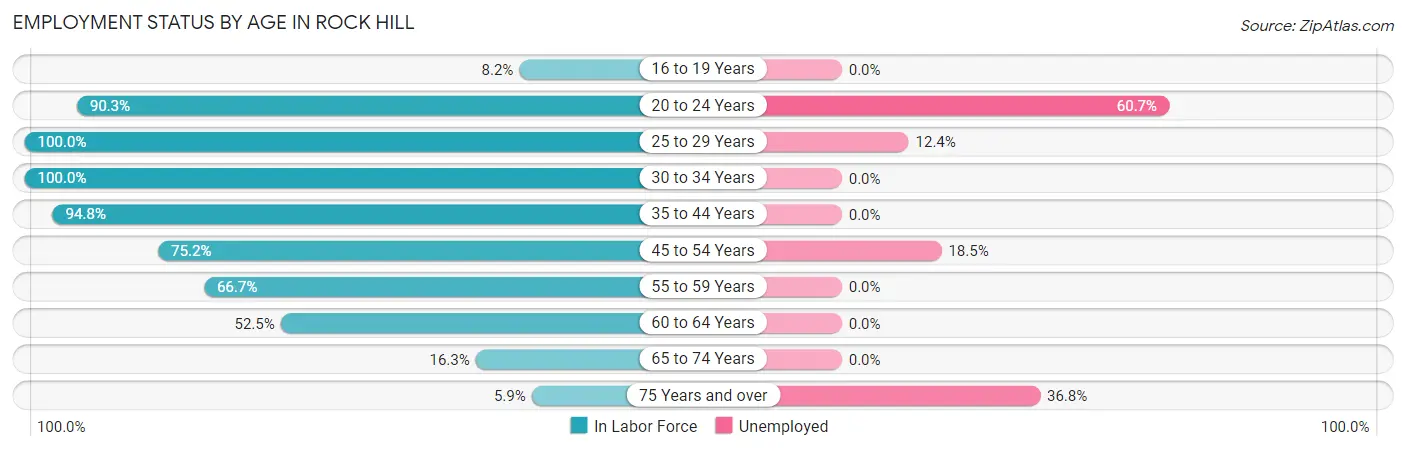
According to the labor force statistics for Rock Hill, out of the total population over 16 years of age (1,991), 52.7% or 1,049 individuals are in the labor force, with 8.2% or 86 of them unemployed. The age group with the highest labor force participation rate is 25 to 29 years, with 100.0% or 129 individuals in the labor force. Within the labor force, the 20 to 24 years age range has the highest percentage of unemployed individuals, with 60.7% or 17 of them being unemployed.
| Age Bracket | In Labor Force | Unemployed |
| 16 to 19 Years | 7 (8.2%) | 0 (0.0%) |
| 20 to 24 Years | 28 (90.3%) | 17 (60.7%) |
| 25 to 29 Years | 129 (100.0%) | 16 (12.4%) |
| 30 to 34 Years | 136 (100.0%) | 0 (0.0%) |
| 35 to 44 Years | 219 (94.8%) | 0 (0.0%) |
| 45 to 54 Years | 248 (75.2%) | 46 (18.5%) |
| 55 to 59 Years | 96 (66.7%) | 0 (0.0%) |
| 60 to 64 Years | 104 (52.5%) | 0 (0.0%) |
| 65 to 74 Years | 63 (16.3%) | 0 (0.0%) |
| 75 Years and over | 19 (5.9%) | 7 (36.8%) |
| Total | 1,049 (52.7%) | 86 (8.2%) |
Employment Status by Educational Attainment in Rock Hill
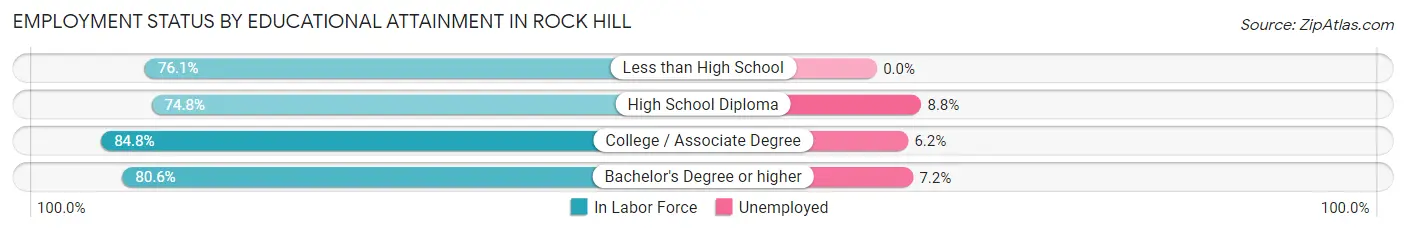
According to labor force statistics for Rock Hill, 79.8% of individuals (932) out of the total population between 25 and 64 years of age (1,168) are in the labor force, with 6.7% or 62 of them being unemployed. The group with the highest labor force participation rate are those with the educational attainment of college / associate degree, with 84.8% or 195 individuals in the labor force. Within the labor force, individuals with high school diploma education have the highest percentage of unemployment, with 8.8% or 16 of them being unemployed.
| Educational Attainment | In Labor Force | Unemployed |
| Less than High School | 86 (76.1%) | 0 (0.0%) |
| High School Diploma | 181 (74.8%) | 21 (8.8%) |
| College / Associate Degree | 195 (84.8%) | 14 (6.2%) |
| Bachelor's Degree or higher | 470 (80.6%) | 42 (7.2%) |
| Total | 932 (79.8%) | 78 (6.7%) |
Employment Occupations by Sex in Rock Hill
Management, Business, Science and Arts Occupations
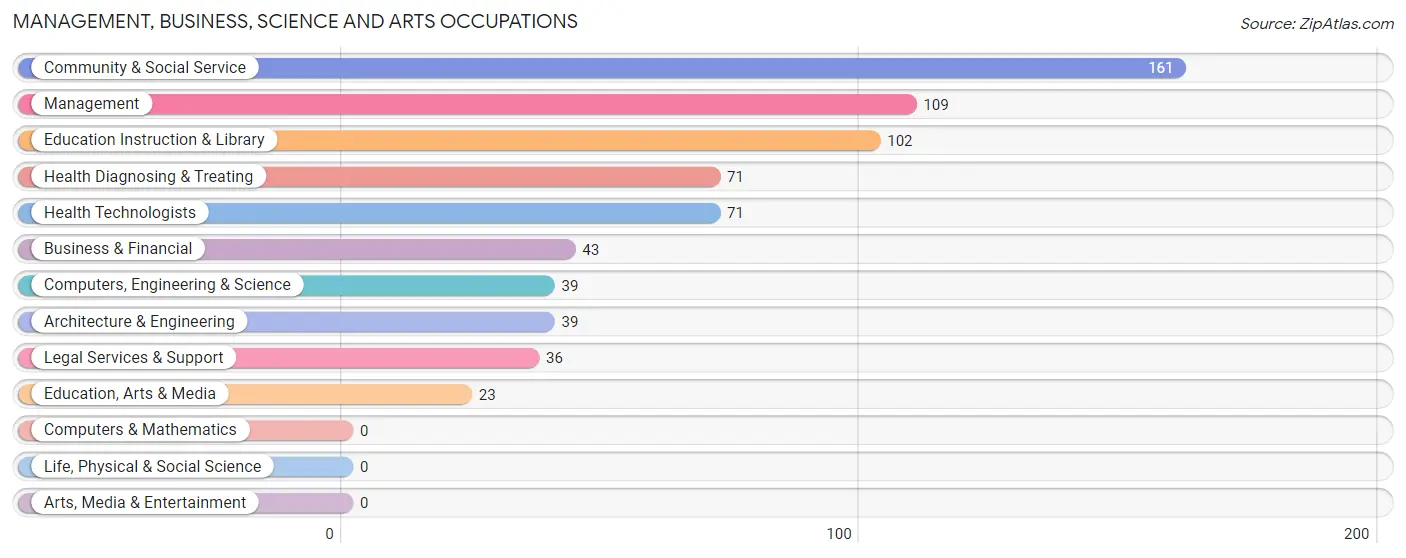
The most common Management, Business, Science and Arts occupations in Rock Hill are Community & Social Service (161 | 16.7%), Management (109 | 11.3%), Education Instruction & Library (102 | 10.6%), Health Diagnosing & Treating (71 | 7.4%), and Health Technologists (71 | 7.4%).
Management, Business, Science and Arts Occupations by Sex
Within the Management, Business, Science and Arts occupations in Rock Hill, the most male-oriented occupations are Computers, Engineering & Science (100.0%), Architecture & Engineering (100.0%), and Legal Services & Support (100.0%), while the most female-oriented occupations are Education, Arts & Media (100.0%), Health Diagnosing & Treating (60.6%), and Health Technologists (60.6%).
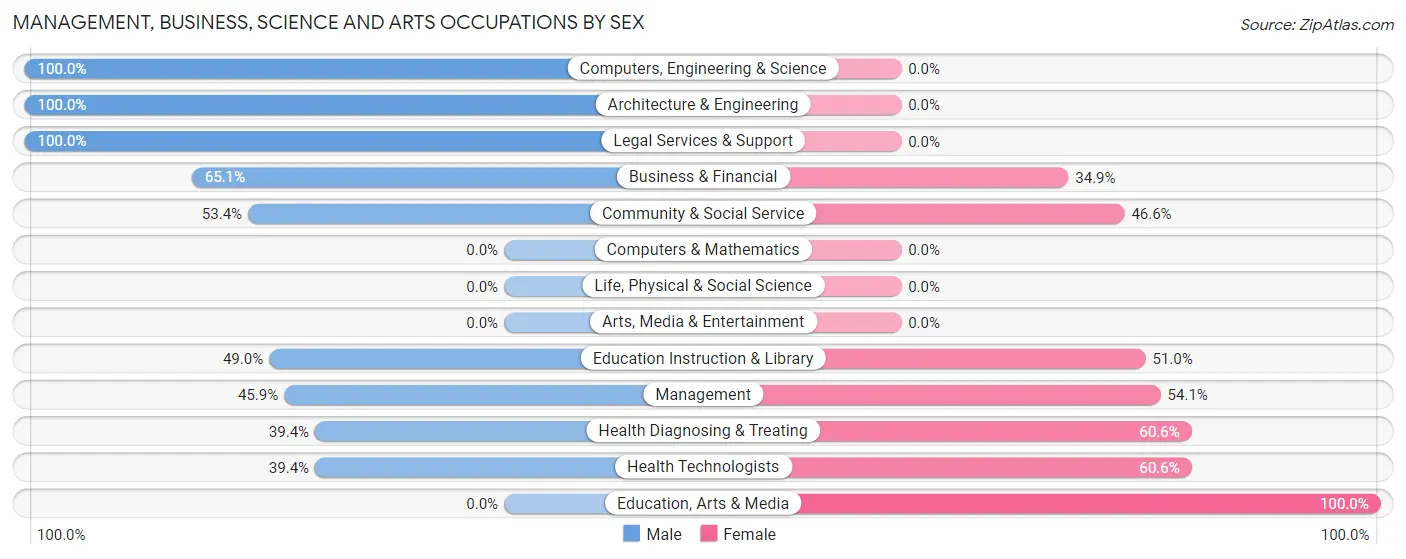
| Occupation | Male | Female |
| Management | 50 (45.9%) | 59 (54.1%) |
| Business & Financial | 28 (65.1%) | 15 (34.9%) |
| Computers, Engineering & Science | 39 (100.0%) | 0 (0.0%) |
| Computers & Mathematics | 0 (0.0%) | 0 (0.0%) |
| Architecture & Engineering | 39 (100.0%) | 0 (0.0%) |
| Life, Physical & Social Science | 0 (0.0%) | 0 (0.0%) |
| Community & Social Service | 86 (53.4%) | 75 (46.6%) |
| Education, Arts & Media | 0 (0.0%) | 23 (100.0%) |
| Legal Services & Support | 36 (100.0%) | 0 (0.0%) |
| Education Instruction & Library | 50 (49.0%) | 52 (51.0%) |
| Arts, Media & Entertainment | 0 (0.0%) | 0 (0.0%) |
| Health Diagnosing & Treating | 28 (39.4%) | 43 (60.6%) |
| Health Technologists | 28 (39.4%) | 43 (60.6%) |
| Total (Category) | 231 (54.6%) | 192 (45.4%) |
| Total (Overall) | 567 (58.9%) | 396 (41.1%) |
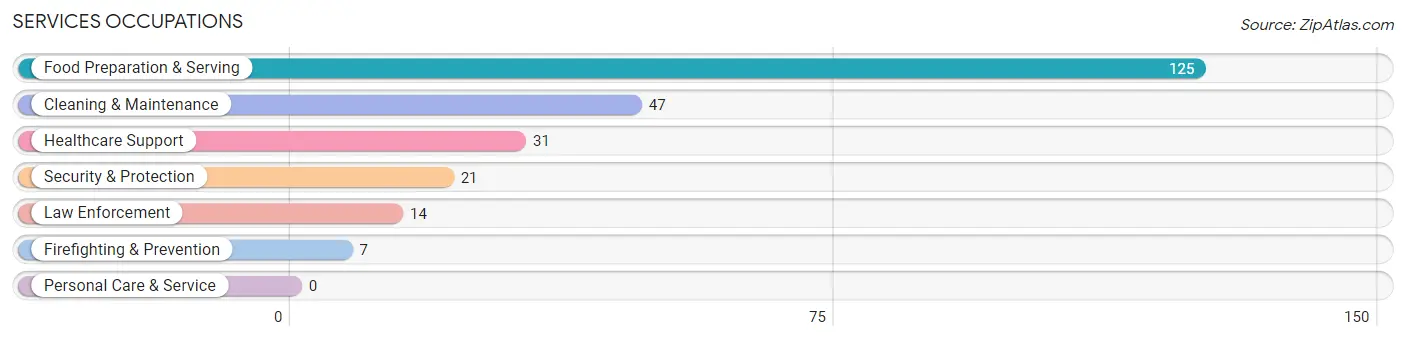
Services Occupations
The most common Services occupations in Rock Hill are Food Preparation & Serving (125 | 13.0%), Cleaning & Maintenance (47 | 4.9%), Healthcare Support (31 | 3.2%), Security & Protection (21 | 2.2%), and Law Enforcement (14 | 1.5%).
Services Occupations by Sex
Within the Services occupations in Rock Hill, the most male-oriented occupations are Law Enforcement (100.0%), Security & Protection (66.7%), and Cleaning & Maintenance (63.8%), while the most female-oriented occupations are Healthcare Support (100.0%), Firefighting & Prevention (100.0%), and Food Preparation & Serving (48.8%).
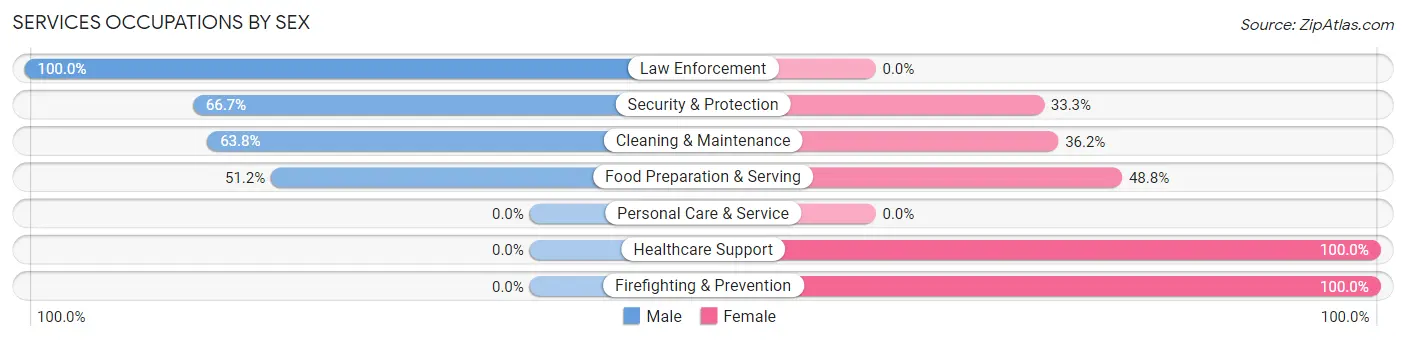
| Occupation | Male | Female |
| Healthcare Support | 0 (0.0%) | 31 (100.0%) |
| Security & Protection | 14 (66.7%) | 7 (33.3%) |
| Firefighting & Prevention | 0 (0.0%) | 7 (100.0%) |
| Law Enforcement | 14 (100.0%) | 0 (0.0%) |
| Food Preparation & Serving | 64 (51.2%) | 61 (48.8%) |
| Cleaning & Maintenance | 30 (63.8%) | 17 (36.2%) |
| Personal Care & Service | 0 (0.0%) | 0 (0.0%) |
| Total (Category) | 108 (48.2%) | 116 (51.8%) |
| Total (Overall) | 567 (58.9%) | 396 (41.1%) |
Sales and Office Occupations
The most common Sales and Office occupations in Rock Hill are Office & Administration (67 | 7.0%), and Sales & Related (52 | 5.4%).

Sales and Office Occupations by Sex

| Occupation | Male | Female |
| Sales & Related | 52 (100.0%) | 0 (0.0%) |
| Office & Administration | 13 (19.4%) | 54 (80.6%) |
| Total (Category) | 65 (54.6%) | 54 (45.4%) |
| Total (Overall) | 567 (58.9%) | 396 (41.1%) |
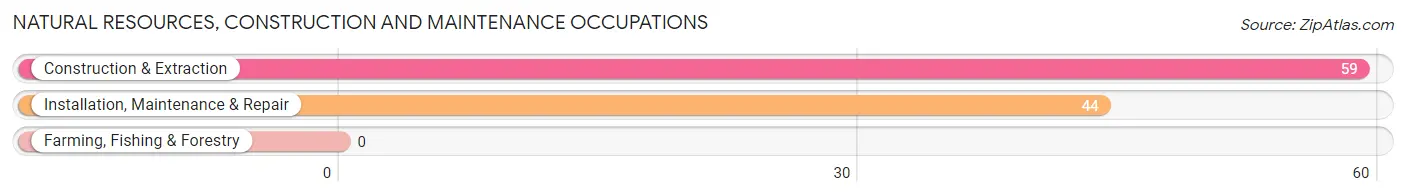
Natural Resources, Construction and Maintenance Occupations
The most common Natural Resources, Construction and Maintenance occupations in Rock Hill are Construction & Extraction (59 | 6.1%), and Installation, Maintenance & Repair (44 | 4.6%).
Natural Resources, Construction and Maintenance Occupations by Sex
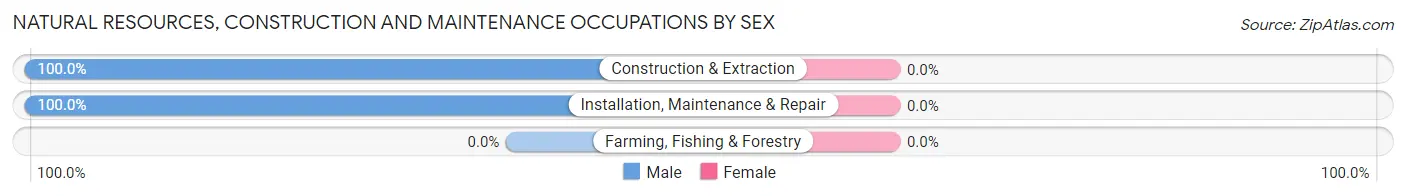
| Occupation | Male | Female |
| Farming, Fishing & Forestry | 0 (0.0%) | 0 (0.0%) |
| Construction & Extraction | 59 (100.0%) | 0 (0.0%) |
| Installation, Maintenance & Repair | 44 (100.0%) | 0 (0.0%) |
| Total (Category) | 103 (100.0%) | 0 (0.0%) |
| Total (Overall) | 567 (58.9%) | 396 (41.1%) |
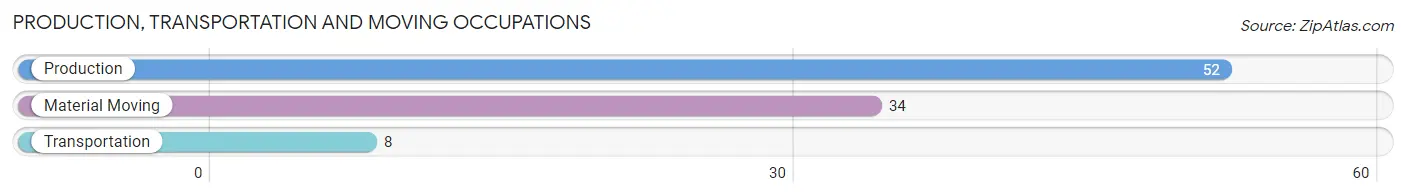
Production, Transportation and Moving Occupations
The most common Production, Transportation and Moving occupations in Rock Hill are Production (52 | 5.4%), Material Moving (34 | 3.5%), and Transportation (8 | 0.8%).
Production, Transportation and Moving Occupations by Sex
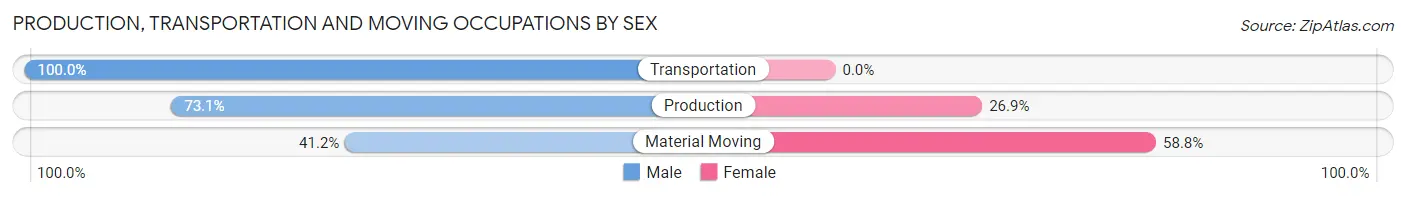
| Occupation | Male | Female |
| Production | 38 (73.1%) | 14 (26.9%) |
| Transportation | 8 (100.0%) | 0 (0.0%) |
| Material Moving | 14 (41.2%) | 20 (58.8%) |
| Total (Category) | 60 (63.8%) | 34 (36.2%) |
| Total (Overall) | 567 (58.9%) | 396 (41.1%) |
Employment Industries by Sex in Rock Hill
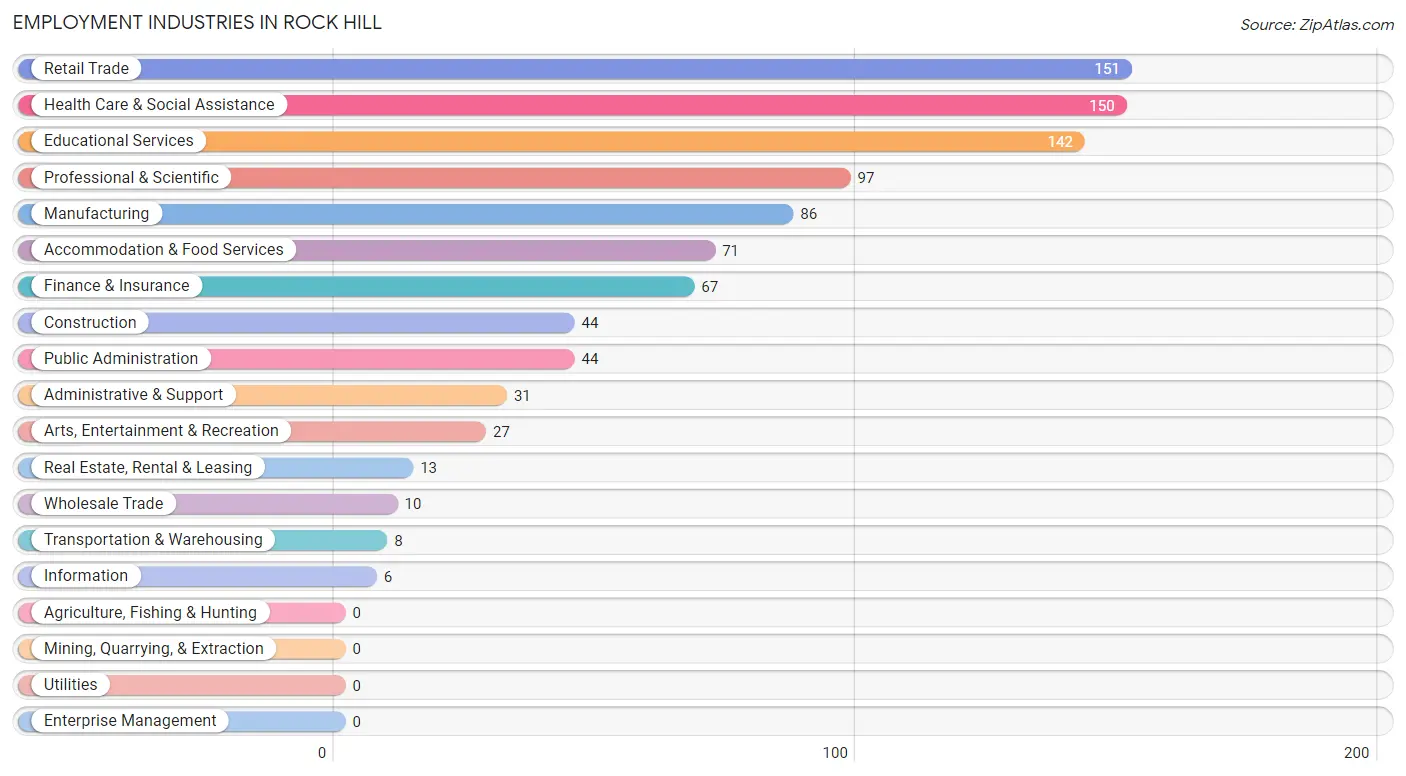
Employment Industries in Rock Hill
The major employment industries in Rock Hill include Retail Trade (151 | 15.7%), Health Care & Social Assistance (150 | 15.6%), Educational Services (142 | 14.7%), Professional & Scientific (97 | 10.1%), and Manufacturing (86 | 8.9%).
Employment Industries by Sex in Rock Hill
The Rock Hill industries that see more men than women are Construction (100.0%), Wholesale Trade (100.0%), and Transportation & Warehousing (100.0%), whereas the industries that tend to have a higher number of women are Real Estate, Rental & Leasing (100.0%), Arts, Entertainment & Recreation (100.0%), and Health Care & Social Assistance (82.7%).
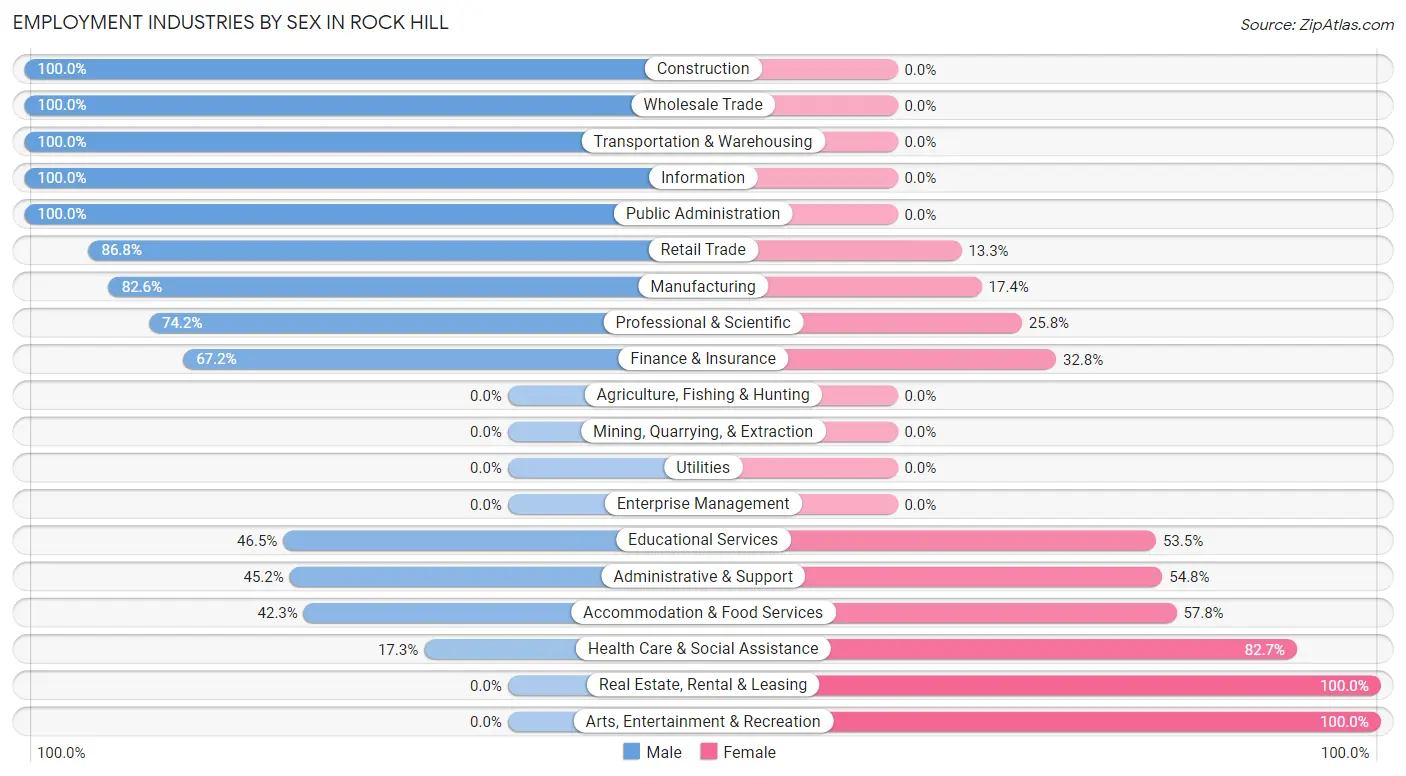
| Industry | Male | Female |
| Agriculture, Fishing & Hunting | 0 (0.0%) | 0 (0.0%) |
| Mining, Quarrying, & Extraction | 0 (0.0%) | 0 (0.0%) |
| Construction | 44 (100.0%) | 0 (0.0%) |
| Manufacturing | 71 (82.6%) | 15 (17.4%) |
| Wholesale Trade | 10 (100.0%) | 0 (0.0%) |
| Retail Trade | 131 (86.8%) | 20 (13.3%) |
| Transportation & Warehousing | 8 (100.0%) | 0 (0.0%) |
| Utilities | 0 (0.0%) | 0 (0.0%) |
| Information | 6 (100.0%) | 0 (0.0%) |
| Finance & Insurance | 45 (67.2%) | 22 (32.8%) |
| Real Estate, Rental & Leasing | 0 (0.0%) | 13 (100.0%) |
| Professional & Scientific | 72 (74.2%) | 25 (25.8%) |
| Enterprise Management | 0 (0.0%) | 0 (0.0%) |
| Administrative & Support | 14 (45.2%) | 17 (54.8%) |
| Educational Services | 66 (46.5%) | 76 (53.5%) |
| Health Care & Social Assistance | 26 (17.3%) | 124 (82.7%) |
| Arts, Entertainment & Recreation | 0 (0.0%) | 27 (100.0%) |
| Accommodation & Food Services | 30 (42.2%) | 41 (57.8%) |
| Public Administration | 44 (100.0%) | 0 (0.0%) |
| Total | 567 (58.9%) | 396 (41.1%) |
Education in Rock Hill
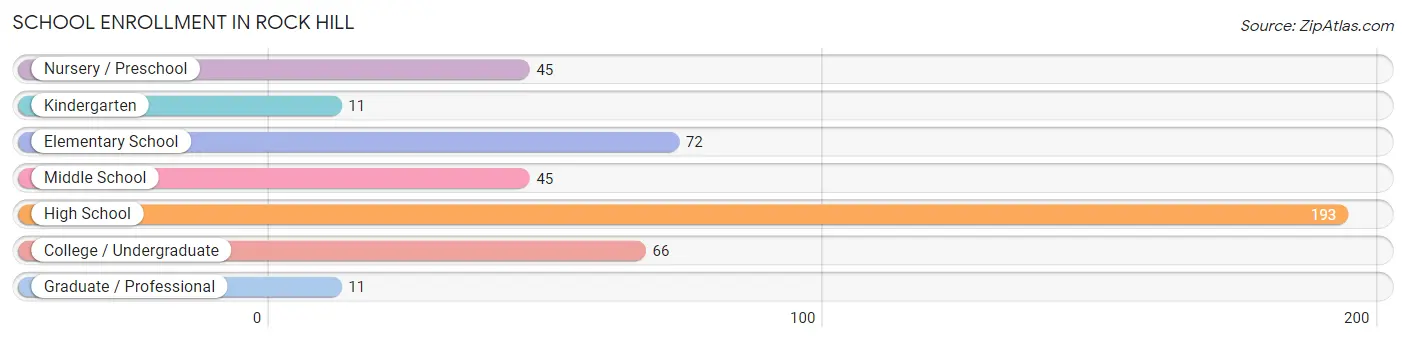
School Enrollment in Rock Hill
The most common levels of schooling among the 443 students in Rock Hill are high school (193 | 43.6%), elementary school (72 | 16.3%), and college / undergraduate (66 | 14.9%).
| School Level | # Students | % Students |
| Nursery / Preschool | 45 | 10.2% |
| Kindergarten | 11 | 2.5% |
| Elementary School | 72 | 16.3% |
| Middle School | 45 | 10.2% |
| High School | 193 | 43.6% |
| College / Undergraduate | 66 | 14.9% |
| Graduate / Professional | 11 | 2.5% |
| Total | 443 | 100.0% |
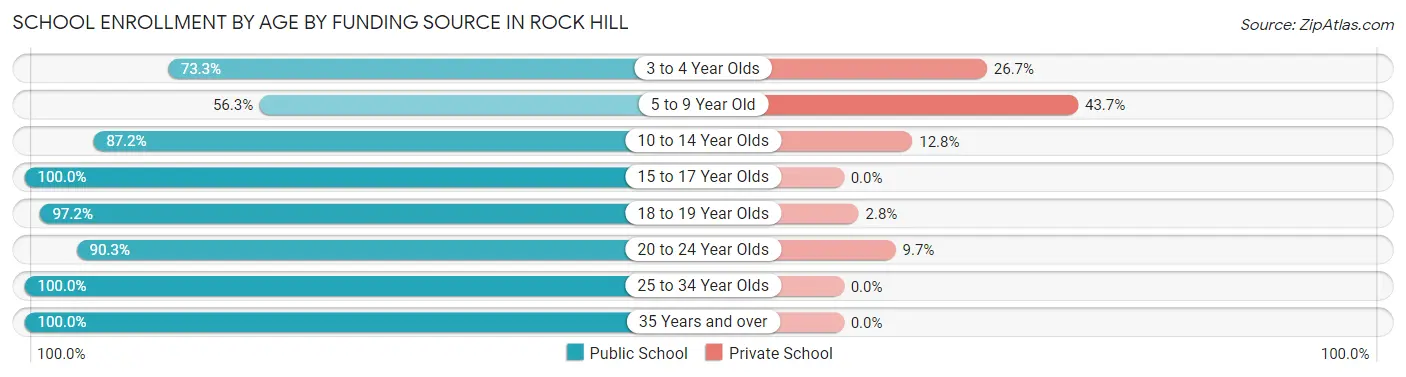
School Enrollment by Age by Funding Source in Rock Hill
Out of a total of 443 students who are enrolled in schools in Rock Hill, 58 (13.1%) attend a private institution, while the remaining 385 (86.9%) are enrolled in public schools. The age group of 5 to 9 year old has the highest likelihood of being enrolled in private schools, with 31 (43.7% in the age bracket) enrolled. Conversely, the age group of 15 to 17 year olds has the lowest likelihood of being enrolled in a private school, with 129 (100.0% in the age bracket) attending a public institution.
| Age Bracket | Public School | Private School |
| 3 to 4 Year Olds | 33 (73.3%) | 12 (26.7%) |
| 5 to 9 Year Old | 40 (56.3%) | 31 (43.7%) |
| 10 to 14 Year Olds | 75 (87.2%) | 11 (12.8%) |
| 15 to 17 Year Olds | 129 (100.0%) | 0 (0.0%) |
| 18 to 19 Year Olds | 35 (97.2%) | 1 (2.8%) |
| 20 to 24 Year Olds | 28 (90.3%) | 3 (9.7%) |
| 25 to 34 Year Olds | 25 (100.0%) | 0 (0.0%) |
| 35 Years and over | 20 (100.0%) | 0 (0.0%) |
| Total | 385 (86.9%) | 58 (13.1%) |
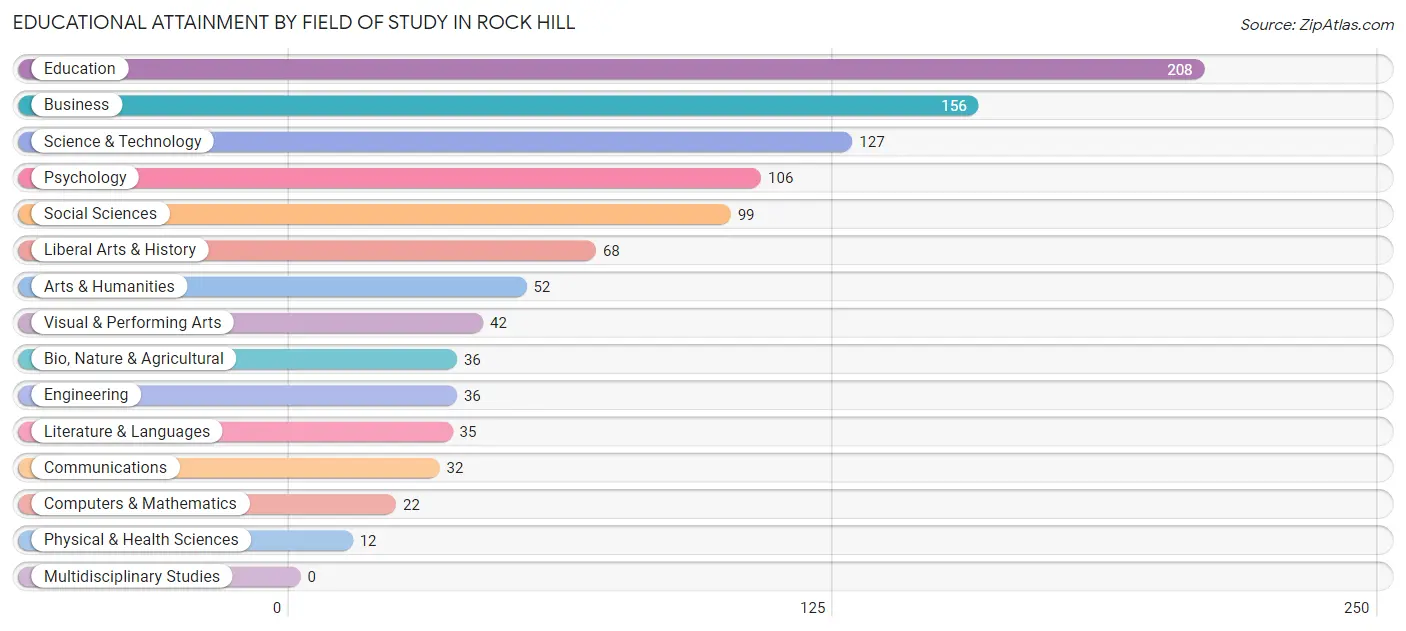
Educational Attainment by Field of Study in Rock Hill
Education (208 | 20.2%), business (156 | 15.1%), science & technology (127 | 12.3%), psychology (106 | 10.3%), and social sciences (99 | 9.6%) are the most common fields of study among 1,031 individuals in Rock Hill who have obtained a bachelor's degree or higher.
| Field of Study | # Graduates | % Graduates |
| Computers & Mathematics | 22 | 2.1% |
| Bio, Nature & Agricultural | 36 | 3.5% |
| Physical & Health Sciences | 12 | 1.2% |
| Psychology | 106 | 10.3% |
| Social Sciences | 99 | 9.6% |
| Engineering | 36 | 3.5% |
| Multidisciplinary Studies | 0 | 0.0% |
| Science & Technology | 127 | 12.3% |
| Business | 156 | 15.1% |
| Education | 208 | 20.2% |
| Literature & Languages | 35 | 3.4% |
| Liberal Arts & History | 68 | 6.6% |
| Visual & Performing Arts | 42 | 4.1% |
| Communications | 32 | 3.1% |
| Arts & Humanities | 52 | 5.0% |
| Total | 1,031 | 100.0% |
Transportation & Commute in Rock Hill
Vehicle Availability by Sex in Rock Hill
The most prevalent vehicle ownership categories in Rock Hill are males with 2 vehicles (247, accounting for 43.6%) and females with 2 vehicles (177, making up 65.0%).
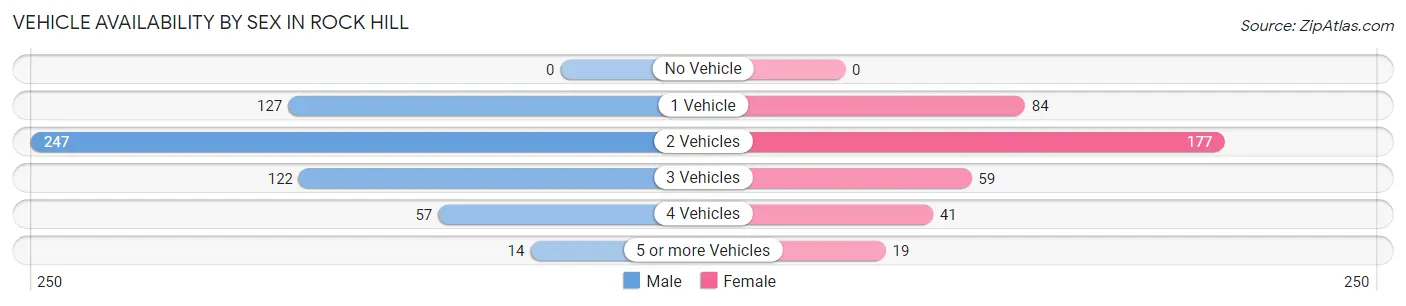
| Vehicles Available | Male | Female |
| No Vehicle | 0 (0.0%) | 0 (0.0%) |
| 1 Vehicle | 127 (22.4%) | 84 (22.1%) |
| 2 Vehicles | 247 (43.6%) | 177 (46.6%) |
| 3 Vehicles | 122 (21.5%) | 59 (15.5%) |
| 4 Vehicles | 57 (10.1%) | 41 (10.8%) |
| 5 or more Vehicles | 14 (2.5%) | 19 (5.0%) |
| Total | 567 (100.0%) | 380 (100.0%) |
Commute Time in Rock Hill
The most frequently occuring commute durations in Rock Hill are 15 to 19 minutes (225 commuters, 25.4%), 10 to 14 minutes (125 commuters, 14.1%), and 20 to 24 minutes (104 commuters, 11.7%).
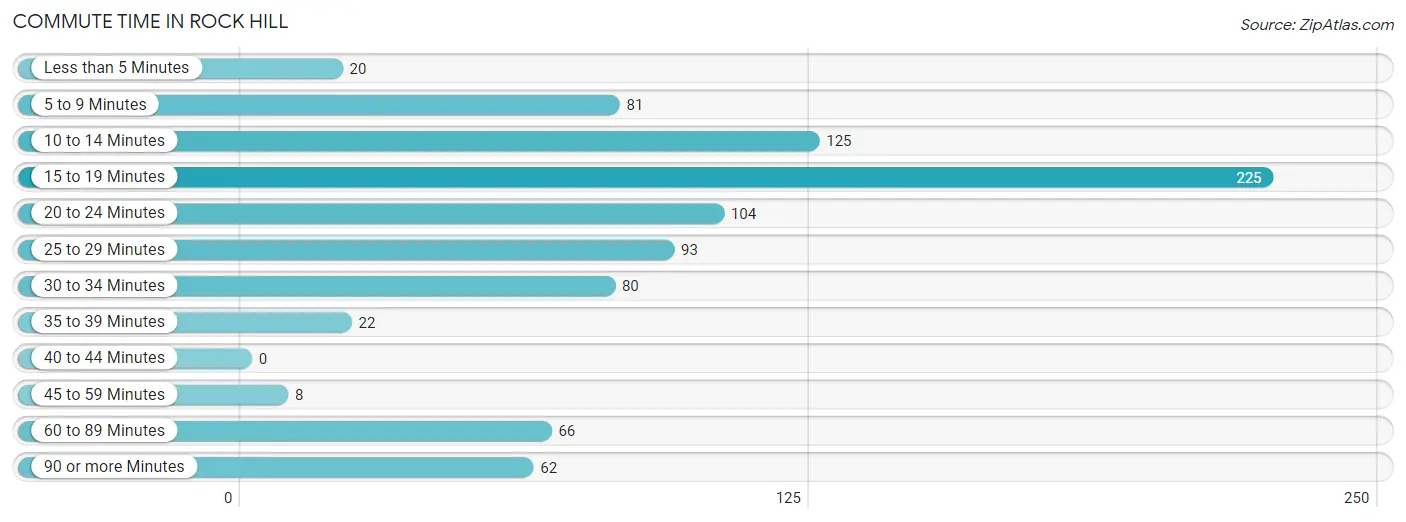
| Commute Time | # Commuters | % Commuters |
| Less than 5 Minutes | 20 | 2.3% |
| 5 to 9 Minutes | 81 | 9.1% |
| 10 to 14 Minutes | 125 | 14.1% |
| 15 to 19 Minutes | 225 | 25.4% |
| 20 to 24 Minutes | 104 | 11.7% |
| 25 to 29 Minutes | 93 | 10.5% |
| 30 to 34 Minutes | 80 | 9.0% |
| 35 to 39 Minutes | 22 | 2.5% |
| 40 to 44 Minutes | 0 | 0.0% |
| 45 to 59 Minutes | 8 | 0.9% |
| 60 to 89 Minutes | 66 | 7.4% |
| 90 or more Minutes | 62 | 7.0% |
Commute Time by Sex in Rock Hill
The most common commute times in Rock Hill are 15 to 19 minutes (123 commuters, 23.5%) for males and 15 to 19 minutes (102 commuters, 28.2%) for females.
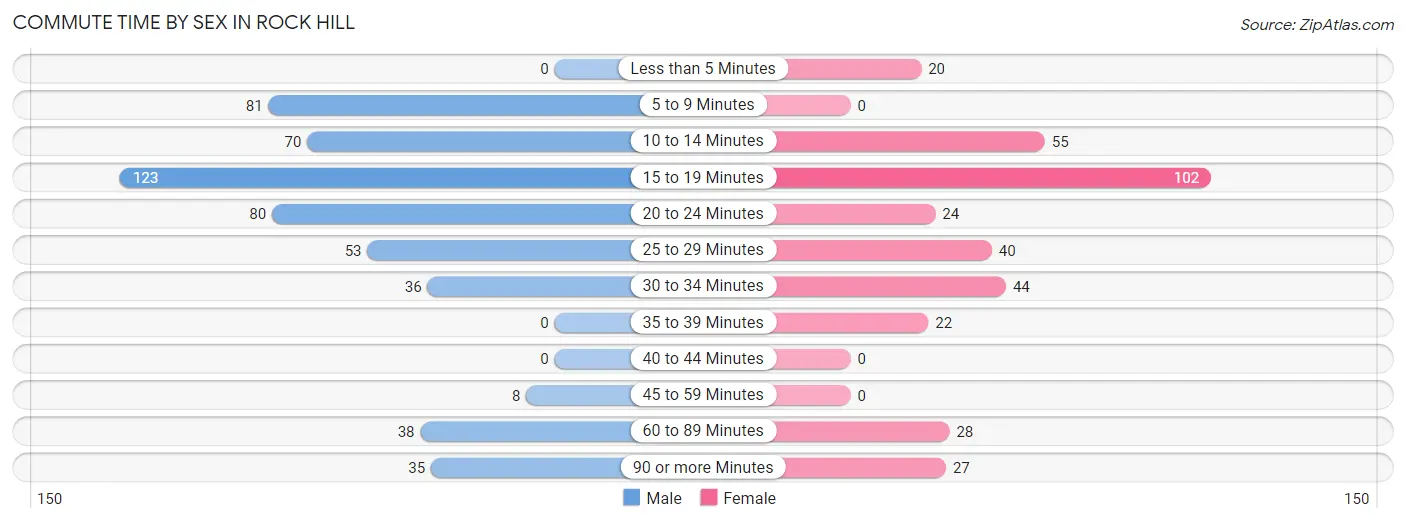
| Commute Time | Male | Female |
| Less than 5 Minutes | 0 (0.0%) | 20 (5.5%) |
| 5 to 9 Minutes | 81 (15.5%) | 0 (0.0%) |
| 10 to 14 Minutes | 70 (13.4%) | 55 (15.2%) |
| 15 to 19 Minutes | 123 (23.5%) | 102 (28.2%) |
| 20 to 24 Minutes | 80 (15.3%) | 24 (6.6%) |
| 25 to 29 Minutes | 53 (10.1%) | 40 (11.1%) |
| 30 to 34 Minutes | 36 (6.9%) | 44 (12.1%) |
| 35 to 39 Minutes | 0 (0.0%) | 22 (6.1%) |
| 40 to 44 Minutes | 0 (0.0%) | 0 (0.0%) |
| 45 to 59 Minutes | 8 (1.5%) | 0 (0.0%) |
| 60 to 89 Minutes | 38 (7.2%) | 28 (7.7%) |
| 90 or more Minutes | 35 (6.7%) | 27 (7.5%) |
Time of Departure to Work by Sex in Rock Hill
The most frequent times of departure to work in Rock Hill are 6:00 AM to 6:29 AM (86, 16.4%) for males and 7:00 AM to 7:29 AM (94, 26.0%) for females.
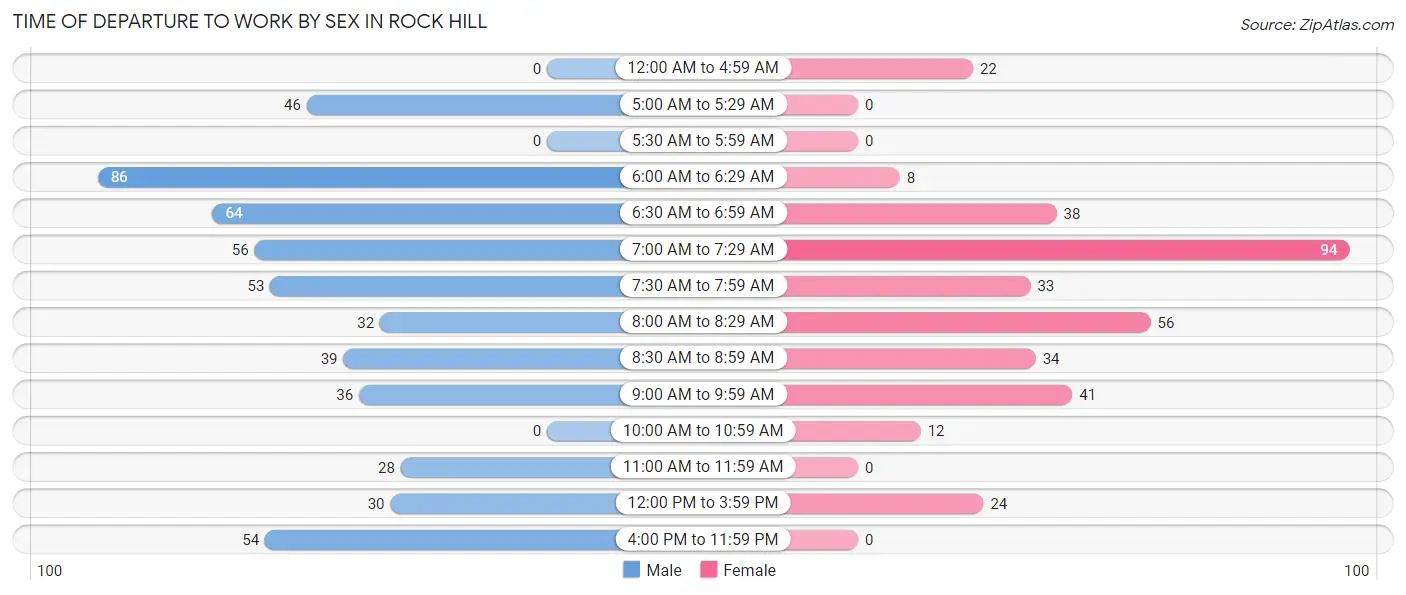
| Time of Departure | Male | Female |
| 12:00 AM to 4:59 AM | 0 (0.0%) | 22 (6.1%) |
| 5:00 AM to 5:29 AM | 46 (8.8%) | 0 (0.0%) |
| 5:30 AM to 5:59 AM | 0 (0.0%) | 0 (0.0%) |
| 6:00 AM to 6:29 AM | 86 (16.4%) | 8 (2.2%) |
| 6:30 AM to 6:59 AM | 64 (12.2%) | 38 (10.5%) |
| 7:00 AM to 7:29 AM | 56 (10.7%) | 94 (26.0%) |
| 7:30 AM to 7:59 AM | 53 (10.1%) | 33 (9.1%) |
| 8:00 AM to 8:29 AM | 32 (6.1%) | 56 (15.5%) |
| 8:30 AM to 8:59 AM | 39 (7.4%) | 34 (9.4%) |
| 9:00 AM to 9:59 AM | 36 (6.9%) | 41 (11.3%) |
| 10:00 AM to 10:59 AM | 0 (0.0%) | 12 (3.3%) |
| 11:00 AM to 11:59 AM | 28 (5.3%) | 0 (0.0%) |
| 12:00 PM to 3:59 PM | 30 (5.7%) | 24 (6.6%) |
| 4:00 PM to 11:59 PM | 54 (10.3%) | 0 (0.0%) |
| Total | 524 (100.0%) | 362 (100.0%) |
Housing Occupancy in Rock Hill
Occupancy by Ownership in Rock Hill
Of the total 910 dwellings in Rock Hill, owner-occupied units account for 758 (83.3%), while renter-occupied units make up 152 (16.7%).
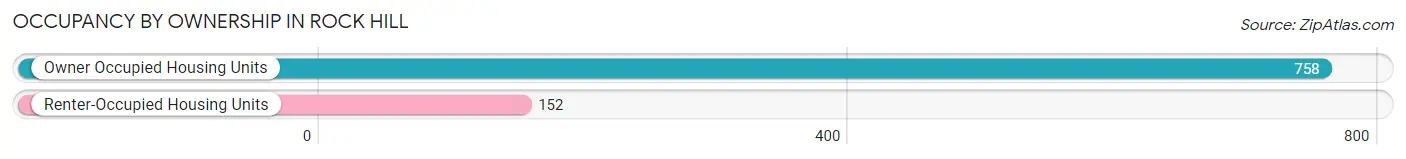
| Occupancy | # Housing Units | % Housing Units |
| Owner Occupied Housing Units | 758 | 83.3% |
| Renter-Occupied Housing Units | 152 | 16.7% |
| Total Occupied Housing Units | 910 | 100.0% |
Occupancy by Household Size in Rock Hill
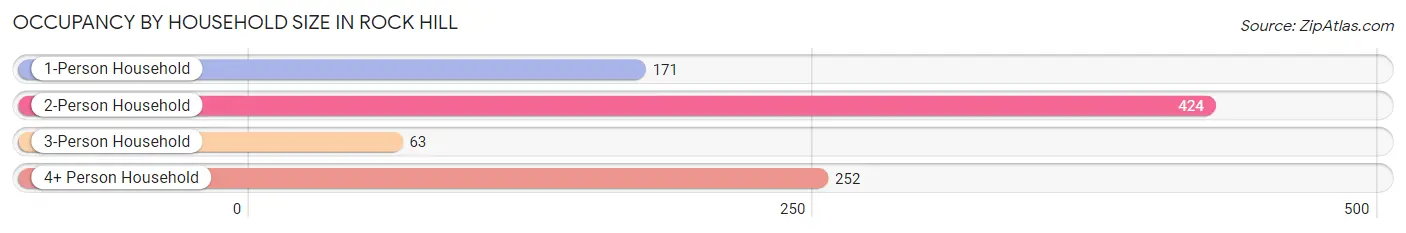
| Household Size | # Housing Units | % Housing Units |
| 1-Person Household | 171 | 18.8% |
| 2-Person Household | 424 | 46.6% |
| 3-Person Household | 63 | 6.9% |
| 4+ Person Household | 252 | 27.7% |
| Total Housing Units | 910 | 100.0% |
Occupancy by Ownership by Household Size in Rock Hill
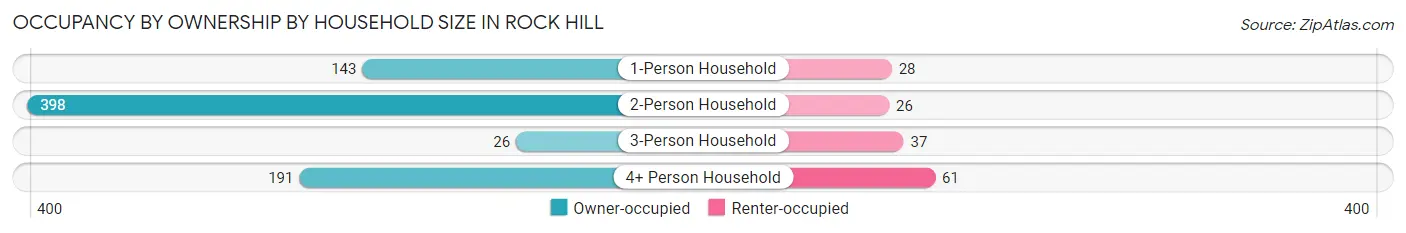
| Household Size | Owner-occupied | Renter-occupied |
| 1-Person Household | 143 (83.6%) | 28 (16.4%) |
| 2-Person Household | 398 (93.9%) | 26 (6.1%) |
| 3-Person Household | 26 (41.3%) | 37 (58.7%) |
| 4+ Person Household | 191 (75.8%) | 61 (24.2%) |
| Total Housing Units | 758 (83.3%) | 152 (16.7%) |
Occupancy by Educational Attainment in Rock Hill
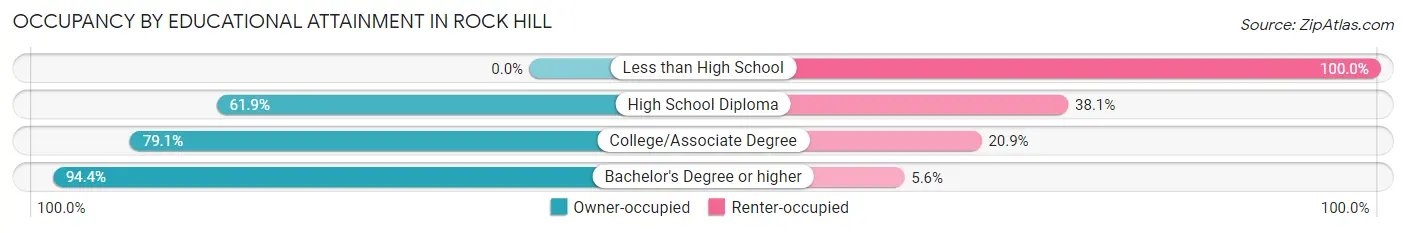
| Household Size | Owner-occupied | Renter-occupied |
| Less than High School | 0 (0.0%) | 20 (100.0%) |
| High School Diploma | 83 (61.9%) | 51 (38.1%) |
| College/Associate Degree | 201 (79.1%) | 53 (20.9%) |
| Bachelor's Degree or higher | 474 (94.4%) | 28 (5.6%) |
Occupancy by Age of Householder in Rock Hill
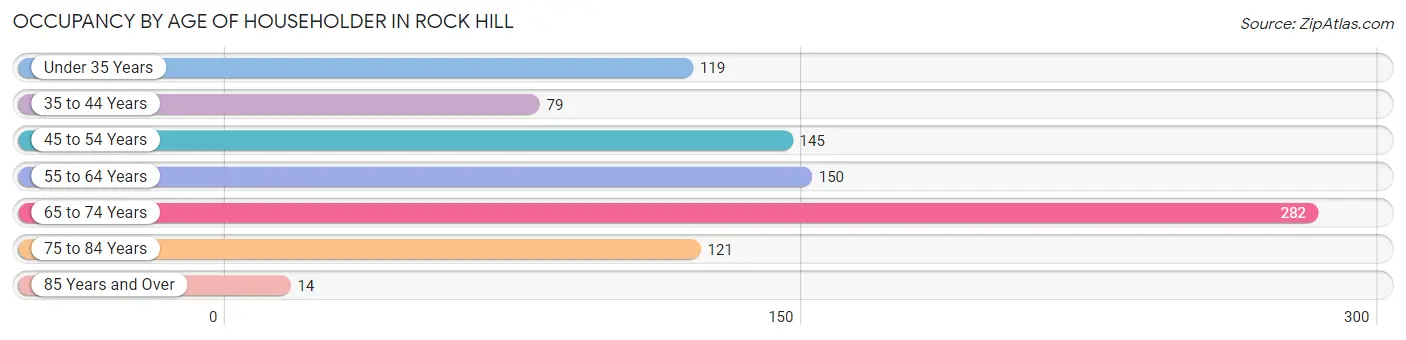
| Age Bracket | # Households | % Households |
| Under 35 Years | 119 | 13.1% |
| 35 to 44 Years | 79 | 8.7% |
| 45 to 54 Years | 145 | 15.9% |
| 55 to 64 Years | 150 | 16.5% |
| 65 to 74 Years | 282 | 31.0% |
| 75 to 84 Years | 121 | 13.3% |
| 85 Years and Over | 14 | 1.5% |
| Total | 910 | 100.0% |
Housing Finances in Rock Hill
Median Income by Occupancy in Rock Hill
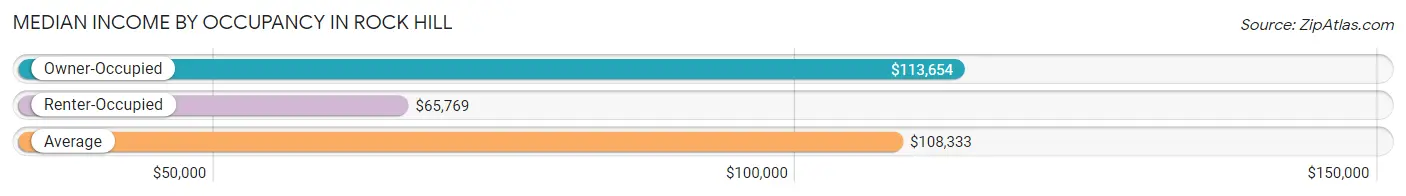
| Occupancy Type | # Households | Median Income |
| Owner-Occupied | 758 (83.3%) | $113,654 |
| Renter-Occupied | 152 (16.7%) | $65,769 |
| Average | 910 (100.0%) | $108,333 |
Occupancy by Householder Income Bracket in Rock Hill
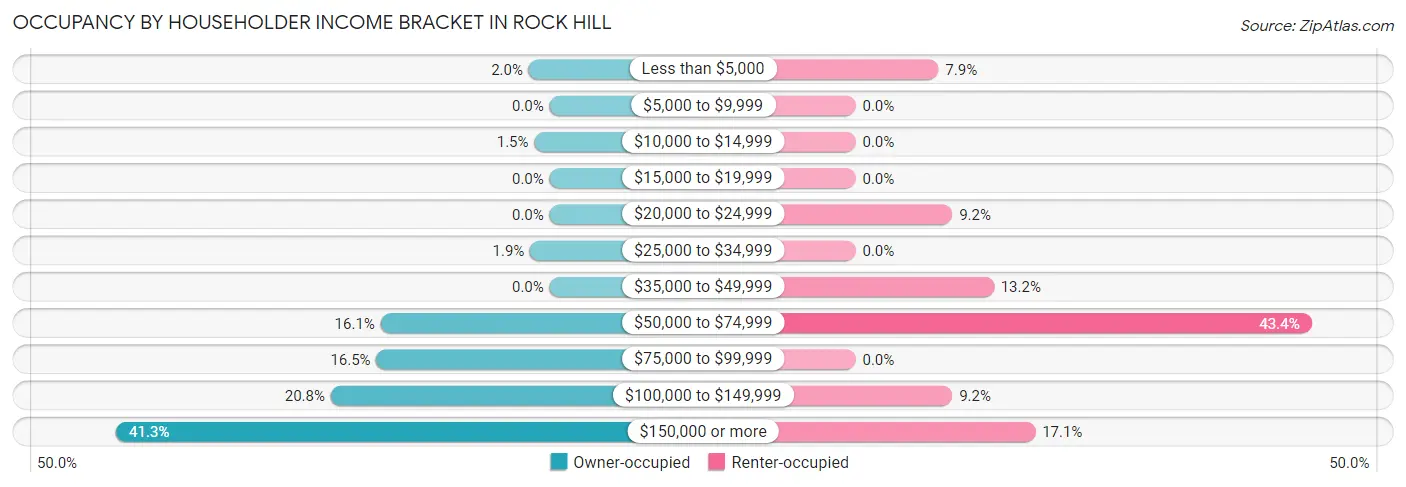
| Income Bracket | Owner-occupied | Renter-occupied |
| Less than $5,000 | 15 (2.0%) | 12 (7.9%) |
| $5,000 to $9,999 | 0 (0.0%) | 0 (0.0%) |
| $10,000 to $14,999 | 11 (1.5%) | 0 (0.0%) |
| $15,000 to $19,999 | 0 (0.0%) | 0 (0.0%) |
| $20,000 to $24,999 | 0 (0.0%) | 14 (9.2%) |
| $25,000 to $34,999 | 14 (1.8%) | 0 (0.0%) |
| $35,000 to $49,999 | 0 (0.0%) | 20 (13.2%) |
| $50,000 to $74,999 | 122 (16.1%) | 66 (43.4%) |
| $75,000 to $99,999 | 125 (16.5%) | 0 (0.0%) |
| $100,000 to $149,999 | 158 (20.8%) | 14 (9.2%) |
| $150,000 or more | 313 (41.3%) | 26 (17.1%) |
| Total | 758 (100.0%) | 152 (100.0%) |
Monthly Housing Cost Tiers in Rock Hill
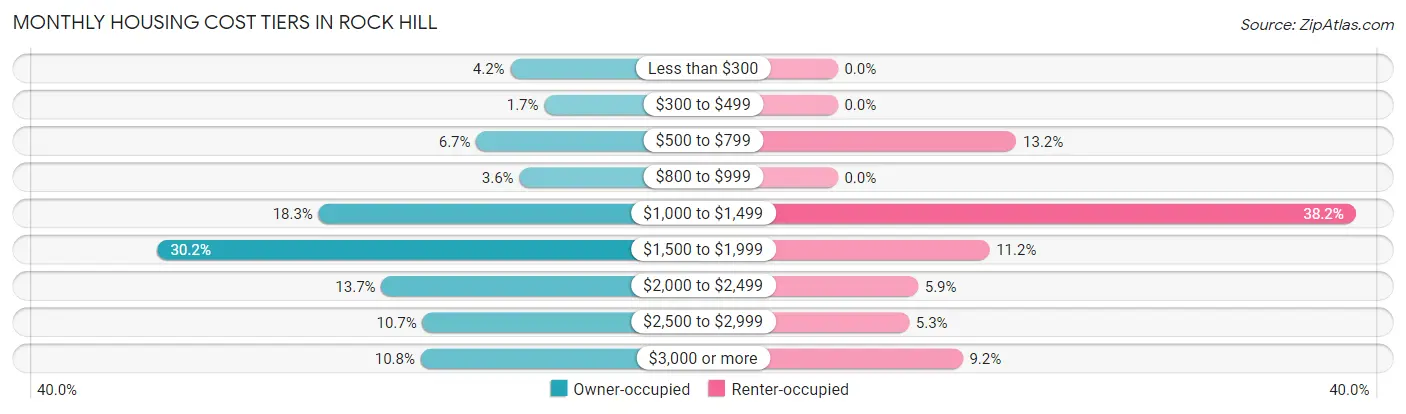
| Monthly Cost | Owner-occupied | Renter-occupied |
| Less than $300 | 32 (4.2%) | 0 (0.0%) |
| $300 to $499 | 13 (1.7%) | 0 (0.0%) |
| $500 to $799 | 51 (6.7%) | 20 (13.2%) |
| $800 to $999 | 27 (3.6%) | 0 (0.0%) |
| $1,000 to $1,499 | 139 (18.3%) | 58 (38.2%) |
| $1,500 to $1,999 | 229 (30.2%) | 17 (11.2%) |
| $2,000 to $2,499 | 104 (13.7%) | 9 (5.9%) |
| $2,500 to $2,999 | 81 (10.7%) | 8 (5.3%) |
| $3,000 or more | 82 (10.8%) | 14 (9.2%) |
| Total | 758 (100.0%) | 152 (100.0%) |
Physical Housing Characteristics in Rock Hill
Housing Structures in Rock Hill
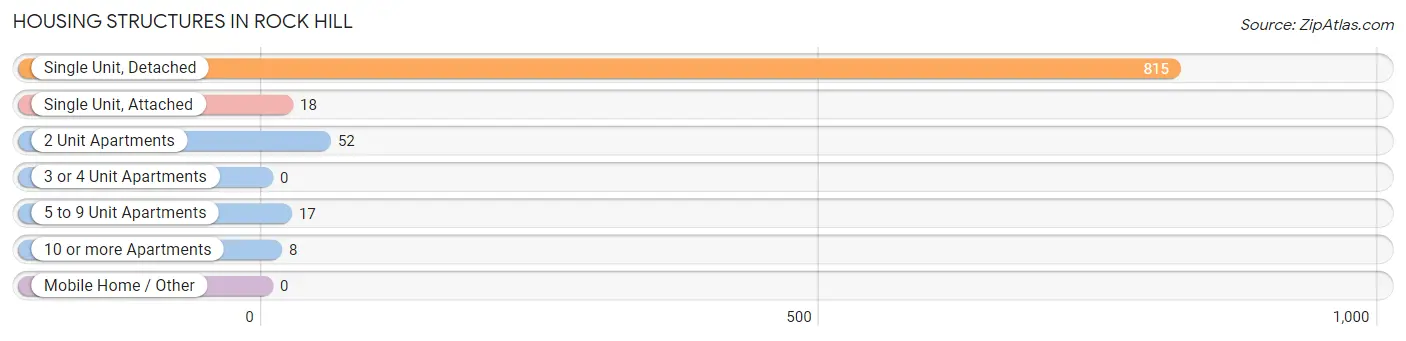
| Structure Type | # Housing Units | % Housing Units |
| Single Unit, Detached | 815 | 89.6% |
| Single Unit, Attached | 18 | 2.0% |
| 2 Unit Apartments | 52 | 5.7% |
| 3 or 4 Unit Apartments | 0 | 0.0% |
| 5 to 9 Unit Apartments | 17 | 1.9% |
| 10 or more Apartments | 8 | 0.9% |
| Mobile Home / Other | 0 | 0.0% |
| Total | 910 | 100.0% |
Housing Structures by Occupancy in Rock Hill
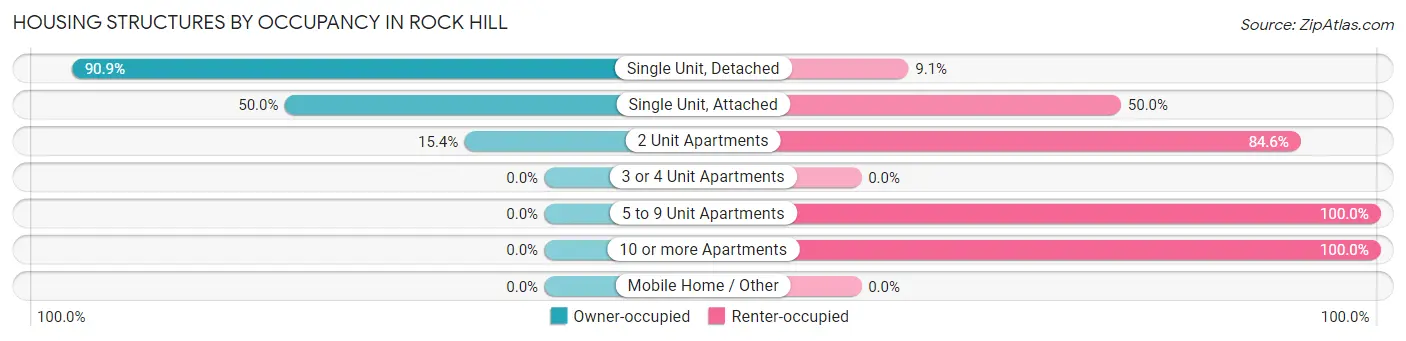
| Structure Type | Owner-occupied | Renter-occupied |
| Single Unit, Detached | 741 (90.9%) | 74 (9.1%) |
| Single Unit, Attached | 9 (50.0%) | 9 (50.0%) |
| 2 Unit Apartments | 8 (15.4%) | 44 (84.6%) |
| 3 or 4 Unit Apartments | 0 (0.0%) | 0 (0.0%) |
| 5 to 9 Unit Apartments | 0 (0.0%) | 17 (100.0%) |
| 10 or more Apartments | 0 (0.0%) | 8 (100.0%) |
| Mobile Home / Other | 0 (0.0%) | 0 (0.0%) |
| Total | 758 (83.3%) | 152 (16.7%) |
Housing Structures by Number of Rooms in Rock Hill
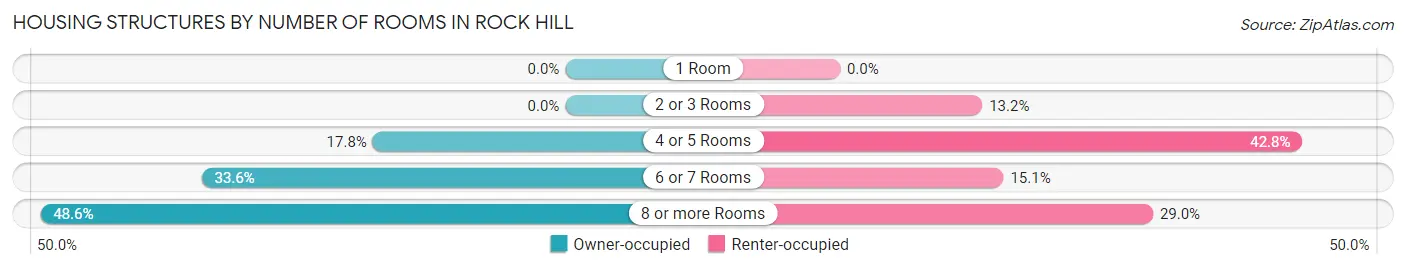
| Number of Rooms | Owner-occupied | Renter-occupied |
| 1 Room | 0 (0.0%) | 0 (0.0%) |
| 2 or 3 Rooms | 0 (0.0%) | 20 (13.2%) |
| 4 or 5 Rooms | 135 (17.8%) | 65 (42.8%) |
| 6 or 7 Rooms | 255 (33.6%) | 23 (15.1%) |
| 8 or more Rooms | 368 (48.5%) | 44 (28.9%) |
| Total | 758 (100.0%) | 152 (100.0%) |
Housing Structure by Heating Type in Rock Hill
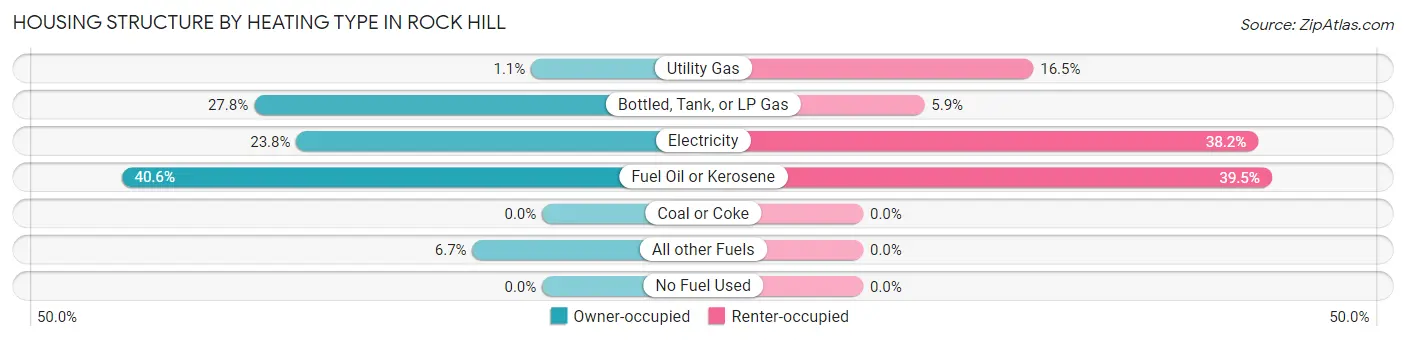
| Heating Type | Owner-occupied | Renter-occupied |
| Utility Gas | 8 (1.1%) | 25 (16.5%) |
| Bottled, Tank, or LP Gas | 211 (27.8%) | 9 (5.9%) |
| Electricity | 180 (23.7%) | 58 (38.2%) |
| Fuel Oil or Kerosene | 308 (40.6%) | 60 (39.5%) |
| Coal or Coke | 0 (0.0%) | 0 (0.0%) |
| All other Fuels | 51 (6.7%) | 0 (0.0%) |
| No Fuel Used | 0 (0.0%) | 0 (0.0%) |
| Total | 758 (100.0%) | 152 (100.0%) |
Household Vehicle Usage in Rock Hill
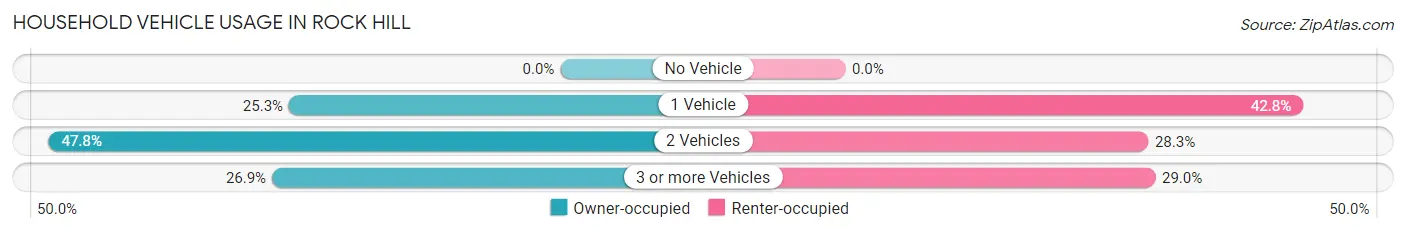
| Vehicles per Household | Owner-occupied | Renter-occupied |
| No Vehicle | 0 (0.0%) | 0 (0.0%) |
| 1 Vehicle | 192 (25.3%) | 65 (42.8%) |
| 2 Vehicles | 362 (47.8%) | 43 (28.3%) |
| 3 or more Vehicles | 204 (26.9%) | 44 (28.9%) |
| Total | 758 (100.0%) | 152 (100.0%) |
Real Estate & Mortgages in Rock Hill
Real Estate and Mortgage Overview in Rock Hill
| Characteristic | Without Mortgage | With Mortgage |
| Housing Units | 405 | 353 |
| Median Property Value | $420,300 | $328,100 |
| Median Household Income | $100,795 | $152 |
| Monthly Housing Costs | $1,417 | $79 |
| Real Estate Taxes | $9,523 | $0 |
Property Value by Mortgage Status in Rock Hill
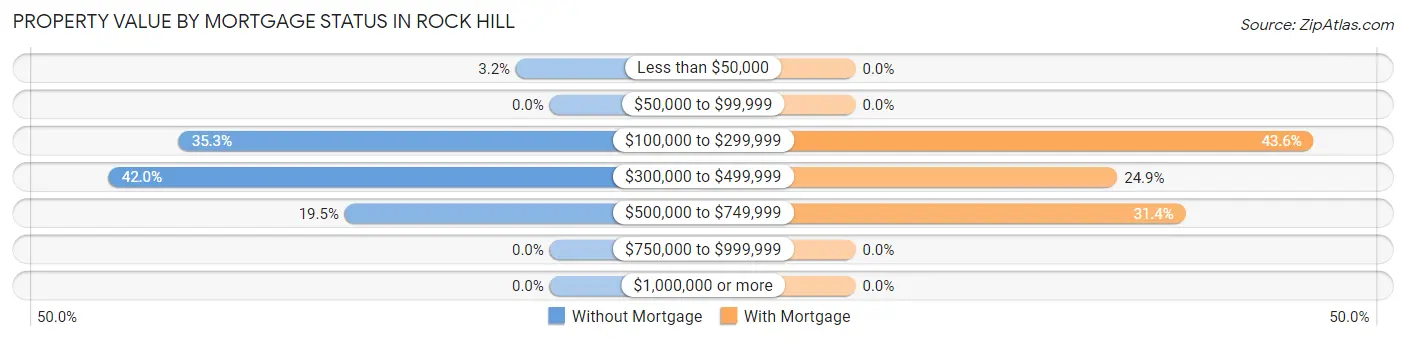
| Property Value | Without Mortgage | With Mortgage |
| Less than $50,000 | 13 (3.2%) | 0 (0.0%) |
| $50,000 to $99,999 | 0 (0.0%) | 0 (0.0%) |
| $100,000 to $299,999 | 143 (35.3%) | 154 (43.6%) |
| $300,000 to $499,999 | 170 (42.0%) | 88 (24.9%) |
| $500,000 to $749,999 | 79 (19.5%) | 111 (31.4%) |
| $750,000 to $999,999 | 0 (0.0%) | 0 (0.0%) |
| $1,000,000 or more | 0 (0.0%) | 0 (0.0%) |
| Total | 405 (100.0%) | 353 (100.0%) |
Household Income by Mortgage Status in Rock Hill
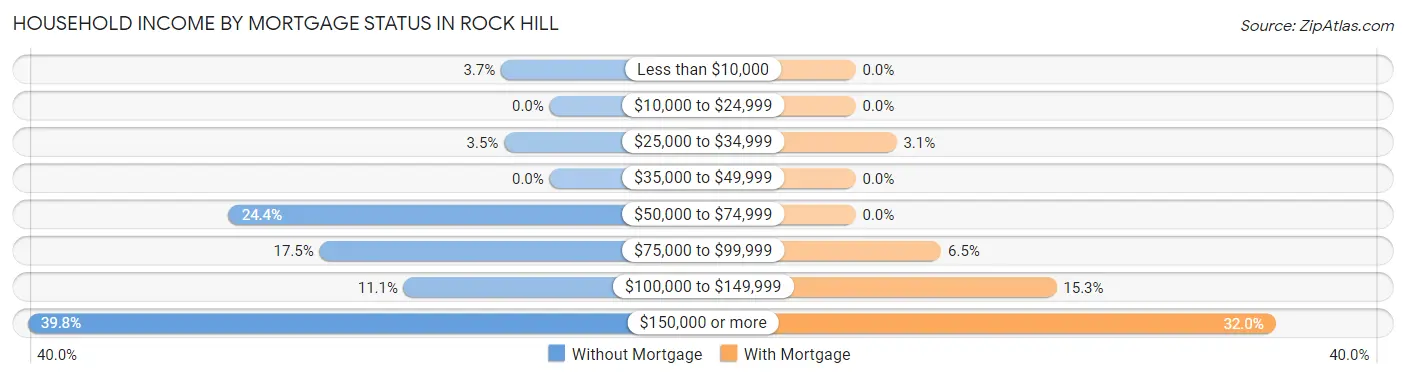
| Household Income | Without Mortgage | With Mortgage |
| Less than $10,000 | 15 (3.7%) | 0 (0.0%) |
| $10,000 to $24,999 | 0 (0.0%) | 0 (0.0%) |
| $25,000 to $34,999 | 14 (3.5%) | 11 (3.1%) |
| $35,000 to $49,999 | 0 (0.0%) | 0 (0.0%) |
| $50,000 to $74,999 | 99 (24.4%) | 0 (0.0%) |
| $75,000 to $99,999 | 71 (17.5%) | 23 (6.5%) |
| $100,000 to $149,999 | 45 (11.1%) | 54 (15.3%) |
| $150,000 or more | 161 (39.8%) | 113 (32.0%) |
| Total | 405 (100.0%) | 353 (100.0%) |
Property Value to Household Income Ratio in Rock Hill
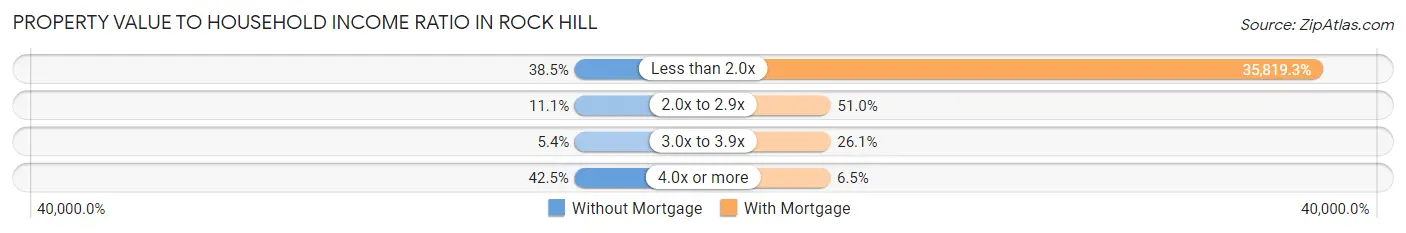
| Value-to-Income Ratio | Without Mortgage | With Mortgage |
| Less than 2.0x | 156 (38.5%) | 126,442 (35,819.3%) |
| 2.0x to 2.9x | 45 (11.1%) | 180 (51.0%) |
| 3.0x to 3.9x | 22 (5.4%) | 92 (26.1%) |
| 4.0x or more | 172 (42.5%) | 23 (6.5%) |
| Total | 405 (100.0%) | 353 (100.0%) |
Real Estate Taxes by Mortgage Status in Rock Hill

| Property Taxes | Without Mortgage | With Mortgage |
| Less than $800 | 27 (6.7%) | 0 (0.0%) |
| $800 to $1,499 | 0 (0.0%) | 0 (0.0%) |
| $800 to $1,499 | 360 (88.9%) | 0 (0.0%) |
| Total | 405 (100.0%) | 353 (100.0%) |
Health & Disability in Rock Hill
Health Insurance Coverage by Age in Rock Hill
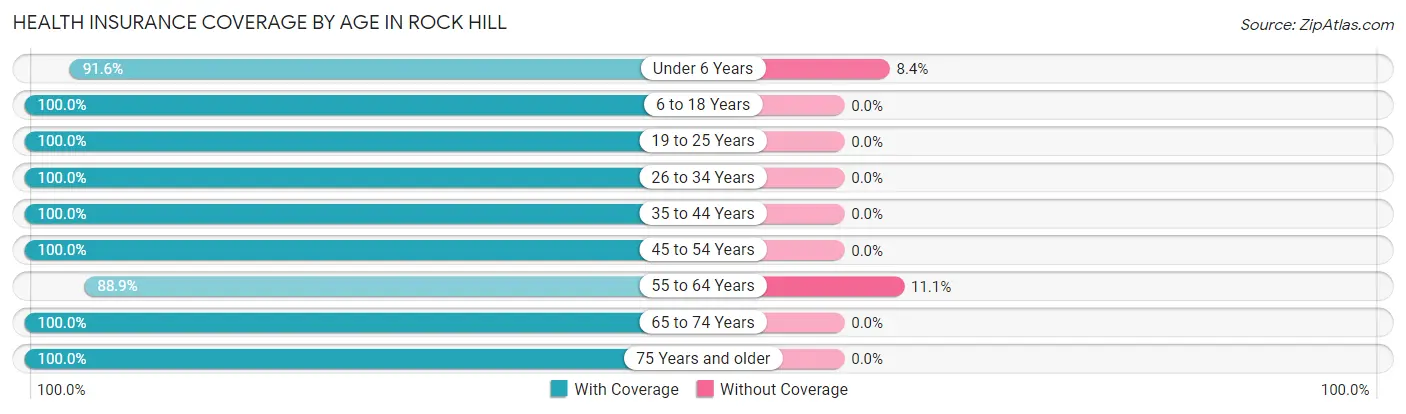
| Age Bracket | With Coverage | Without Coverage |
| Under 6 Years | 141 (91.6%) | 13 (8.4%) |
| 6 to 18 Years | 319 (100.0%) | 0 (0.0%) |
| 19 to 25 Years | 31 (100.0%) | 0 (0.0%) |
| 26 to 34 Years | 265 (100.0%) | 0 (0.0%) |
| 35 to 44 Years | 231 (100.0%) | 0 (0.0%) |
| 45 to 54 Years | 330 (100.0%) | 0 (0.0%) |
| 55 to 64 Years | 303 (88.9%) | 38 (11.1%) |
| 65 to 74 Years | 385 (100.0%) | 0 (0.0%) |
| 75 Years and older | 319 (100.0%) | 0 (0.0%) |
| Total | 2,324 (97.9%) | 51 (2.1%) |
Health Insurance Coverage by Citizenship Status in Rock Hill
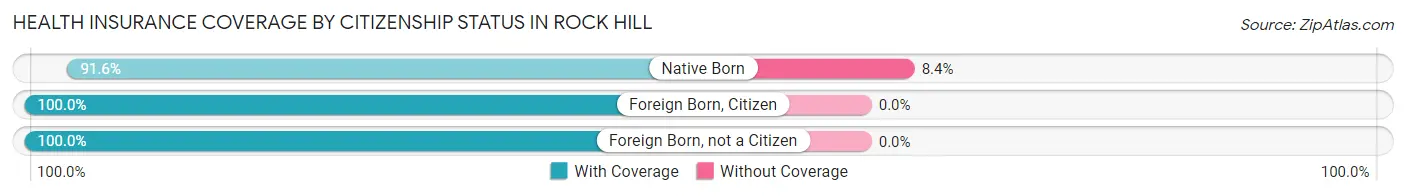
| Citizenship Status | With Coverage | Without Coverage |
| Native Born | 141 (91.6%) | 13 (8.4%) |
| Foreign Born, Citizen | 319 (100.0%) | 0 (0.0%) |
| Foreign Born, not a Citizen | 31 (100.0%) | 0 (0.0%) |
Health Insurance Coverage by Household Income in Rock Hill
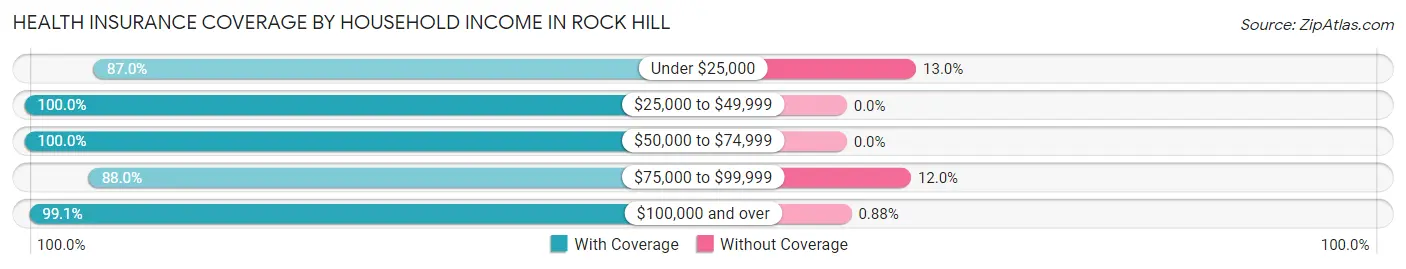
| Household Income | With Coverage | Without Coverage |
| Under $25,000 | 67 (87.0%) | 10 (13.0%) |
| $25,000 to $49,999 | 103 (100.0%) | 0 (0.0%) |
| $50,000 to $74,999 | 485 (100.0%) | 0 (0.0%) |
| $75,000 to $99,999 | 205 (88.0%) | 28 (12.0%) |
| $100,000 and over | 1,464 (99.1%) | 13 (0.9%) |
Public vs Private Health Insurance Coverage by Age in Rock Hill
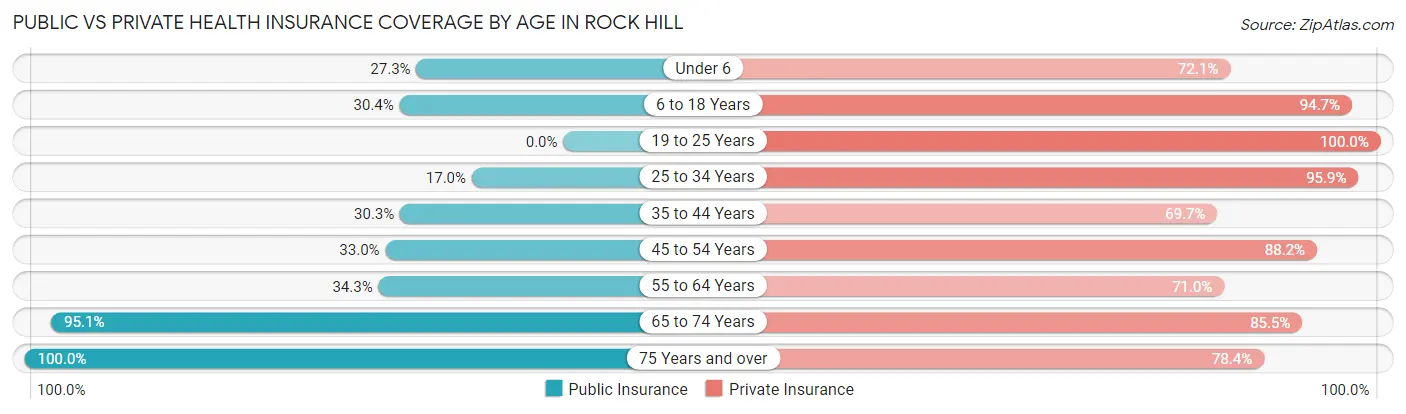
| Age Bracket | Public Insurance | Private Insurance |
| Under 6 | 42 (27.3%) | 111 (72.1%) |
| 6 to 18 Years | 97 (30.4%) | 302 (94.7%) |
| 19 to 25 Years | 0 (0.0%) | 31 (100.0%) |
| 25 to 34 Years | 45 (17.0%) | 254 (95.9%) |
| 35 to 44 Years | 70 (30.3%) | 161 (69.7%) |
| 45 to 54 Years | 109 (33.0%) | 291 (88.2%) |
| 55 to 64 Years | 117 (34.3%) | 242 (71.0%) |
| 65 to 74 Years | 366 (95.1%) | 329 (85.5%) |
| 75 Years and over | 319 (100.0%) | 250 (78.4%) |
| Total | 1,165 (49.0%) | 1,971 (83.0%) |
Disability Status by Sex by Age in Rock Hill
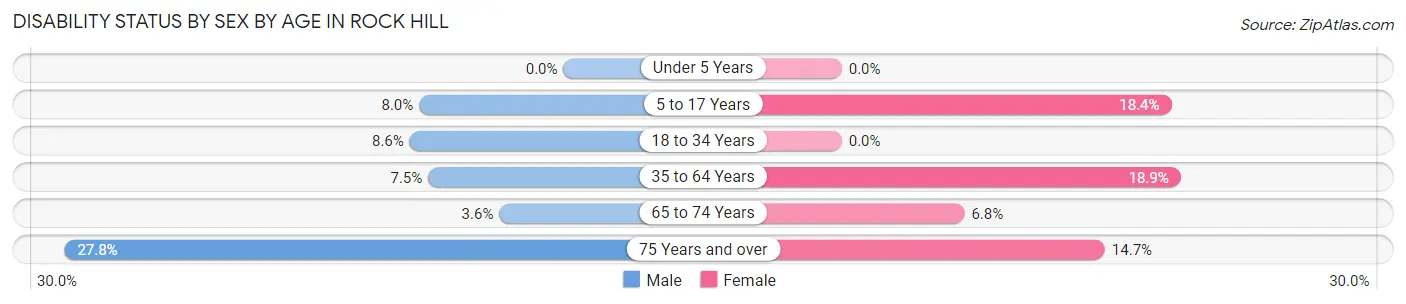
| Age Bracket | Male | Female |
| Under 5 Years | 0 (0.0%) | 0 (0.0%) |
| 5 to 17 Years | 11 (8.0%) | 29 (18.3%) |
| 18 to 34 Years | 16 (8.6%) | 0 (0.0%) |
| 35 to 64 Years | 32 (7.5%) | 90 (18.9%) |
| 65 to 74 Years | 8 (3.6%) | 11 (6.8%) |
| 75 Years and over | 45 (27.8%) | 23 (14.6%) |
Disability Class by Sex by Age in Rock Hill
Disability Class: Hearing Difficulty
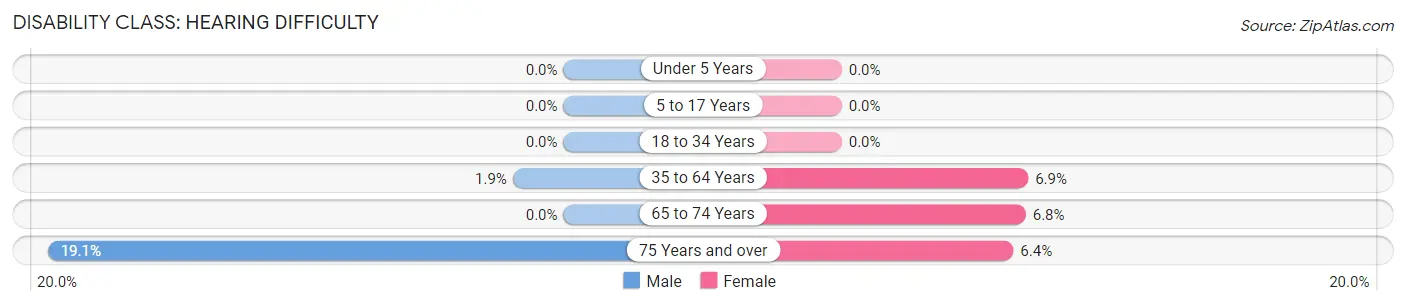
| Age Bracket | Male | Female |
| Under 5 Years | 0 (0.0%) | 0 (0.0%) |
| 5 to 17 Years | 0 (0.0%) | 0 (0.0%) |
| 18 to 34 Years | 0 (0.0%) | 0 (0.0%) |
| 35 to 64 Years | 8 (1.9%) | 33 (6.9%) |
| 65 to 74 Years | 0 (0.0%) | 11 (6.8%) |
| 75 Years and over | 31 (19.1%) | 10 (6.4%) |
Disability Class: Vision Difficulty
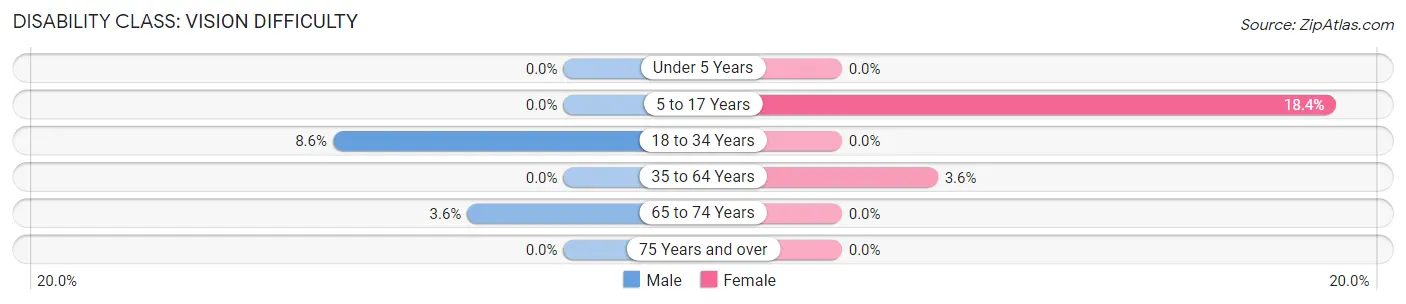
| Age Bracket | Male | Female |
| Under 5 Years | 0 (0.0%) | 0 (0.0%) |
| 5 to 17 Years | 0 (0.0%) | 29 (18.3%) |
| 18 to 34 Years | 16 (8.6%) | 0 (0.0%) |
| 35 to 64 Years | 0 (0.0%) | 17 (3.6%) |
| 65 to 74 Years | 8 (3.6%) | 0 (0.0%) |
| 75 Years and over | 0 (0.0%) | 0 (0.0%) |
Disability Class: Cognitive Difficulty
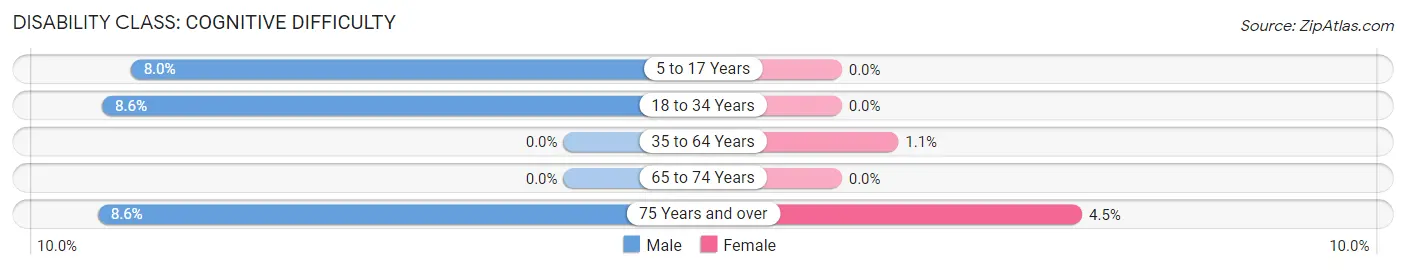
| Age Bracket | Male | Female |
| 5 to 17 Years | 11 (8.0%) | 0 (0.0%) |
| 18 to 34 Years | 16 (8.6%) | 0 (0.0%) |
| 35 to 64 Years | 0 (0.0%) | 5 (1.1%) |
| 65 to 74 Years | 0 (0.0%) | 0 (0.0%) |
| 75 Years and over | 14 (8.6%) | 7 (4.5%) |
Disability Class: Ambulatory Difficulty
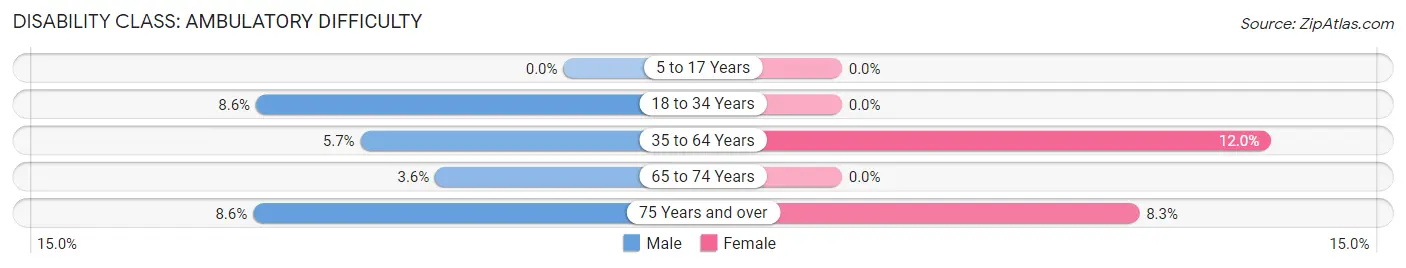
| Age Bracket | Male | Female |
| 5 to 17 Years | 0 (0.0%) | 0 (0.0%) |
| 18 to 34 Years | 16 (8.6%) | 0 (0.0%) |
| 35 to 64 Years | 24 (5.7%) | 57 (11.9%) |
| 65 to 74 Years | 8 (3.6%) | 0 (0.0%) |
| 75 Years and over | 14 (8.6%) | 13 (8.3%) |
Disability Class: Self-Care Difficulty
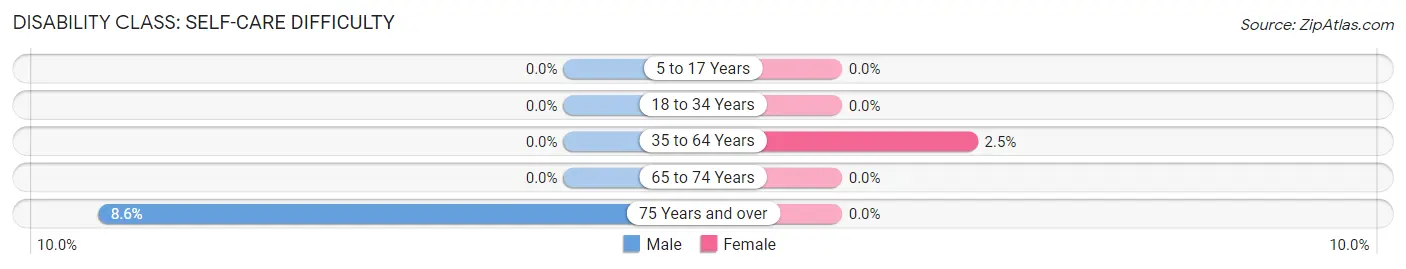
| Age Bracket | Male | Female |
| 5 to 17 Years | 0 (0.0%) | 0 (0.0%) |
| 18 to 34 Years | 0 (0.0%) | 0 (0.0%) |
| 35 to 64 Years | 0 (0.0%) | 12 (2.5%) |
| 65 to 74 Years | 0 (0.0%) | 0 (0.0%) |
| 75 Years and over | 14 (8.6%) | 0 (0.0%) |
Technology Access in Rock Hill
Computing Device Access in Rock Hill
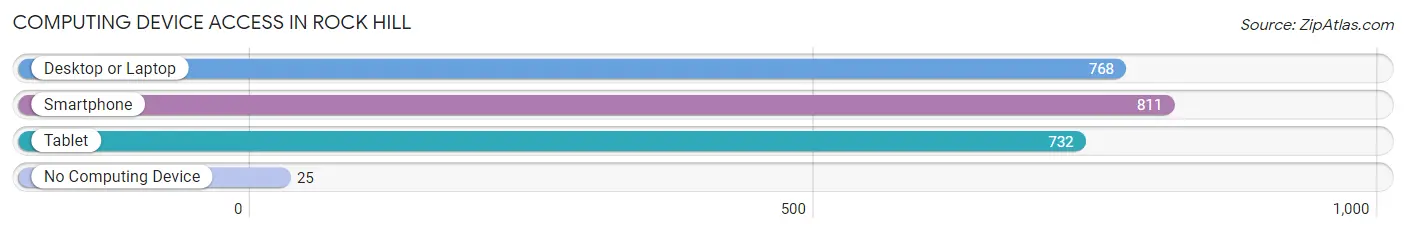
| Device Type | # Households | % Households |
| Desktop or Laptop | 768 | 84.4% |
| Smartphone | 811 | 89.1% |
| Tablet | 732 | 80.4% |
| No Computing Device | 25 | 2.8% |
| Total | 910 | 100.0% |
Internet Access in Rock Hill
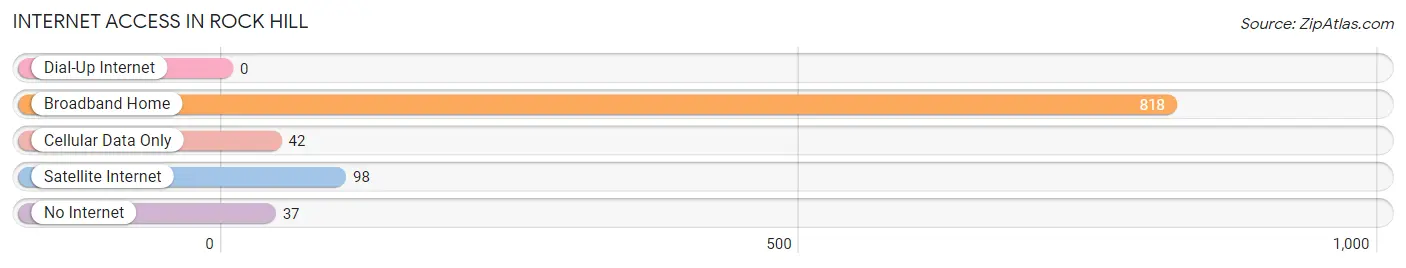
| Internet Type | # Households | % Households |
| Dial-Up Internet | 0 | 0.0% |
| Broadband Home | 818 | 89.9% |
| Cellular Data Only | 42 | 4.6% |
| Satellite Internet | 98 | 10.8% |
| No Internet | 37 | 4.1% |
| Total | 910 | 100.0% |
Rock Hill Summary
Introduction
Rock Hill is a small town located in Sullivan County, New York. It is situated in the foothills of the Catskill Mountains, and is part of the larger Sullivan County region. The town has a population of approximately 4,000 people, and is known for its rural charm and natural beauty. Rock Hill is a popular destination for outdoor recreation, and is home to a variety of attractions, including the Bethel Woods Center for the Arts, the Catskill Mountain Railroad, and the Rock Hill Golf Course.
History
Rock Hill was first settled in 1790 by a group of settlers from Connecticut. The town was originally known as “Rock Hill” due to the rocky terrain of the area. The town was officially incorporated in 1809, and was named after the rocky hills that surrounded the area.
In the early 19th century, Rock Hill was a thriving agricultural community. The town was home to a variety of farms, and the local economy was largely based on the production of dairy products, grains, and livestock. The town also had a thriving lumber industry, and the local sawmills provided much of the lumber used in the construction of homes and businesses in the area.
In the late 19th century, Rock Hill began to experience a period of growth and development. The town was home to a variety of businesses, including a hotel, a bank, and a variety of stores. The town also had a thriving tourism industry, and the local hotels and resorts attracted visitors from all over the country.
Geography
Rock Hill is located in the foothills of the Catskill Mountains in Sullivan County, New York. The town is situated on the western edge of the Catskill Park, and is bordered by the towns of Bethel, Liberty, and Neversink. The town is located approximately 70 miles from New York City, and is accessible via the New York State Thruway.
The town of Rock Hill is situated on a plateau, and is surrounded by rolling hills and valleys. The town is home to a variety of natural features, including the Neversink River, the Mongaup River, and the Shawangunk Mountains. The town is also home to a variety of parks and recreational areas, including the Bethel Woods Center for the Arts, the Rock Hill Golf Course, and the Catskill Mountain Railroad.
Economy
The economy of Rock Hill is largely based on tourism and outdoor recreation. The town is home to a variety of attractions, including the Bethel Woods Center for the Arts, the Catskill Mountain Railroad, and the Rock Hill Golf Course. The town is also home to a variety of restaurants, shops, and other businesses.
The town is also home to a variety of manufacturing and industrial businesses. The town is home to a variety of manufacturing plants, including a paper mill, a plastics factory, and a printing plant. The town is also home to a variety of service businesses, including a variety of medical and dental offices, and a variety of professional services.
Demographics
As of the 2010 census, the town of Rock Hill had a population of 4,000 people. The town has a median household income of $50,000, and the median age of the population is 44. The town is predominantly white, with approximately 90% of the population identifying as Caucasian. The town is also home to a variety of other ethnicities, including African American, Hispanic, and Asian.
Conclusion
Rock Hill is a small town located in Sullivan County, New York. The town is situated in the foothills of the Catskill Mountains, and is known for its rural charm and natural beauty. The town has a population of approximately 4,000 people, and is home to a variety of attractions, including the Bethel Woods Center for the Arts, the Catskill Mountain Railroad, and the Rock Hill Golf Course. The economy of Rock Hill is largely based on tourism and outdoor recreation, and the town is home to a variety of manufacturing and industrial businesses. The town is predominantly white, with approximately 90% of the population identifying as Caucasian.
Common Questions
What is Per Capita Income in Rock Hill?
Per Capita income in Rock Hill is $86,009.
What is the Median Family Income in Rock Hill?
Median Family Income in Rock Hill is $152,865.
What is the Median Household income in Rock Hill?
Median Household Income in Rock Hill is $108,333.
What is Income or Wage Gap in Rock Hill?
Income or Wage Gap in Rock Hill is 53.2%.
Women in Rock Hill earn 46.8 cents for every dollar earned by a man.
What is Inequality or Gini Index in Rock Hill?
Inequality or Gini Index in Rock Hill is 0.55.
What is the Total Population of Rock Hill?
Total Population of Rock Hill is 2,384.
What is the Total Male Population of Rock Hill?
Total Male Population of Rock Hill is 1,231.
What is the Total Female Population of Rock Hill?
Total Female Population of Rock Hill is 1,153.
What is the Ratio of Males per 100 Females in Rock Hill?
There are 106.76 Males per 100 Females in Rock Hill.
What is the Ratio of Females per 100 Males in Rock Hill?
There are 93.66 Females per 100 Males in Rock Hill.
What is the Median Population Age in Rock Hill?
Median Population Age in Rock Hill is 50.5 Years.
What is the Average Family Size in Rock Hill
Average Family Size in Rock Hill is 3.1 People.
What is the Average Household Size in Rock Hill
Average Household Size in Rock Hill is 2.6 People.
How Large is the Labor Force in Rock Hill?
There are 1,049 People in the Labor Forcein in Rock Hill.
What is the Percentage of People in the Labor Force in Rock Hill?
52.7% of People are in the Labor Force in Rock Hill.
What is the Unemployment Rate in Rock Hill?
Unemployment Rate in Rock Hill is 8.2%.