Montgomery, NY Map & Demographics
Montgomery Map
Montgomery Overview
$39,378
PER CAPITA INCOME
$112,269
AVG FAMILY INCOME
$89,107
AVG HOUSEHOLD INCOME
34.6%
WAGE / INCOME GAP [ % ]
65.4¢/ $1
WAGE / INCOME GAP [ $ ]
0.45
INEQUALITY / GINI INDEX
3,797
TOTAL POPULATION
1,756
MALE POPULATION
2,041
FEMALE POPULATION
86.04
MALES / 100 FEMALES
116.23
FEMALES / 100 MALES
38.5
MEDIAN AGE
3.4
AVG FAMILY SIZE
2.6
AVG HOUSEHOLD SIZE
1,812
LABOR FORCE [ PEOPLE ]
59.6%
PERCENT IN LABOR FORCE
2.7%
UNEMPLOYMENT RATE
Montgomery Zip Codes
Montgomery Area Codes
Income in Montgomery
Income Overview in Montgomery
Per Capita Income in Montgomery is $39,378, while median incomes of families and households are $112,269 and $89,107 respectively.
| Characteristic | Number | Measure |
| Per Capita Income | 3,797 | $39,378 |
| Median Family Income | 883 | $112,269 |
| Mean Family Income | 883 | $124,658 |
| Median Household Income | 1,471 | $89,107 |
| Mean Household Income | 1,471 | $100,584 |
| Income Deficit | 883 | $0 |
| Wage / Income Gap (%) | 3,797 | 34.56% |
| Wage / Income Gap ($) | 3,797 | 65.44¢ per $1 |
| Gini / Inequality Index | 3,797 | 0.45 |
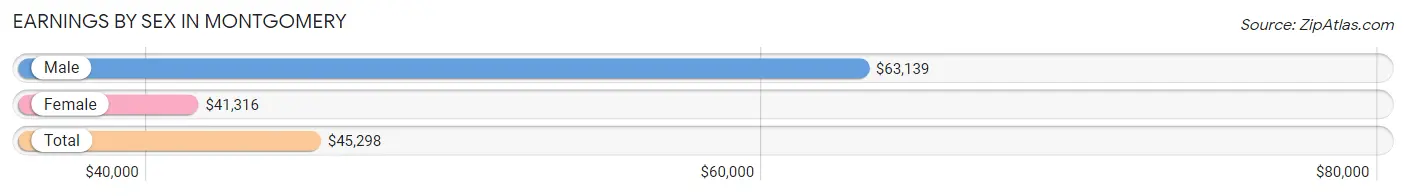
Earnings by Sex in Montgomery
Average Earnings in Montgomery are $45,298, $63,139 for men and $41,316 for women, a difference of 34.6%.
| Sex | Number | Average Earnings |
| Male | 1,019 (51.8%) | $63,139 |
| Female | 948 (48.2%) | $41,316 |
| Total | 1,967 (100.0%) | $45,298 |
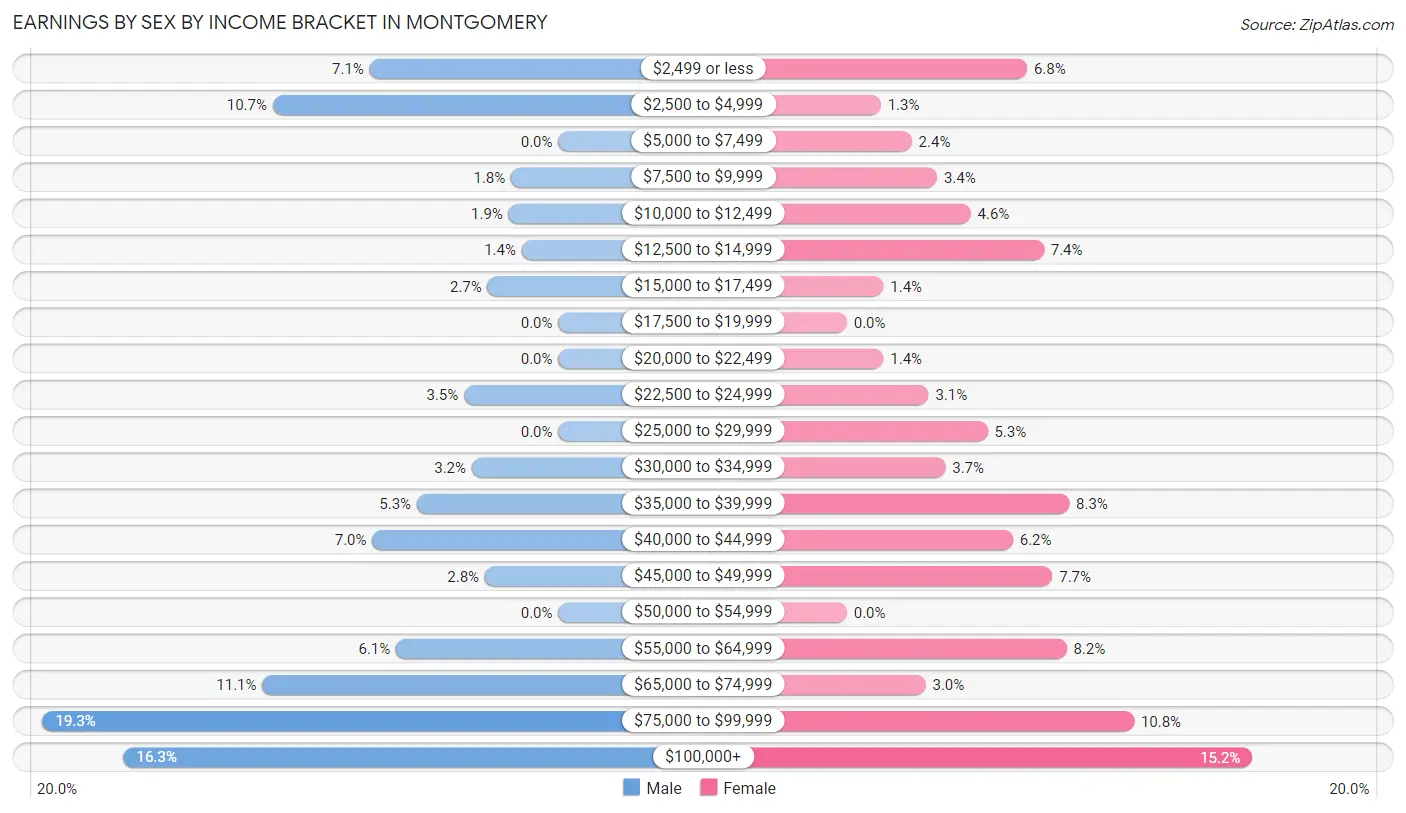
Earnings by Sex by Income Bracket in Montgomery
The most common earnings brackets in Montgomery are $75,000 to $99,999 for men (197 | 19.3%) and $100,000+ for women (144 | 15.2%).
| Income | Male | Female |
| $2,499 or less | 72 (7.1%) | 64 (6.8%) |
| $2,500 to $4,999 | 109 (10.7%) | 12 (1.3%) |
| $5,000 to $7,499 | 0 (0.0%) | 23 (2.4%) |
| $7,500 to $9,999 | 18 (1.8%) | 32 (3.4%) |
| $10,000 to $12,499 | 19 (1.9%) | 44 (4.6%) |
| $12,500 to $14,999 | 14 (1.4%) | 70 (7.4%) |
| $15,000 to $17,499 | 27 (2.6%) | 13 (1.4%) |
| $17,500 to $19,999 | 0 (0.0%) | 0 (0.0%) |
| $20,000 to $22,499 | 0 (0.0%) | 13 (1.4%) |
| $22,500 to $24,999 | 36 (3.5%) | 29 (3.1%) |
| $25,000 to $29,999 | 0 (0.0%) | 50 (5.3%) |
| $30,000 to $34,999 | 33 (3.2%) | 35 (3.7%) |
| $35,000 to $39,999 | 54 (5.3%) | 79 (8.3%) |
| $40,000 to $44,999 | 71 (7.0%) | 59 (6.2%) |
| $45,000 to $49,999 | 28 (2.8%) | 73 (7.7%) |
| $50,000 to $54,999 | 0 (0.0%) | 0 (0.0%) |
| $55,000 to $64,999 | 62 (6.1%) | 78 (8.2%) |
| $65,000 to $74,999 | 113 (11.1%) | 28 (2.9%) |
| $75,000 to $99,999 | 197 (19.3%) | 102 (10.8%) |
| $100,000+ | 166 (16.3%) | 144 (15.2%) |
| Total | 1,019 (100.0%) | 948 (100.0%) |
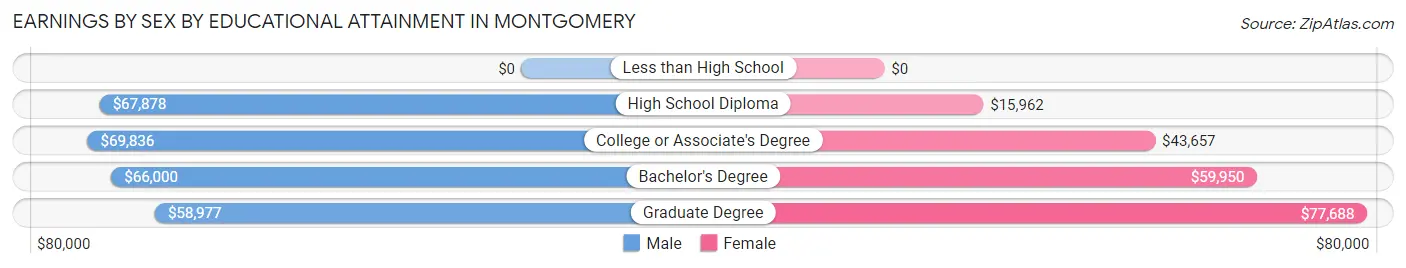
Earnings by Sex by Educational Attainment in Montgomery
Average earnings in Montgomery are $67,840 for men and $45,143 for women, a difference of 33.5%. Men with an educational attainment of college or associate's degree enjoy the highest average annual earnings of $69,836, while those with graduate degree education earn the least with $58,977. Women with an educational attainment of graduate degree earn the most with the average annual earnings of $77,688, while those with high school diploma education have the smallest earnings of $15,962.
| Educational Attainment | Male Income | Female Income |
| Less than High School | - | - |
| High School Diploma | $67,878 | $15,962 |
| College or Associate's Degree | $69,836 | $43,657 |
| Bachelor's Degree | $66,000 | $59,950 |
| Graduate Degree | $58,977 | $77,688 |
| Total | $67,840 | $45,143 |
Family Income in Montgomery
Family Income Brackets in Montgomery
According to the Montgomery family income data, there are 304 families falling into the $100,000 to $149,999 income range, which is the most common income bracket and makes up 34.4% of all families.
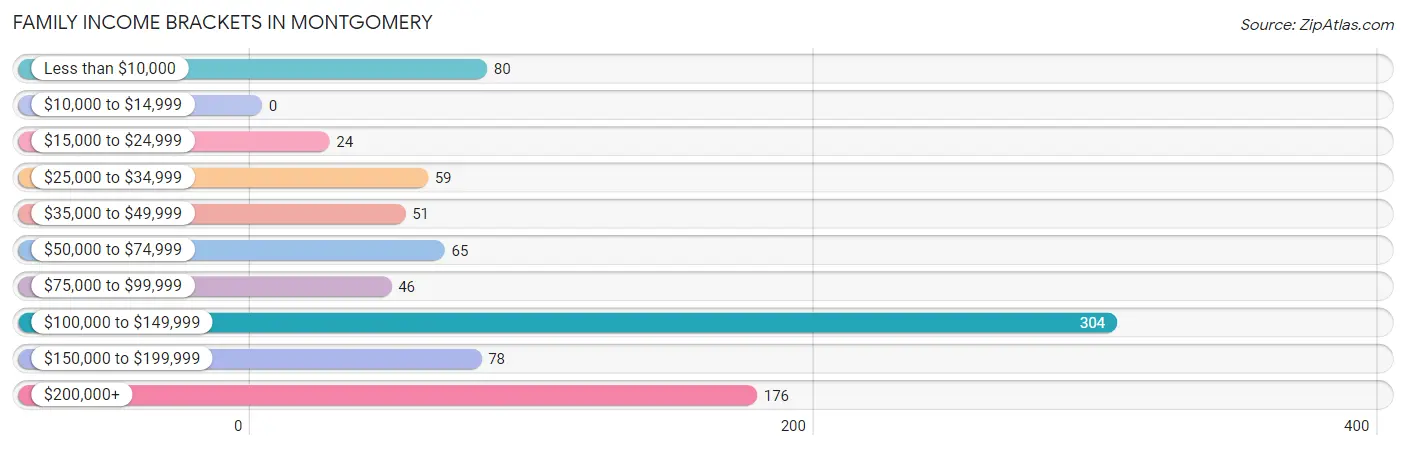
| Income Bracket | # Families | % Families |
| Less than $10,000 | 80 | 9.1% |
| $10,000 to $14,999 | 0 | 0.0% |
| $15,000 to $24,999 | 24 | 2.7% |
| $25,000 to $34,999 | 59 | 6.7% |
| $35,000 to $49,999 | 51 | 5.8% |
| $50,000 to $74,999 | 65 | 7.4% |
| $75,000 to $99,999 | 46 | 5.2% |
| $100,000 to $149,999 | 304 | 34.4% |
| $150,000 to $199,999 | 78 | 8.8% |
| $200,000+ | 176 | 19.9% |
Family Income by Famaliy Size in Montgomery
4-person families (201 | 22.8%) account for the highest median family income in Montgomery with $117,533 per family, while 2-person families (295 | 33.4%) have the highest median income of $49,140 per family member.
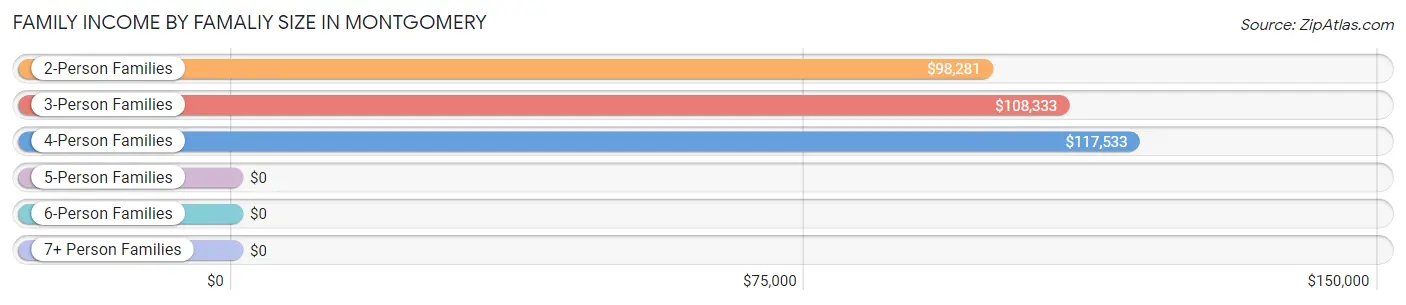
| Income Bracket | # Families | Median Income |
| 2-Person Families | 295 (33.4%) | $98,281 |
| 3-Person Families | 206 (23.3%) | $108,333 |
| 4-Person Families | 201 (22.8%) | $117,533 |
| 5-Person Families | 116 (13.1%) | $0 |
| 6-Person Families | 50 (5.7%) | $0 |
| 7+ Person Families | 15 (1.7%) | $0 |
| Total | 883 (100.0%) | $112,269 |
Family Income by Number of Earners in Montgomery
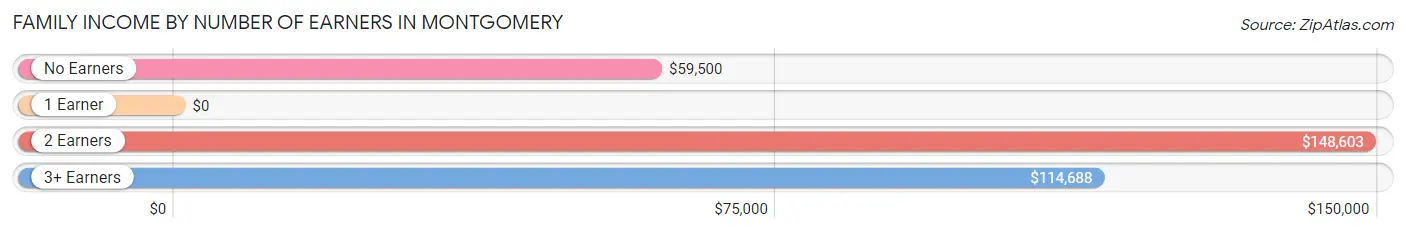
| Number of Earners | # Families | Median Income |
| No Earners | 114 (12.9%) | $59,500 |
| 1 Earner | 268 (30.3%) | $0 |
| 2 Earners | 345 (39.1%) | $148,603 |
| 3+ Earners | 156 (17.7%) | $114,688 |
| Total | 883 (100.0%) | $112,269 |
Household Income in Montgomery
Household Income Brackets in Montgomery
With 399 households falling in the category, the $100,000 to $149,999 income range is the most frequent in Montgomery, accounting for 27.1% of all households. In contrast, only 22 households (1.5%) fall into the $10,000 to $14,999 income bracket, making it the least populous group.
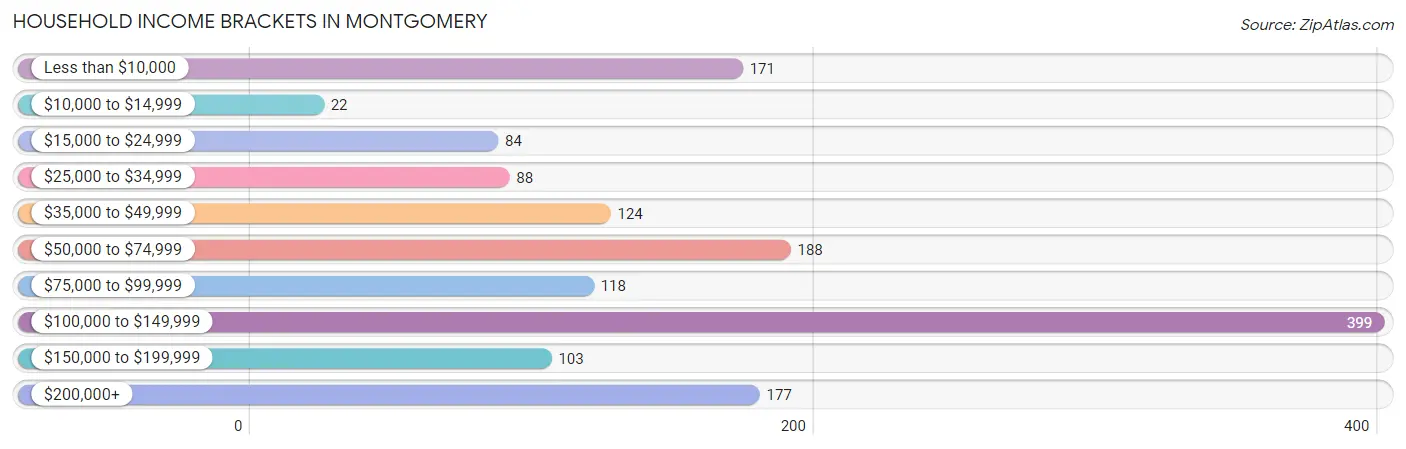
| Income Bracket | # Households | % Households |
| Less than $10,000 | 171 | 11.6% |
| $10,000 to $14,999 | 22 | 1.5% |
| $15,000 to $24,999 | 84 | 5.7% |
| $25,000 to $34,999 | 88 | 6.0% |
| $35,000 to $49,999 | 124 | 8.4% |
| $50,000 to $74,999 | 188 | 12.8% |
| $75,000 to $99,999 | 118 | 8.0% |
| $100,000 to $149,999 | 399 | 27.1% |
| $150,000 to $199,999 | 103 | 7.0% |
| $200,000+ | 177 | 12.0% |
Household Income by Householder Age in Montgomery
The median household income in Montgomery is $89,107, with the highest median household income of $110,313 found in the 45 to 64 years age bracket for the primary householder. A total of 483 households (32.8%) fall into this category. Meanwhile, the 15 to 24 years age bracket for the primary householder has the lowest median household income of $0, with 47 households (3.2%) in this group.
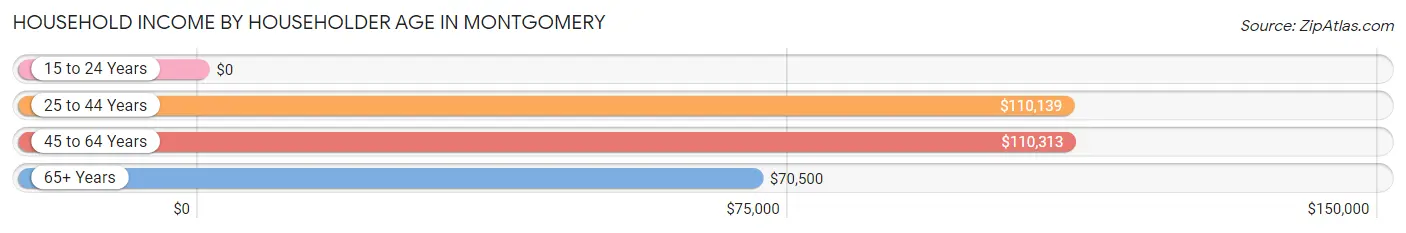
| Income Bracket | # Households | Median Income |
| 15 to 24 Years | 47 (3.2%) | $0 |
| 25 to 44 Years | 427 (29.0%) | $110,139 |
| 45 to 64 Years | 483 (32.8%) | $110,313 |
| 65+ Years | 514 (34.9%) | $70,500 |
| Total | 1,471 (100.0%) | $89,107 |
Poverty in Montgomery
Income Below Poverty by Sex and Age in Montgomery
With 9.2% poverty level for males and 19.6% for females among the residents of Montgomery, 6 to 11 year old males and 6 to 11 year old females are the most vulnerable to poverty, with 56 males (60.2%) and 188 females (76.1%) in their respective age groups living below the poverty level.
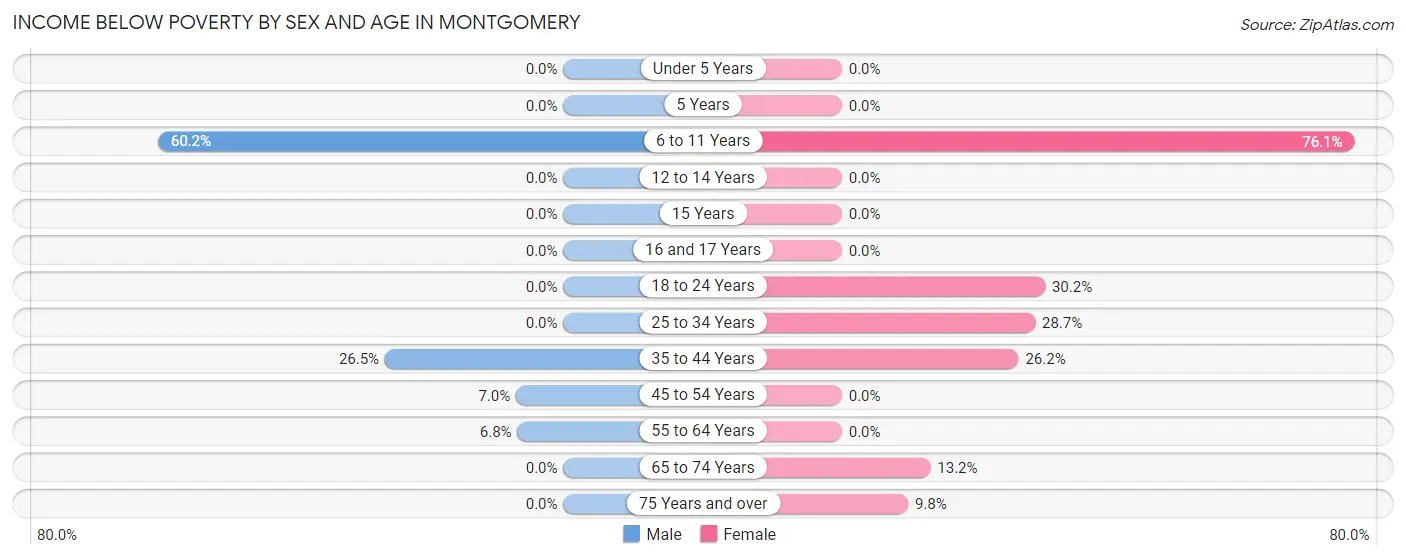
| Age Bracket | Male | Female |
| Under 5 Years | 0 (0.0%) | 0 (0.0%) |
| 5 Years | 0 (0.0%) | 0 (0.0%) |
| 6 to 11 Years | 56 (60.2%) | 188 (76.1%) |
| 12 to 14 Years | 0 (0.0%) | 0 (0.0%) |
| 15 Years | 0 (0.0%) | 0 (0.0%) |
| 16 and 17 Years | 0 (0.0%) | 0 (0.0%) |
| 18 to 24 Years | 0 (0.0%) | 35 (30.2%) |
| 25 to 34 Years | 0 (0.0%) | 62 (28.7%) |
| 35 to 44 Years | 80 (26.5%) | 58 (26.2%) |
| 45 to 54 Years | 13 (7.0%) | 0 (0.0%) |
| 55 to 64 Years | 12 (6.8%) | 0 (0.0%) |
| 65 to 74 Years | 0 (0.0%) | 38 (13.2%) |
| 75 Years and over | 0 (0.0%) | 18 (9.8%) |
| Total | 161 (9.2%) | 399 (19.6%) |
Income Above Poverty by Sex and Age in Montgomery
According to the poverty statistics in Montgomery, males aged under 5 years and females aged under 5 years are the age groups that are most secure financially, with 100.0% of males and 100.0% of females in these age groups living above the poverty line.
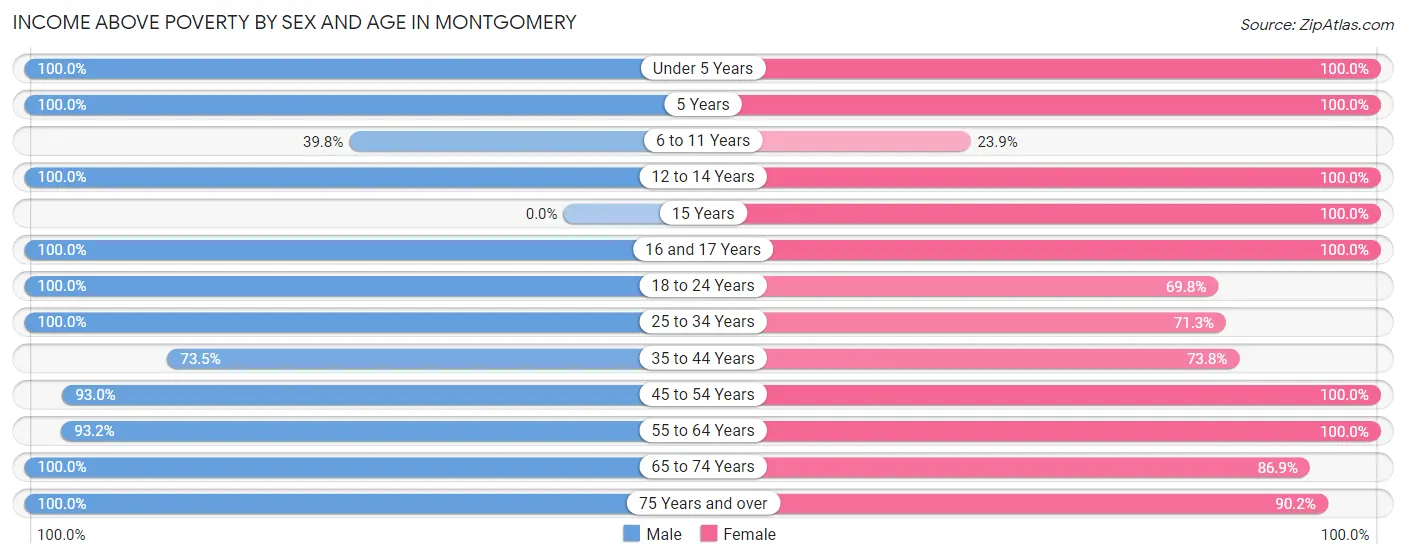
| Age Bracket | Male | Female |
| Under 5 Years | 85 (100.0%) | 121 (100.0%) |
| 5 Years | 10 (100.0%) | 36 (100.0%) |
| 6 to 11 Years | 37 (39.8%) | 59 (23.9%) |
| 12 to 14 Years | 67 (100.0%) | 73 (100.0%) |
| 15 Years | 0 (0.0%) | 24 (100.0%) |
| 16 and 17 Years | 96 (100.0%) | 68 (100.0%) |
| 18 to 24 Years | 204 (100.0%) | 81 (69.8%) |
| 25 to 34 Years | 251 (100.0%) | 154 (71.3%) |
| 35 to 44 Years | 222 (73.5%) | 163 (73.8%) |
| 45 to 54 Years | 172 (93.0%) | 219 (100.0%) |
| 55 to 64 Years | 164 (93.2%) | 228 (100.0%) |
| 65 to 74 Years | 142 (100.0%) | 251 (86.9%) |
| 75 Years and over | 145 (100.0%) | 165 (90.2%) |
| Total | 1,595 (90.8%) | 1,642 (80.4%) |
Income Below Poverty Among Married-Couple Families in Montgomery
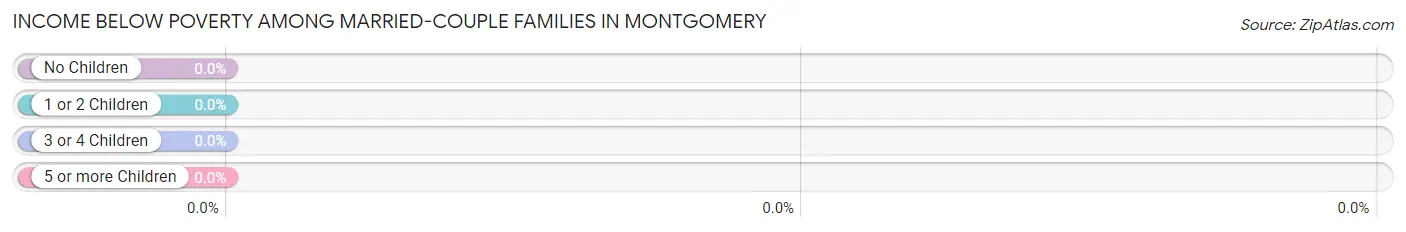
| Children | Above Poverty | Below Poverty |
| No Children | 294 (100.0%) | 0 (0.0%) |
| 1 or 2 Children | 230 (100.0%) | 0 (0.0%) |
| 3 or 4 Children | 90 (100.0%) | 0 (0.0%) |
| 5 or more Children | 0 (0.0%) | 0 (0.0%) |
| Total | 614 (100.0%) | 0 (0.0%) |
Income Below Poverty Among Single-Parent Households in Montgomery
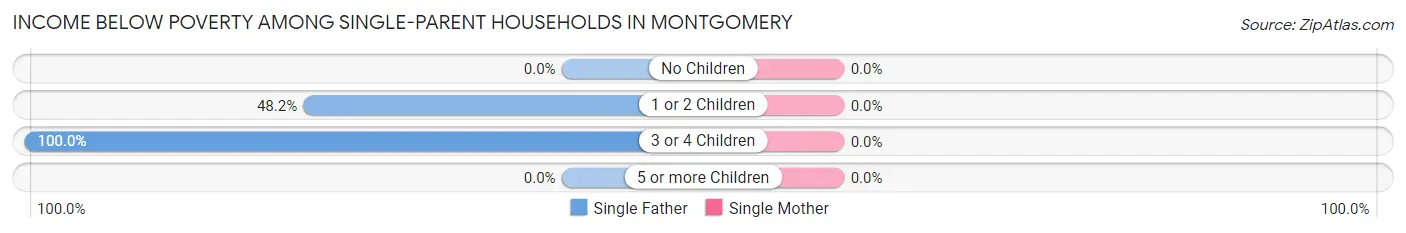
| Children | Single Father | Single Mother |
| No Children | 0 (0.0%) | 0 (0.0%) |
| 1 or 2 Children | 13 (48.1%) | 0 (0.0%) |
| 3 or 4 Children | 80 (100.0%) | 0 (0.0%) |
| 5 or more Children | 0 (0.0%) | 0 (0.0%) |
| Total | 93 (64.1%) | 0 (0.0%) |
Income Below Poverty Among Married-Couple vs Single-Parent Households in Montgomery
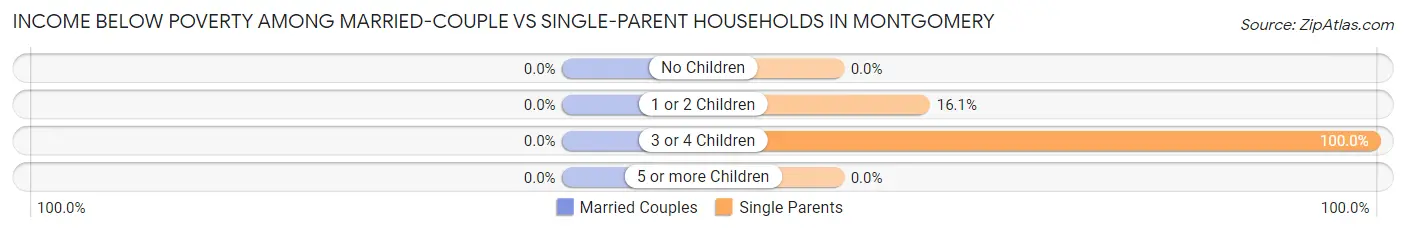
| Children | Married-Couple Families | Single-Parent Households |
| No Children | 0 (0.0%) | 0 (0.0%) |
| 1 or 2 Children | 0 (0.0%) | 13 (16.1%) |
| 3 or 4 Children | 0 (0.0%) | 80 (100.0%) |
| 5 or more Children | 0 (0.0%) | 0 (0.0%) |
| Total | 0 (0.0%) | 93 (34.6%) |
Race in Montgomery
The most populous races in Montgomery are White / Caucasian (2,514 | 66.2%), Hispanic or Latino (1,077 | 28.4%), and Black / African American (744 | 19.6%).
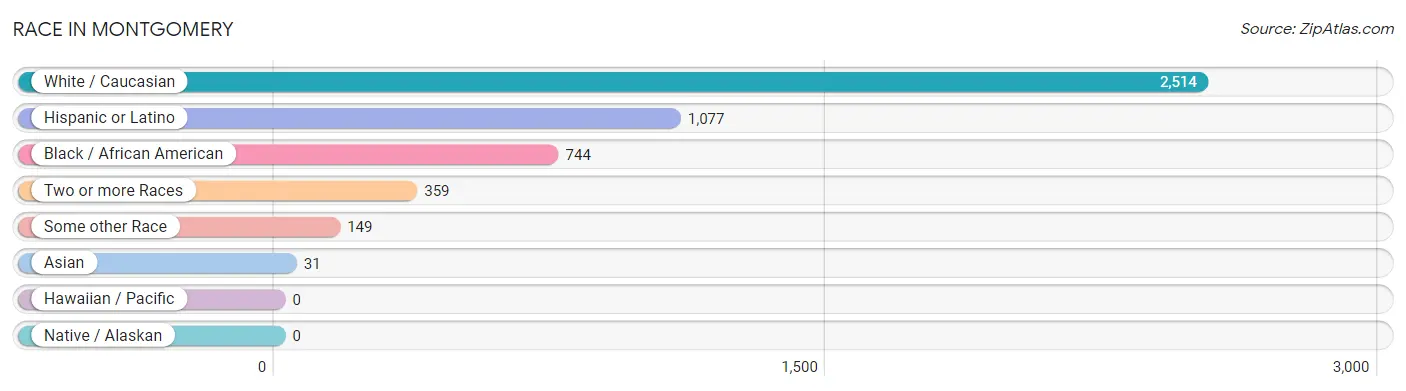
| Race | # Population | % Population |
| Asian | 31 | 0.8% |
| Black / African American | 744 | 19.6% |
| Hawaiian / Pacific | 0 | 0.0% |
| Hispanic or Latino | 1,077 | 28.4% |
| Native / Alaskan | 0 | 0.0% |
| White / Caucasian | 2,514 | 66.2% |
| Two or more Races | 359 | 9.5% |
| Some other Race | 149 | 3.9% |
| Total | 3,797 | 100.0% |
Ancestry in Montgomery
The most populous ancestries reported in Montgomery are Puerto Rican (811 | 21.4%), Italian (785 | 20.7%), Irish (499 | 13.1%), German (465 | 12.2%), and English (286 | 7.5%), together accounting for 74.9% of all Montgomery residents.
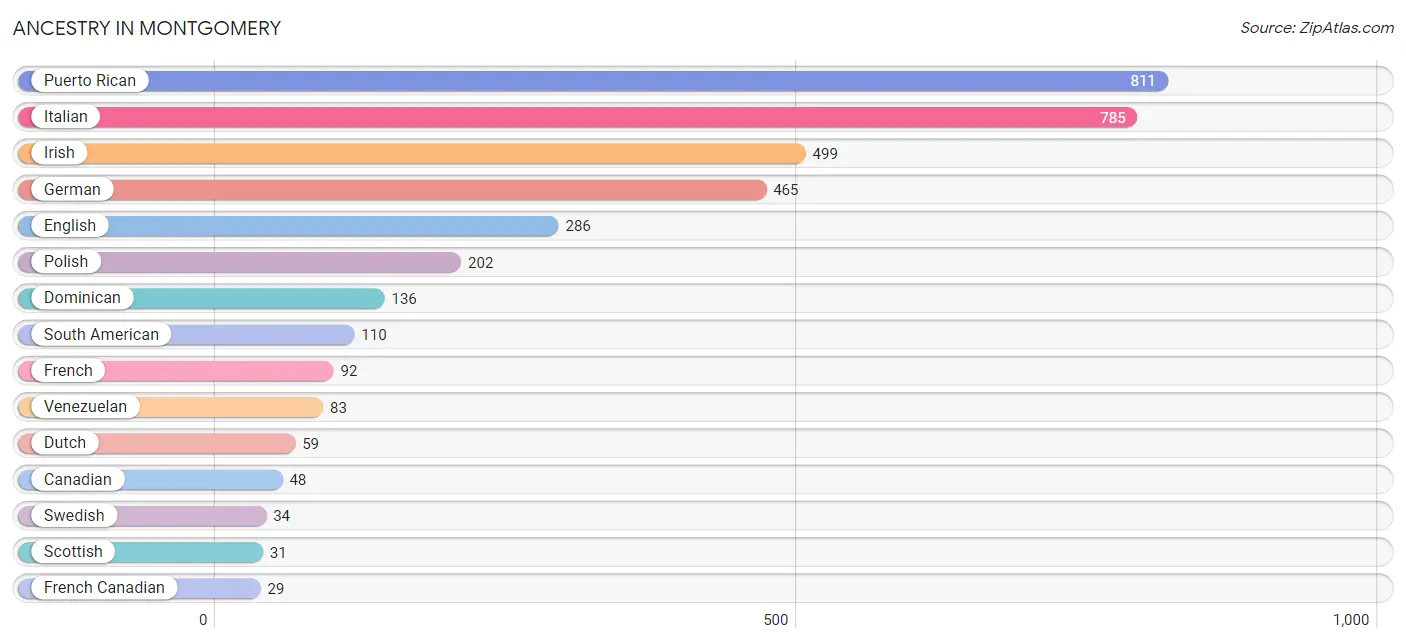
| Ancestry | # Population | % Population |
| American | 14 | 0.4% |
| Argentinean | 17 | 0.4% |
| Austrian | 26 | 0.7% |
| Burmese | 12 | 0.3% |
| Canadian | 48 | 1.3% |
| Cherokee | 22 | 0.6% |
| Colombian | 10 | 0.3% |
| Dominican | 136 | 3.6% |
| Dutch | 59 | 1.5% |
| Eastern European | 7 | 0.2% |
| English | 286 | 7.5% |
| European | 17 | 0.4% |
| French | 92 | 2.4% |
| French Canadian | 29 | 0.8% |
| German | 465 | 12.2% |
| Greek | 9 | 0.2% |
| Irish | 499 | 13.1% |
| Italian | 785 | 20.7% |
| Mexican | 20 | 0.5% |
| Mongolian | 10 | 0.3% |
| Norwegian | 9 | 0.2% |
| Pakistani | 9 | 0.2% |
| Polish | 202 | 5.3% |
| Puerto Rican | 811 | 21.4% |
| Russian | 22 | 0.6% |
| Scottish | 31 | 0.8% |
| South American | 110 | 2.9% |
| Swedish | 34 | 0.9% |
| Swiss | 10 | 0.3% |
| Ukrainian | 23 | 0.6% |
| Venezuelan | 83 | 2.2% |
| Welsh | 13 | 0.3% | View All 32 Rows |
Immigrants in Montgomery
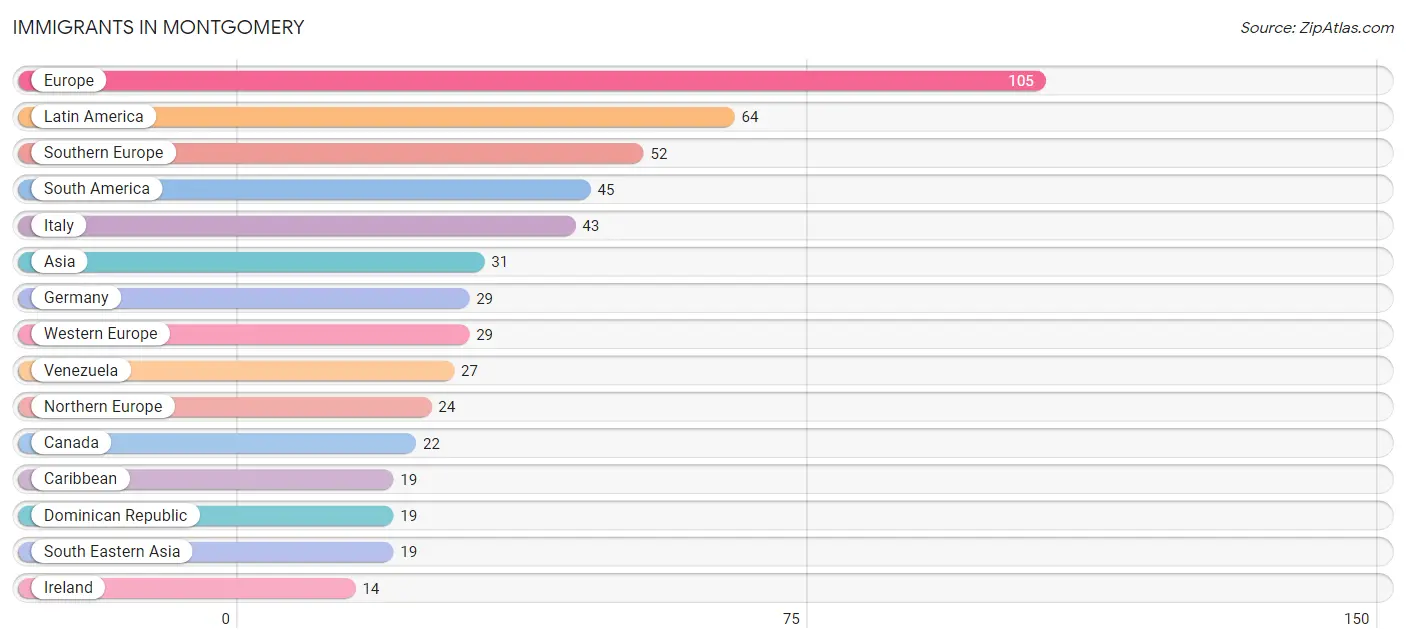
The most numerous immigrant groups reported in Montgomery came from Europe (105 | 2.8%), Latin America (64 | 1.7%), Southern Europe (52 | 1.4%), South America (45 | 1.2%), and Italy (43 | 1.1%), together accounting for 8.2% of all Montgomery residents.
| Immigration Origin | # Population | % Population |
| Argentina | 8 | 0.2% |
| Asia | 31 | 0.8% |
| Canada | 22 | 0.6% |
| Caribbean | 19 | 0.5% |
| Colombia | 10 | 0.3% |
| Dominican Republic | 19 | 0.5% |
| Eastern Asia | 12 | 0.3% |
| Europe | 105 | 2.8% |
| Germany | 29 | 0.8% |
| Greece | 9 | 0.2% |
| Ireland | 14 | 0.4% |
| Italy | 43 | 1.1% |
| Korea | 12 | 0.3% |
| Latin America | 64 | 1.7% |
| Northern Europe | 24 | 0.6% |
| Philippines | 10 | 0.3% |
| South America | 45 | 1.2% |
| South Eastern Asia | 19 | 0.5% |
| Southern Europe | 52 | 1.4% |
| Thailand | 9 | 0.2% |
| Venezuela | 27 | 0.7% |
| Western Europe | 29 | 0.8% | View All 22 Rows |
Sex and Age in Montgomery
Sex and Age in Montgomery
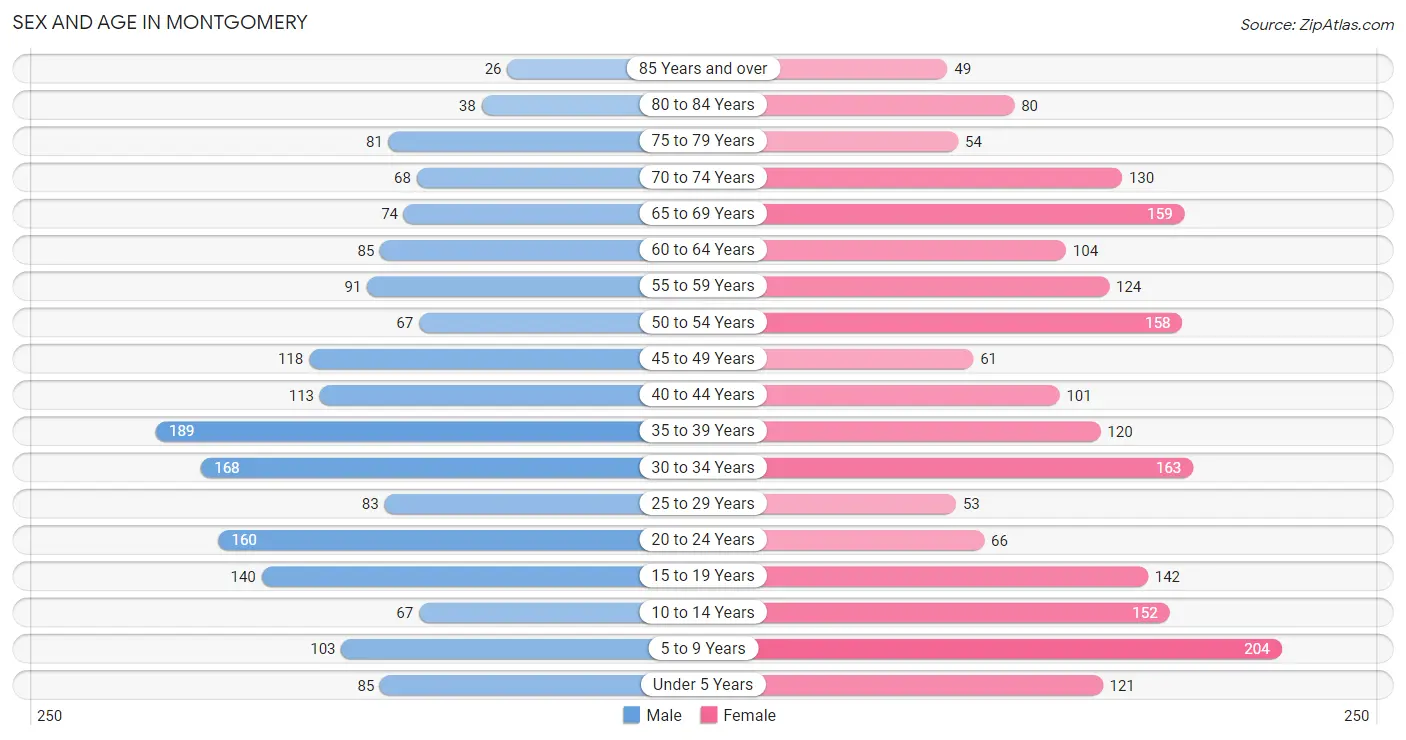
The most populous age groups in Montgomery are 35 to 39 Years (189 | 10.8%) for men and 5 to 9 Years (204 | 10.0%) for women.
| Age Bracket | Male | Female |
| Under 5 Years | 85 (4.8%) | 121 (5.9%) |
| 5 to 9 Years | 103 (5.9%) | 204 (10.0%) |
| 10 to 14 Years | 67 (3.8%) | 152 (7.4%) |
| 15 to 19 Years | 140 (8.0%) | 142 (7.0%) |
| 20 to 24 Years | 160 (9.1%) | 66 (3.2%) |
| 25 to 29 Years | 83 (4.7%) | 53 (2.6%) |
| 30 to 34 Years | 168 (9.6%) | 163 (8.0%) |
| 35 to 39 Years | 189 (10.8%) | 120 (5.9%) |
| 40 to 44 Years | 113 (6.4%) | 101 (5.0%) |
| 45 to 49 Years | 118 (6.7%) | 61 (3.0%) |
| 50 to 54 Years | 67 (3.8%) | 158 (7.7%) |
| 55 to 59 Years | 91 (5.2%) | 124 (6.1%) |
| 60 to 64 Years | 85 (4.8%) | 104 (5.1%) |
| 65 to 69 Years | 74 (4.2%) | 159 (7.8%) |
| 70 to 74 Years | 68 (3.9%) | 130 (6.4%) |
| 75 to 79 Years | 81 (4.6%) | 54 (2.6%) |
| 80 to 84 Years | 38 (2.2%) | 80 (3.9%) |
| 85 Years and over | 26 (1.5%) | 49 (2.4%) |
| Total | 1,756 (100.0%) | 2,041 (100.0%) |
Families and Households in Montgomery
Median Family Size in Montgomery
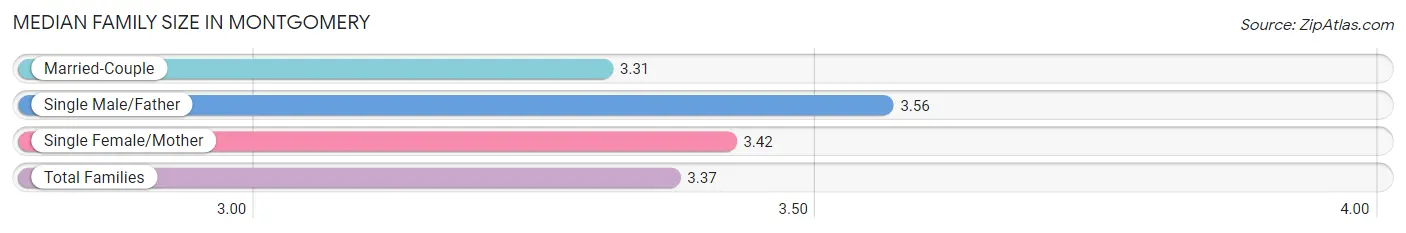
The median family size in Montgomery is 3.37 persons per family, with single male/father families (145 | 16.4%) accounting for the largest median family size of 3.56 persons per family. On the other hand, married-couple families (614 | 69.5%) represent the smallest median family size with 3.31 persons per family.
| Family Type | # Families | Family Size |
| Married-Couple | 614 (69.5%) | 3.31 |
| Single Male/Father | 145 (16.4%) | 3.56 |
| Single Female/Mother | 124 (14.0%) | 3.42 |
| Total Families | 883 (100.0%) | 3.37 |
Median Household Size in Montgomery
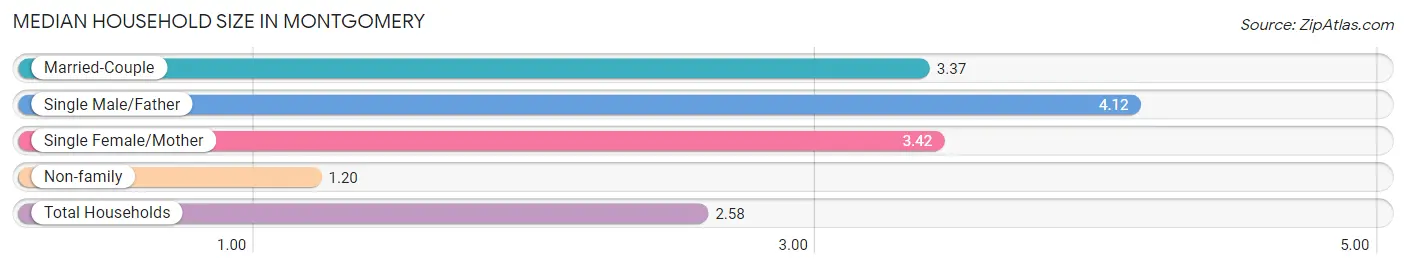
The median household size in Montgomery is 2.58 persons per household, with single male/father households (145 | 9.9%) accounting for the largest median household size of 4.12 persons per household. non-family households (588 | 40.0%) represent the smallest median household size with 1.20 persons per household.
| Household Type | # Households | Household Size |
| Married-Couple | 614 (41.7%) | 3.37 |
| Single Male/Father | 145 (9.9%) | 4.12 |
| Single Female/Mother | 124 (8.4%) | 3.42 |
| Non-family | 588 (40.0%) | 1.20 |
| Total Households | 1,471 (100.0%) | 2.58 |
Household Size by Marriage Status in Montgomery
Out of a total of 1,471 households in Montgomery, 883 (60.0%) are family households, while 588 (40.0%) are nonfamily households. The most numerous type of family households are 2-person households, comprising 262, and the most common type of nonfamily households are 1-person households, comprising 492.
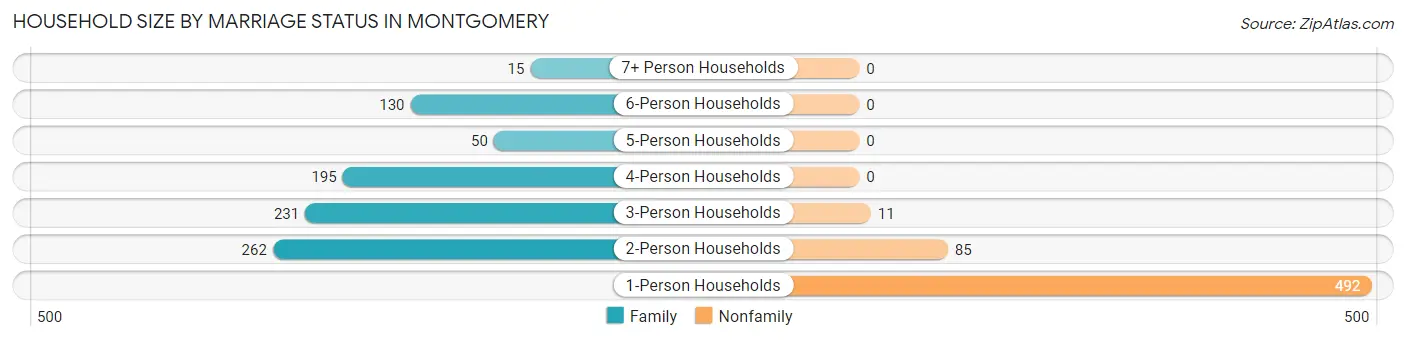
| Household Size | Family Households | Nonfamily Households |
| 1-Person Households | - | 492 (33.5%) |
| 2-Person Households | 262 (17.8%) | 85 (5.8%) |
| 3-Person Households | 231 (15.7%) | 11 (0.7%) |
| 4-Person Households | 195 (13.3%) | 0 (0.0%) |
| 5-Person Households | 50 (3.4%) | 0 (0.0%) |
| 6-Person Households | 130 (8.8%) | 0 (0.0%) |
| 7+ Person Households | 15 (1.0%) | 0 (0.0%) |
| Total | 883 (60.0%) | 588 (40.0%) |
Female Fertility in Montgomery
Fertility by Age in Montgomery
Average fertility rate in Montgomery is 31.0 births per 1,000 women. Women in the age bracket of 20 to 34 years have the highest fertility rate with 82.0 births per 1,000 women. Women in the age bracket of 20 to 34 years acount for 100.0% of all women with births.
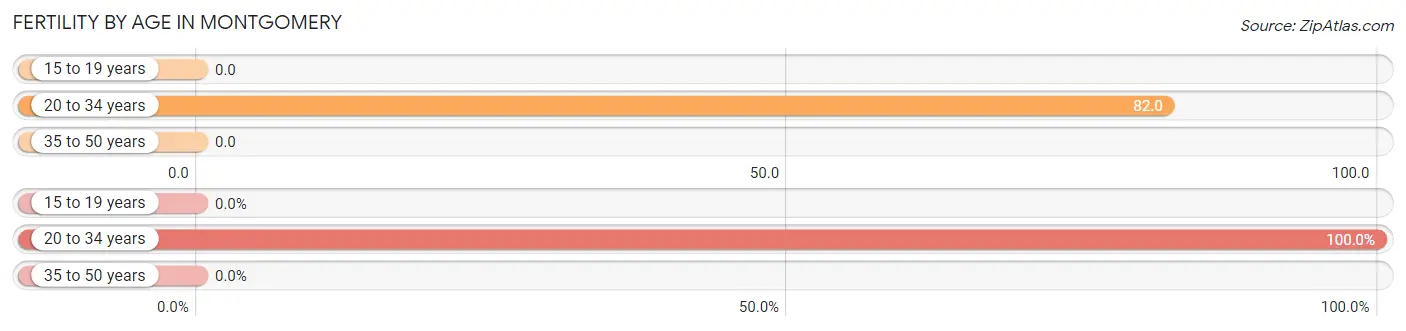
| Age Bracket | Women with Births | Births / 1,000 Women |
| 15 to 19 years | 0 (0.0%) | 0.0 |
| 20 to 34 years | 23 (100.0%) | 82.0 |
| 35 to 50 years | 0 (0.0%) | 0.0 |
| Total | 23 (100.0%) | 31.0 |
Fertility by Age by Marriage Status in Montgomery
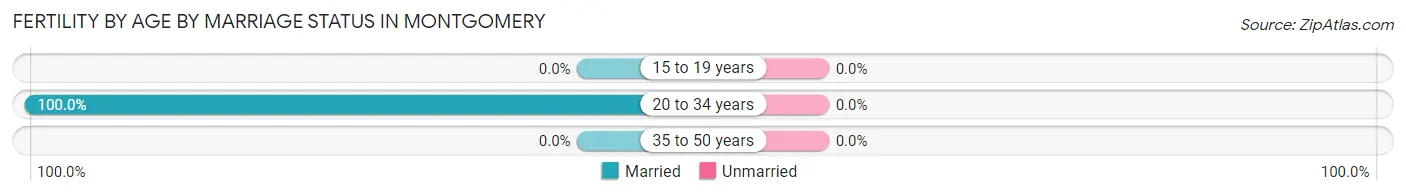
| Age Bracket | Married | Unmarried |
| 15 to 19 years | 0 (0.0%) | 0 (0.0%) |
| 20 to 34 years | 23 (100.0%) | 0 (0.0%) |
| 35 to 50 years | 0 (0.0%) | 0 (0.0%) |
| Total | 23 (100.0%) | 0 (0.0%) |
Fertility by Education in Montgomery
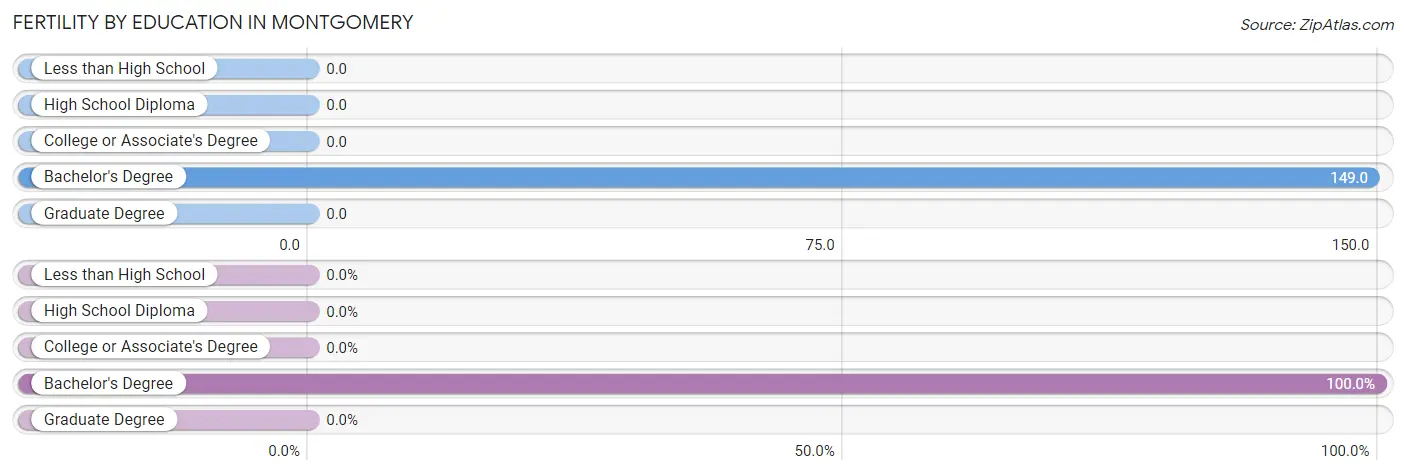
| Educational Attainment | Women with Births | Births / 1,000 Women |
| Less than High School | 0 (0.0%) | 0.0 |
| High School Diploma | 0 (0.0%) | 0.0 |
| College or Associate's Degree | 0 (0.0%) | 0.0 |
| Bachelor's Degree | 23 (100.0%) | 149.0 |
| Graduate Degree | 0 (0.0%) | 0.0 |
| Total | 23 (100.0%) | 31.0 |
Fertility by Education by Marriage Status in Montgomery
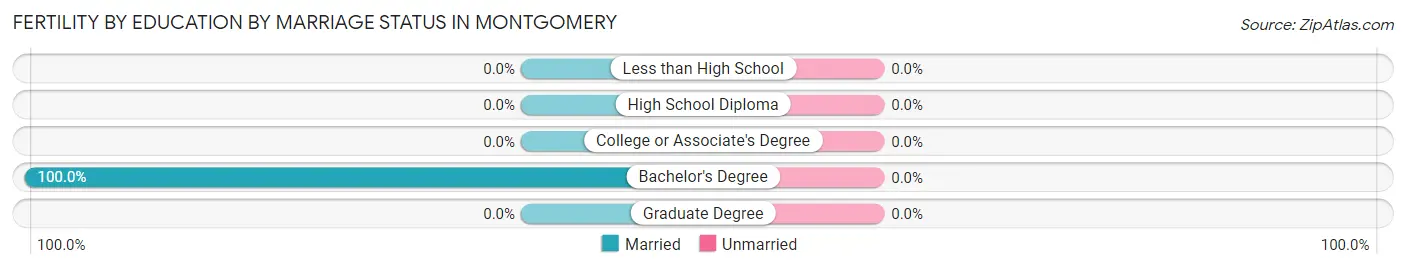
| Educational Attainment | Married | Unmarried |
| Less than High School | 0 (0.0%) | 0 (0.0%) |
| High School Diploma | 0 (0.0%) | 0 (0.0%) |
| College or Associate's Degree | 0 (0.0%) | 0 (0.0%) |
| Bachelor's Degree | 23 (100.0%) | 0 (0.0%) |
| Graduate Degree | 0 (0.0%) | 0 (0.0%) |
| Total | 23 (100.0%) | 0 (0.0%) |
Employment Characteristics in Montgomery
Employment by Class of Employer in Montgomery
Among the 1,737 employed individuals in Montgomery, private company employees (1,153 | 66.4%), local government employees (167 | 9.6%), and state government employees (131 | 7.5%) make up the most common classes of employment.
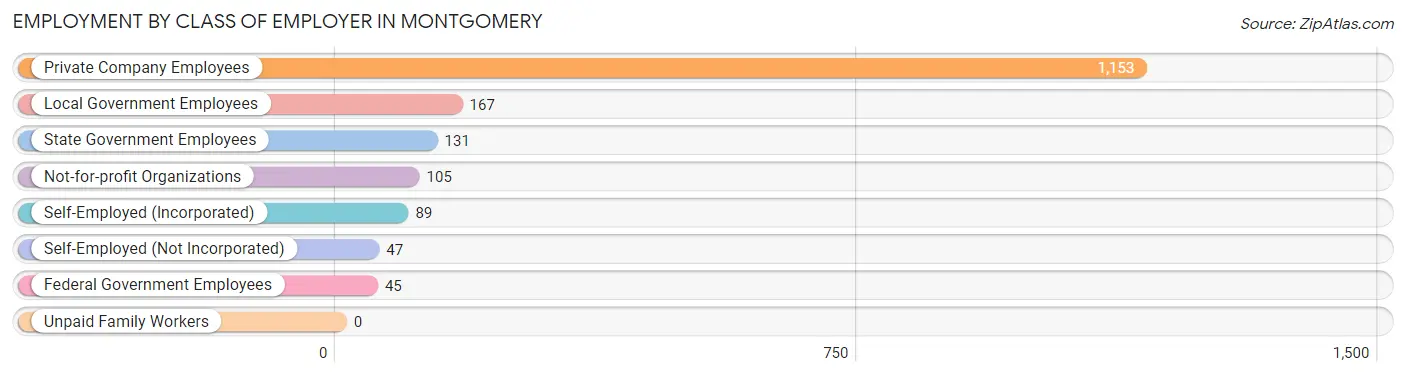
| Employer Class | # Employees | % Employees |
| Private Company Employees | 1,153 | 66.4% |
| Self-Employed (Incorporated) | 89 | 5.1% |
| Self-Employed (Not Incorporated) | 47 | 2.7% |
| Not-for-profit Organizations | 105 | 6.0% |
| Local Government Employees | 167 | 9.6% |
| State Government Employees | 131 | 7.5% |
| Federal Government Employees | 45 | 2.6% |
| Unpaid Family Workers | 0 | 0.0% |
| Total | 1,737 | 100.0% |
Employment Status by Age in Montgomery
According to the labor force statistics for Montgomery, out of the total population over 16 years of age (3,041), 59.6% or 1,812 individuals are in the labor force, with 2.7% or 49 of them unemployed. The age group with the highest labor force participation rate is 25 to 29 years, with 100.0% or 136 individuals in the labor force. Within the labor force, the 20 to 24 years age range has the highest percentage of unemployed individuals, with 18.4% or 19 of them being unemployed.
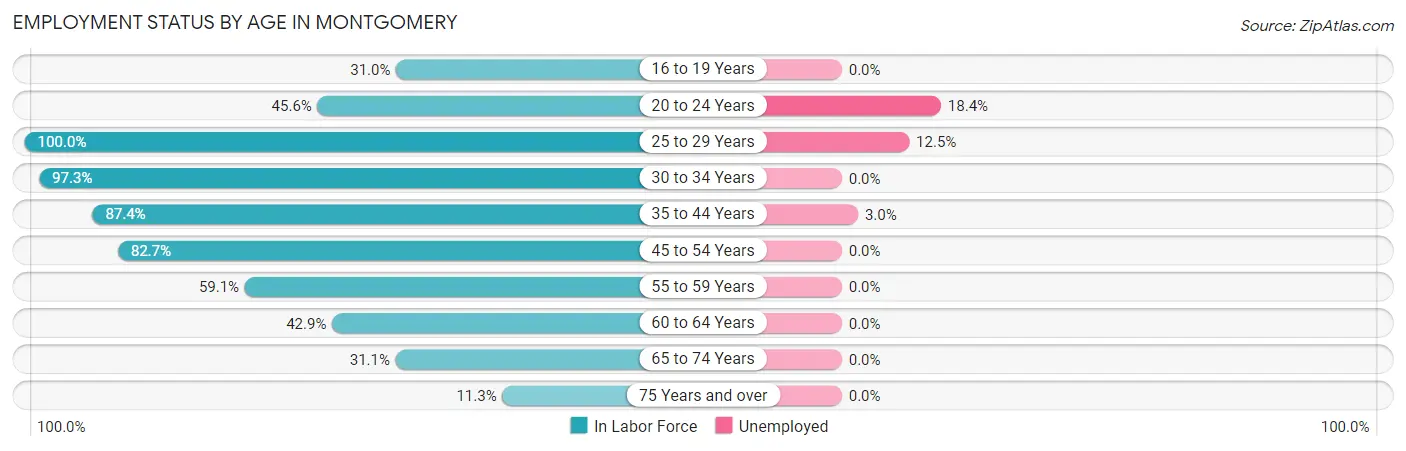
| Age Bracket | In Labor Force | Unemployed |
| 16 to 19 Years | 80 (31.0%) | 0 (0.0%) |
| 20 to 24 Years | 103 (45.6%) | 19 (18.4%) |
| 25 to 29 Years | 136 (100.0%) | 17 (12.5%) |
| 30 to 34 Years | 322 (97.3%) | 0 (0.0%) |
| 35 to 44 Years | 457 (87.4%) | 14 (3.0%) |
| 45 to 54 Years | 334 (82.7%) | 0 (0.0%) |
| 55 to 59 Years | 127 (59.1%) | 0 (0.0%) |
| 60 to 64 Years | 81 (42.9%) | 0 (0.0%) |
| 65 to 74 Years | 134 (31.1%) | 0 (0.0%) |
| 75 Years and over | 37 (11.3%) | 0 (0.0%) |
| Total | 1,812 (59.6%) | 49 (2.7%) |
Employment Status by Educational Attainment in Montgomery
According to labor force statistics for Montgomery, 81.0% of individuals (1,456) out of the total population between 25 and 64 years of age (1,798) are in the labor force, with 2.1% or 31 of them being unemployed. The group with the highest labor force participation rate are those with the educational attainment of bachelor's degree or higher, with 89.8% or 547 individuals in the labor force. Within the labor force, individuals with high school diploma education have the highest percentage of unemployment, with 9.9% or 30 of them being unemployed.
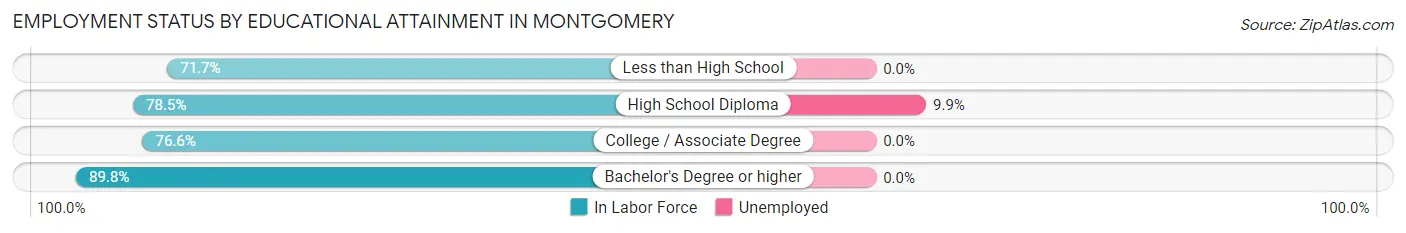
| Educational Attainment | In Labor Force | Unemployed |
| Less than High School | 119 (71.7%) | 0 (0.0%) |
| High School Diploma | 303 (78.5%) | 38 (9.9%) |
| College / Associate Degree | 488 (76.6%) | 0 (0.0%) |
| Bachelor's Degree or higher | 547 (89.8%) | 0 (0.0%) |
| Total | 1,456 (81.0%) | 38 (2.1%) |
Employment Occupations by Sex in Montgomery
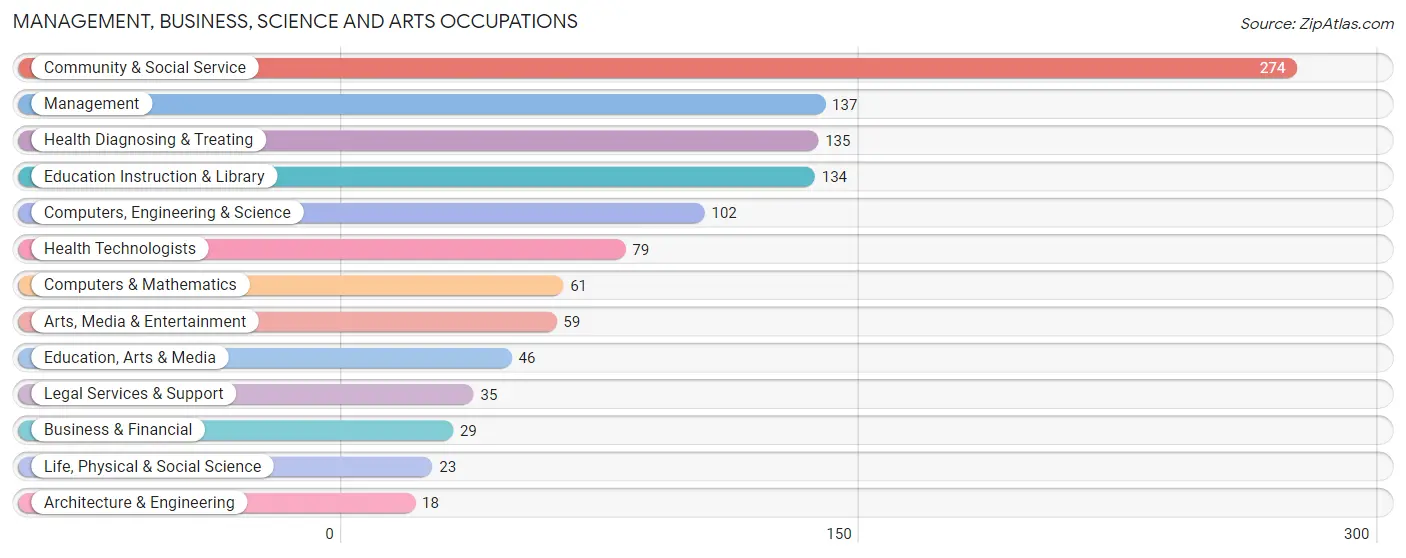
Management, Business, Science and Arts Occupations
The most common Management, Business, Science and Arts occupations in Montgomery are Community & Social Service (274 | 15.7%), Management (137 | 7.9%), Health Diagnosing & Treating (135 | 7.7%), Education Instruction & Library (134 | 7.7%), and Computers, Engineering & Science (102 | 5.9%).
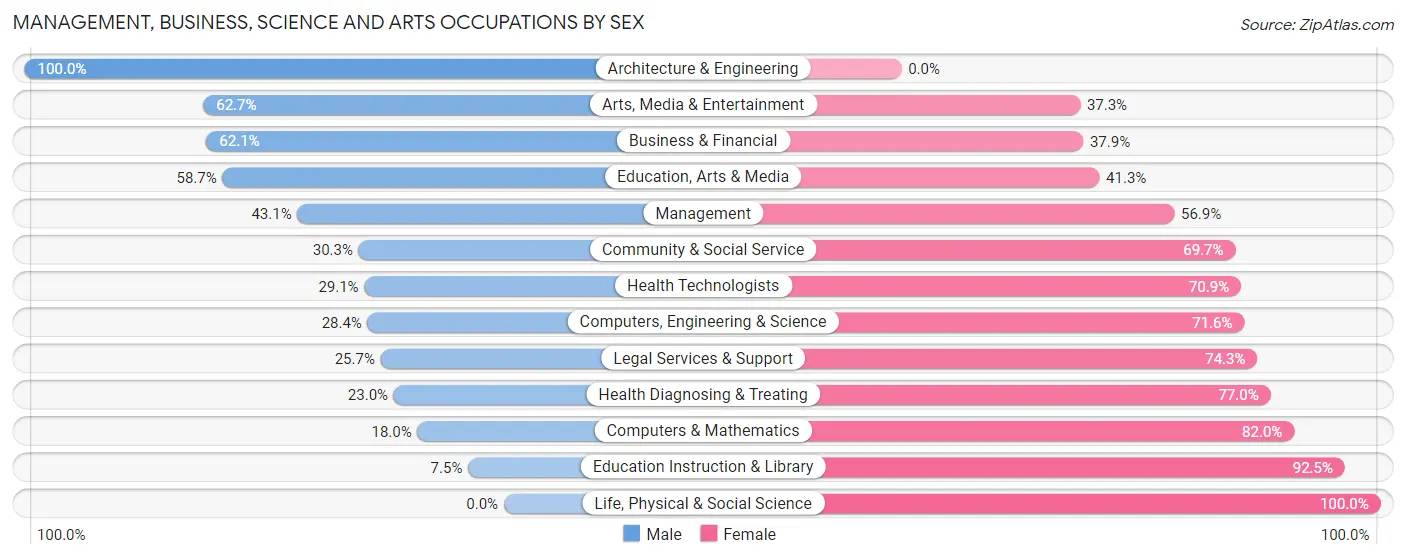
Management, Business, Science and Arts Occupations by Sex
Within the Management, Business, Science and Arts occupations in Montgomery, the most male-oriented occupations are Architecture & Engineering (100.0%), Arts, Media & Entertainment (62.7%), and Business & Financial (62.1%), while the most female-oriented occupations are Life, Physical & Social Science (100.0%), Education Instruction & Library (92.5%), and Computers & Mathematics (82.0%).
| Occupation | Male | Female |
| Management | 59 (43.1%) | 78 (56.9%) |
| Business & Financial | 18 (62.1%) | 11 (37.9%) |
| Computers, Engineering & Science | 29 (28.4%) | 73 (71.6%) |
| Computers & Mathematics | 11 (18.0%) | 50 (82.0%) |
| Architecture & Engineering | 18 (100.0%) | 0 (0.0%) |
| Life, Physical & Social Science | 0 (0.0%) | 23 (100.0%) |
| Community & Social Service | 83 (30.3%) | 191 (69.7%) |
| Education, Arts & Media | 27 (58.7%) | 19 (41.3%) |
| Legal Services & Support | 9 (25.7%) | 26 (74.3%) |
| Education Instruction & Library | 10 (7.5%) | 124 (92.5%) |
| Arts, Media & Entertainment | 37 (62.7%) | 22 (37.3%) |
| Health Diagnosing & Treating | 31 (23.0%) | 104 (77.0%) |
| Health Technologists | 23 (29.1%) | 56 (70.9%) |
| Total (Category) | 220 (32.5%) | 457 (67.5%) |
| Total (Overall) | 941 (54.0%) | 802 (46.0%) |
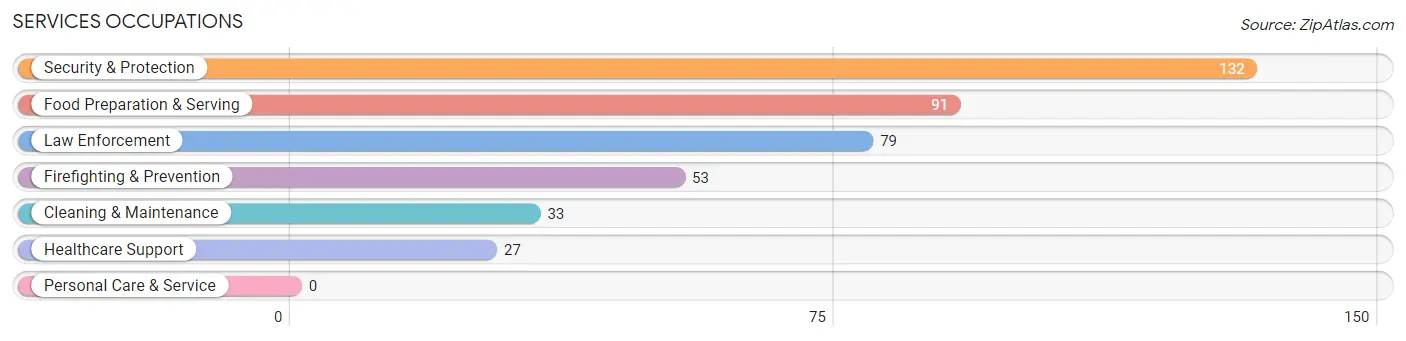
Services Occupations
The most common Services occupations in Montgomery are Security & Protection (132 | 7.6%), Food Preparation & Serving (91 | 5.2%), Law Enforcement (79 | 4.5%), Firefighting & Prevention (53 | 3.0%), and Cleaning & Maintenance (33 | 1.9%).
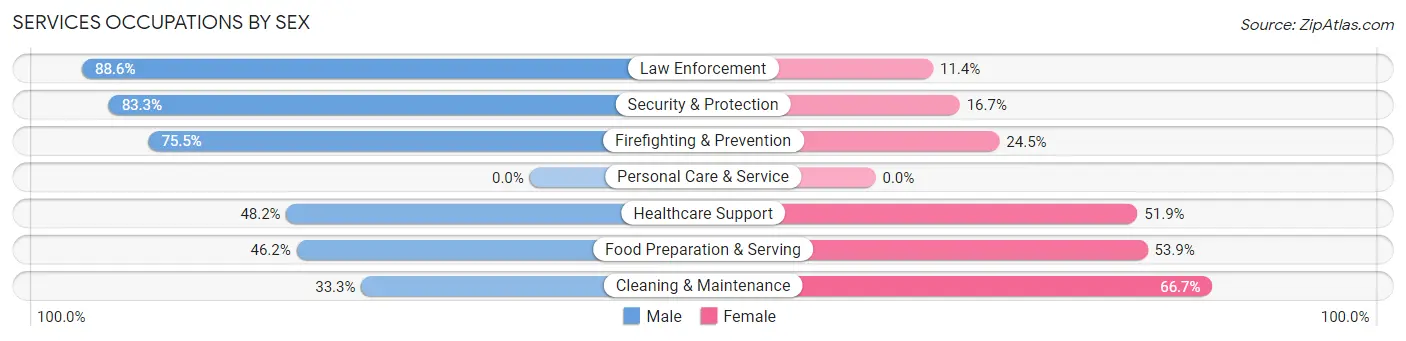
Services Occupations by Sex
Within the Services occupations in Montgomery, the most male-oriented occupations are Law Enforcement (88.6%), Security & Protection (83.3%), and Firefighting & Prevention (75.5%), while the most female-oriented occupations are Cleaning & Maintenance (66.7%), Food Preparation & Serving (53.8%), and Healthcare Support (51.8%).
| Occupation | Male | Female |
| Healthcare Support | 13 (48.1%) | 14 (51.8%) |
| Security & Protection | 110 (83.3%) | 22 (16.7%) |
| Firefighting & Prevention | 40 (75.5%) | 13 (24.5%) |
| Law Enforcement | 70 (88.6%) | 9 (11.4%) |
| Food Preparation & Serving | 42 (46.2%) | 49 (53.8%) |
| Cleaning & Maintenance | 11 (33.3%) | 22 (66.7%) |
| Personal Care & Service | 0 (0.0%) | 0 (0.0%) |
| Total (Category) | 176 (62.2%) | 107 (37.8%) |
| Total (Overall) | 941 (54.0%) | 802 (46.0%) |
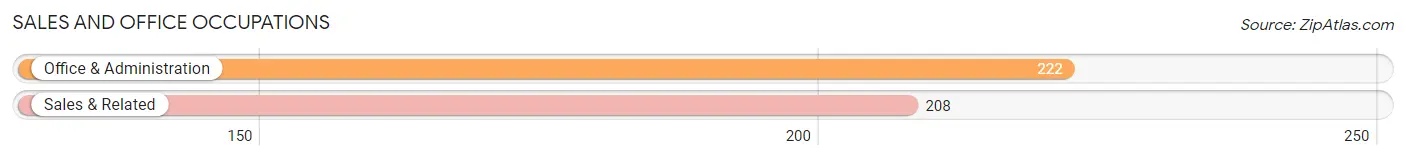
Sales and Office Occupations
The most common Sales and Office occupations in Montgomery are Office & Administration (222 | 12.7%), and Sales & Related (208 | 11.9%).
Sales and Office Occupations by Sex
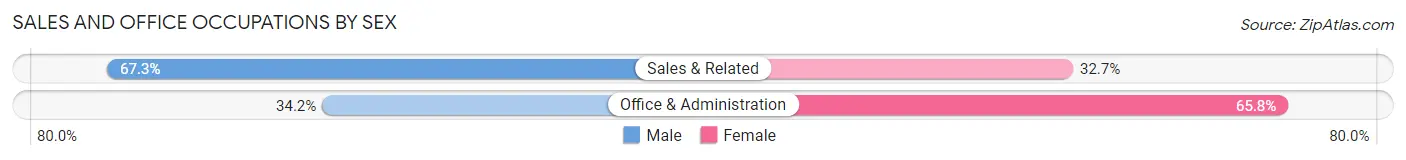
| Occupation | Male | Female |
| Sales & Related | 140 (67.3%) | 68 (32.7%) |
| Office & Administration | 76 (34.2%) | 146 (65.8%) |
| Total (Category) | 216 (50.2%) | 214 (49.8%) |
| Total (Overall) | 941 (54.0%) | 802 (46.0%) |
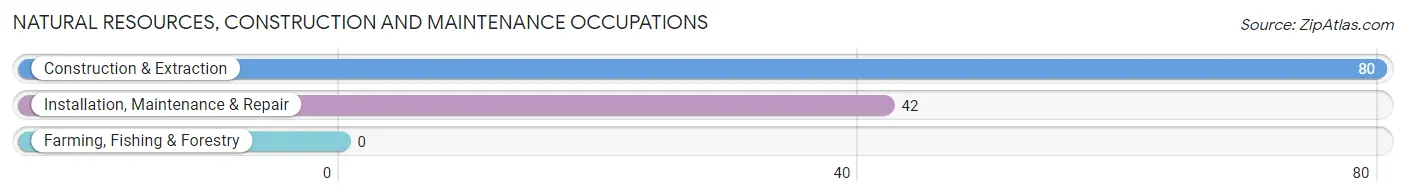
Natural Resources, Construction and Maintenance Occupations
The most common Natural Resources, Construction and Maintenance occupations in Montgomery are Construction & Extraction (80 | 4.6%), and Installation, Maintenance & Repair (42 | 2.4%).
Natural Resources, Construction and Maintenance Occupations by Sex
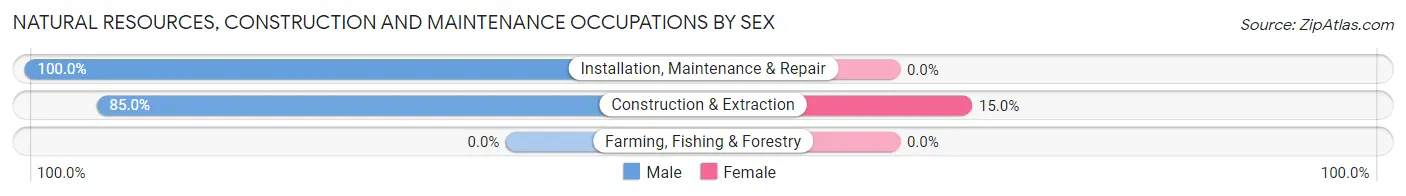
| Occupation | Male | Female |
| Farming, Fishing & Forestry | 0 (0.0%) | 0 (0.0%) |
| Construction & Extraction | 68 (85.0%) | 12 (15.0%) |
| Installation, Maintenance & Repair | 42 (100.0%) | 0 (0.0%) |
| Total (Category) | 110 (90.2%) | 12 (9.8%) |
| Total (Overall) | 941 (54.0%) | 802 (46.0%) |
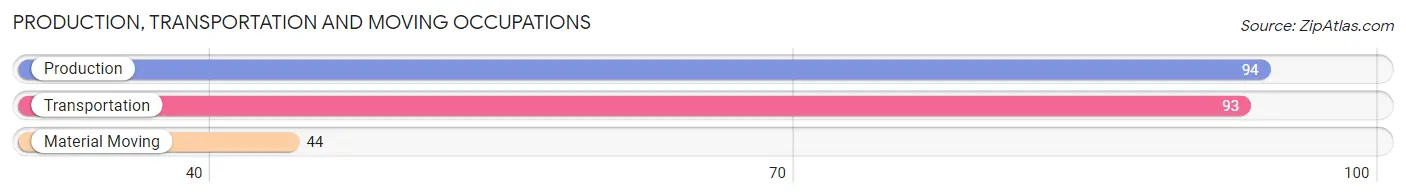
Production, Transportation and Moving Occupations
The most common Production, Transportation and Moving occupations in Montgomery are Production (94 | 5.4%), Transportation (93 | 5.3%), and Material Moving (44 | 2.5%).
Production, Transportation and Moving Occupations by Sex
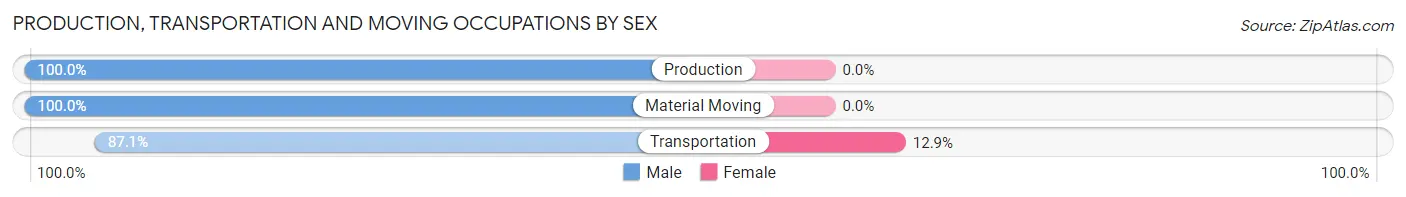
| Occupation | Male | Female |
| Production | 94 (100.0%) | 0 (0.0%) |
| Transportation | 81 (87.1%) | 12 (12.9%) |
| Material Moving | 44 (100.0%) | 0 (0.0%) |
| Total (Category) | 219 (94.8%) | 12 (5.2%) |
| Total (Overall) | 941 (54.0%) | 802 (46.0%) |
Employment Industries by Sex in Montgomery
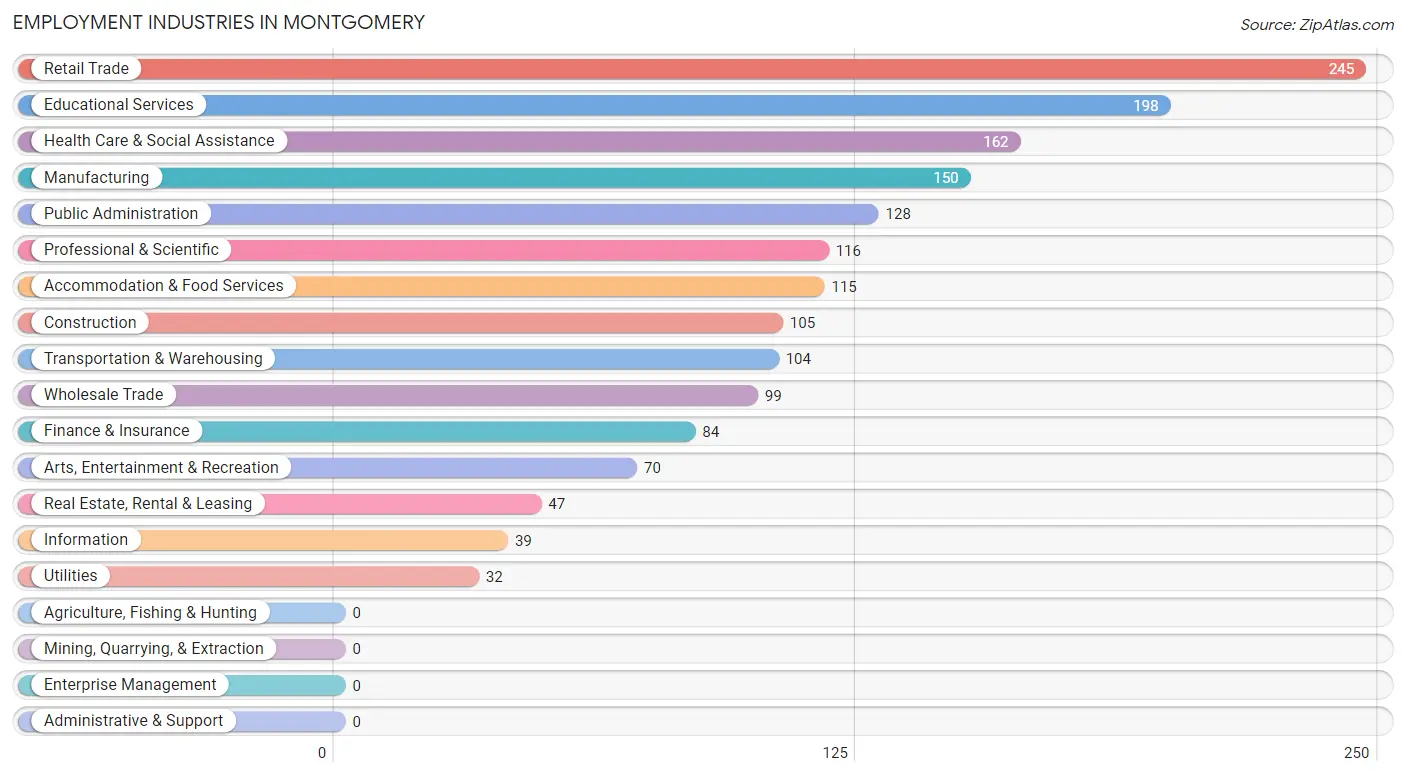
Employment Industries in Montgomery
The major employment industries in Montgomery include Retail Trade (245 | 14.1%), Educational Services (198 | 11.4%), Health Care & Social Assistance (162 | 9.3%), Manufacturing (150 | 8.6%), and Public Administration (128 | 7.3%).
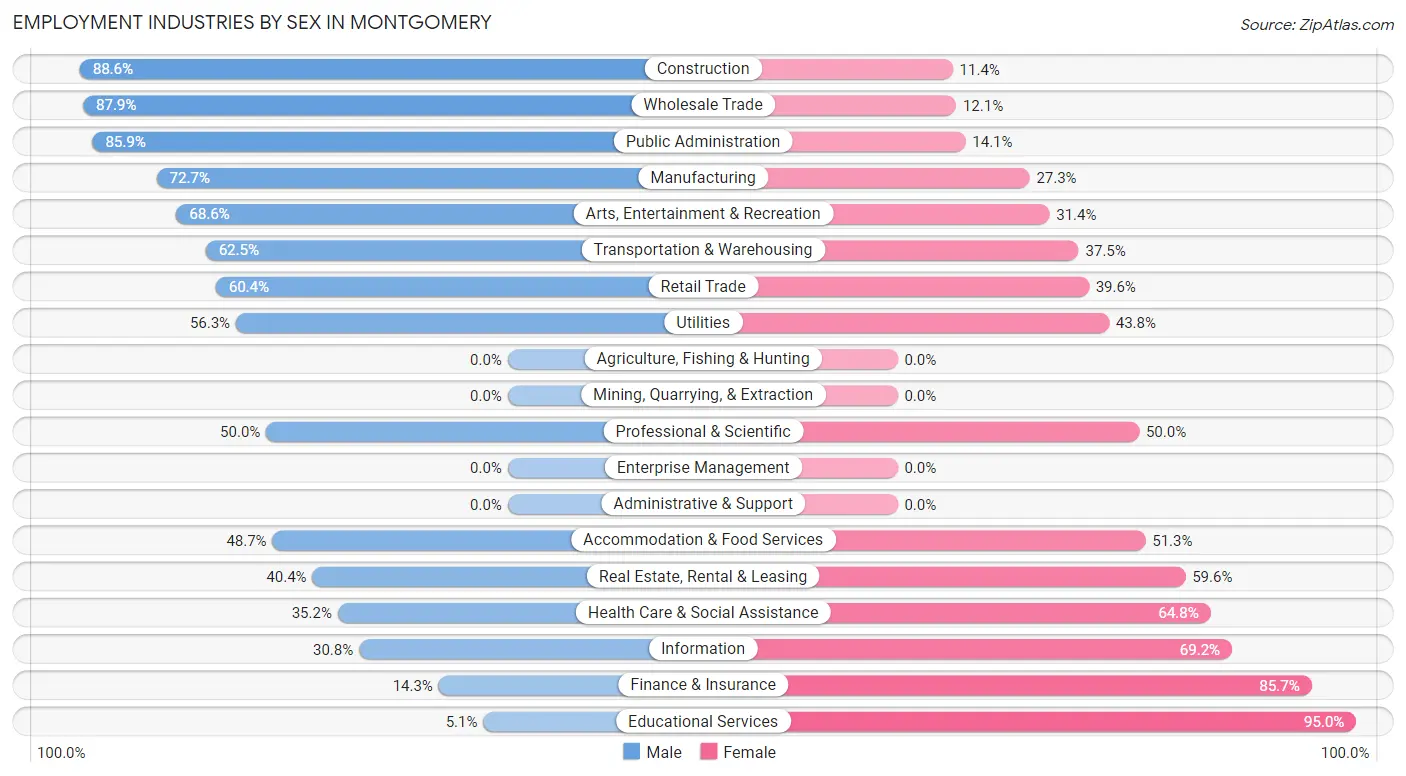
Employment Industries by Sex in Montgomery
The Montgomery industries that see more men than women are Construction (88.6%), Wholesale Trade (87.9%), and Public Administration (85.9%), whereas the industries that tend to have a higher number of women are Educational Services (95.0%), Finance & Insurance (85.7%), and Information (69.2%).
| Industry | Male | Female |
| Agriculture, Fishing & Hunting | 0 (0.0%) | 0 (0.0%) |
| Mining, Quarrying, & Extraction | 0 (0.0%) | 0 (0.0%) |
| Construction | 93 (88.6%) | 12 (11.4%) |
| Manufacturing | 109 (72.7%) | 41 (27.3%) |
| Wholesale Trade | 87 (87.9%) | 12 (12.1%) |
| Retail Trade | 148 (60.4%) | 97 (39.6%) |
| Transportation & Warehousing | 65 (62.5%) | 39 (37.5%) |
| Utilities | 18 (56.2%) | 14 (43.8%) |
| Information | 12 (30.8%) | 27 (69.2%) |
| Finance & Insurance | 12 (14.3%) | 72 (85.7%) |
| Real Estate, Rental & Leasing | 19 (40.4%) | 28 (59.6%) |
| Professional & Scientific | 58 (50.0%) | 58 (50.0%) |
| Enterprise Management | 0 (0.0%) | 0 (0.0%) |
| Administrative & Support | 0 (0.0%) | 0 (0.0%) |
| Educational Services | 10 (5.1%) | 188 (95.0%) |
| Health Care & Social Assistance | 57 (35.2%) | 105 (64.8%) |
| Arts, Entertainment & Recreation | 48 (68.6%) | 22 (31.4%) |
| Accommodation & Food Services | 56 (48.7%) | 59 (51.3%) |
| Public Administration | 110 (85.9%) | 18 (14.1%) |
| Total | 941 (54.0%) | 802 (46.0%) |
Education in Montgomery
School Enrollment in Montgomery
The most common levels of schooling among the 942 students in Montgomery are elementary school (261 | 27.7%), high school (258 | 27.4%), and middle school (174 | 18.5%).
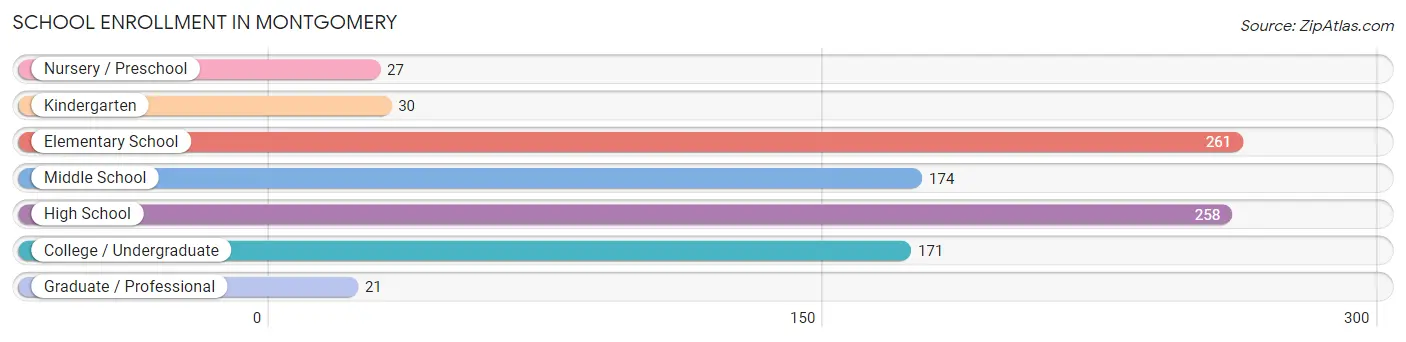
| School Level | # Students | % Students |
| Nursery / Preschool | 27 | 2.9% |
| Kindergarten | 30 | 3.2% |
| Elementary School | 261 | 27.7% |
| Middle School | 174 | 18.5% |
| High School | 258 | 27.4% |
| College / Undergraduate | 171 | 18.1% |
| Graduate / Professional | 21 | 2.2% |
| Total | 942 | 100.0% |
School Enrollment by Age by Funding Source in Montgomery
Out of a total of 942 students who are enrolled in schools in Montgomery, 40 (4.2%) attend a private institution, while the remaining 902 (95.8%) are enrolled in public schools. The age group of 35 years and over has the highest likelihood of being enrolled in private schools, with 40 (100.0% in the age bracket) enrolled. Conversely, the age group of 3 to 4 year olds has the lowest likelihood of being enrolled in a private school, with 11 (100.0% in the age bracket) attending a public institution.
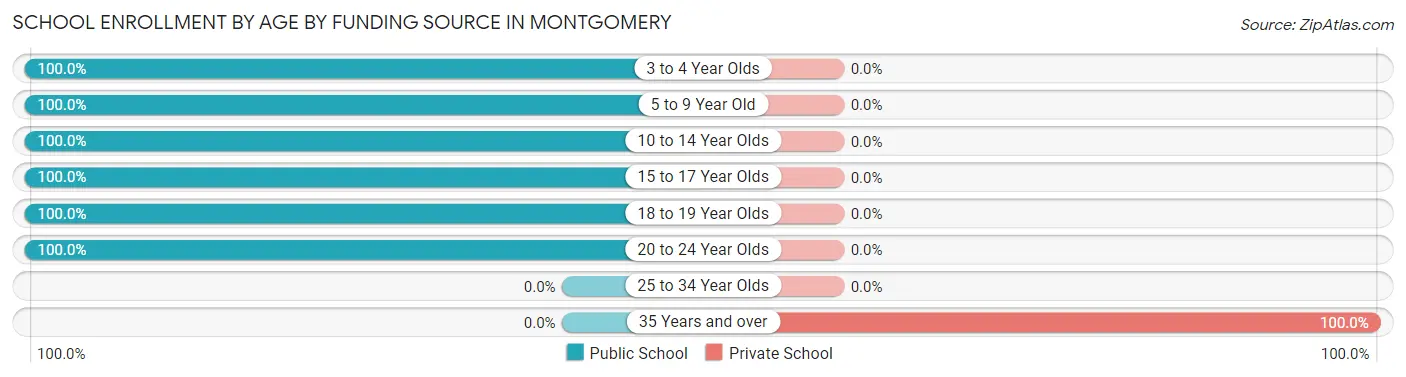
| Age Bracket | Public School | Private School |
| 3 to 4 Year Olds | 11 (100.0%) | 0 (0.0%) |
| 5 to 9 Year Old | 307 (100.0%) | 0 (0.0%) |
| 10 to 14 Year Olds | 219 (100.0%) | 0 (0.0%) |
| 15 to 17 Year Olds | 188 (100.0%) | 0 (0.0%) |
| 18 to 19 Year Olds | 94 (100.0%) | 0 (0.0%) |
| 20 to 24 Year Olds | 83 (100.0%) | 0 (0.0%) |
| 25 to 34 Year Olds | 0 (0.0%) | 0 (0.0%) |
| 35 Years and over | 0 (0.0%) | 40 (100.0%) |
| Total | 902 (95.8%) | 40 (4.2%) |
Educational Attainment by Field of Study in Montgomery
Liberal arts & history (156 | 17.5%), communications (112 | 12.6%), psychology (105 | 11.8%), business (105 | 11.8%), and education (104 | 11.7%) are the most common fields of study among 891 individuals in Montgomery who have obtained a bachelor's degree or higher.
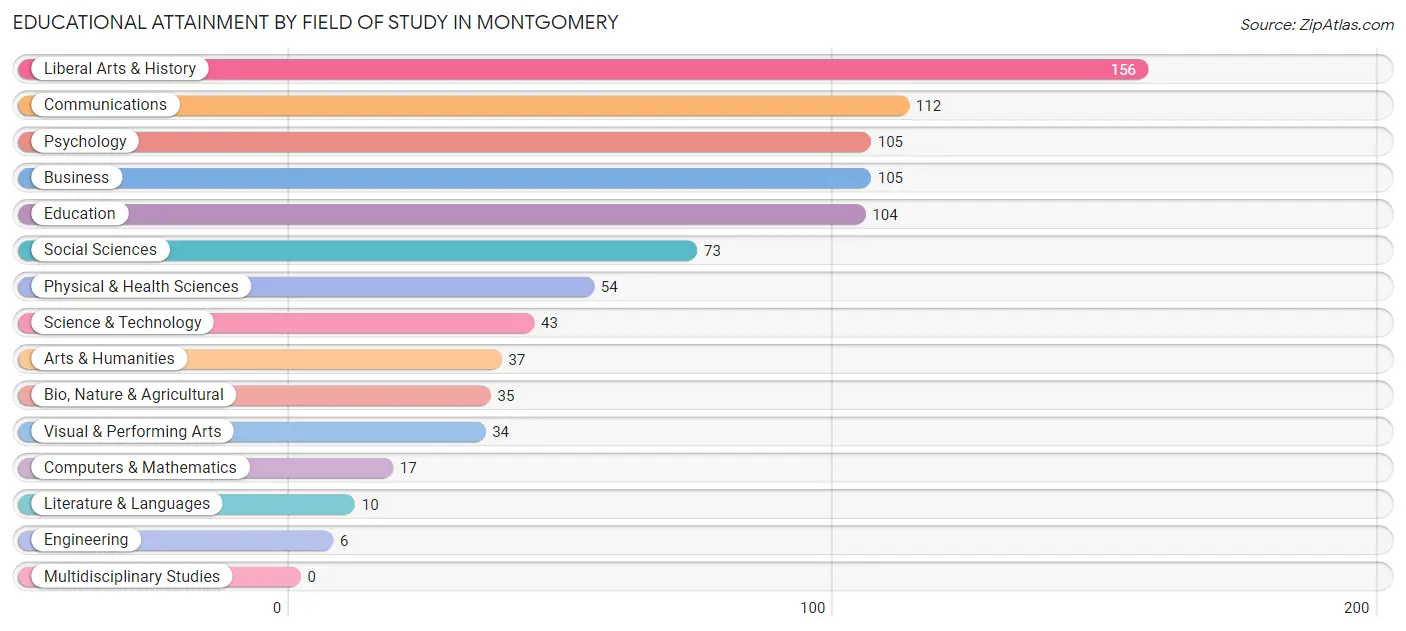
| Field of Study | # Graduates | % Graduates |
| Computers & Mathematics | 17 | 1.9% |
| Bio, Nature & Agricultural | 35 | 3.9% |
| Physical & Health Sciences | 54 | 6.1% |
| Psychology | 105 | 11.8% |
| Social Sciences | 73 | 8.2% |
| Engineering | 6 | 0.7% |
| Multidisciplinary Studies | 0 | 0.0% |
| Science & Technology | 43 | 4.8% |
| Business | 105 | 11.8% |
| Education | 104 | 11.7% |
| Literature & Languages | 10 | 1.1% |
| Liberal Arts & History | 156 | 17.5% |
| Visual & Performing Arts | 34 | 3.8% |
| Communications | 112 | 12.6% |
| Arts & Humanities | 37 | 4.2% |
| Total | 891 | 100.0% |
Transportation & Commute in Montgomery
Vehicle Availability by Sex in Montgomery
The most prevalent vehicle ownership categories in Montgomery are males with 2 vehicles (467, accounting for 48.6%) and females with 2 vehicles (432, making up 60.1%).
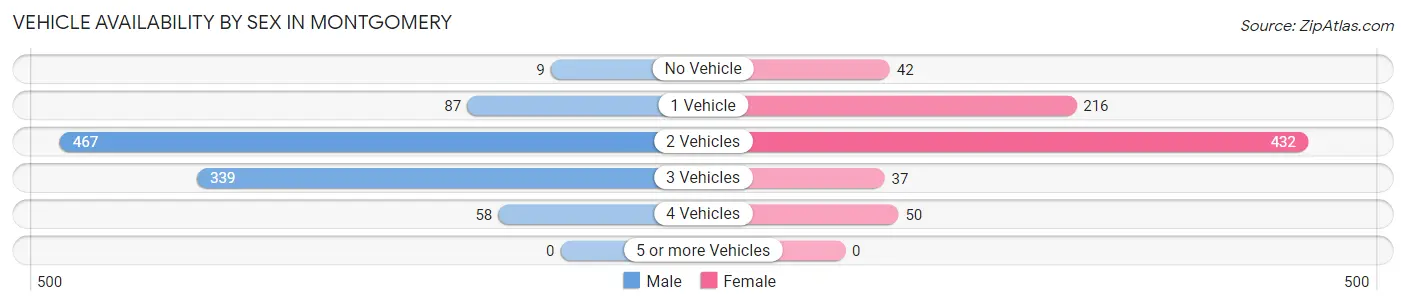
| Vehicles Available | Male | Female |
| No Vehicle | 9 (0.9%) | 42 (5.4%) |
| 1 Vehicle | 87 (9.1%) | 216 (27.8%) |
| 2 Vehicles | 467 (48.6%) | 432 (55.6%) |
| 3 Vehicles | 339 (35.3%) | 37 (4.8%) |
| 4 Vehicles | 58 (6.0%) | 50 (6.4%) |
| 5 or more Vehicles | 0 (0.0%) | 0 (0.0%) |
| Total | 960 (100.0%) | 777 (100.0%) |
Commute Time in Montgomery
The most frequently occuring commute durations in Montgomery are 15 to 19 minutes (287 commuters, 18.3%), 20 to 24 minutes (209 commuters, 13.3%), and 90 or more minutes (195 commuters, 12.4%).
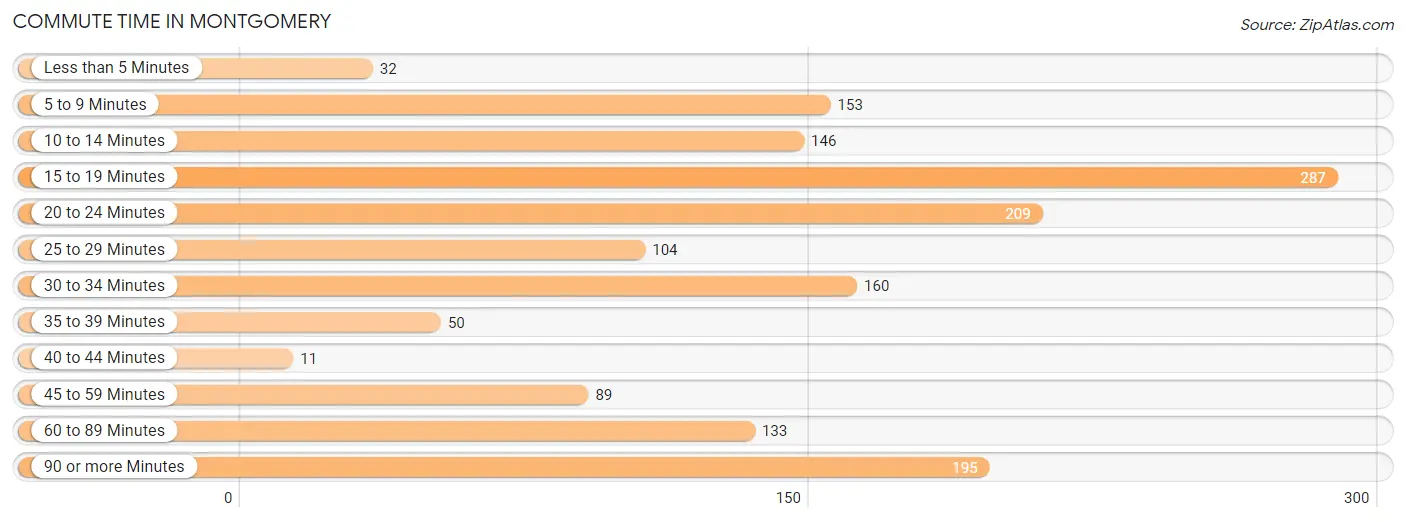
| Commute Time | # Commuters | % Commuters |
| Less than 5 Minutes | 32 | 2.0% |
| 5 to 9 Minutes | 153 | 9.8% |
| 10 to 14 Minutes | 146 | 9.3% |
| 15 to 19 Minutes | 287 | 18.3% |
| 20 to 24 Minutes | 209 | 13.3% |
| 25 to 29 Minutes | 104 | 6.6% |
| 30 to 34 Minutes | 160 | 10.2% |
| 35 to 39 Minutes | 50 | 3.2% |
| 40 to 44 Minutes | 11 | 0.7% |
| 45 to 59 Minutes | 89 | 5.7% |
| 60 to 89 Minutes | 133 | 8.5% |
| 90 or more Minutes | 195 | 12.4% |
Commute Time by Sex in Montgomery
The most common commute times in Montgomery are 90 or more minutes (190 commuters, 22.0%) for males and 15 to 19 minutes (153 commuters, 21.7%) for females.
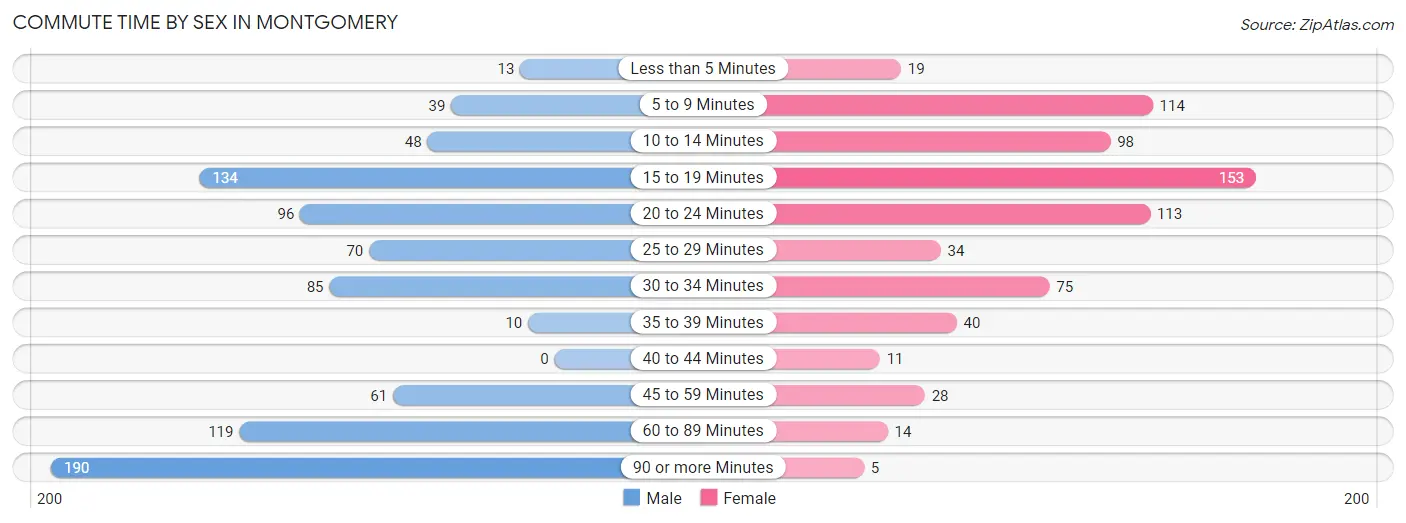
| Commute Time | Male | Female |
| Less than 5 Minutes | 13 (1.5%) | 19 (2.7%) |
| 5 to 9 Minutes | 39 (4.5%) | 114 (16.2%) |
| 10 to 14 Minutes | 48 (5.6%) | 98 (13.9%) |
| 15 to 19 Minutes | 134 (15.5%) | 153 (21.7%) |
| 20 to 24 Minutes | 96 (11.1%) | 113 (16.1%) |
| 25 to 29 Minutes | 70 (8.1%) | 34 (4.8%) |
| 30 to 34 Minutes | 85 (9.8%) | 75 (10.6%) |
| 35 to 39 Minutes | 10 (1.2%) | 40 (5.7%) |
| 40 to 44 Minutes | 0 (0.0%) | 11 (1.6%) |
| 45 to 59 Minutes | 61 (7.0%) | 28 (4.0%) |
| 60 to 89 Minutes | 119 (13.8%) | 14 (2.0%) |
| 90 or more Minutes | 190 (22.0%) | 5 (0.7%) |
Time of Departure to Work by Sex in Montgomery
The most frequent times of departure to work in Montgomery are 8:00 AM to 8:29 AM (124, 14.3%) for males and 8:00 AM to 8:29 AM (149, 21.2%) for females.
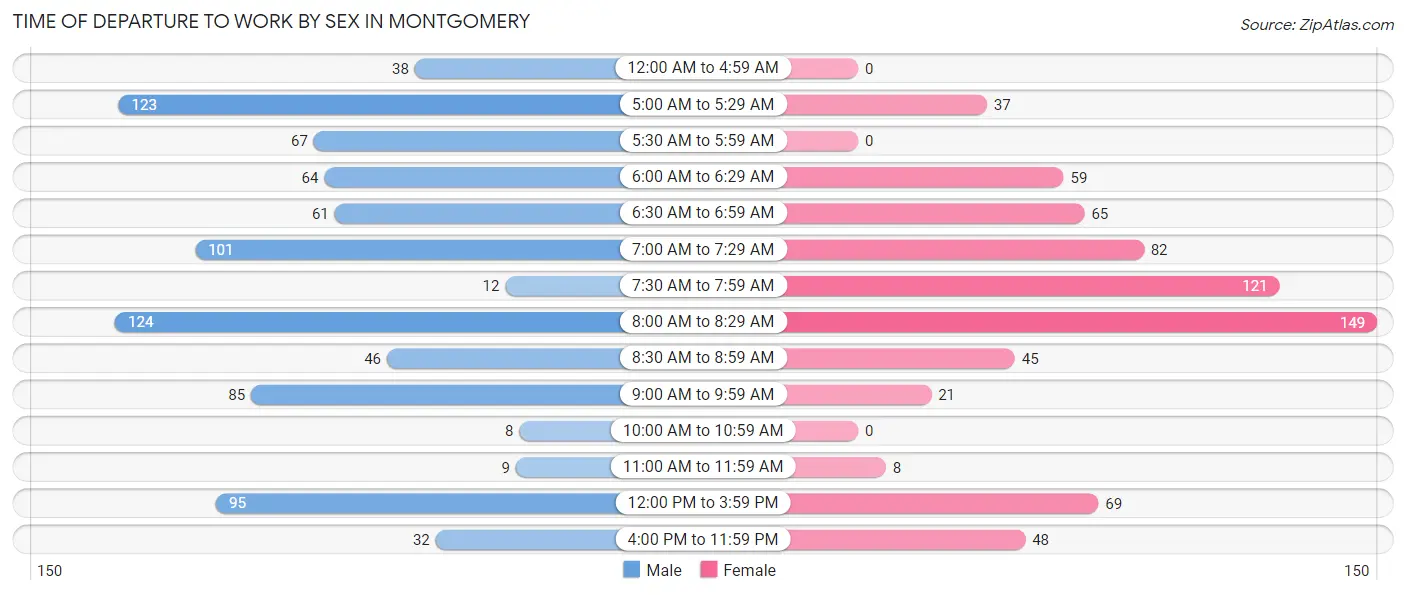
| Time of Departure | Male | Female |
| 12:00 AM to 4:59 AM | 38 (4.4%) | 0 (0.0%) |
| 5:00 AM to 5:29 AM | 123 (14.2%) | 37 (5.3%) |
| 5:30 AM to 5:59 AM | 67 (7.7%) | 0 (0.0%) |
| 6:00 AM to 6:29 AM | 64 (7.4%) | 59 (8.4%) |
| 6:30 AM to 6:59 AM | 61 (7.0%) | 65 (9.2%) |
| 7:00 AM to 7:29 AM | 101 (11.7%) | 82 (11.7%) |
| 7:30 AM to 7:59 AM | 12 (1.4%) | 121 (17.2%) |
| 8:00 AM to 8:29 AM | 124 (14.3%) | 149 (21.2%) |
| 8:30 AM to 8:59 AM | 46 (5.3%) | 45 (6.4%) |
| 9:00 AM to 9:59 AM | 85 (9.8%) | 21 (3.0%) |
| 10:00 AM to 10:59 AM | 8 (0.9%) | 0 (0.0%) |
| 11:00 AM to 11:59 AM | 9 (1.0%) | 8 (1.1%) |
| 12:00 PM to 3:59 PM | 95 (11.0%) | 69 (9.8%) |
| 4:00 PM to 11:59 PM | 32 (3.7%) | 48 (6.8%) |
| Total | 865 (100.0%) | 704 (100.0%) |
Housing Occupancy in Montgomery
Occupancy by Ownership in Montgomery
Of the total 1,471 dwellings in Montgomery, owner-occupied units account for 1,026 (69.8%), while renter-occupied units make up 445 (30.2%).
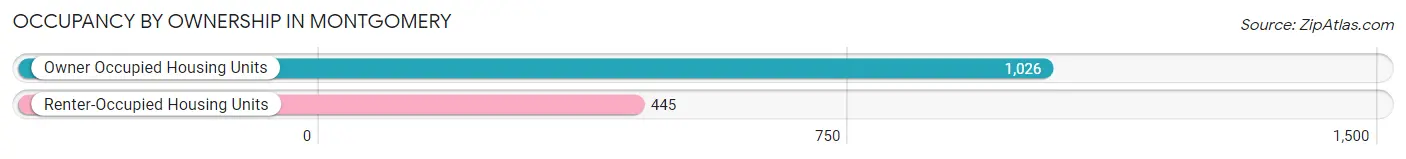
| Occupancy | # Housing Units | % Housing Units |
| Owner Occupied Housing Units | 1,026 | 69.8% |
| Renter-Occupied Housing Units | 445 | 30.2% |
| Total Occupied Housing Units | 1,471 | 100.0% |
Occupancy by Household Size in Montgomery
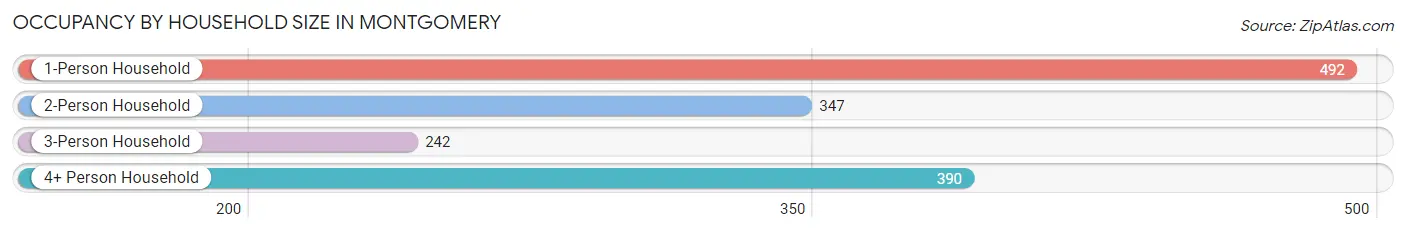
| Household Size | # Housing Units | % Housing Units |
| 1-Person Household | 492 | 33.5% |
| 2-Person Household | 347 | 23.6% |
| 3-Person Household | 242 | 16.5% |
| 4+ Person Household | 390 | 26.5% |
| Total Housing Units | 1,471 | 100.0% |
Occupancy by Ownership by Household Size in Montgomery
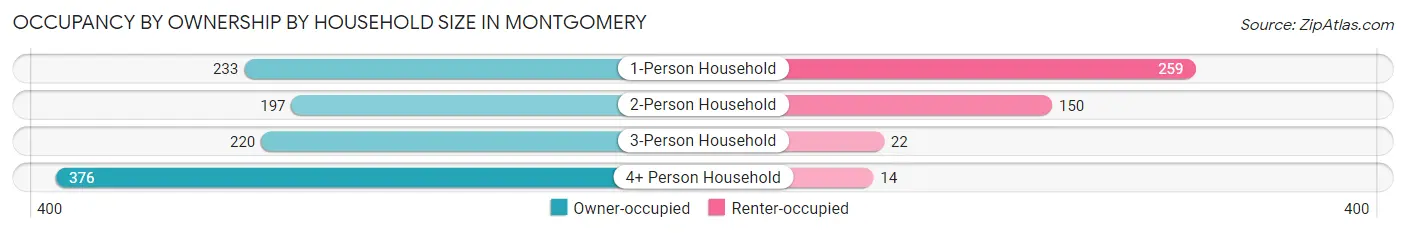
| Household Size | Owner-occupied | Renter-occupied |
| 1-Person Household | 233 (47.4%) | 259 (52.6%) |
| 2-Person Household | 197 (56.8%) | 150 (43.2%) |
| 3-Person Household | 220 (90.9%) | 22 (9.1%) |
| 4+ Person Household | 376 (96.4%) | 14 (3.6%) |
| Total Housing Units | 1,026 (69.8%) | 445 (30.2%) |
Occupancy by Educational Attainment in Montgomery
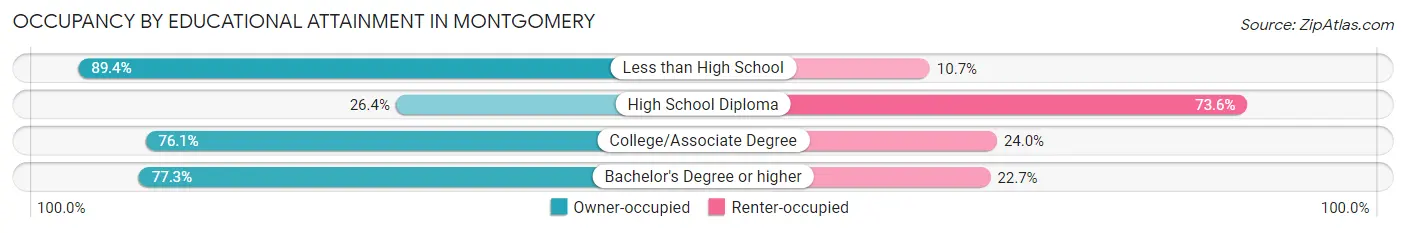
| Household Size | Owner-occupied | Renter-occupied |
| Less than High School | 151 (89.3%) | 18 (10.6%) |
| High School Diploma | 65 (26.4%) | 181 (73.6%) |
| College/Associate Degree | 397 (76.0%) | 125 (23.9%) |
| Bachelor's Degree or higher | 413 (77.3%) | 121 (22.7%) |
Occupancy by Age of Householder in Montgomery
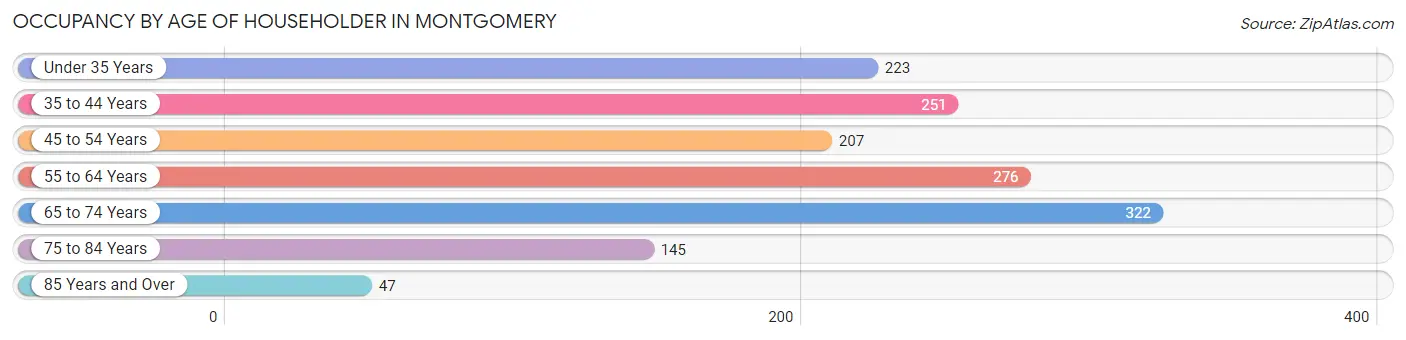
| Age Bracket | # Households | % Households |
| Under 35 Years | 223 | 15.2% |
| 35 to 44 Years | 251 | 17.1% |
| 45 to 54 Years | 207 | 14.1% |
| 55 to 64 Years | 276 | 18.8% |
| 65 to 74 Years | 322 | 21.9% |
| 75 to 84 Years | 145 | 9.9% |
| 85 Years and Over | 47 | 3.2% |
| Total | 1,471 | 100.0% |
Housing Finances in Montgomery
Median Income by Occupancy in Montgomery
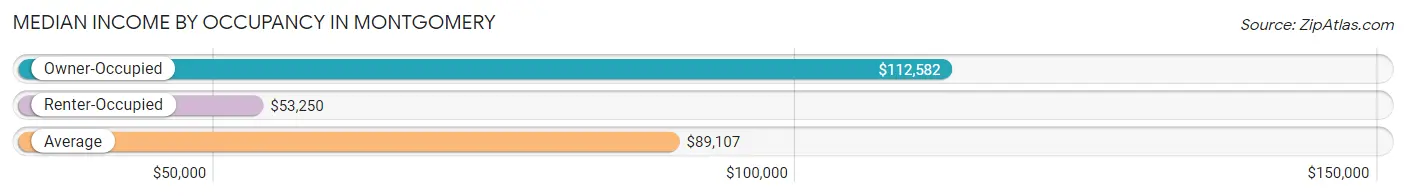
| Occupancy Type | # Households | Median Income |
| Owner-Occupied | 1,026 (69.8%) | $112,582 |
| Renter-Occupied | 445 (30.2%) | $53,250 |
| Average | 1,471 (100.0%) | $89,107 |
Occupancy by Householder Income Bracket in Montgomery
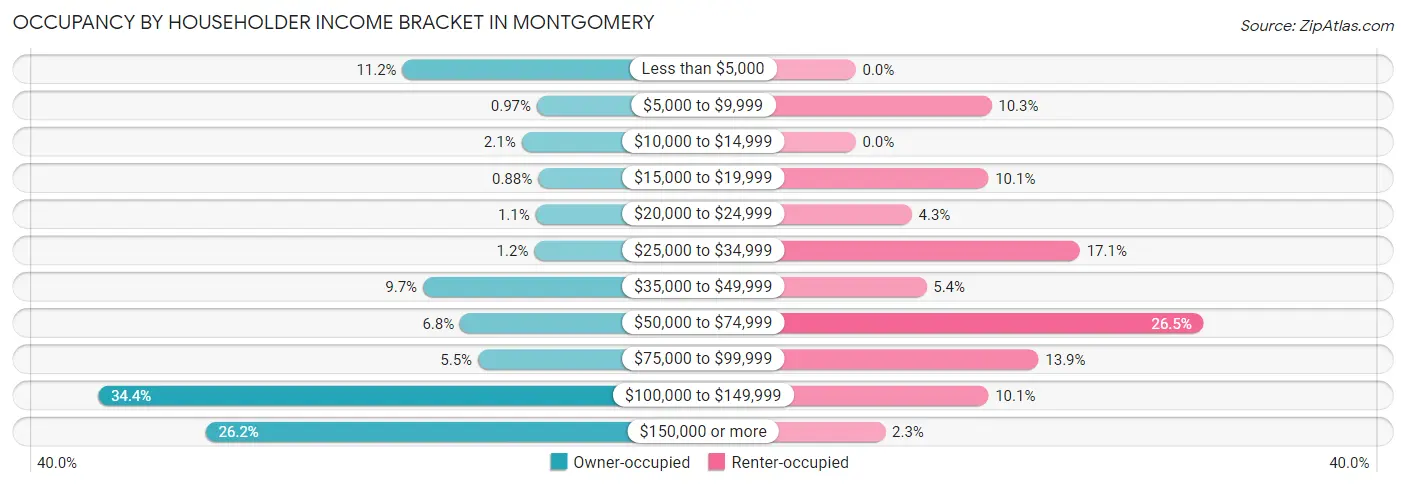
| Income Bracket | Owner-occupied | Renter-occupied |
| Less than $5,000 | 115 (11.2%) | 0 (0.0%) |
| $5,000 to $9,999 | 10 (1.0%) | 46 (10.3%) |
| $10,000 to $14,999 | 22 (2.1%) | 0 (0.0%) |
| $15,000 to $19,999 | 9 (0.9%) | 45 (10.1%) |
| $20,000 to $24,999 | 11 (1.1%) | 19 (4.3%) |
| $25,000 to $34,999 | 12 (1.2%) | 76 (17.1%) |
| $35,000 to $49,999 | 99 (9.7%) | 24 (5.4%) |
| $50,000 to $74,999 | 70 (6.8%) | 118 (26.5%) |
| $75,000 to $99,999 | 56 (5.5%) | 62 (13.9%) |
| $100,000 to $149,999 | 353 (34.4%) | 45 (10.1%) |
| $150,000 or more | 269 (26.2%) | 10 (2.2%) |
| Total | 1,026 (100.0%) | 445 (100.0%) |
Monthly Housing Cost Tiers in Montgomery
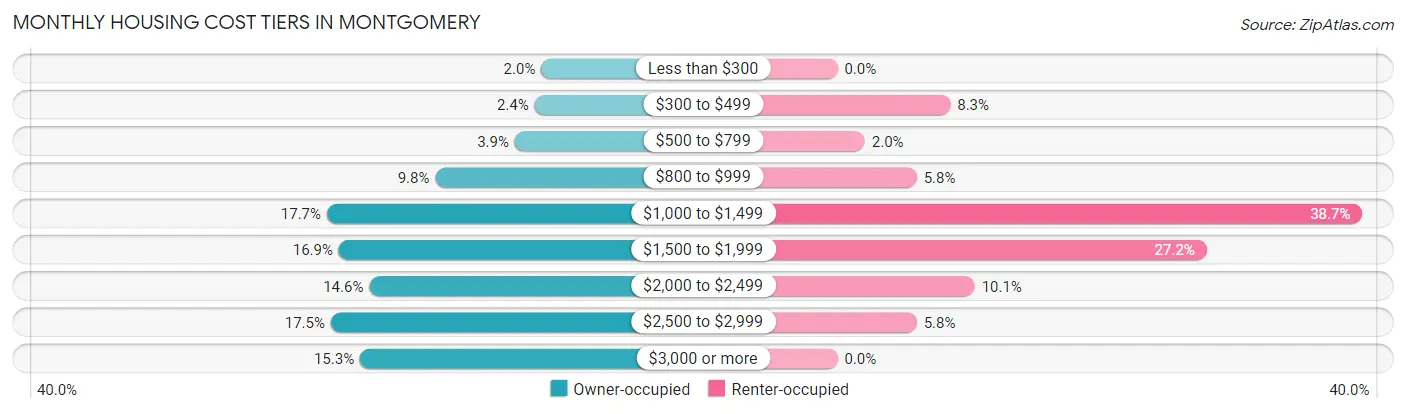
| Monthly Cost | Owner-occupied | Renter-occupied |
| Less than $300 | 20 (1.9%) | 0 (0.0%) |
| $300 to $499 | 25 (2.4%) | 37 (8.3%) |
| $500 to $799 | 40 (3.9%) | 9 (2.0%) |
| $800 to $999 | 100 (9.8%) | 26 (5.8%) |
| $1,000 to $1,499 | 182 (17.7%) | 172 (38.7%) |
| $1,500 to $1,999 | 173 (16.9%) | 121 (27.2%) |
| $2,000 to $2,499 | 150 (14.6%) | 45 (10.1%) |
| $2,500 to $2,999 | 179 (17.4%) | 26 (5.8%) |
| $3,000 or more | 157 (15.3%) | 0 (0.0%) |
| Total | 1,026 (100.0%) | 445 (100.0%) |
Physical Housing Characteristics in Montgomery
Housing Structures in Montgomery
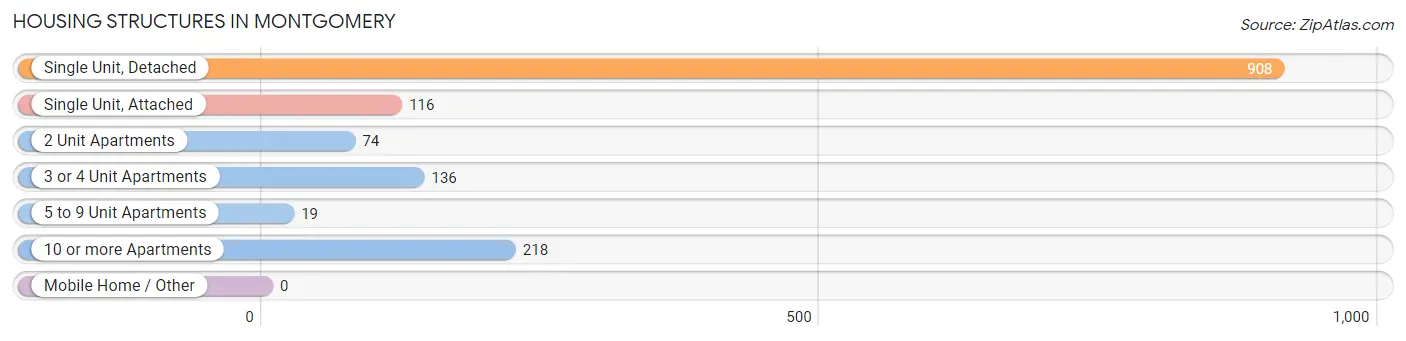
| Structure Type | # Housing Units | % Housing Units |
| Single Unit, Detached | 908 | 61.7% |
| Single Unit, Attached | 116 | 7.9% |
| 2 Unit Apartments | 74 | 5.0% |
| 3 or 4 Unit Apartments | 136 | 9.2% |
| 5 to 9 Unit Apartments | 19 | 1.3% |
| 10 or more Apartments | 218 | 14.8% |
| Mobile Home / Other | 0 | 0.0% |
| Total | 1,471 | 100.0% |
Housing Structures by Occupancy in Montgomery
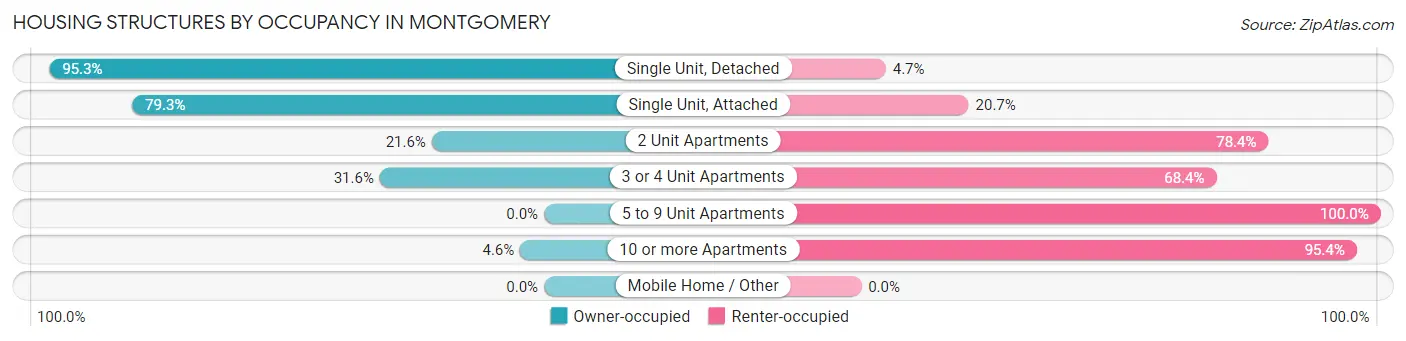
| Structure Type | Owner-occupied | Renter-occupied |
| Single Unit, Detached | 865 (95.3%) | 43 (4.7%) |
| Single Unit, Attached | 92 (79.3%) | 24 (20.7%) |
| 2 Unit Apartments | 16 (21.6%) | 58 (78.4%) |
| 3 or 4 Unit Apartments | 43 (31.6%) | 93 (68.4%) |
| 5 to 9 Unit Apartments | 0 (0.0%) | 19 (100.0%) |
| 10 or more Apartments | 10 (4.6%) | 208 (95.4%) |
| Mobile Home / Other | 0 (0.0%) | 0 (0.0%) |
| Total | 1,026 (69.8%) | 445 (30.2%) |
Housing Structures by Number of Rooms in Montgomery
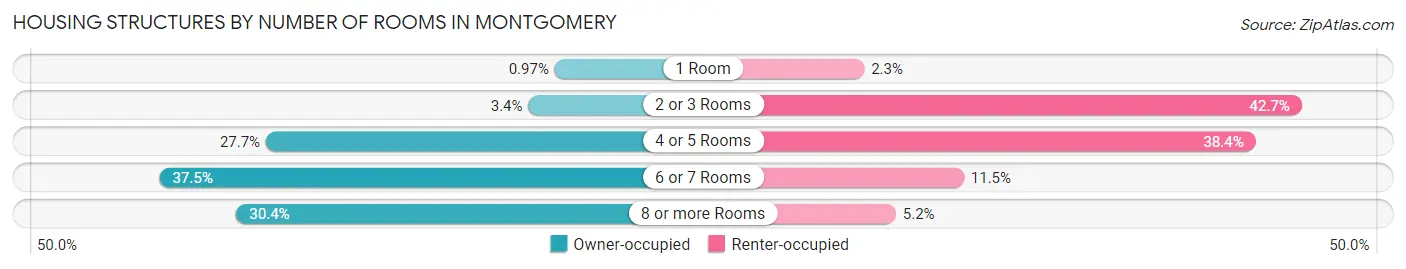
| Number of Rooms | Owner-occupied | Renter-occupied |
| 1 Room | 10 (1.0%) | 10 (2.2%) |
| 2 or 3 Rooms | 35 (3.4%) | 190 (42.7%) |
| 4 or 5 Rooms | 284 (27.7%) | 171 (38.4%) |
| 6 or 7 Rooms | 385 (37.5%) | 51 (11.5%) |
| 8 or more Rooms | 312 (30.4%) | 23 (5.2%) |
| Total | 1,026 (100.0%) | 445 (100.0%) |
Housing Structure by Heating Type in Montgomery
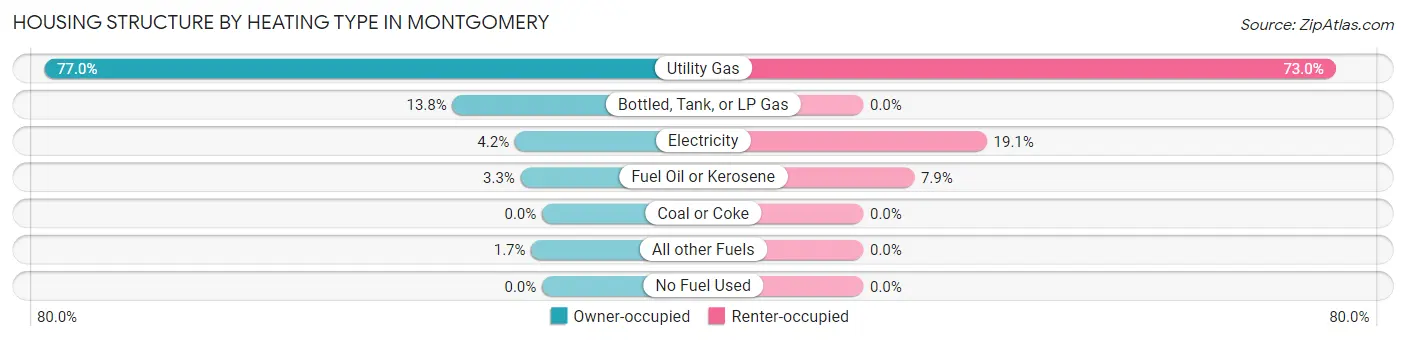
| Heating Type | Owner-occupied | Renter-occupied |
| Utility Gas | 790 (77.0%) | 325 (73.0%) |
| Bottled, Tank, or LP Gas | 142 (13.8%) | 0 (0.0%) |
| Electricity | 43 (4.2%) | 85 (19.1%) |
| Fuel Oil or Kerosene | 34 (3.3%) | 35 (7.9%) |
| Coal or Coke | 0 (0.0%) | 0 (0.0%) |
| All other Fuels | 17 (1.7%) | 0 (0.0%) |
| No Fuel Used | 0 (0.0%) | 0 (0.0%) |
| Total | 1,026 (100.0%) | 445 (100.0%) |
Household Vehicle Usage in Montgomery
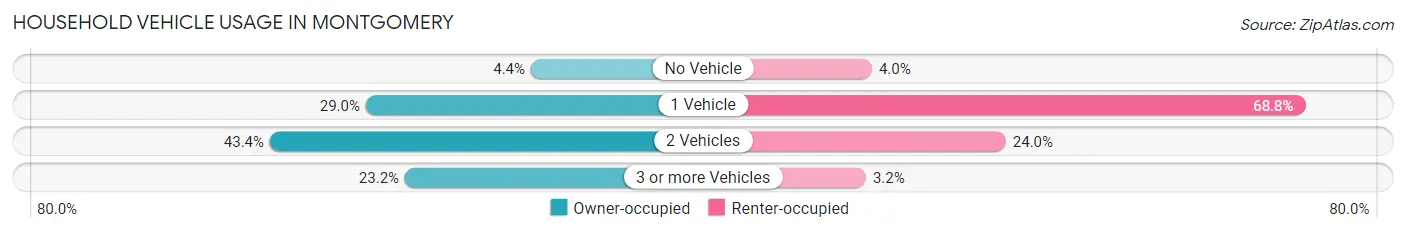
| Vehicles per Household | Owner-occupied | Renter-occupied |
| No Vehicle | 45 (4.4%) | 18 (4.0%) |
| 1 Vehicle | 298 (29.0%) | 306 (68.8%) |
| 2 Vehicles | 445 (43.4%) | 107 (24.0%) |
| 3 or more Vehicles | 238 (23.2%) | 14 (3.2%) |
| Total | 1,026 (100.0%) | 445 (100.0%) |
Real Estate & Mortgages in Montgomery
Real Estate and Mortgage Overview in Montgomery
| Characteristic | Without Mortgage | With Mortgage |
| Housing Units | 425 | 601 |
| Median Property Value | $306,000 | $357,000 |
| Median Household Income | $108,750 | $193 |
| Monthly Housing Costs | $1,079 | $157 |
| Real Estate Taxes | $8,285 | $11 |
Property Value by Mortgage Status in Montgomery
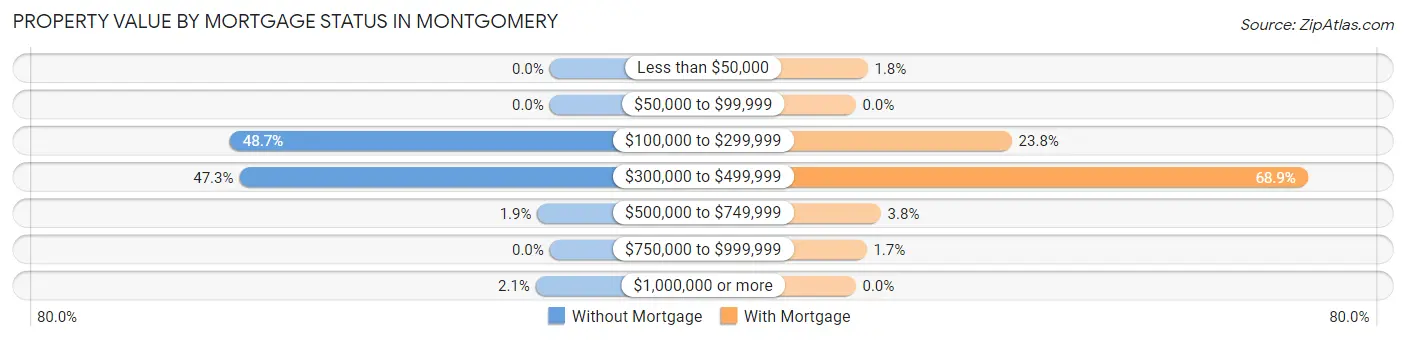
| Property Value | Without Mortgage | With Mortgage |
| Less than $50,000 | 0 (0.0%) | 11 (1.8%) |
| $50,000 to $99,999 | 0 (0.0%) | 0 (0.0%) |
| $100,000 to $299,999 | 207 (48.7%) | 143 (23.8%) |
| $300,000 to $499,999 | 201 (47.3%) | 414 (68.9%) |
| $500,000 to $749,999 | 8 (1.9%) | 23 (3.8%) |
| $750,000 to $999,999 | 0 (0.0%) | 10 (1.7%) |
| $1,000,000 or more | 9 (2.1%) | 0 (0.0%) |
| Total | 425 (100.0%) | 601 (100.0%) |
Household Income by Mortgage Status in Montgomery
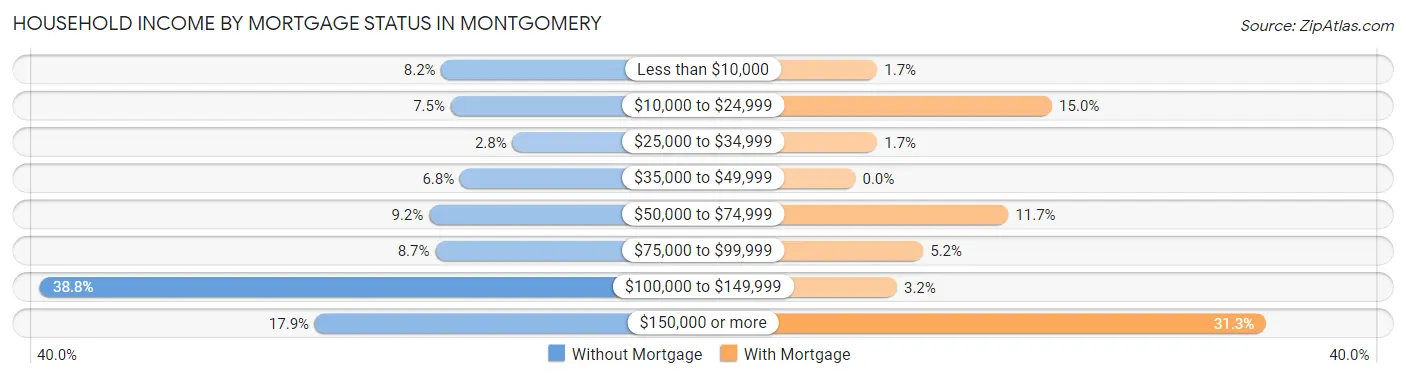
| Household Income | Without Mortgage | With Mortgage |
| Less than $10,000 | 35 (8.2%) | 10 (1.7%) |
| $10,000 to $24,999 | 32 (7.5%) | 90 (15.0%) |
| $25,000 to $34,999 | 12 (2.8%) | 10 (1.7%) |
| $35,000 to $49,999 | 29 (6.8%) | 0 (0.0%) |
| $50,000 to $74,999 | 39 (9.2%) | 70 (11.7%) |
| $75,000 to $99,999 | 37 (8.7%) | 31 (5.2%) |
| $100,000 to $149,999 | 165 (38.8%) | 19 (3.2%) |
| $150,000 or more | 76 (17.9%) | 188 (31.3%) |
| Total | 425 (100.0%) | 601 (100.0%) |
Property Value to Household Income Ratio in Montgomery
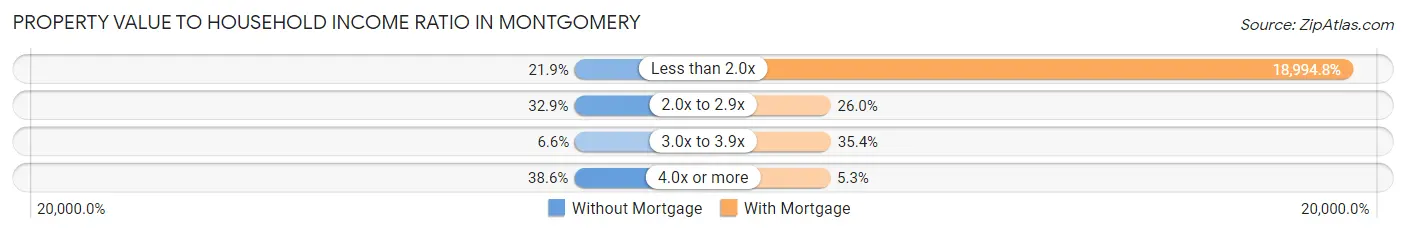
| Value-to-Income Ratio | Without Mortgage | With Mortgage |
| Less than 2.0x | 93 (21.9%) | 114,159 (18,994.8%) |
| 2.0x to 2.9x | 140 (32.9%) | 156 (26.0%) |
| 3.0x to 3.9x | 28 (6.6%) | 213 (35.4%) |
| 4.0x or more | 164 (38.6%) | 32 (5.3%) |
| Total | 425 (100.0%) | 601 (100.0%) |
Real Estate Taxes by Mortgage Status in Montgomery
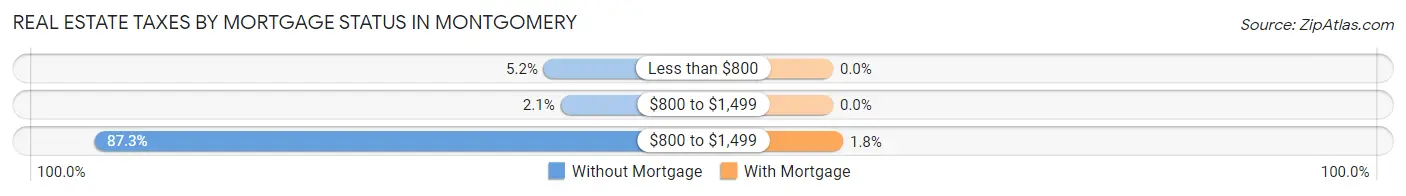
| Property Taxes | Without Mortgage | With Mortgage |
| Less than $800 | 22 (5.2%) | 0 (0.0%) |
| $800 to $1,499 | 9 (2.1%) | 0 (0.0%) |
| $800 to $1,499 | 371 (87.3%) | 11 (1.8%) |
| Total | 425 (100.0%) | 601 (100.0%) |
Health & Disability in Montgomery
Health Insurance Coverage by Age in Montgomery
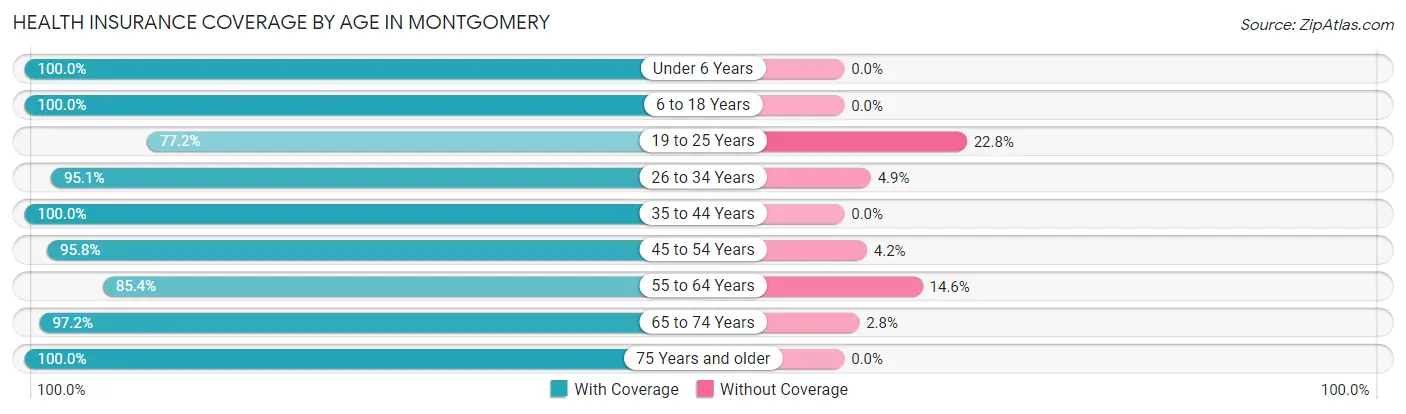
| Age Bracket | With Coverage | Without Coverage |
| Under 6 Years | 252 (100.0%) | 0 (0.0%) |
| 6 to 18 Years | 712 (100.0%) | 0 (0.0%) |
| 19 to 25 Years | 213 (77.2%) | 63 (22.8%) |
| 26 to 34 Years | 444 (95.1%) | 23 (4.9%) |
| 35 to 44 Years | 504 (100.0%) | 0 (0.0%) |
| 45 to 54 Years | 387 (95.8%) | 17 (4.2%) |
| 55 to 64 Years | 345 (85.4%) | 59 (14.6%) |
| 65 to 74 Years | 419 (97.2%) | 12 (2.8%) |
| 75 Years and older | 328 (100.0%) | 0 (0.0%) |
| Total | 3,604 (95.4%) | 174 (4.6%) |
Health Insurance Coverage by Citizenship Status in Montgomery
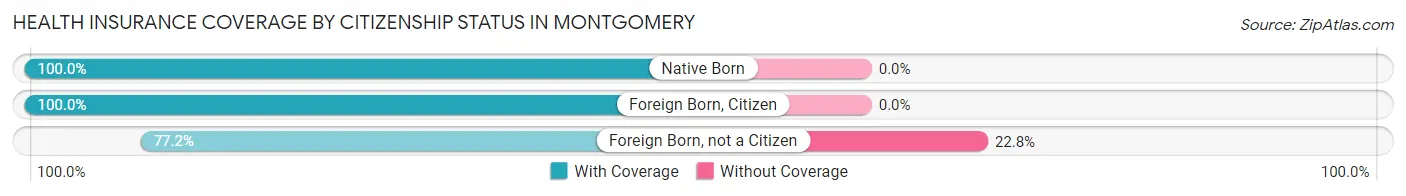
| Citizenship Status | With Coverage | Without Coverage |
| Native Born | 252 (100.0%) | 0 (0.0%) |
| Foreign Born, Citizen | 712 (100.0%) | 0 (0.0%) |
| Foreign Born, not a Citizen | 213 (77.2%) | 63 (22.8%) |
Health Insurance Coverage by Household Income in Montgomery
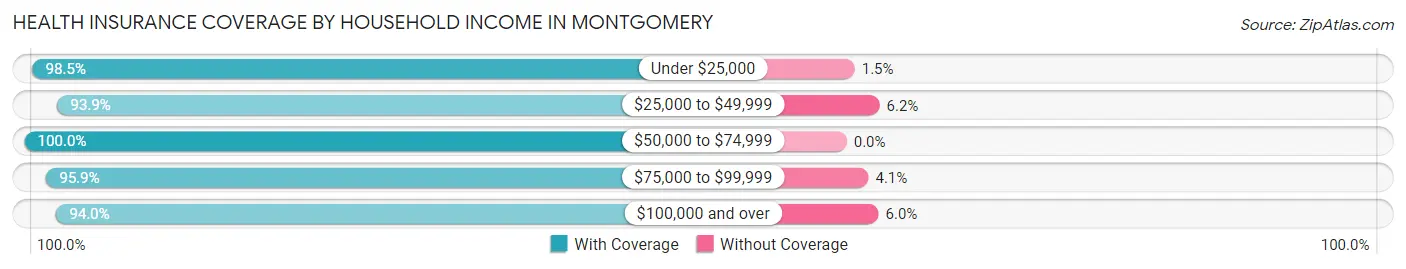
| Household Income | With Coverage | Without Coverage |
| Under $25,000 | 590 (98.5%) | 9 (1.5%) |
| $25,000 to $49,999 | 366 (93.9%) | 24 (6.1%) |
| $50,000 to $74,999 | 353 (100.0%) | 0 (0.0%) |
| $75,000 to $99,999 | 212 (95.9%) | 9 (4.1%) |
| $100,000 and over | 2,083 (94.0%) | 132 (6.0%) |
Public vs Private Health Insurance Coverage by Age in Montgomery
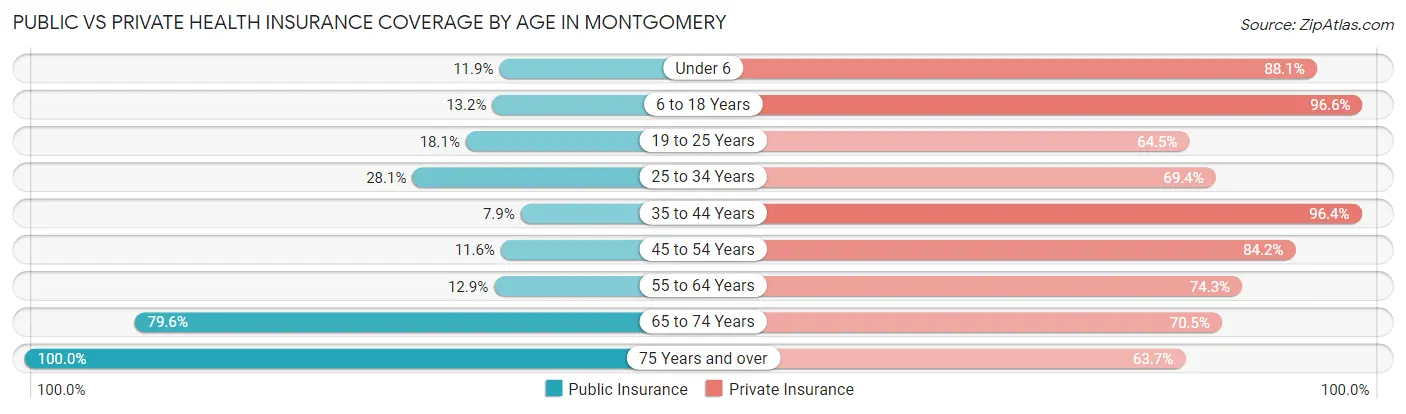
| Age Bracket | Public Insurance | Private Insurance |
| Under 6 | 30 (11.9%) | 222 (88.1%) |
| 6 to 18 Years | 94 (13.2%) | 688 (96.6%) |
| 19 to 25 Years | 50 (18.1%) | 178 (64.5%) |
| 25 to 34 Years | 131 (28.1%) | 324 (69.4%) |
| 35 to 44 Years | 40 (7.9%) | 486 (96.4%) |
| 45 to 54 Years | 47 (11.6%) | 340 (84.2%) |
| 55 to 64 Years | 52 (12.9%) | 300 (74.3%) |
| 65 to 74 Years | 343 (79.6%) | 304 (70.5%) |
| 75 Years and over | 328 (100.0%) | 209 (63.7%) |
| Total | 1,115 (29.5%) | 3,051 (80.8%) |
Disability Status by Sex by Age in Montgomery
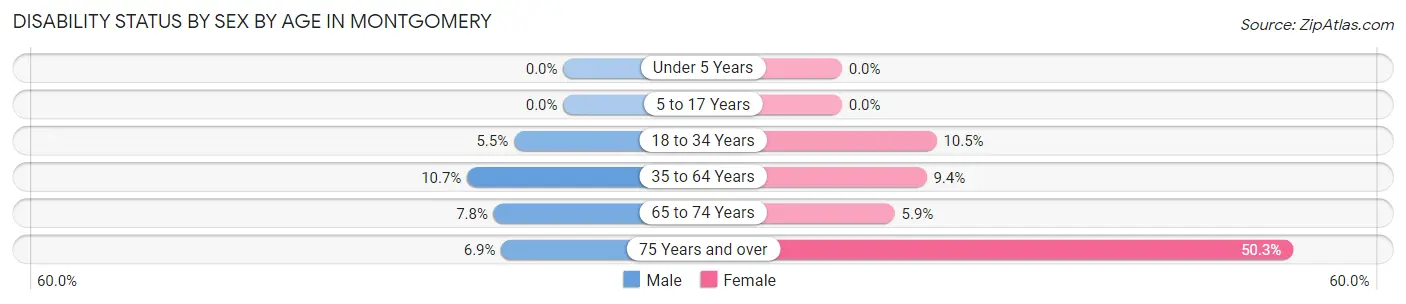
| Age Bracket | Male | Female |
| Under 5 Years | 0 (0.0%) | 0 (0.0%) |
| 5 to 17 Years | 0 (0.0%) | 0 (0.0%) |
| 18 to 34 Years | 25 (5.5%) | 35 (10.5%) |
| 35 to 64 Years | 69 (10.7%) | 63 (9.4%) |
| 65 to 74 Years | 11 (7.7%) | 17 (5.9%) |
| 75 Years and over | 10 (6.9%) | 92 (50.3%) |
Disability Class by Sex by Age in Montgomery
Disability Class: Hearing Difficulty
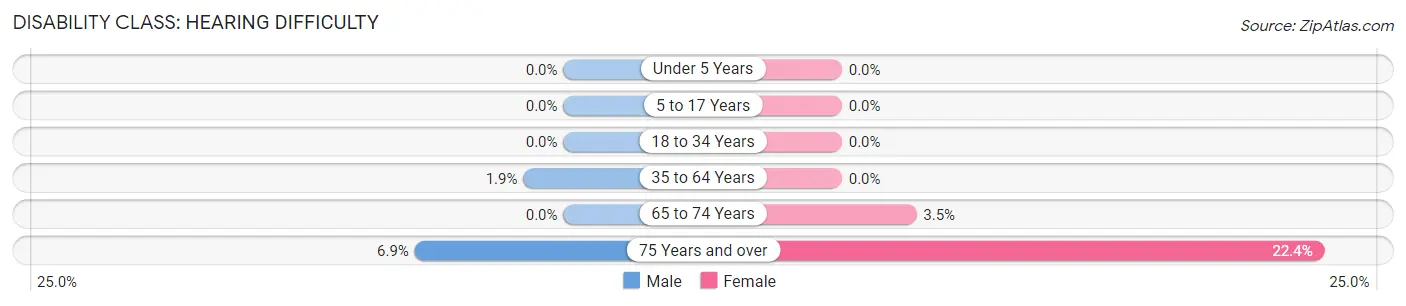
| Age Bracket | Male | Female |
| Under 5 Years | 0 (0.0%) | 0 (0.0%) |
| 5 to 17 Years | 0 (0.0%) | 0 (0.0%) |
| 18 to 34 Years | 0 (0.0%) | 0 (0.0%) |
| 35 to 64 Years | 12 (1.9%) | 0 (0.0%) |
| 65 to 74 Years | 0 (0.0%) | 10 (3.5%) |
| 75 Years and over | 10 (6.9%) | 41 (22.4%) |
Disability Class: Vision Difficulty
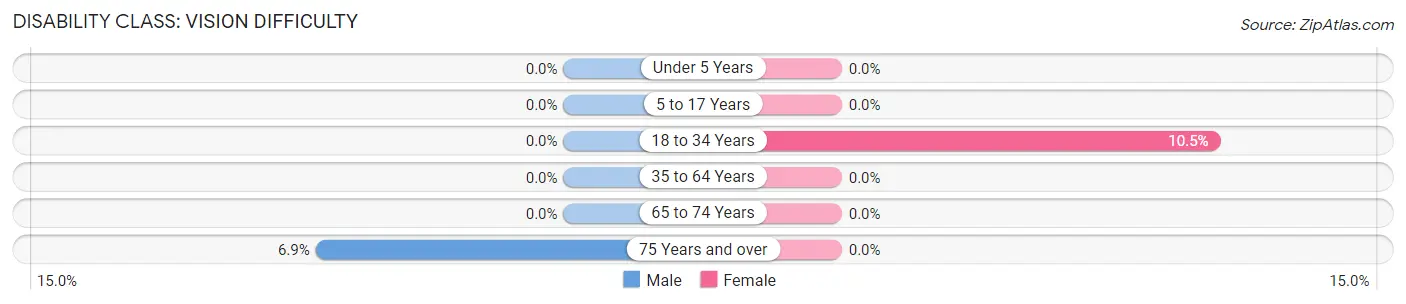
| Age Bracket | Male | Female |
| Under 5 Years | 0 (0.0%) | 0 (0.0%) |
| 5 to 17 Years | 0 (0.0%) | 0 (0.0%) |
| 18 to 34 Years | 0 (0.0%) | 35 (10.5%) |
| 35 to 64 Years | 0 (0.0%) | 0 (0.0%) |
| 65 to 74 Years | 0 (0.0%) | 0 (0.0%) |
| 75 Years and over | 10 (6.9%) | 0 (0.0%) |
Disability Class: Cognitive Difficulty
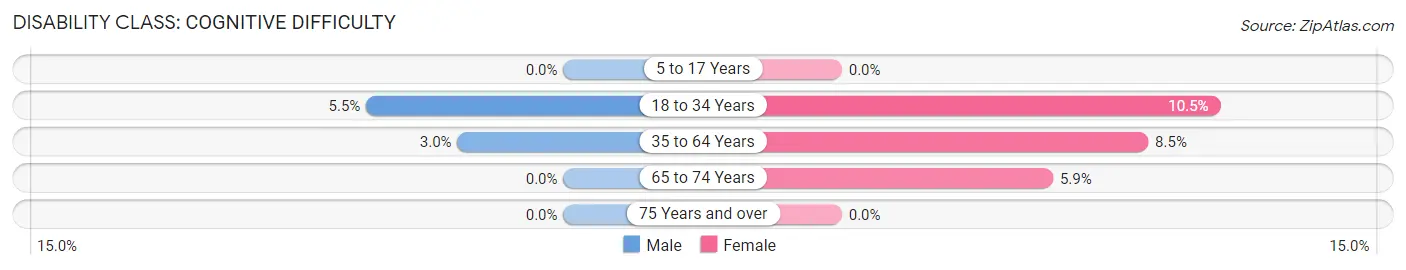
| Age Bracket | Male | Female |
| 5 to 17 Years | 0 (0.0%) | 0 (0.0%) |
| 18 to 34 Years | 25 (5.5%) | 35 (10.5%) |
| 35 to 64 Years | 19 (2.9%) | 57 (8.5%) |
| 65 to 74 Years | 0 (0.0%) | 17 (5.9%) |
| 75 Years and over | 0 (0.0%) | 0 (0.0%) |
Disability Class: Ambulatory Difficulty
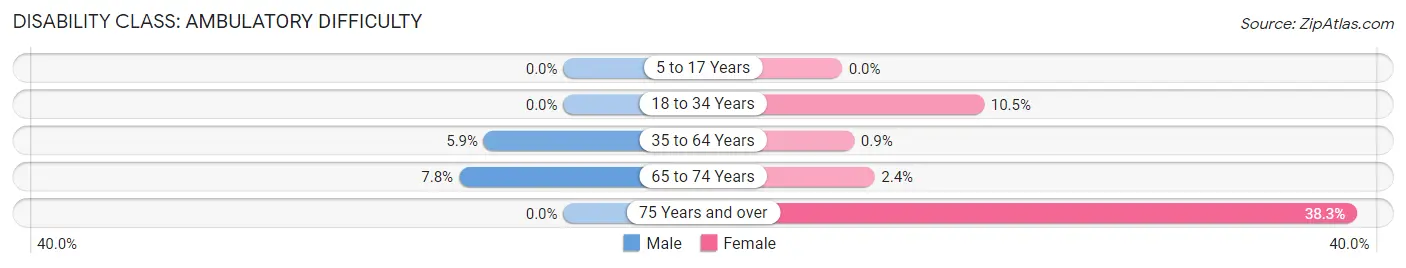
| Age Bracket | Male | Female |
| 5 to 17 Years | 0 (0.0%) | 0 (0.0%) |
| 18 to 34 Years | 0 (0.0%) | 35 (10.5%) |
| 35 to 64 Years | 38 (5.9%) | 6 (0.9%) |
| 65 to 74 Years | 11 (7.7%) | 7 (2.4%) |
| 75 Years and over | 0 (0.0%) | 70 (38.3%) |
Disability Class: Self-Care Difficulty
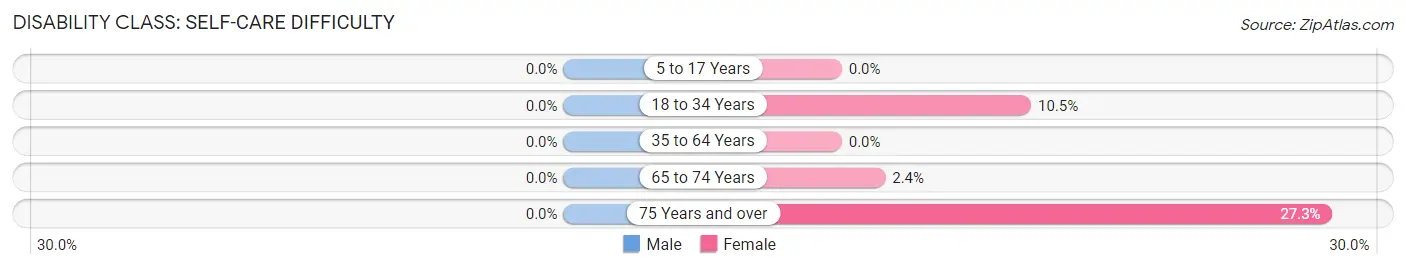
| Age Bracket | Male | Female |
| 5 to 17 Years | 0 (0.0%) | 0 (0.0%) |
| 18 to 34 Years | 0 (0.0%) | 35 (10.5%) |
| 35 to 64 Years | 0 (0.0%) | 0 (0.0%) |
| 65 to 74 Years | 0 (0.0%) | 7 (2.4%) |
| 75 Years and over | 0 (0.0%) | 50 (27.3%) |
Technology Access in Montgomery
Computing Device Access in Montgomery
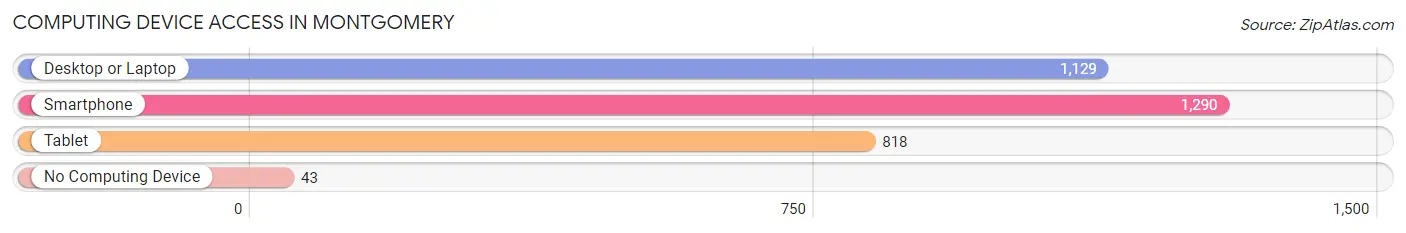
| Device Type | # Households | % Households |
| Desktop or Laptop | 1,129 | 76.7% |
| Smartphone | 1,290 | 87.7% |
| Tablet | 818 | 55.6% |
| No Computing Device | 43 | 2.9% |
| Total | 1,471 | 100.0% |
Internet Access in Montgomery
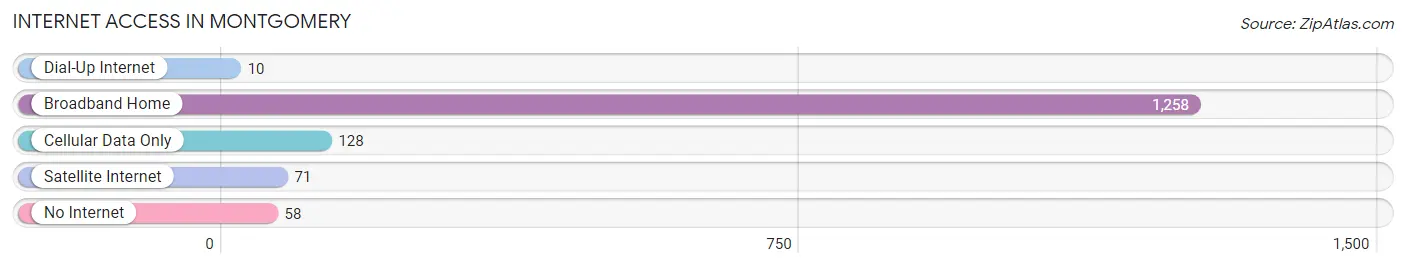
| Internet Type | # Households | % Households |
| Dial-Up Internet | 10 | 0.7% |
| Broadband Home | 1,258 | 85.5% |
| Cellular Data Only | 128 | 8.7% |
| Satellite Internet | 71 | 4.8% |
| No Internet | 58 | 3.9% |
| Total | 1,471 | 100.0% |
Montgomery Summary
Montgomery, New York is a town located in Orange County, New York, United States. The town is located in the southeastern part of the county, and is bordered by the towns of Wallkill, Hamptonburgh, Newburgh, and Crawford. As of the 2010 census, the town had a population of 11,566.
Geography
Montgomery is located in the southeastern part of Orange County, and is bordered by the towns of Wallkill, Hamptonburgh, Newburgh, and Crawford. The town is located in the Hudson Valley region of New York, and is situated on the west bank of the Hudson River. The town has a total area of 33.2 square miles, of which 32.9 square miles is land and 0.3 square miles is water.
The town is home to several small lakes, including Lake Maratanza, Lake Marlboro, and Lake Montgomery. The town is also home to several parks, including the Montgomery Town Park, the Montgomery Town Beach, and the Montgomery Town Green.
History
The area that is now Montgomery was originally inhabited by the Munsee Native Americans. The first European settlers arrived in the area in the late 17th century, and the town was officially established in 1772. The town was named after General Richard Montgomery, who was killed in the Battle of Quebec during the American Revolutionary War.
The town was an agricultural community for much of its history, and was known for its production of apples, peaches, and other fruits. The town also had several mills, including a grist mill, a saw mill, and a paper mill.
Economy
The economy of Montgomery is largely based on agriculture and tourism. The town is home to several farms, which produce apples, peaches, and other fruits. The town is also home to several wineries, which produce a variety of wines.
The town is also home to several businesses, including a number of restaurants, retail stores, and other businesses. The town is also home to several manufacturing companies, including a paper mill and a plastics factory.
Demographics
As of the 2010 census, the town had a population of 11,566. The racial makeup of the town was 87.3% White, 5.7% African American, 0.4% Native American, 1.7% Asian, 0.1% Pacific Islander, 2.3% from other races, and 2.5% from two or more races. Hispanic or Latino of any race were 8.2% of the population.
The median income for a household in the town was $60,945, and the median income for a family was $71,917. The per capita income for the town was $27,845. About 4.2% of families and 5.7% of the population were below the poverty line, including 6.7% of those under age 18 and 4.2% of those age 65 or over.
Common Questions
What is Per Capita Income in Montgomery?
Per Capita income in Montgomery is $39,378.
What is the Median Family Income in Montgomery?
Median Family Income in Montgomery is $112,269.
What is the Median Household income in Montgomery?
Median Household Income in Montgomery is $89,107.
What is Income or Wage Gap in Montgomery?
Income or Wage Gap in Montgomery is 34.6%.
Women in Montgomery earn 65.4 cents for every dollar earned by a man.
What is Inequality or Gini Index in Montgomery?
Inequality or Gini Index in Montgomery is 0.45.
What is the Total Population of Montgomery?
Total Population of Montgomery is 3,797.
What is the Total Male Population of Montgomery?
Total Male Population of Montgomery is 1,756.
What is the Total Female Population of Montgomery?
Total Female Population of Montgomery is 2,041.
What is the Ratio of Males per 100 Females in Montgomery?
There are 86.04 Males per 100 Females in Montgomery.
What is the Ratio of Females per 100 Males in Montgomery?
There are 116.23 Females per 100 Males in Montgomery.
What is the Median Population Age in Montgomery?
Median Population Age in Montgomery is 38.5 Years.
What is the Average Family Size in Montgomery
Average Family Size in Montgomery is 3.4 People.
What is the Average Household Size in Montgomery
Average Household Size in Montgomery is 2.6 People.
How Large is the Labor Force in Montgomery?
There are 1,812 People in the Labor Forcein in Montgomery.
What is the Percentage of People in the Labor Force in Montgomery?
59.6% of People are in the Labor Force in Montgomery.
What is the Unemployment Rate in Montgomery?
Unemployment Rate in Montgomery is 2.7%.