Maybrook, NY Map & Demographics
Maybrook Map
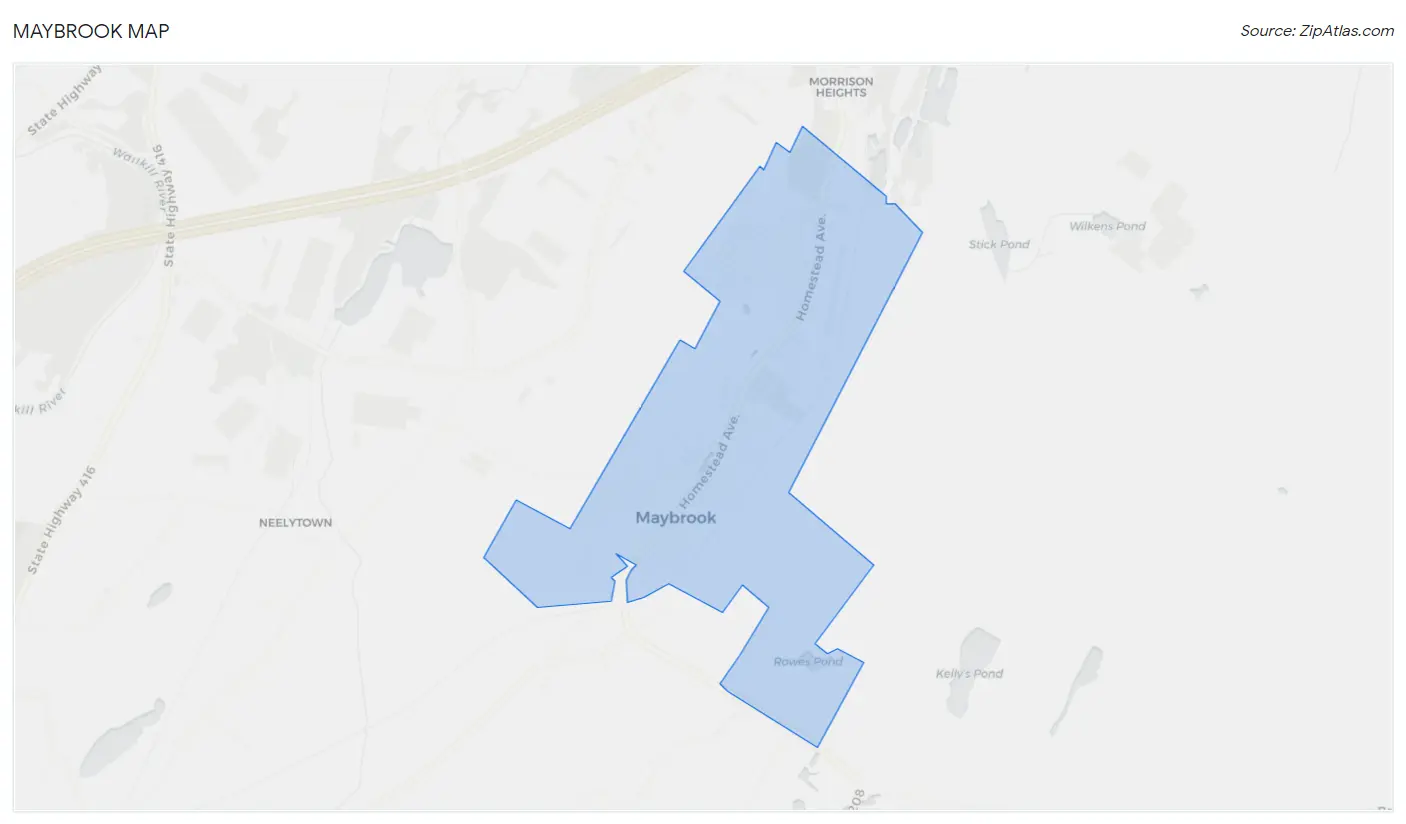
Maybrook Overview
$44,685
PER CAPITA INCOME
$111,131
AVG FAMILY INCOME
$90,111
AVG HOUSEHOLD INCOME
15.8%
WAGE / INCOME GAP [ % ]
84.2¢/ $1
WAGE / INCOME GAP [ $ ]
0.45
INEQUALITY / GINI INDEX
3,135
TOTAL POPULATION
1,417
MALE POPULATION
1,718
FEMALE POPULATION
82.48
MALES / 100 FEMALES
121.24
FEMALES / 100 MALES
43.3
MEDIAN AGE
3.1
AVG FAMILY SIZE
2.3
AVG HOUSEHOLD SIZE
1,720
LABOR FORCE [ PEOPLE ]
66.3%
PERCENT IN LABOR FORCE
4.2%
UNEMPLOYMENT RATE
Maybrook Zip Codes
Maybrook Area Codes
Income in Maybrook
Income Overview in Maybrook
Per Capita Income in Maybrook is $44,685, while median incomes of families and households are $111,131 and $90,111 respectively.
| Characteristic | Number | Measure |
| Per Capita Income | 3,135 | $44,685 |
| Median Family Income | 766 | $111,131 |
| Mean Family Income | 766 | $136,465 |
| Median Household Income | 1,336 | $90,111 |
| Mean Household Income | 1,336 | $103,780 |
| Income Deficit | 766 | $0 |
| Wage / Income Gap (%) | 3,135 | 15.84% |
| Wage / Income Gap ($) | 3,135 | 84.16¢ per $1 |
| Gini / Inequality Index | 3,135 | 0.45 |
Earnings by Sex in Maybrook
Average Earnings in Maybrook are $53,322, $57,985 for men and $48,798 for women, a difference of 15.8%.
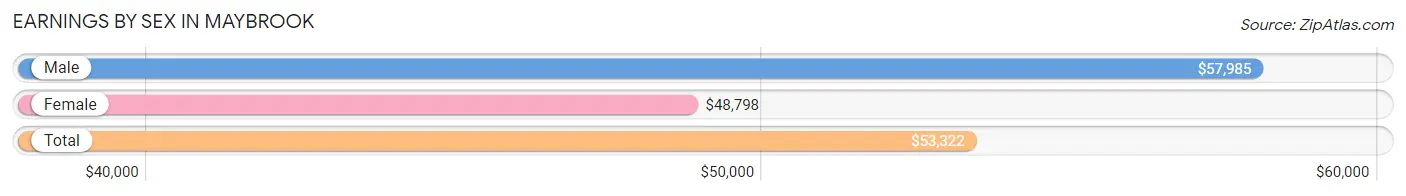
| Sex | Number | Average Earnings |
| Male | 973 (54.6%) | $57,985 |
| Female | 808 (45.4%) | $48,798 |
| Total | 1,781 (100.0%) | $53,322 |
Earnings by Sex by Income Bracket in Maybrook
The most common earnings brackets in Maybrook are $100,000+ for men (159 | 16.3%) and $55,000 to $64,999 for women (127 | 15.7%).
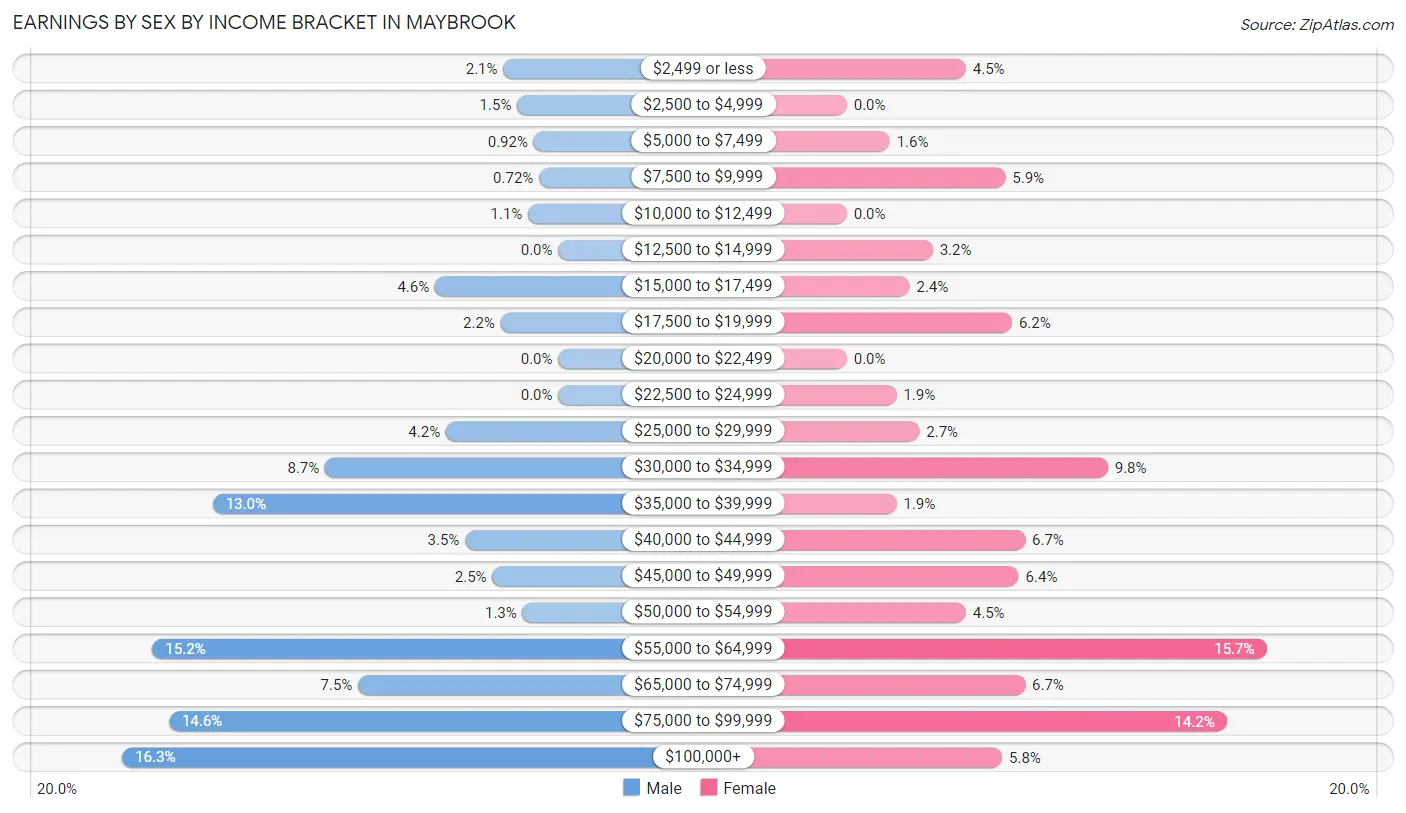
| Income | Male | Female |
| $2,499 or less | 20 (2.1%) | 36 (4.5%) |
| $2,500 to $4,999 | 15 (1.5%) | 0 (0.0%) |
| $5,000 to $7,499 | 9 (0.9%) | 13 (1.6%) |
| $7,500 to $9,999 | 7 (0.7%) | 48 (5.9%) |
| $10,000 to $12,499 | 11 (1.1%) | 0 (0.0%) |
| $12,500 to $14,999 | 0 (0.0%) | 26 (3.2%) |
| $15,000 to $17,499 | 45 (4.6%) | 19 (2.4%) |
| $17,500 to $19,999 | 21 (2.2%) | 50 (6.2%) |
| $20,000 to $22,499 | 0 (0.0%) | 0 (0.0%) |
| $22,500 to $24,999 | 0 (0.0%) | 15 (1.9%) |
| $25,000 to $29,999 | 41 (4.2%) | 22 (2.7%) |
| $30,000 to $34,999 | 85 (8.7%) | 79 (9.8%) |
| $35,000 to $39,999 | 126 (13.0%) | 15 (1.9%) |
| $40,000 to $44,999 | 34 (3.5%) | 54 (6.7%) |
| $45,000 to $49,999 | 24 (2.5%) | 52 (6.4%) |
| $50,000 to $54,999 | 13 (1.3%) | 36 (4.5%) |
| $55,000 to $64,999 | 148 (15.2%) | 127 (15.7%) |
| $65,000 to $74,999 | 73 (7.5%) | 54 (6.7%) |
| $75,000 to $99,999 | 142 (14.6%) | 115 (14.2%) |
| $100,000+ | 159 (16.3%) | 47 (5.8%) |
| Total | 973 (100.0%) | 808 (100.0%) |
Earnings by Sex by Educational Attainment in Maybrook
Average earnings in Maybrook are $60,491 for men and $53,281 for women, a difference of 11.9%. Men with an educational attainment of bachelor's degree enjoy the highest average annual earnings of $73,889, while those with high school diploma education earn the least with $56,458. Women with an educational attainment of high school diploma earn the most with the average annual earnings of $58,575, while those with college or associate's degree education have the smallest earnings of $53,068.
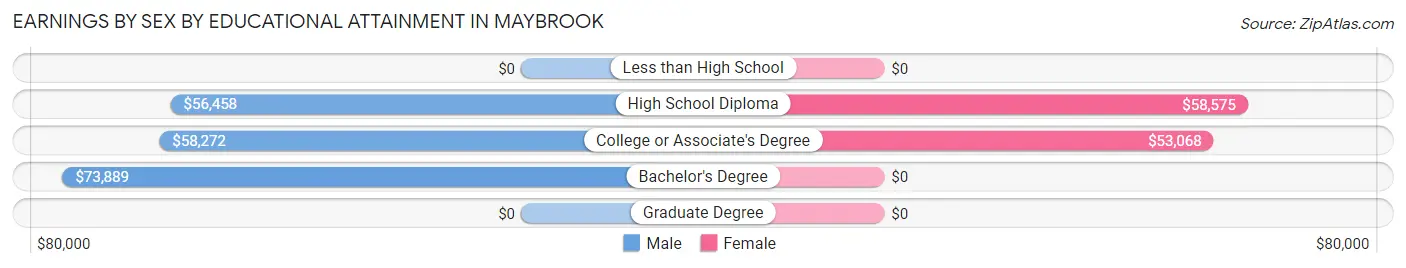
| Educational Attainment | Male Income | Female Income |
| Less than High School | - | - |
| High School Diploma | $56,458 | $58,575 |
| College or Associate's Degree | $58,272 | $53,068 |
| Bachelor's Degree | $73,889 | $0 |
| Graduate Degree | - | - |
| Total | $60,491 | $53,281 |
Family Income in Maybrook
Family Income Brackets in Maybrook
According to the Maybrook family income data, there are 281 families falling into the $100,000 to $149,999 income range, which is the most common income bracket and makes up 36.7% of all families.
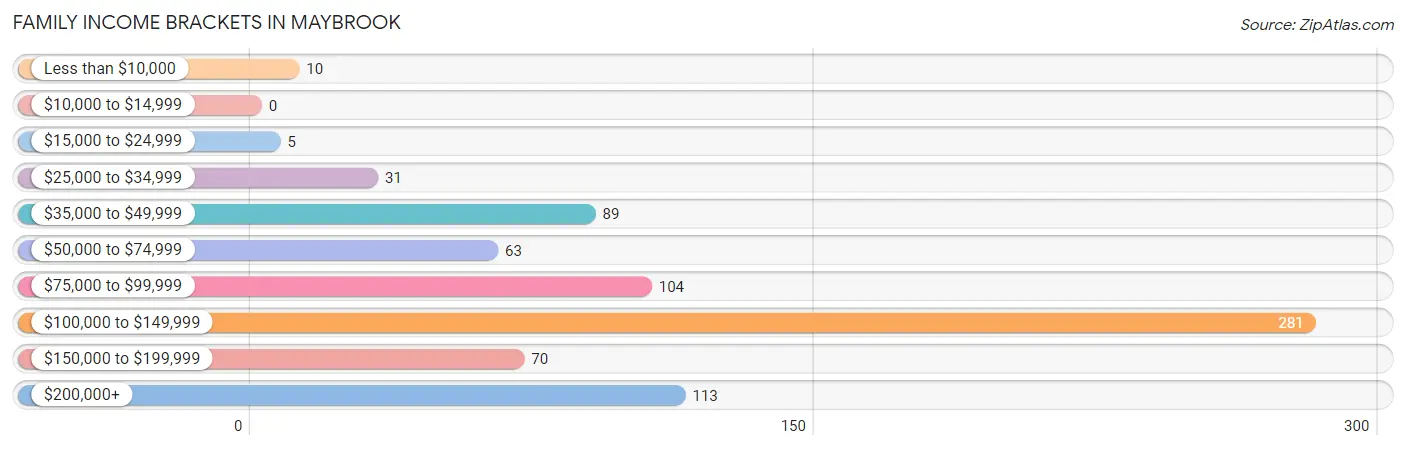
| Income Bracket | # Families | % Families |
| Less than $10,000 | 10 | 1.3% |
| $10,000 to $14,999 | 0 | 0.0% |
| $15,000 to $24,999 | 5 | 0.7% |
| $25,000 to $34,999 | 31 | 4.0% |
| $35,000 to $49,999 | 89 | 11.6% |
| $50,000 to $74,999 | 63 | 8.2% |
| $75,000 to $99,999 | 104 | 13.6% |
| $100,000 to $149,999 | 281 | 36.7% |
| $150,000 to $199,999 | 70 | 9.1% |
| $200,000+ | 113 | 14.8% |
Family Income by Famaliy Size in Maybrook
4-person families (89 | 11.6%) account for the highest median family income in Maybrook with $162,936 per family, while 2-person families (336 | 43.9%) have the highest median income of $55,625 per family member.
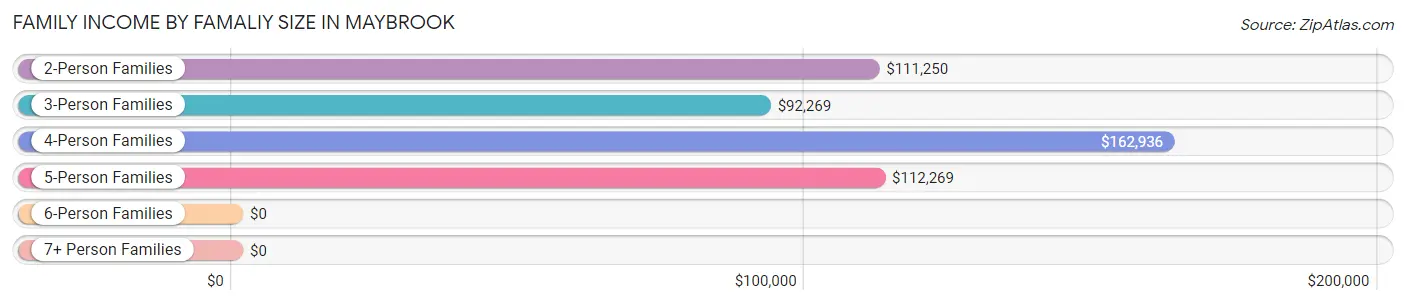
| Income Bracket | # Families | Median Income |
| 2-Person Families | 336 (43.9%) | $111,250 |
| 3-Person Families | 233 (30.4%) | $92,269 |
| 4-Person Families | 89 (11.6%) | $162,936 |
| 5-Person Families | 95 (12.4%) | $112,269 |
| 6-Person Families | 13 (1.7%) | $0 |
| 7+ Person Families | 0 (0.0%) | $0 |
| Total | 766 (100.0%) | $111,131 |
Family Income by Number of Earners in Maybrook
The median family income in Maybrook is $111,131, with families comprising 3+ earners (81) having the highest median family income of $114,464, while families with no earners (66) have the lowest median family income of $49,500, accounting for 10.6% and 8.6% of families, respectively.
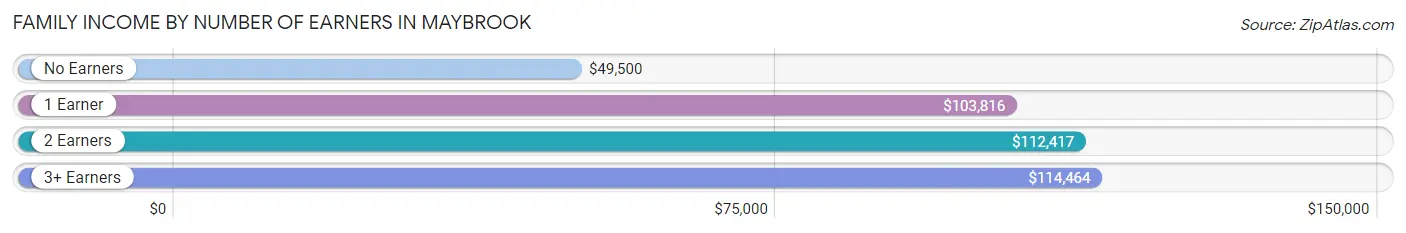
| Number of Earners | # Families | Median Income |
| No Earners | 66 (8.6%) | $49,500 |
| 1 Earner | 208 (27.2%) | $103,816 |
| 2 Earners | 411 (53.7%) | $112,417 |
| 3+ Earners | 81 (10.6%) | $114,464 |
| Total | 766 (100.0%) | $111,131 |
Household Income in Maybrook
Household Income Brackets in Maybrook
With 393 households falling in the category, the $100,000 to $149,999 income range is the most frequent in Maybrook, accounting for 29.4% of all households. In contrast, only 19 households (1.4%) fall into the $10,000 to $14,999 income bracket, making it the least populous group.
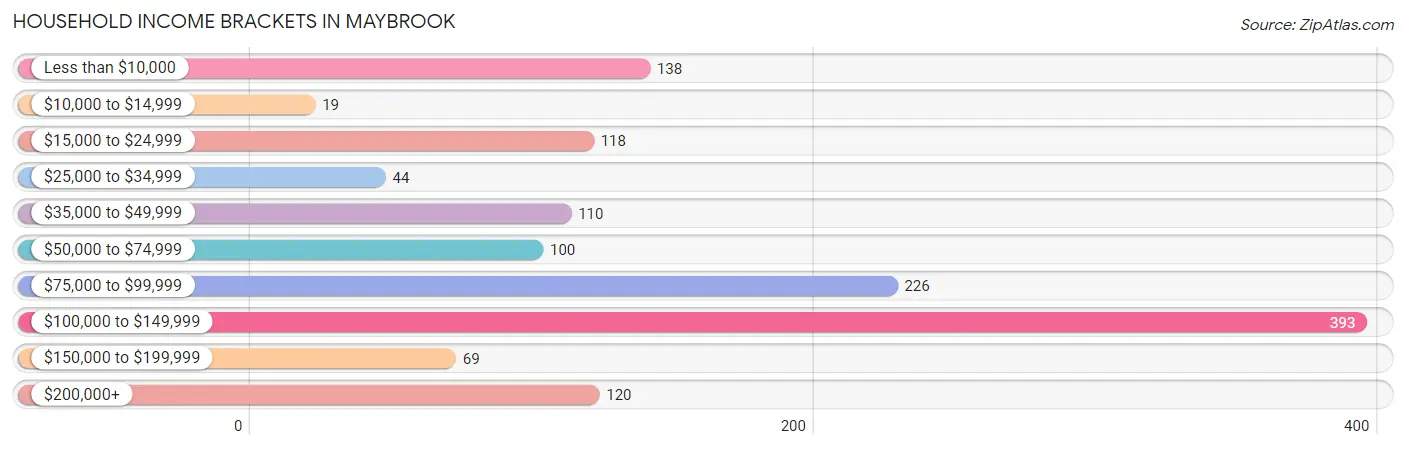
| Income Bracket | # Households | % Households |
| Less than $10,000 | 138 | 10.3% |
| $10,000 to $14,999 | 19 | 1.4% |
| $15,000 to $24,999 | 118 | 8.8% |
| $25,000 to $34,999 | 44 | 3.3% |
| $35,000 to $49,999 | 110 | 8.2% |
| $50,000 to $74,999 | 100 | 7.5% |
| $75,000 to $99,999 | 226 | 16.9% |
| $100,000 to $149,999 | 393 | 29.4% |
| $150,000 to $199,999 | 69 | 5.2% |
| $200,000+ | 120 | 9.0% |
Household Income by Householder Age in Maybrook
The median household income in Maybrook is $90,111, with the highest median household income of $111,875 found in the 45 to 64 years age bracket for the primary householder. A total of 437 households (32.7%) fall into this category. Meanwhile, the 15 to 24 years age bracket for the primary householder has the lowest median household income of $0, with 20 households (1.5%) in this group.
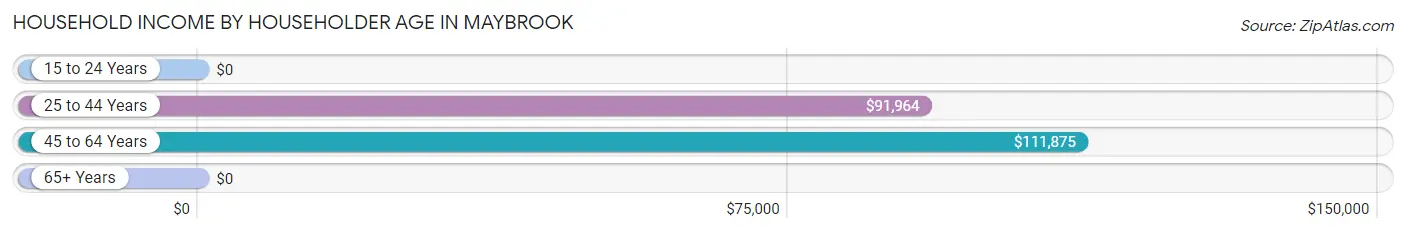
| Income Bracket | # Households | Median Income |
| 15 to 24 Years | 20 (1.5%) | $0 |
| 25 to 44 Years | 380 (28.4%) | $91,964 |
| 45 to 64 Years | 437 (32.7%) | $111,875 |
| 65+ Years | 499 (37.3%) | $0 |
| Total | 1,336 (100.0%) | $90,111 |
Poverty in Maybrook
Income Below Poverty by Sex and Age in Maybrook
With 5.1% poverty level for males and 8.6% for females among the residents of Maybrook, 75 year old and over males and 75 year old and over females are the most vulnerable to poverty, with 42 males (43.8%) and 81 females (43.5%) in their respective age groups living below the poverty level.
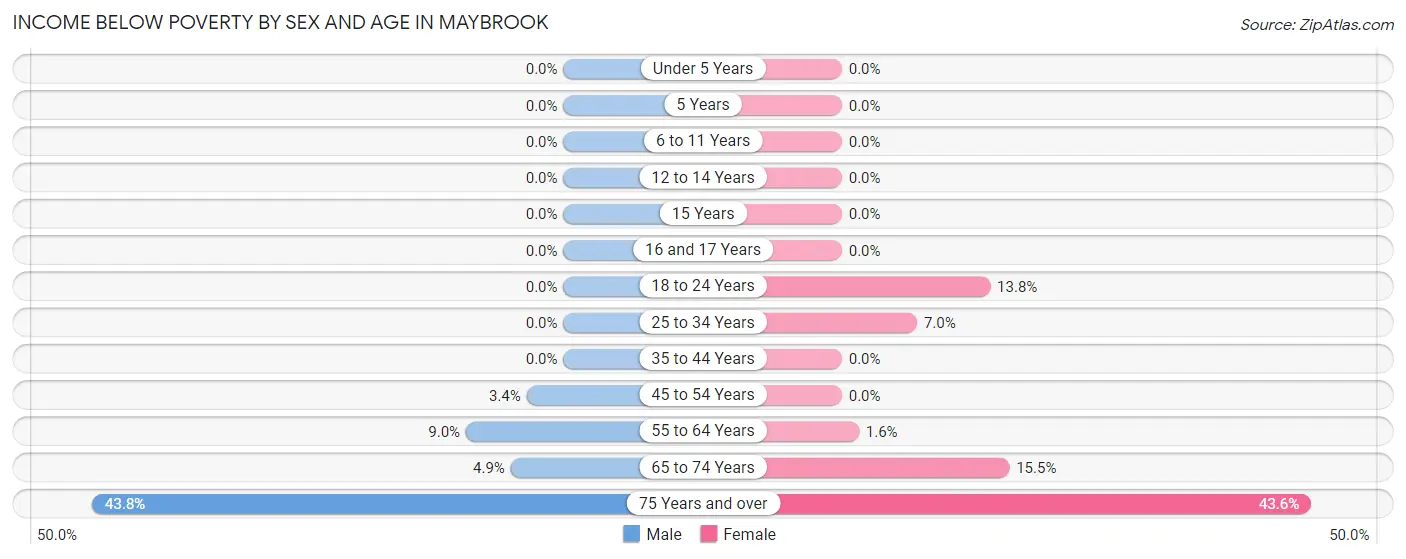
| Age Bracket | Male | Female |
| Under 5 Years | 0 (0.0%) | 0 (0.0%) |
| 5 Years | 0 (0.0%) | 0 (0.0%) |
| 6 to 11 Years | 0 (0.0%) | 0 (0.0%) |
| 12 to 14 Years | 0 (0.0%) | 0 (0.0%) |
| 15 Years | 0 (0.0%) | 0 (0.0%) |
| 16 and 17 Years | 0 (0.0%) | 0 (0.0%) |
| 18 to 24 Years | 0 (0.0%) | 23 (13.8%) |
| 25 to 34 Years | 0 (0.0%) | 9 (7.0%) |
| 35 to 44 Years | 0 (0.0%) | 0 (0.0%) |
| 45 to 54 Years | 7 (3.4%) | 0 (0.0%) |
| 55 to 64 Years | 15 (9.0%) | 5 (1.6%) |
| 65 to 74 Years | 9 (4.9%) | 30 (15.5%) |
| 75 Years and over | 42 (43.8%) | 81 (43.5%) |
| Total | 73 (5.1%) | 148 (8.6%) |
Income Above Poverty by Sex and Age in Maybrook
According to the poverty statistics in Maybrook, males aged under 5 years and females aged under 5 years are the age groups that are most secure financially, with 100.0% of males and 100.0% of females in these age groups living above the poverty line.
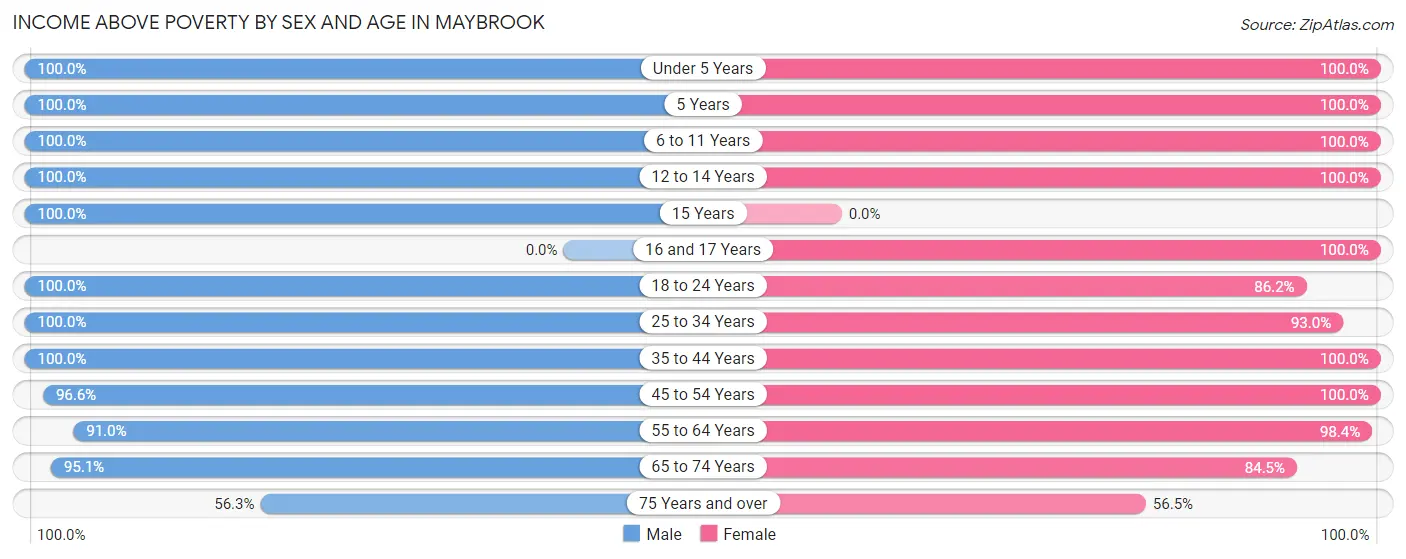
| Age Bracket | Male | Female |
| Under 5 Years | 74 (100.0%) | 125 (100.0%) |
| 5 Years | 17 (100.0%) | 12 (100.0%) |
| 6 to 11 Years | 49 (100.0%) | 110 (100.0%) |
| 12 to 14 Years | 43 (100.0%) | 79 (100.0%) |
| 15 Years | 32 (100.0%) | 0 (0.0%) |
| 16 and 17 Years | 0 (0.0%) | 46 (100.0%) |
| 18 to 24 Years | 99 (100.0%) | 144 (86.2%) |
| 25 to 34 Years | 267 (100.0%) | 120 (93.0%) |
| 35 to 44 Years | 185 (100.0%) | 180 (100.0%) |
| 45 to 54 Years | 198 (96.6%) | 174 (100.0%) |
| 55 to 64 Years | 151 (91.0%) | 312 (98.4%) |
| 65 to 74 Years | 175 (95.1%) | 163 (84.5%) |
| 75 Years and over | 54 (56.2%) | 105 (56.5%) |
| Total | 1,344 (94.9%) | 1,570 (91.4%) |
Income Below Poverty Among Married-Couple Families in Maybrook
The poverty statistics for married-couple families in Maybrook show that 1.9% or 10 of the total 539 families live below the poverty line. Families with no children have the highest poverty rate of 3.1%, comprising of 10 families. On the other hand, families with 1 or 2 children have the lowest poverty rate of 0.0%, which includes 0 families.
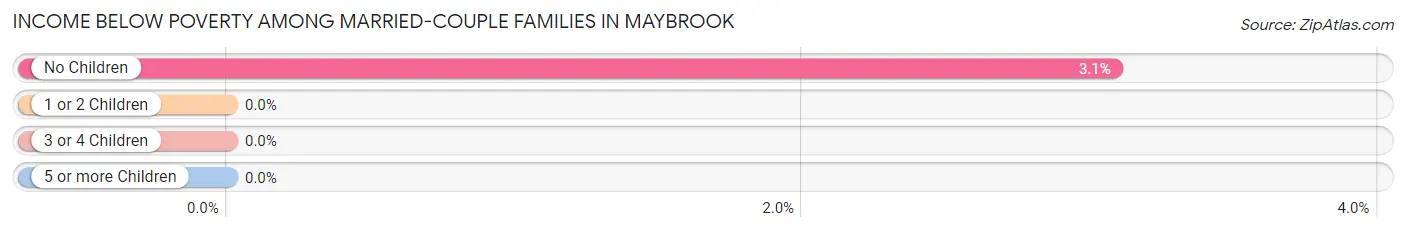
| Children | Above Poverty | Below Poverty |
| No Children | 315 (96.9%) | 10 (3.1%) |
| 1 or 2 Children | 156 (100.0%) | 0 (0.0%) |
| 3 or 4 Children | 58 (100.0%) | 0 (0.0%) |
| 5 or more Children | 0 (0.0%) | 0 (0.0%) |
| Total | 529 (98.1%) | 10 (1.9%) |
Income Below Poverty Among Single-Parent Households in Maybrook
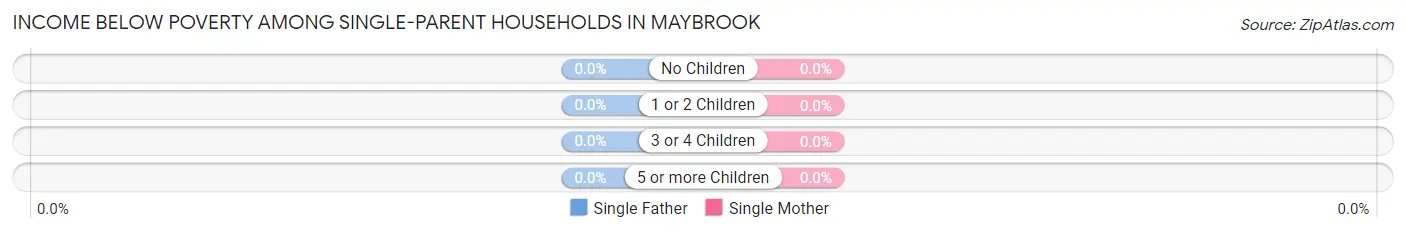
| Children | Single Father | Single Mother |
| No Children | 0 (0.0%) | 0 (0.0%) |
| 1 or 2 Children | 0 (0.0%) | 0 (0.0%) |
| 3 or 4 Children | 0 (0.0%) | 0 (0.0%) |
| 5 or more Children | 0 (0.0%) | 0 (0.0%) |
| Total | 0 (0.0%) | 0 (0.0%) |
Income Below Poverty Among Married-Couple vs Single-Parent Households in Maybrook
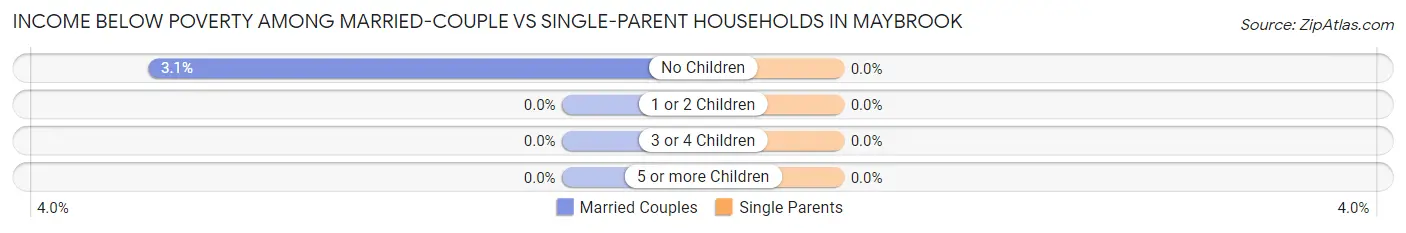
| Children | Married-Couple Families | Single-Parent Households |
| No Children | 10 (3.1%) | 0 (0.0%) |
| 1 or 2 Children | 0 (0.0%) | 0 (0.0%) |
| 3 or 4 Children | 0 (0.0%) | 0 (0.0%) |
| 5 or more Children | 0 (0.0%) | 0 (0.0%) |
| Total | 10 (1.9%) | 0 (0.0%) |
Race in Maybrook
The most populous races in Maybrook are White / Caucasian (2,144 | 68.4%), Hispanic or Latino (847 | 27.0%), and Two or more Races (581 | 18.5%).
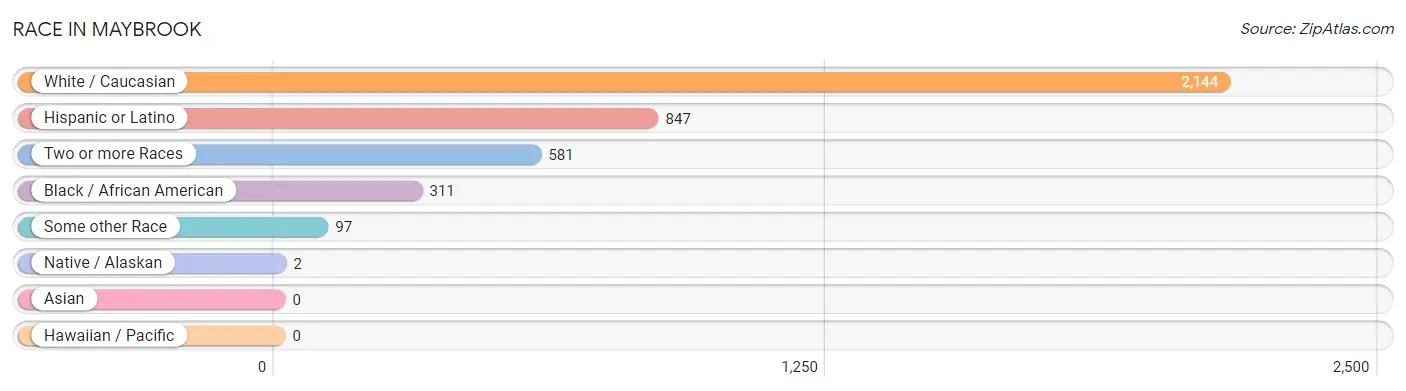
| Race | # Population | % Population |
| Asian | 0 | 0.0% |
| Black / African American | 311 | 9.9% |
| Hawaiian / Pacific | 0 | 0.0% |
| Hispanic or Latino | 847 | 27.0% |
| Native / Alaskan | 2 | 0.1% |
| White / Caucasian | 2,144 | 68.4% |
| Two or more Races | 581 | 18.5% |
| Some other Race | 97 | 3.1% |
| Total | 3,135 | 100.0% |
Ancestry in Maybrook
The most populous ancestries reported in Maybrook are German (546 | 17.4%), Irish (531 | 16.9%), Italian (509 | 16.2%), Puerto Rican (488 | 15.6%), and Dominican (163 | 5.2%), together accounting for 71.4% of all Maybrook residents.
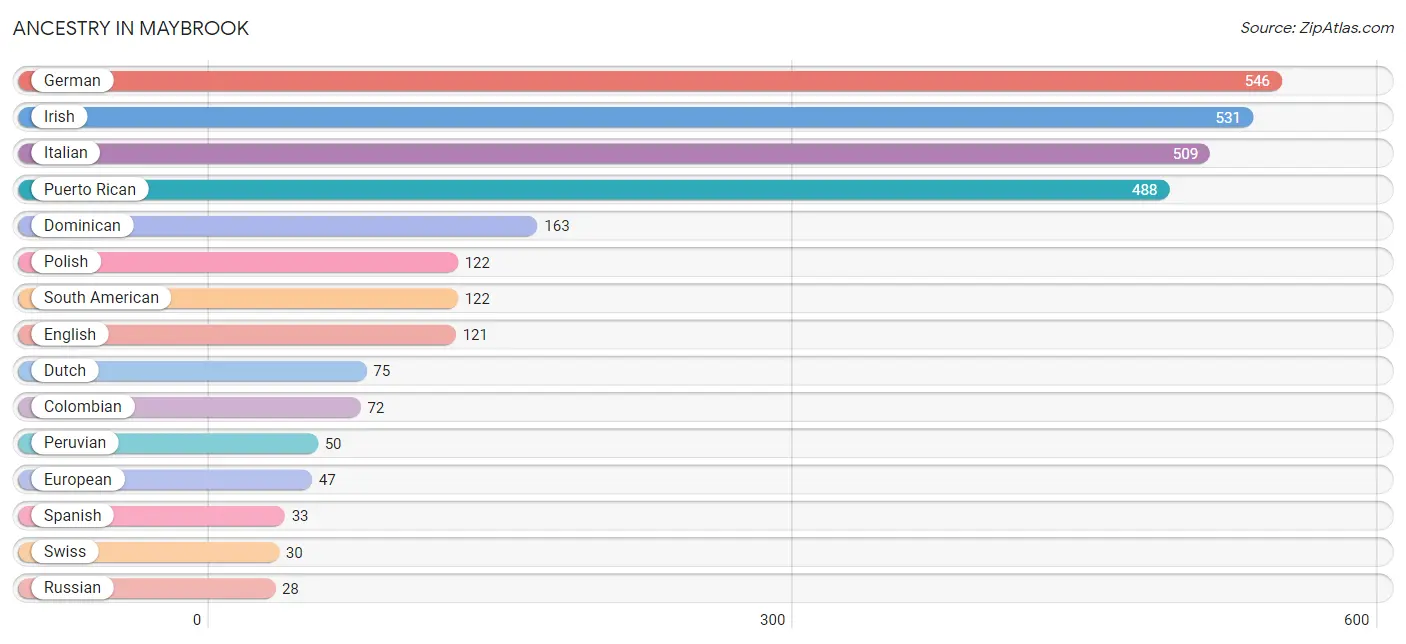
| Ancestry | # Population | % Population |
| African | 10 | 0.3% |
| American | 22 | 0.7% |
| British | 13 | 0.4% |
| Bulgarian | 12 | 0.4% |
| Central American | 19 | 0.6% |
| Colombian | 72 | 2.3% |
| Cree | 2 | 0.1% |
| Cuban | 9 | 0.3% |
| Czech | 16 | 0.5% |
| Dominican | 163 | 5.2% |
| Dutch | 75 | 2.4% |
| English | 121 | 3.9% |
| European | 47 | 1.5% |
| French | 22 | 0.7% |
| French Canadian | 15 | 0.5% |
| German | 546 | 17.4% |
| Honduran | 19 | 0.6% |
| Hungarian | 16 | 0.5% |
| Irish | 531 | 16.9% |
| Italian | 509 | 16.2% |
| Jamaican | 13 | 0.4% |
| Peruvian | 50 | 1.6% |
| Polish | 122 | 3.9% |
| Puerto Rican | 488 | 15.6% |
| Russian | 28 | 0.9% |
| Scandinavian | 25 | 0.8% |
| Scotch-Irish | 12 | 0.4% |
| Scottish | 20 | 0.6% |
| South American | 122 | 3.9% |
| Spaniard | 13 | 0.4% |
| Spanish | 33 | 1.1% |
| Sri Lankan | 9 | 0.3% |
| Subsaharan African | 10 | 0.3% |
| Swiss | 30 | 1.0% | View All 34 Rows |
Immigrants in Maybrook
The most numerous immigrant groups reported in Maybrook came from Latin America (388 | 12.4%), Caribbean (140 | 4.5%), Dominican Republic (127 | 4.1%), South America (127 | 4.1%), and Central America (121 | 3.9%), together accounting for 28.8% of all Maybrook residents.
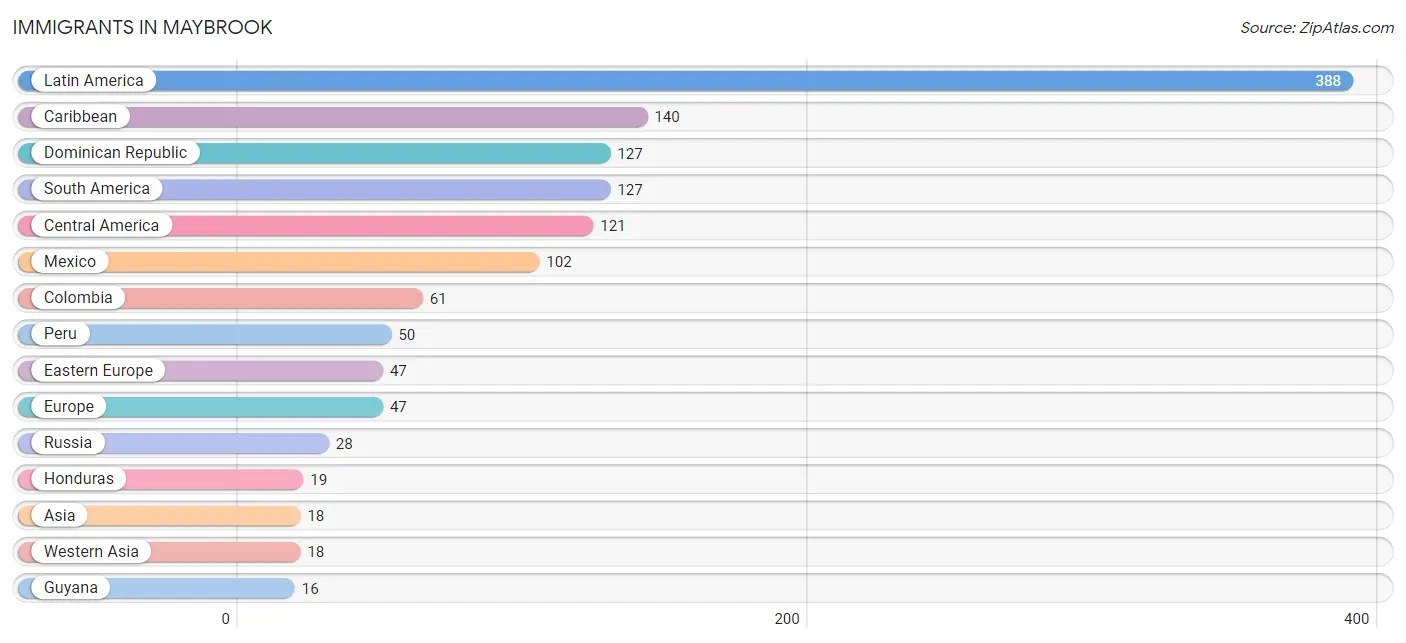
| Immigration Origin | # Population | % Population |
| Asia | 18 | 0.6% |
| Bulgaria | 12 | 0.4% |
| Caribbean | 140 | 4.5% |
| Central America | 121 | 3.9% |
| Colombia | 61 | 1.9% |
| Dominican Republic | 127 | 4.1% |
| Eastern Europe | 47 | 1.5% |
| Europe | 47 | 1.5% |
| Guyana | 16 | 0.5% |
| Honduras | 19 | 0.6% |
| Jamaica | 13 | 0.4% |
| Latin America | 388 | 12.4% |
| Mexico | 102 | 3.3% |
| Peru | 50 | 1.6% |
| Poland | 7 | 0.2% |
| Russia | 28 | 0.9% |
| South America | 127 | 4.1% |
| Western Asia | 18 | 0.6% | View All 18 Rows |
Sex and Age in Maybrook
Sex and Age in Maybrook
The most populous age groups in Maybrook are 50 to 54 Years (154 | 10.9%) for men and 55 to 59 Years (181 | 10.5%) for women.
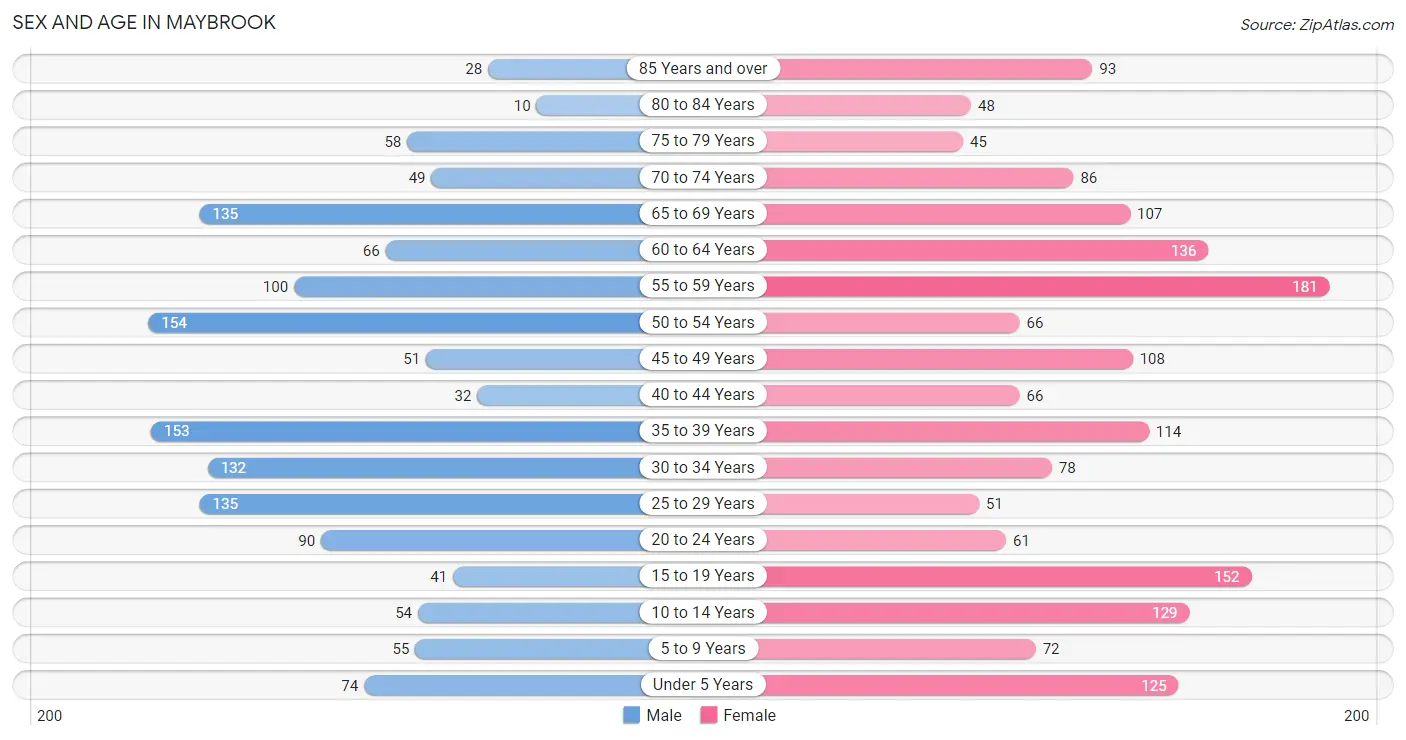
| Age Bracket | Male | Female |
| Under 5 Years | 74 (5.2%) | 125 (7.3%) |
| 5 to 9 Years | 55 (3.9%) | 72 (4.2%) |
| 10 to 14 Years | 54 (3.8%) | 129 (7.5%) |
| 15 to 19 Years | 41 (2.9%) | 152 (8.8%) |
| 20 to 24 Years | 90 (6.4%) | 61 (3.5%) |
| 25 to 29 Years | 135 (9.5%) | 51 (3.0%) |
| 30 to 34 Years | 132 (9.3%) | 78 (4.5%) |
| 35 to 39 Years | 153 (10.8%) | 114 (6.6%) |
| 40 to 44 Years | 32 (2.3%) | 66 (3.8%) |
| 45 to 49 Years | 51 (3.6%) | 108 (6.3%) |
| 50 to 54 Years | 154 (10.9%) | 66 (3.8%) |
| 55 to 59 Years | 100 (7.1%) | 181 (10.5%) |
| 60 to 64 Years | 66 (4.7%) | 136 (7.9%) |
| 65 to 69 Years | 135 (9.5%) | 107 (6.2%) |
| 70 to 74 Years | 49 (3.5%) | 86 (5.0%) |
| 75 to 79 Years | 58 (4.1%) | 45 (2.6%) |
| 80 to 84 Years | 10 (0.7%) | 48 (2.8%) |
| 85 Years and over | 28 (2.0%) | 93 (5.4%) |
| Total | 1,417 (100.0%) | 1,718 (100.0%) |
Families and Households in Maybrook
Median Family Size in Maybrook
The median family size in Maybrook is 3.11 persons per family, with single female/mother families (183 | 23.9%) accounting for the largest median family size of 3.43 persons per family. On the other hand, single male/father families (44 | 5.7%) represent the smallest median family size with 2.09 persons per family.
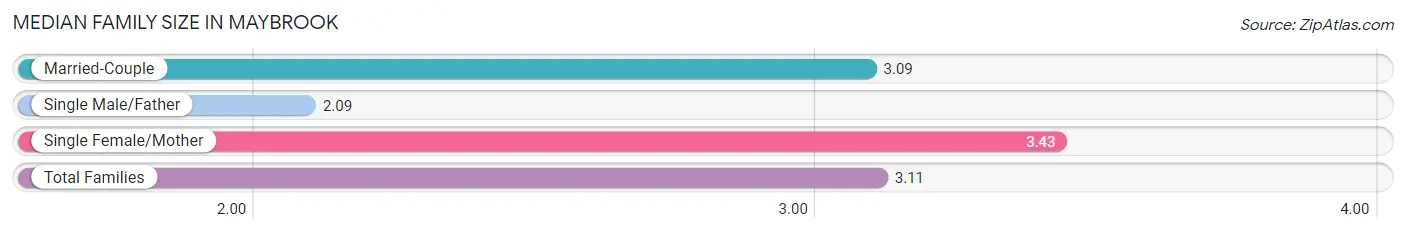
| Family Type | # Families | Family Size |
| Married-Couple | 539 (70.4%) | 3.09 |
| Single Male/Father | 44 (5.7%) | 2.09 |
| Single Female/Mother | 183 (23.9%) | 3.43 |
| Total Families | 766 (100.0%) | 3.11 |
Median Household Size in Maybrook
The median household size in Maybrook is 2.34 persons per household, with single female/mother households (183 | 13.7%) accounting for the largest median household size of 3.6 persons per household. non-family households (570 | 42.7%) represent the smallest median household size with 1.22 persons per household.
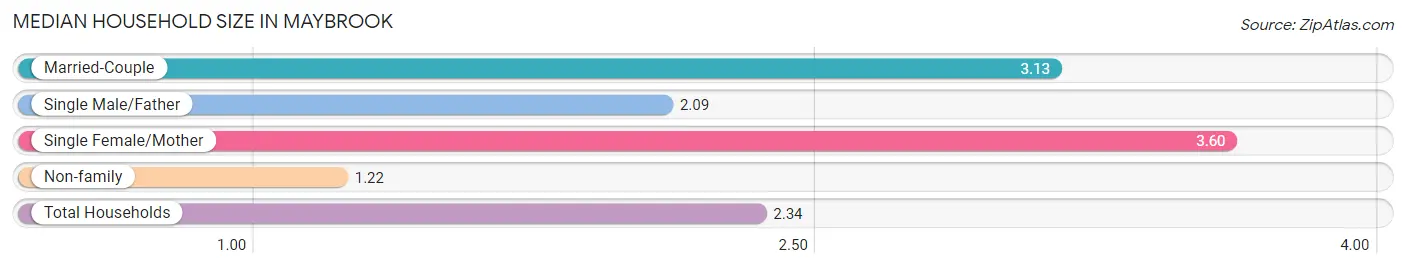
| Household Type | # Households | Household Size |
| Married-Couple | 539 (40.3%) | 3.13 |
| Single Male/Father | 44 (3.3%) | 2.09 |
| Single Female/Mother | 183 (13.7%) | 3.60 |
| Non-family | 570 (42.7%) | 1.22 |
| Total Households | 1,336 (100.0%) | 2.34 |
Household Size by Marriage Status in Maybrook
Out of a total of 1,336 households in Maybrook, 766 (57.3%) are family households, while 570 (42.7%) are nonfamily households. The most numerous type of family households are 2-person households, comprising 336, and the most common type of nonfamily households are 1-person households, comprising 471.
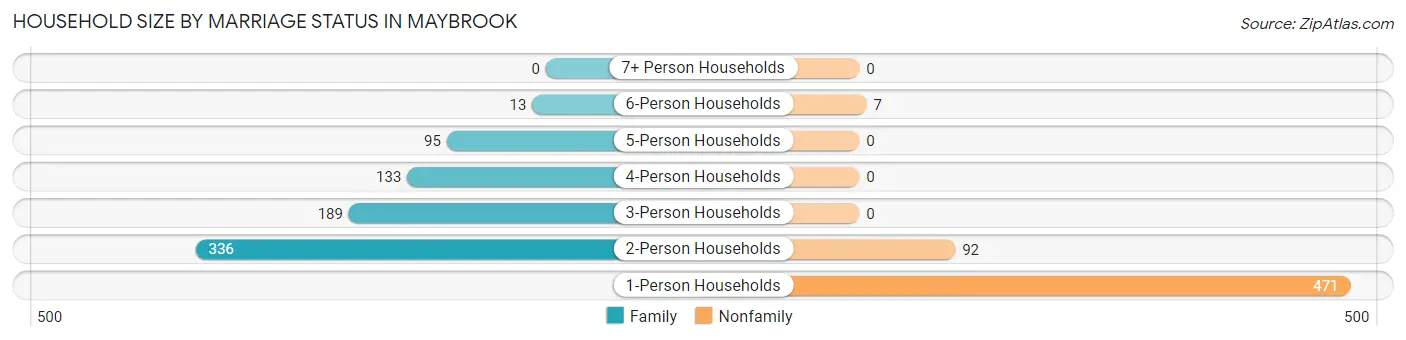
| Household Size | Family Households | Nonfamily Households |
| 1-Person Households | - | 471 (35.2%) |
| 2-Person Households | 336 (25.2%) | 92 (6.9%) |
| 3-Person Households | 189 (14.1%) | 0 (0.0%) |
| 4-Person Households | 133 (10.0%) | 0 (0.0%) |
| 5-Person Households | 95 (7.1%) | 0 (0.0%) |
| 6-Person Households | 13 (1.0%) | 7 (0.5%) |
| 7+ Person Households | 0 (0.0%) | 0 (0.0%) |
| Total | 766 (57.3%) | 570 (42.7%) |
Female Fertility in Maybrook
Fertility by Age in Maybrook
Average fertility rate in Maybrook is 44.0 births per 1,000 women. Women in the age bracket of 20 to 34 years have the highest fertility rate with 153.0 births per 1,000 women. Women in the age bracket of 20 to 34 years acount for 100.0% of all women with births.
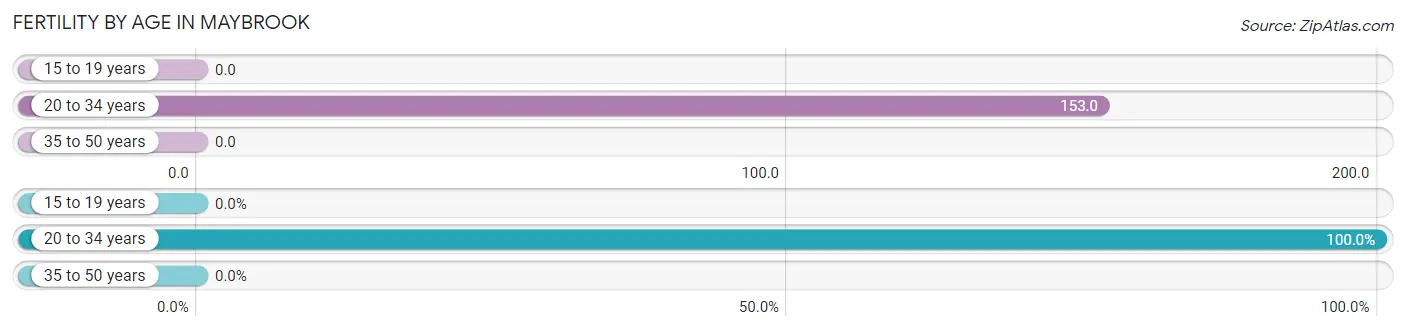
| Age Bracket | Women with Births | Births / 1,000 Women |
| 15 to 19 years | 0 (0.0%) | 0.0 |
| 20 to 34 years | 29 (100.0%) | 153.0 |
| 35 to 50 years | 0 (0.0%) | 0.0 |
| Total | 29 (100.0%) | 44.0 |
Fertility by Age by Marriage Status in Maybrook
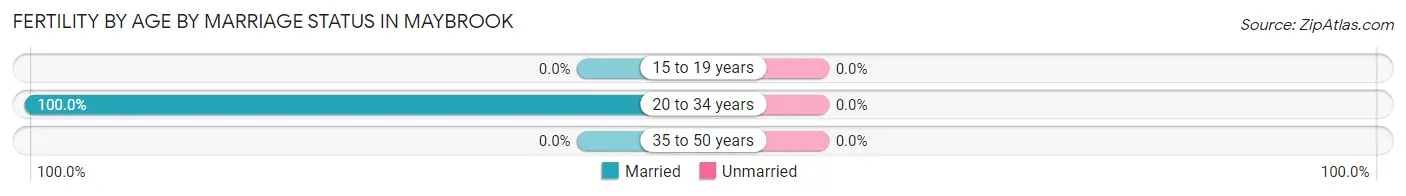
| Age Bracket | Married | Unmarried |
| 15 to 19 years | 0 (0.0%) | 0 (0.0%) |
| 20 to 34 years | 29 (100.0%) | 0 (0.0%) |
| 35 to 50 years | 0 (0.0%) | 0 (0.0%) |
| Total | 29 (100.0%) | 0 (0.0%) |
Fertility by Education in Maybrook
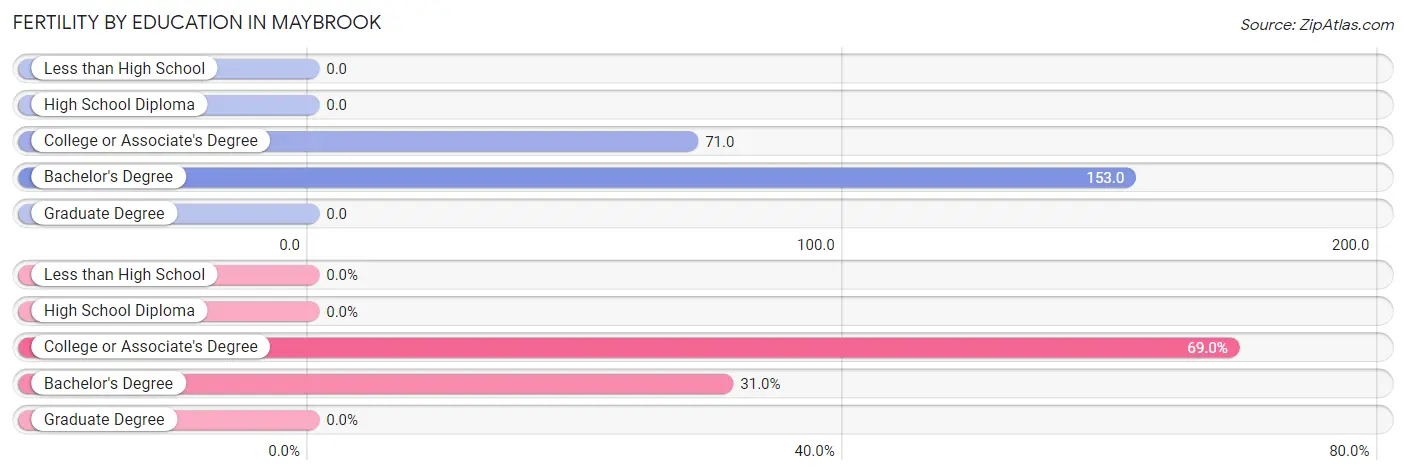
| Educational Attainment | Women with Births | Births / 1,000 Women |
| Less than High School | 0 (0.0%) | 0.0 |
| High School Diploma | 0 (0.0%) | 0.0 |
| College or Associate's Degree | 20 (69.0%) | 71.0 |
| Bachelor's Degree | 9 (31.0%) | 153.0 |
| Graduate Degree | 0 (0.0%) | 0.0 |
| Total | 29 (100.0%) | 44.0 |
Fertility by Education by Marriage Status in Maybrook
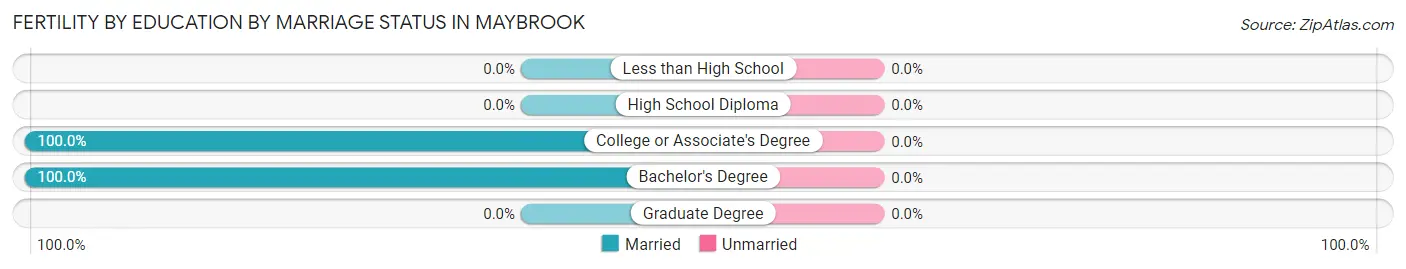
| Educational Attainment | Married | Unmarried |
| Less than High School | 0 (0.0%) | 0 (0.0%) |
| High School Diploma | 0 (0.0%) | 0 (0.0%) |
| College or Associate's Degree | 20 (100.0%) | 0 (0.0%) |
| Bachelor's Degree | 9 (100.0%) | 0 (0.0%) |
| Graduate Degree | 0 (0.0%) | 0 (0.0%) |
| Total | 29 (100.0%) | 0 (0.0%) |
Employment Characteristics in Maybrook
Employment by Class of Employer in Maybrook
Among the 1,630 employed individuals in Maybrook, private company employees (1,103 | 67.7%), local government employees (190 | 11.7%), and not-for-profit organizations (109 | 6.7%) make up the most common classes of employment.
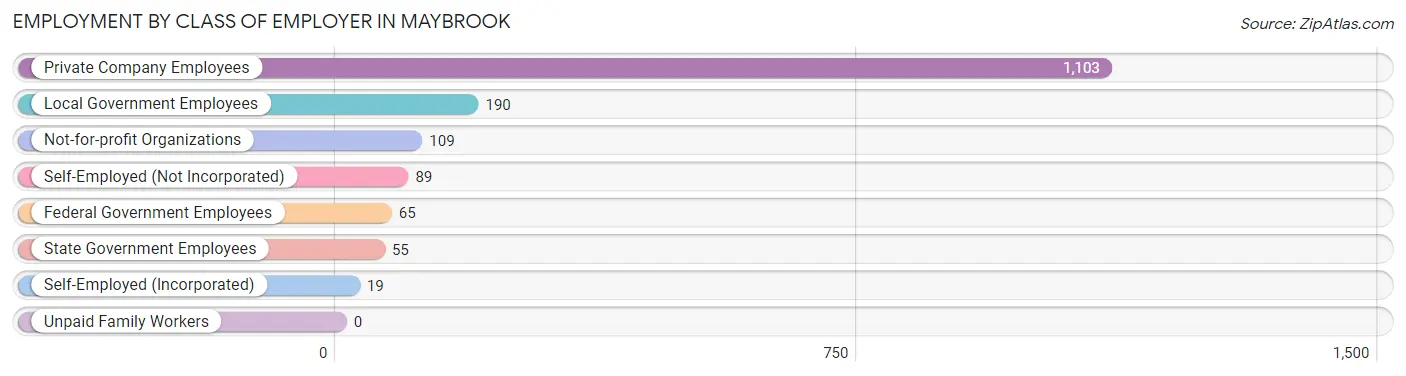
| Employer Class | # Employees | % Employees |
| Private Company Employees | 1,103 | 67.7% |
| Self-Employed (Incorporated) | 19 | 1.2% |
| Self-Employed (Not Incorporated) | 89 | 5.5% |
| Not-for-profit Organizations | 109 | 6.7% |
| Local Government Employees | 190 | 11.7% |
| State Government Employees | 55 | 3.4% |
| Federal Government Employees | 65 | 4.0% |
| Unpaid Family Workers | 0 | 0.0% |
| Total | 1,630 | 100.0% |
Employment Status by Age in Maybrook
According to the labor force statistics for Maybrook, out of the total population over 16 years of age (2,594), 66.3% or 1,720 individuals are in the labor force, with 4.2% or 72 of them unemployed. The age group with the highest labor force participation rate is 20 to 24 years, with 96.0% or 145 individuals in the labor force. Within the labor force, the 35 to 44 years age range has the highest percentage of unemployed individuals, with 13.1% or 39 of them being unemployed.
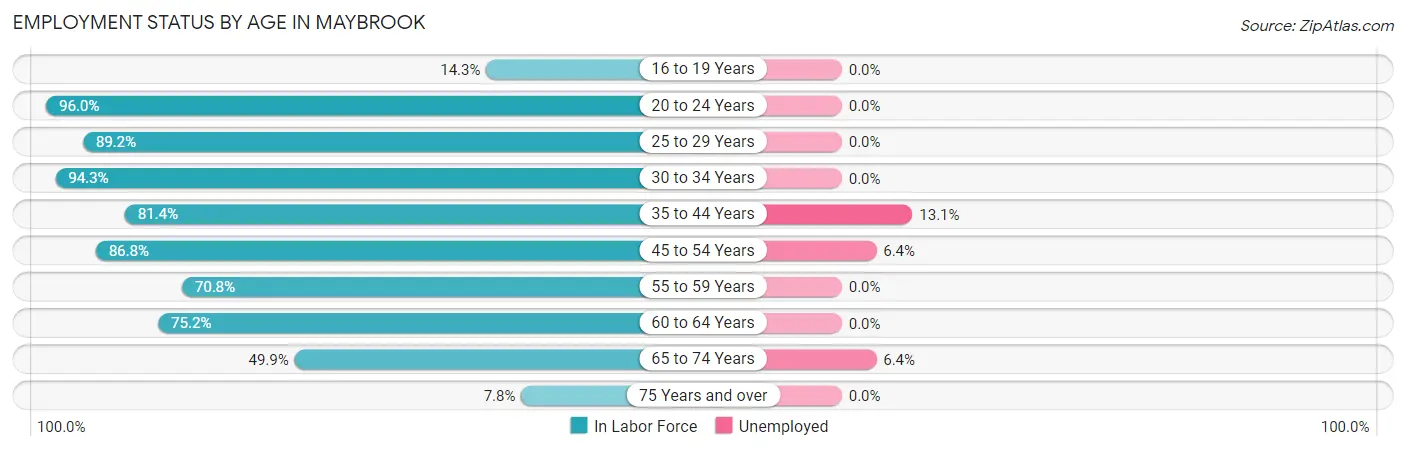
| Age Bracket | In Labor Force | Unemployed |
| 16 to 19 Years | 23 (14.3%) | 0 (0.0%) |
| 20 to 24 Years | 145 (96.0%) | 0 (0.0%) |
| 25 to 29 Years | 166 (89.2%) | 0 (0.0%) |
| 30 to 34 Years | 198 (94.3%) | 0 (0.0%) |
| 35 to 44 Years | 297 (81.4%) | 39 (13.1%) |
| 45 to 54 Years | 329 (86.8%) | 21 (6.4%) |
| 55 to 59 Years | 199 (70.8%) | 0 (0.0%) |
| 60 to 64 Years | 152 (75.2%) | 0 (0.0%) |
| 65 to 74 Years | 188 (49.9%) | 12 (6.4%) |
| 75 Years and over | 22 (7.8%) | 0 (0.0%) |
| Total | 1,720 (66.3%) | 72 (4.2%) |
Employment Status by Educational Attainment in Maybrook
According to labor force statistics for Maybrook, 82.6% of individuals (1,341) out of the total population between 25 and 64 years of age (1,623) are in the labor force, with 4.5% or 60 of them being unemployed. The group with the highest labor force participation rate are those with the educational attainment of high school diploma, with 87.2% or 475 individuals in the labor force. Within the labor force, individuals with high school diploma education have the highest percentage of unemployment, with 11.4% or 54 of them being unemployed.
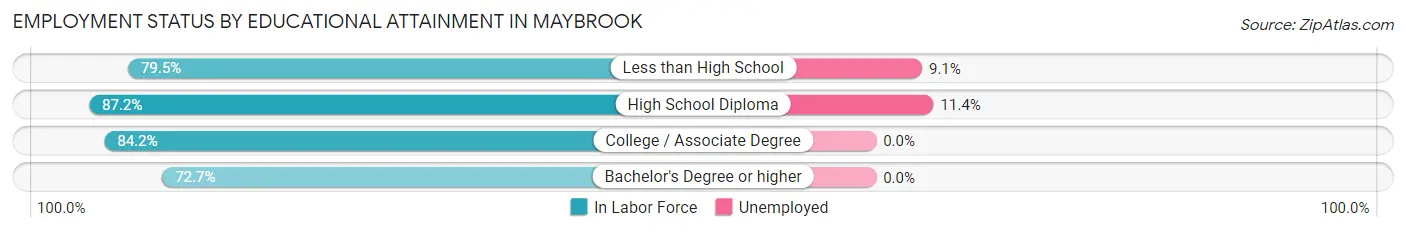
| Educational Attainment | In Labor Force | Unemployed |
| Less than High School | 66 (79.5%) | 8 (9.1%) |
| High School Diploma | 475 (87.2%) | 62 (11.4%) |
| College / Associate Degree | 563 (84.2%) | 0 (0.0%) |
| Bachelor's Degree or higher | 237 (72.7%) | 0 (0.0%) |
| Total | 1,341 (82.6%) | 73 (4.5%) |
Employment Occupations by Sex in Maybrook
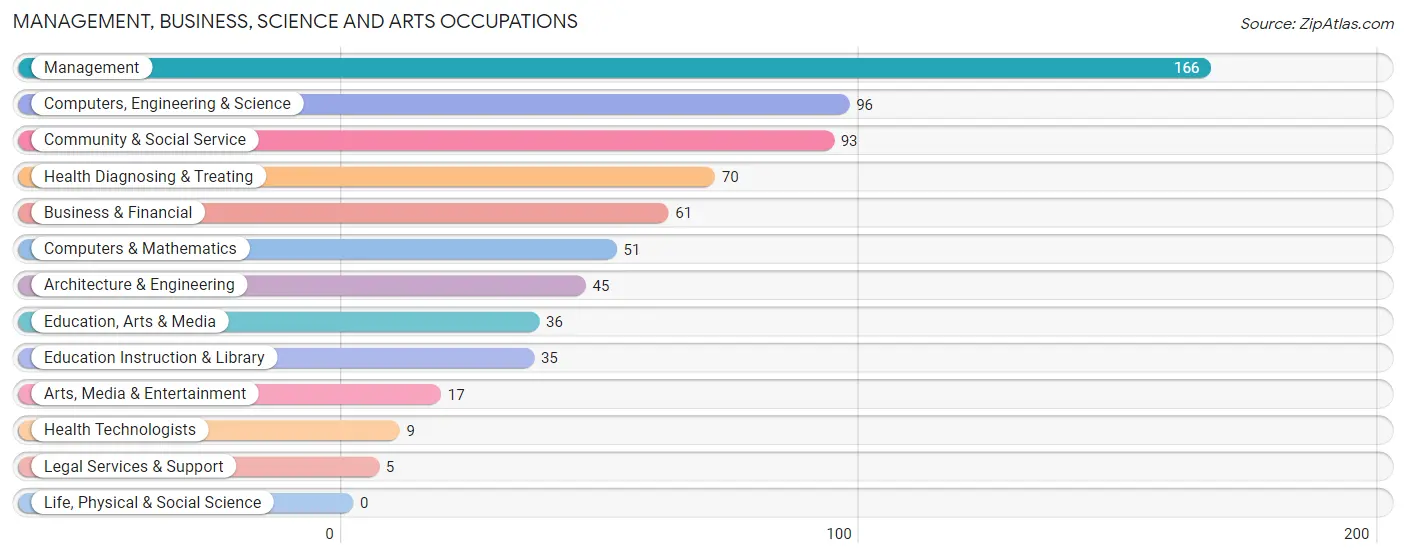
Management, Business, Science and Arts Occupations
The most common Management, Business, Science and Arts occupations in Maybrook are Management (166 | 10.1%), Computers, Engineering & Science (96 | 5.8%), Community & Social Service (93 | 5.7%), Health Diagnosing & Treating (70 | 4.3%), and Business & Financial (61 | 3.7%).
Management, Business, Science and Arts Occupations by Sex
Within the Management, Business, Science and Arts occupations in Maybrook, the most male-oriented occupations are Computers, Engineering & Science (100.0%), Computers & Mathematics (100.0%), and Architecture & Engineering (100.0%), while the most female-oriented occupations are Business & Financial (100.0%), Health Technologists (100.0%), and Education Instruction & Library (82.9%).
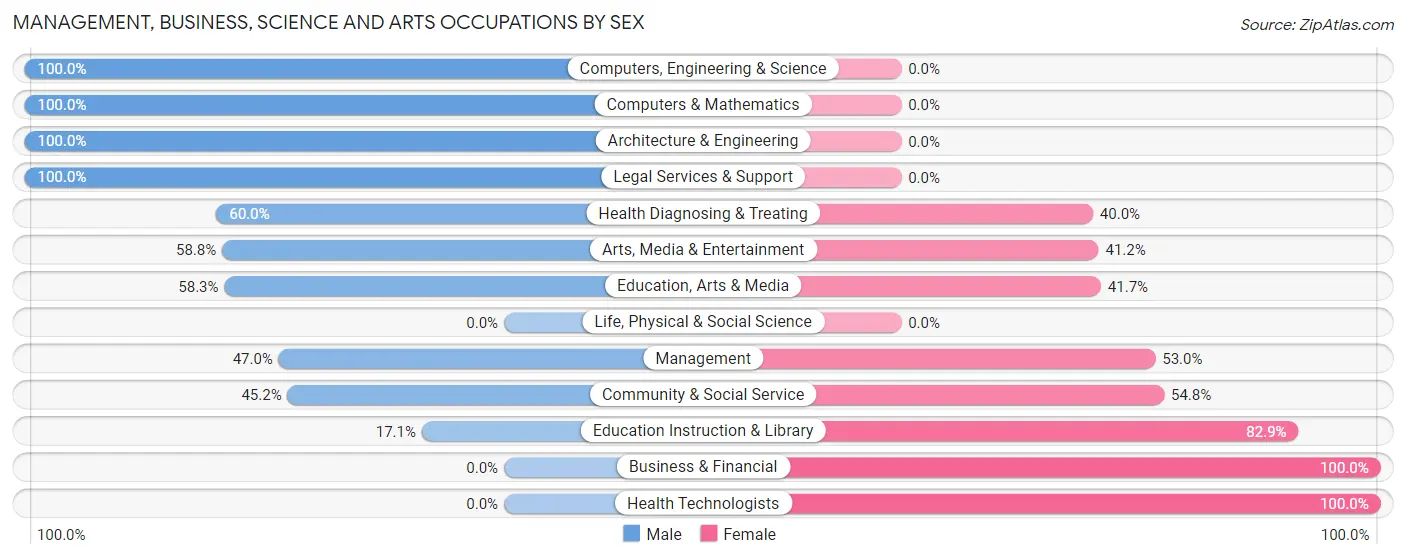
| Occupation | Male | Female |
| Management | 78 (47.0%) | 88 (53.0%) |
| Business & Financial | 0 (0.0%) | 61 (100.0%) |
| Computers, Engineering & Science | 96 (100.0%) | 0 (0.0%) |
| Computers & Mathematics | 51 (100.0%) | 0 (0.0%) |
| Architecture & Engineering | 45 (100.0%) | 0 (0.0%) |
| Life, Physical & Social Science | 0 (0.0%) | 0 (0.0%) |
| Community & Social Service | 42 (45.2%) | 51 (54.8%) |
| Education, Arts & Media | 21 (58.3%) | 15 (41.7%) |
| Legal Services & Support | 5 (100.0%) | 0 (0.0%) |
| Education Instruction & Library | 6 (17.1%) | 29 (82.9%) |
| Arts, Media & Entertainment | 10 (58.8%) | 7 (41.2%) |
| Health Diagnosing & Treating | 42 (60.0%) | 28 (40.0%) |
| Health Technologists | 0 (0.0%) | 9 (100.0%) |
| Total (Category) | 258 (53.1%) | 228 (46.9%) |
| Total (Overall) | 924 (56.1%) | 723 (43.9%) |
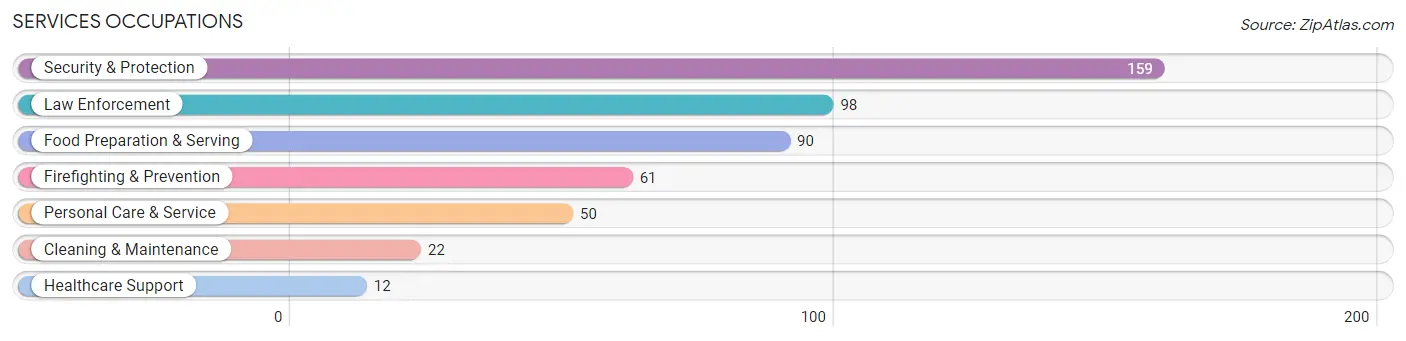
Services Occupations
The most common Services occupations in Maybrook are Security & Protection (159 | 9.7%), Law Enforcement (98 | 5.9%), Food Preparation & Serving (90 | 5.5%), Firefighting & Prevention (61 | 3.7%), and Personal Care & Service (50 | 3.0%).
Services Occupations by Sex
Within the Services occupations in Maybrook, the most male-oriented occupations are Law Enforcement (100.0%), Cleaning & Maintenance (100.0%), and Food Preparation & Serving (68.9%), while the most female-oriented occupations are Personal Care & Service (100.0%), Firefighting & Prevention (86.9%), and Healthcare Support (50.0%).
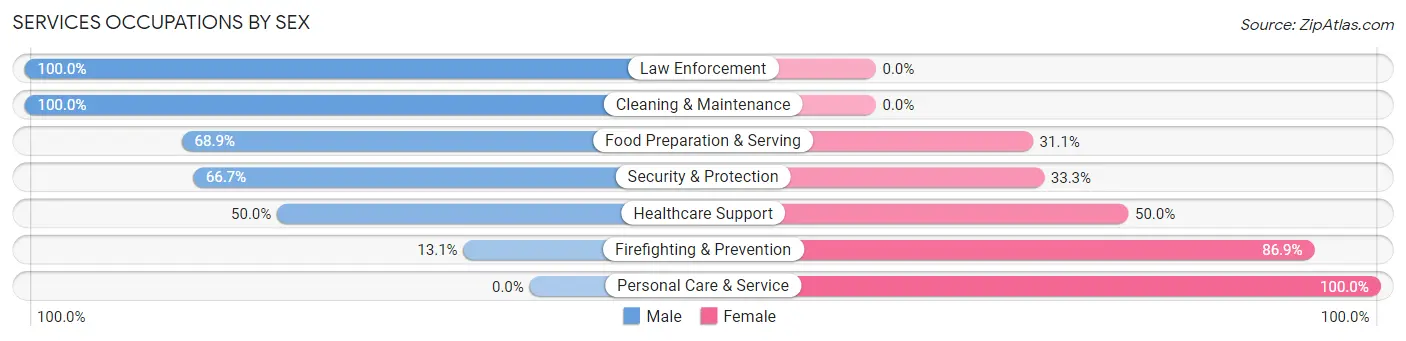
| Occupation | Male | Female |
| Healthcare Support | 6 (50.0%) | 6 (50.0%) |
| Security & Protection | 106 (66.7%) | 53 (33.3%) |
| Firefighting & Prevention | 8 (13.1%) | 53 (86.9%) |
| Law Enforcement | 98 (100.0%) | 0 (0.0%) |
| Food Preparation & Serving | 62 (68.9%) | 28 (31.1%) |
| Cleaning & Maintenance | 22 (100.0%) | 0 (0.0%) |
| Personal Care & Service | 0 (0.0%) | 50 (100.0%) |
| Total (Category) | 196 (58.9%) | 137 (41.1%) |
| Total (Overall) | 924 (56.1%) | 723 (43.9%) |
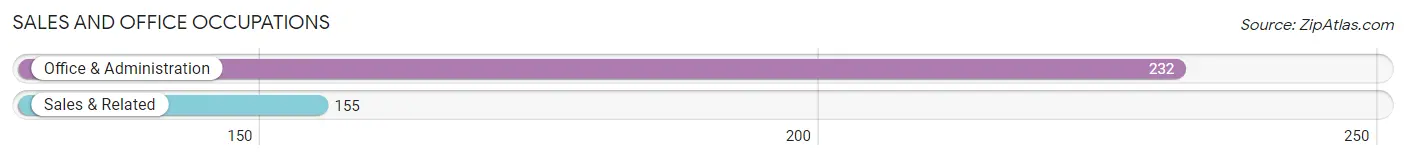
Sales and Office Occupations
The most common Sales and Office occupations in Maybrook are Office & Administration (232 | 14.1%), and Sales & Related (155 | 9.4%).
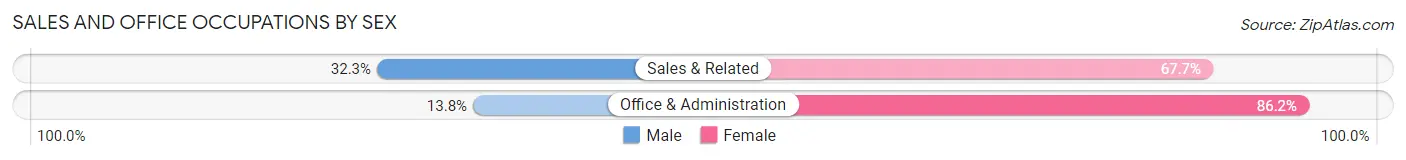
Sales and Office Occupations by Sex
| Occupation | Male | Female |
| Sales & Related | 50 (32.3%) | 105 (67.7%) |
| Office & Administration | 32 (13.8%) | 200 (86.2%) |
| Total (Category) | 82 (21.2%) | 305 (78.8%) |
| Total (Overall) | 924 (56.1%) | 723 (43.9%) |
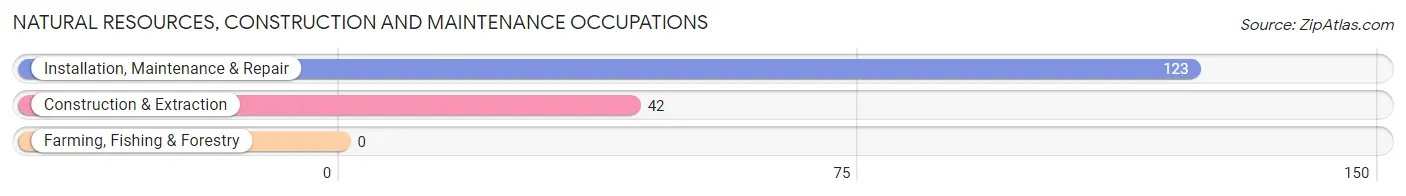
Natural Resources, Construction and Maintenance Occupations
The most common Natural Resources, Construction and Maintenance occupations in Maybrook are Installation, Maintenance & Repair (123 | 7.5%), and Construction & Extraction (42 | 2.5%).
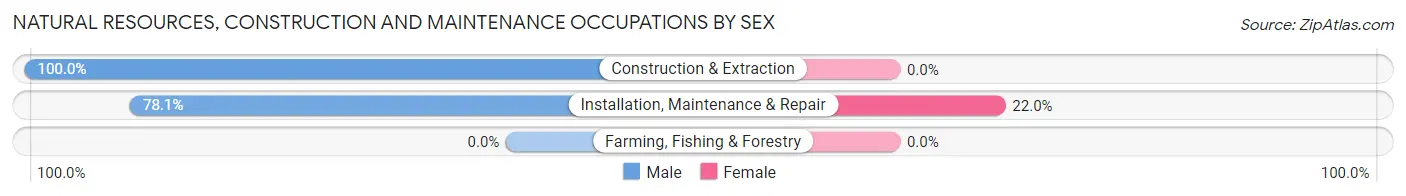
Natural Resources, Construction and Maintenance Occupations by Sex
| Occupation | Male | Female |
| Farming, Fishing & Forestry | 0 (0.0%) | 0 (0.0%) |
| Construction & Extraction | 42 (100.0%) | 0 (0.0%) |
| Installation, Maintenance & Repair | 96 (78.0%) | 27 (22.0%) |
| Total (Category) | 138 (83.6%) | 27 (16.4%) |
| Total (Overall) | 924 (56.1%) | 723 (43.9%) |
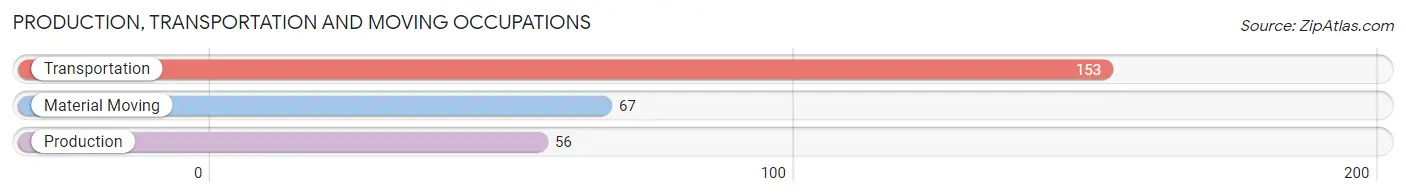
Production, Transportation and Moving Occupations
The most common Production, Transportation and Moving occupations in Maybrook are Transportation (153 | 9.3%), Material Moving (67 | 4.1%), and Production (56 | 3.4%).
Production, Transportation and Moving Occupations by Sex
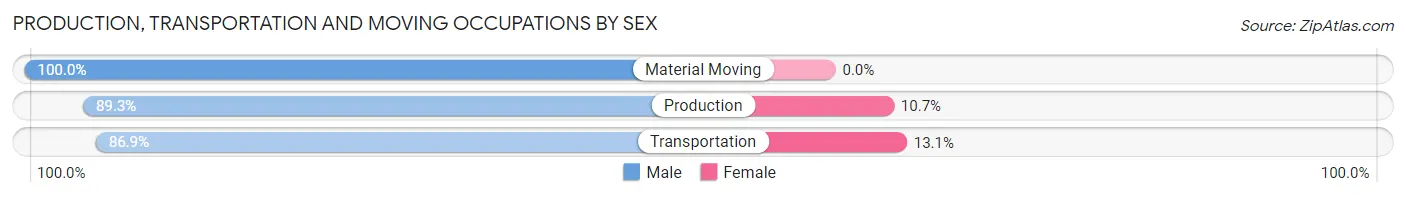
| Occupation | Male | Female |
| Production | 50 (89.3%) | 6 (10.7%) |
| Transportation | 133 (86.9%) | 20 (13.1%) |
| Material Moving | 67 (100.0%) | 0 (0.0%) |
| Total (Category) | 250 (90.6%) | 26 (9.4%) |
| Total (Overall) | 924 (56.1%) | 723 (43.9%) |
Employment Industries by Sex in Maybrook
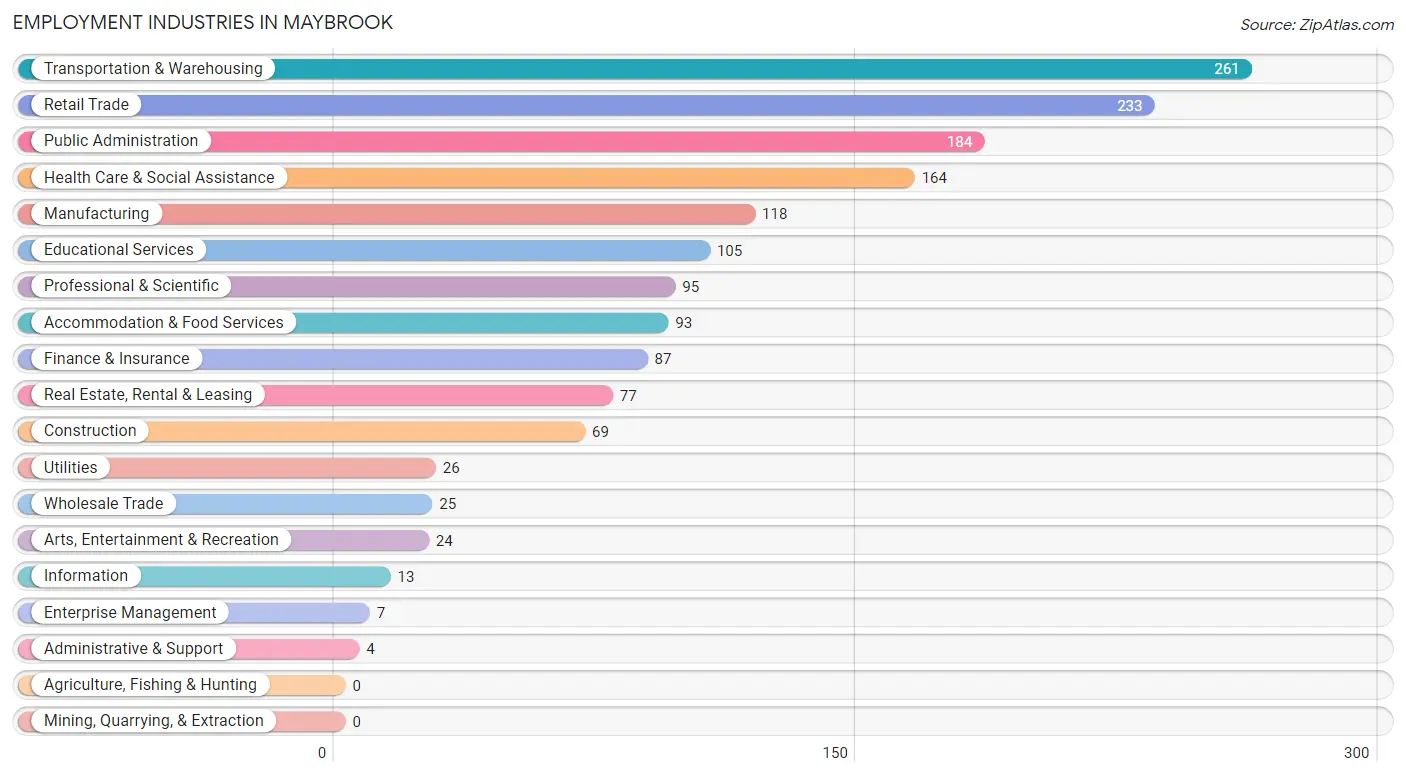
Employment Industries in Maybrook
The major employment industries in Maybrook include Transportation & Warehousing (261 | 15.9%), Retail Trade (233 | 14.1%), Public Administration (184 | 11.2%), Health Care & Social Assistance (164 | 10.0%), and Manufacturing (118 | 7.2%).
Employment Industries by Sex in Maybrook
The Maybrook industries that see more men than women are Construction (100.0%), Wholesale Trade (100.0%), and Utilities (100.0%), whereas the industries that tend to have a higher number of women are Information (100.0%), Enterprise Management (100.0%), and Administrative & Support (100.0%).
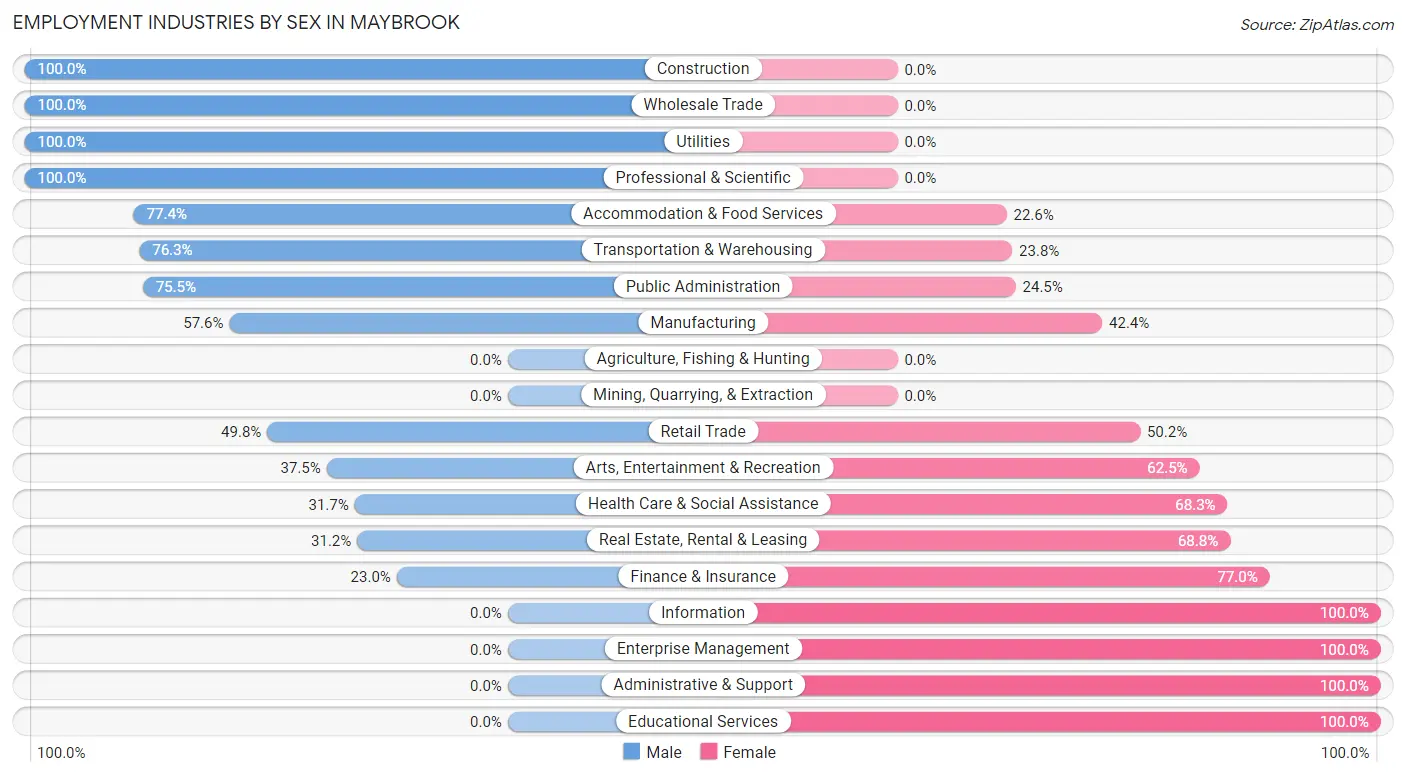
| Industry | Male | Female |
| Agriculture, Fishing & Hunting | 0 (0.0%) | 0 (0.0%) |
| Mining, Quarrying, & Extraction | 0 (0.0%) | 0 (0.0%) |
| Construction | 69 (100.0%) | 0 (0.0%) |
| Manufacturing | 68 (57.6%) | 50 (42.4%) |
| Wholesale Trade | 25 (100.0%) | 0 (0.0%) |
| Retail Trade | 116 (49.8%) | 117 (50.2%) |
| Transportation & Warehousing | 199 (76.2%) | 62 (23.7%) |
| Utilities | 26 (100.0%) | 0 (0.0%) |
| Information | 0 (0.0%) | 13 (100.0%) |
| Finance & Insurance | 20 (23.0%) | 67 (77.0%) |
| Real Estate, Rental & Leasing | 24 (31.2%) | 53 (68.8%) |
| Professional & Scientific | 95 (100.0%) | 0 (0.0%) |
| Enterprise Management | 0 (0.0%) | 7 (100.0%) |
| Administrative & Support | 0 (0.0%) | 4 (100.0%) |
| Educational Services | 0 (0.0%) | 105 (100.0%) |
| Health Care & Social Assistance | 52 (31.7%) | 112 (68.3%) |
| Arts, Entertainment & Recreation | 9 (37.5%) | 15 (62.5%) |
| Accommodation & Food Services | 72 (77.4%) | 21 (22.6%) |
| Public Administration | 139 (75.5%) | 45 (24.5%) |
| Total | 924 (56.1%) | 723 (43.9%) |
Education in Maybrook
School Enrollment in Maybrook
The most common levels of schooling among the 742 students in Maybrook are college / undergraduate (251 | 33.8%), high school (179 | 24.1%), and middle school (104 | 14.0%).
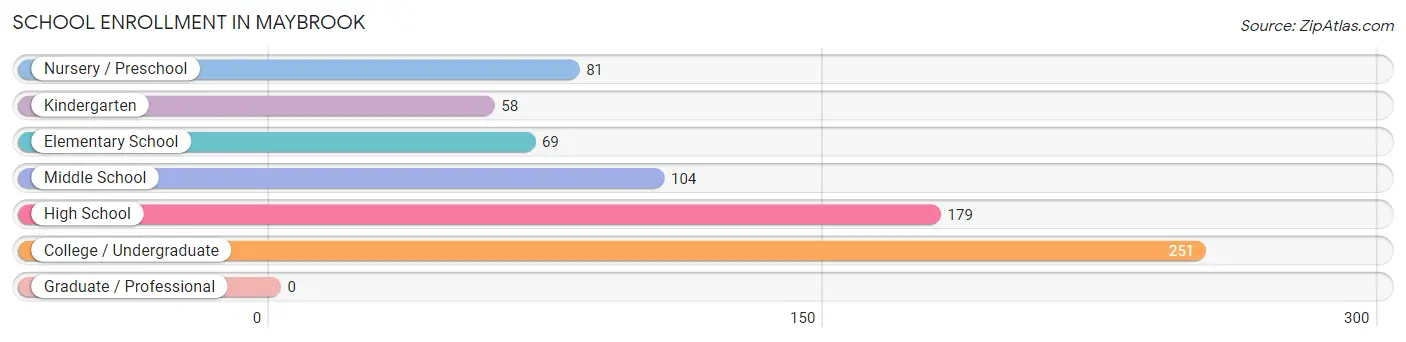
| School Level | # Students | % Students |
| Nursery / Preschool | 81 | 10.9% |
| Kindergarten | 58 | 7.8% |
| Elementary School | 69 | 9.3% |
| Middle School | 104 | 14.0% |
| High School | 179 | 24.1% |
| College / Undergraduate | 251 | 33.8% |
| Graduate / Professional | 0 | 0.0% |
| Total | 742 | 100.0% |
School Enrollment by Age by Funding Source in Maybrook
Out of a total of 742 students who are enrolled in schools in Maybrook, 111 (15.0%) attend a private institution, while the remaining 631 (85.0%) are enrolled in public schools. The age group of 3 to 4 year olds has the highest likelihood of being enrolled in private schools, with 81 (100.0% in the age bracket) enrolled. Conversely, the age group of 5 to 9 year old has the lowest likelihood of being enrolled in a private school, with 127 (100.0% in the age bracket) attending a public institution.
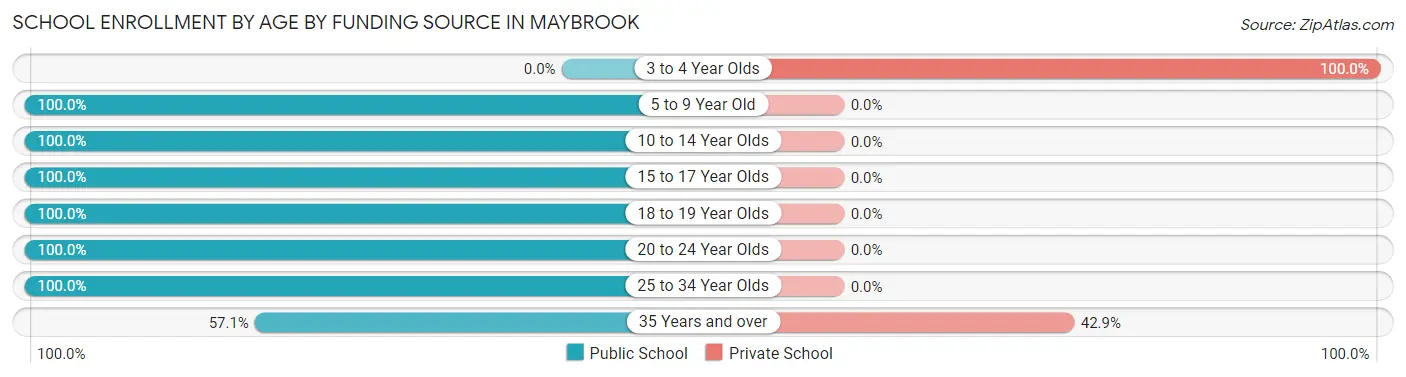
| Age Bracket | Public School | Private School |
| 3 to 4 Year Olds | 0 (0.0%) | 81 (100.0%) |
| 5 to 9 Year Old | 127 (100.0%) | 0 (0.0%) |
| 10 to 14 Year Olds | 183 (100.0%) | 0 (0.0%) |
| 15 to 17 Year Olds | 78 (100.0%) | 0 (0.0%) |
| 18 to 19 Year Olds | 100 (100.0%) | 0 (0.0%) |
| 20 to 24 Year Olds | 89 (100.0%) | 0 (0.0%) |
| 25 to 34 Year Olds | 14 (100.0%) | 0 (0.0%) |
| 35 Years and over | 40 (57.1%) | 30 (42.9%) |
| Total | 631 (85.0%) | 111 (15.0%) |
Educational Attainment by Field of Study in Maybrook
Business (85 | 19.7%), education (68 | 15.8%), science & technology (47 | 10.9%), engineering (46 | 10.7%), and visual & performing arts (32 | 7.4%) are the most common fields of study among 431 individuals in Maybrook who have obtained a bachelor's degree or higher.
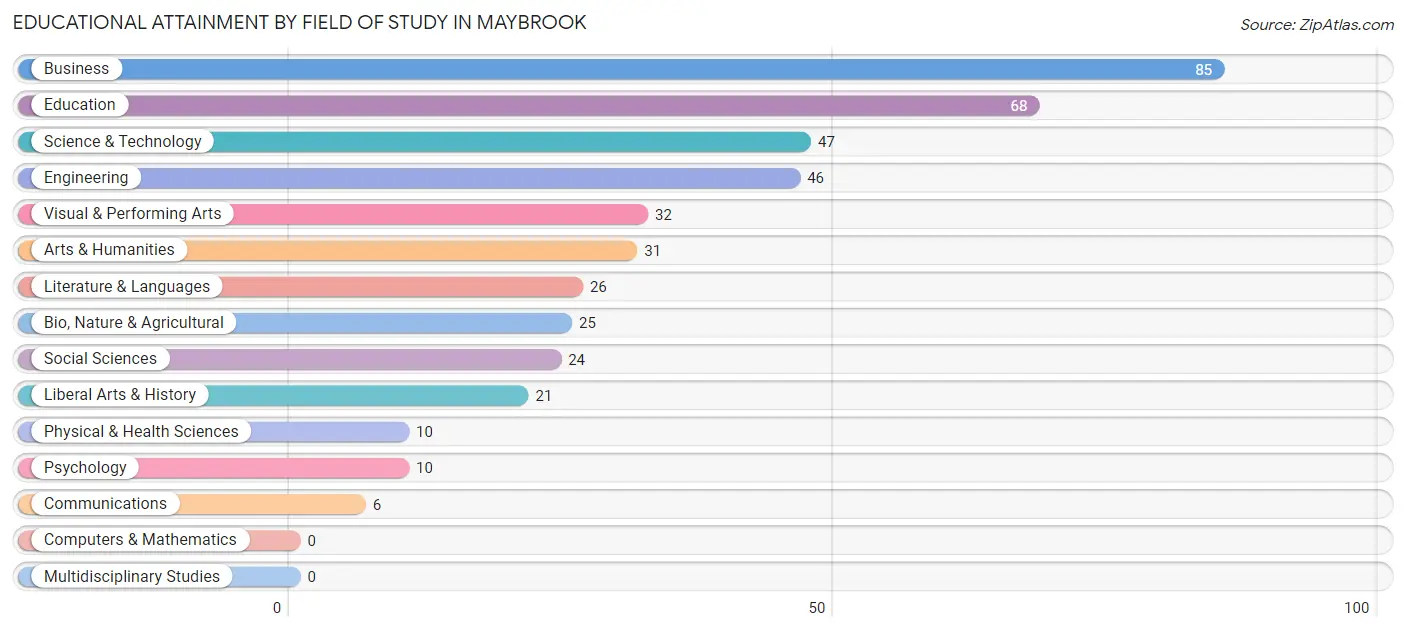
| Field of Study | # Graduates | % Graduates |
| Computers & Mathematics | 0 | 0.0% |
| Bio, Nature & Agricultural | 25 | 5.8% |
| Physical & Health Sciences | 10 | 2.3% |
| Psychology | 10 | 2.3% |
| Social Sciences | 24 | 5.6% |
| Engineering | 46 | 10.7% |
| Multidisciplinary Studies | 0 | 0.0% |
| Science & Technology | 47 | 10.9% |
| Business | 85 | 19.7% |
| Education | 68 | 15.8% |
| Literature & Languages | 26 | 6.0% |
| Liberal Arts & History | 21 | 4.9% |
| Visual & Performing Arts | 32 | 7.4% |
| Communications | 6 | 1.4% |
| Arts & Humanities | 31 | 7.2% |
| Total | 431 | 100.0% |
Transportation & Commute in Maybrook
Vehicle Availability by Sex in Maybrook
The most prevalent vehicle ownership categories in Maybrook are males with 1 vehicle (330, accounting for 35.9%) and females with 1 vehicle (193, making up 46.5%).
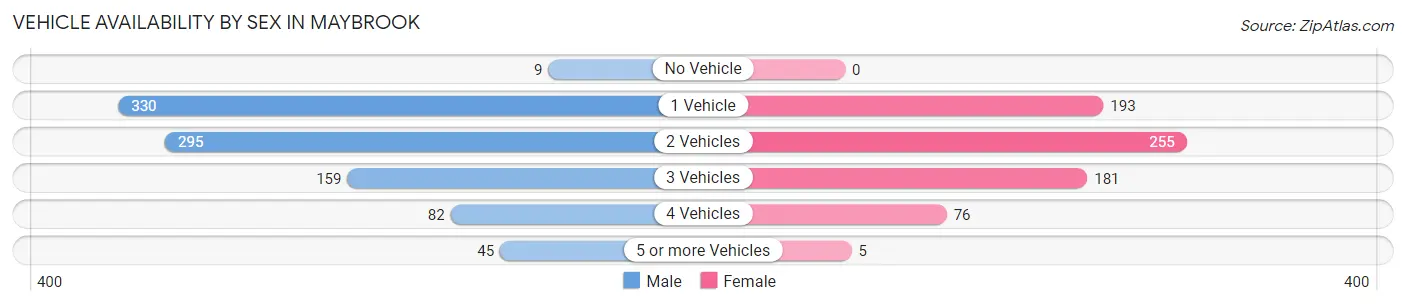
| Vehicles Available | Male | Female |
| No Vehicle | 9 (1.0%) | 0 (0.0%) |
| 1 Vehicle | 330 (35.9%) | 193 (27.2%) |
| 2 Vehicles | 295 (32.1%) | 255 (35.9%) |
| 3 Vehicles | 159 (17.3%) | 181 (25.5%) |
| 4 Vehicles | 82 (8.9%) | 76 (10.7%) |
| 5 or more Vehicles | 45 (4.9%) | 5 (0.7%) |
| Total | 920 (100.0%) | 710 (100.0%) |
Commute Time in Maybrook
The most frequently occuring commute durations in Maybrook are 15 to 19 minutes (242 commuters, 16.1%), 25 to 29 minutes (232 commuters, 15.4%), and 90 or more minutes (188 commuters, 12.5%).
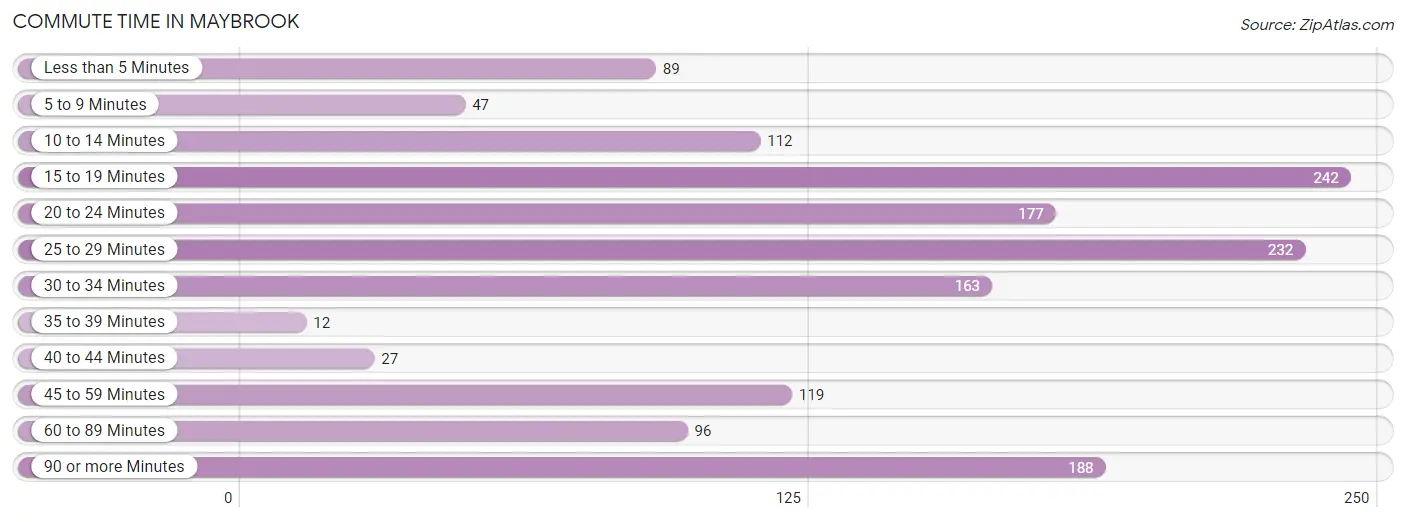
| Commute Time | # Commuters | % Commuters |
| Less than 5 Minutes | 89 | 5.9% |
| 5 to 9 Minutes | 47 | 3.1% |
| 10 to 14 Minutes | 112 | 7.4% |
| 15 to 19 Minutes | 242 | 16.1% |
| 20 to 24 Minutes | 177 | 11.8% |
| 25 to 29 Minutes | 232 | 15.4% |
| 30 to 34 Minutes | 163 | 10.8% |
| 35 to 39 Minutes | 12 | 0.8% |
| 40 to 44 Minutes | 27 | 1.8% |
| 45 to 59 Minutes | 119 | 7.9% |
| 60 to 89 Minutes | 96 | 6.4% |
| 90 or more Minutes | 188 | 12.5% |
Commute Time by Sex in Maybrook
The most common commute times in Maybrook are 90 or more minutes (188 commuters, 20.8%) for males and 30 to 34 minutes (98 commuters, 16.3%) for females.
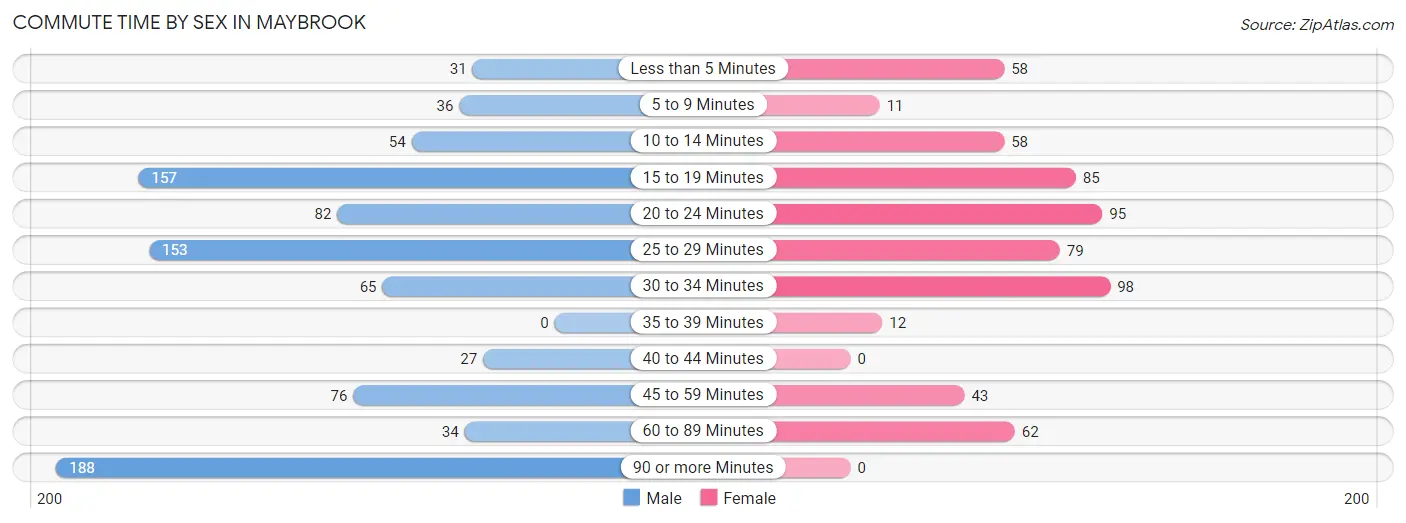
| Commute Time | Male | Female |
| Less than 5 Minutes | 31 (3.4%) | 58 (9.7%) |
| 5 to 9 Minutes | 36 (4.0%) | 11 (1.8%) |
| 10 to 14 Minutes | 54 (6.0%) | 58 (9.7%) |
| 15 to 19 Minutes | 157 (17.4%) | 85 (14.1%) |
| 20 to 24 Minutes | 82 (9.1%) | 95 (15.8%) |
| 25 to 29 Minutes | 153 (16.9%) | 79 (13.1%) |
| 30 to 34 Minutes | 65 (7.2%) | 98 (16.3%) |
| 35 to 39 Minutes | 0 (0.0%) | 12 (2.0%) |
| 40 to 44 Minutes | 27 (3.0%) | 0 (0.0%) |
| 45 to 59 Minutes | 76 (8.4%) | 43 (7.1%) |
| 60 to 89 Minutes | 34 (3.8%) | 62 (10.3%) |
| 90 or more Minutes | 188 (20.8%) | 0 (0.0%) |
Time of Departure to Work by Sex in Maybrook
The most frequent times of departure to work in Maybrook are 7:00 AM to 7:29 AM (179, 19.8%) for males and 8:00 AM to 8:29 AM (99, 16.5%) for females.
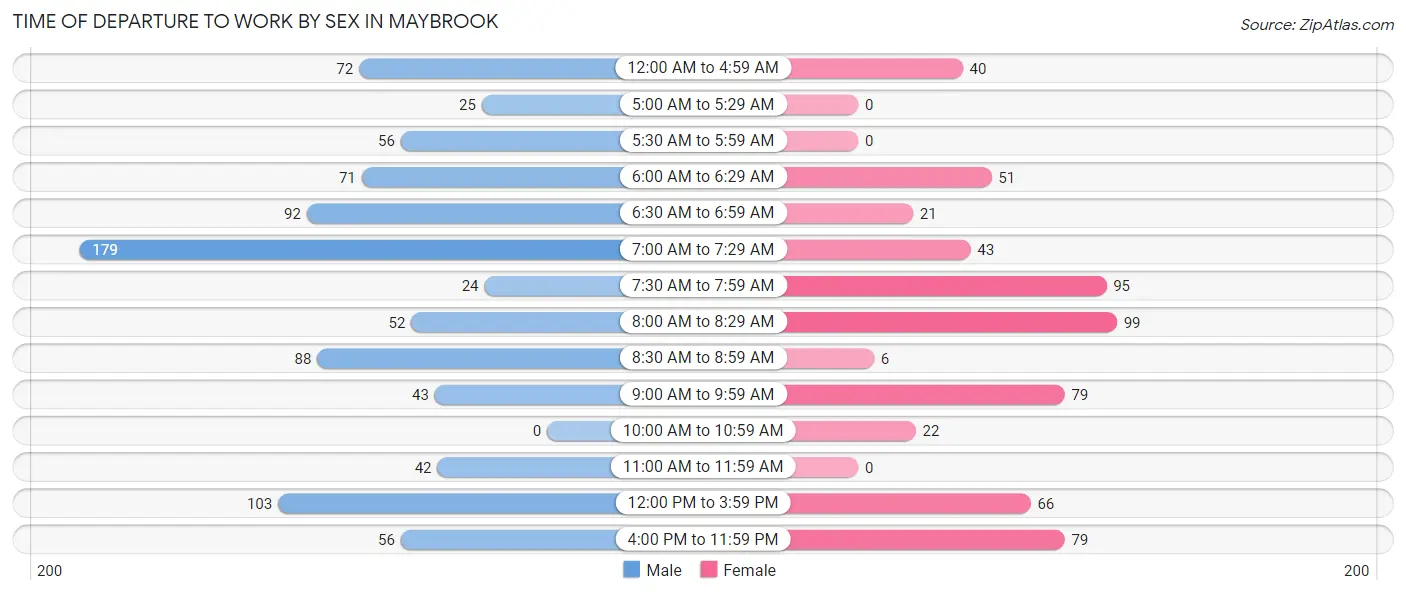
| Time of Departure | Male | Female |
| 12:00 AM to 4:59 AM | 72 (8.0%) | 40 (6.7%) |
| 5:00 AM to 5:29 AM | 25 (2.8%) | 0 (0.0%) |
| 5:30 AM to 5:59 AM | 56 (6.2%) | 0 (0.0%) |
| 6:00 AM to 6:29 AM | 71 (7.9%) | 51 (8.5%) |
| 6:30 AM to 6:59 AM | 92 (10.2%) | 21 (3.5%) |
| 7:00 AM to 7:29 AM | 179 (19.8%) | 43 (7.1%) |
| 7:30 AM to 7:59 AM | 24 (2.7%) | 95 (15.8%) |
| 8:00 AM to 8:29 AM | 52 (5.8%) | 99 (16.5%) |
| 8:30 AM to 8:59 AM | 88 (9.8%) | 6 (1.0%) |
| 9:00 AM to 9:59 AM | 43 (4.8%) | 79 (13.1%) |
| 10:00 AM to 10:59 AM | 0 (0.0%) | 22 (3.7%) |
| 11:00 AM to 11:59 AM | 42 (4.6%) | 0 (0.0%) |
| 12:00 PM to 3:59 PM | 103 (11.4%) | 66 (11.0%) |
| 4:00 PM to 11:59 PM | 56 (6.2%) | 79 (13.1%) |
| Total | 903 (100.0%) | 601 (100.0%) |
Housing Occupancy in Maybrook
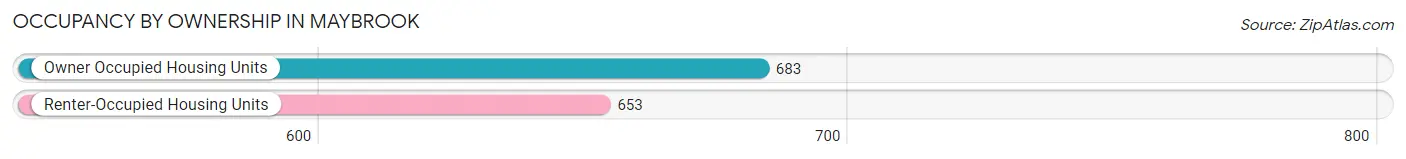
Occupancy by Ownership in Maybrook
Of the total 1,336 dwellings in Maybrook, owner-occupied units account for 683 (51.1%), while renter-occupied units make up 653 (48.9%).
| Occupancy | # Housing Units | % Housing Units |
| Owner Occupied Housing Units | 683 | 51.1% |
| Renter-Occupied Housing Units | 653 | 48.9% |
| Total Occupied Housing Units | 1,336 | 100.0% |
Occupancy by Household Size in Maybrook
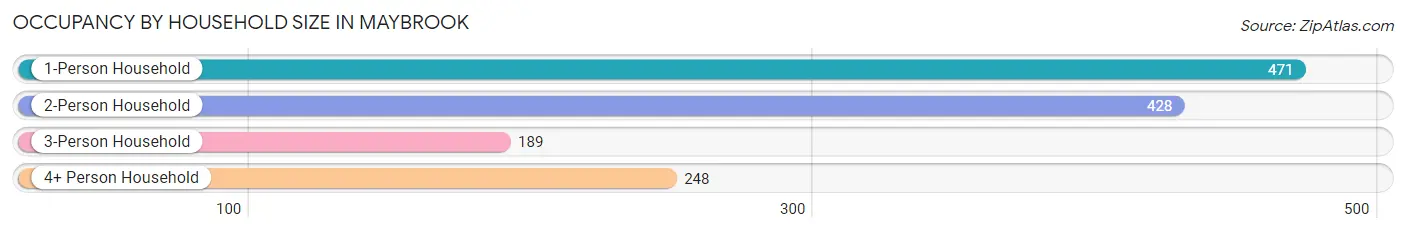
| Household Size | # Housing Units | % Housing Units |
| 1-Person Household | 471 | 35.2% |
| 2-Person Household | 428 | 32.0% |
| 3-Person Household | 189 | 14.1% |
| 4+ Person Household | 248 | 18.6% |
| Total Housing Units | 1,336 | 100.0% |
Occupancy by Ownership by Household Size in Maybrook
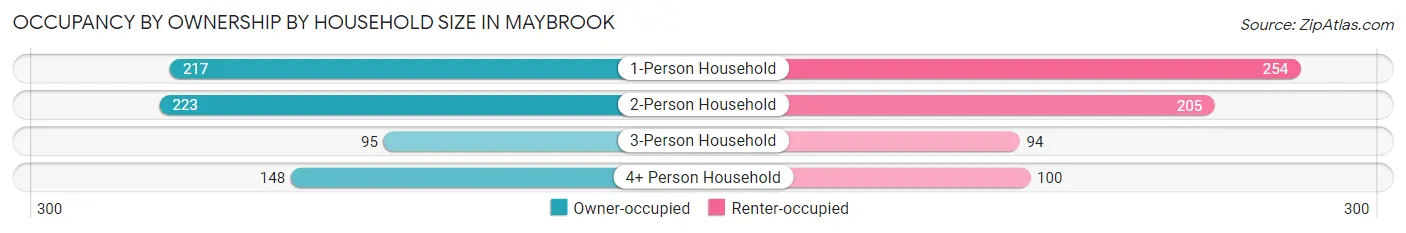
| Household Size | Owner-occupied | Renter-occupied |
| 1-Person Household | 217 (46.1%) | 254 (53.9%) |
| 2-Person Household | 223 (52.1%) | 205 (47.9%) |
| 3-Person Household | 95 (50.3%) | 94 (49.7%) |
| 4+ Person Household | 148 (59.7%) | 100 (40.3%) |
| Total Housing Units | 683 (51.1%) | 653 (48.9%) |
Occupancy by Educational Attainment in Maybrook
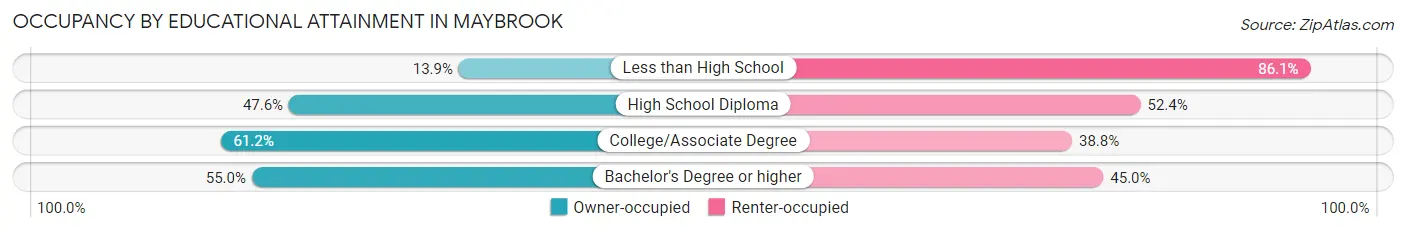
| Household Size | Owner-occupied | Renter-occupied |
| Less than High School | 16 (13.9%) | 99 (86.1%) |
| High School Diploma | 227 (47.6%) | 250 (52.4%) |
| College/Associate Degree | 307 (61.2%) | 195 (38.8%) |
| Bachelor's Degree or higher | 133 (55.0%) | 109 (45.0%) |
Occupancy by Age of Householder in Maybrook
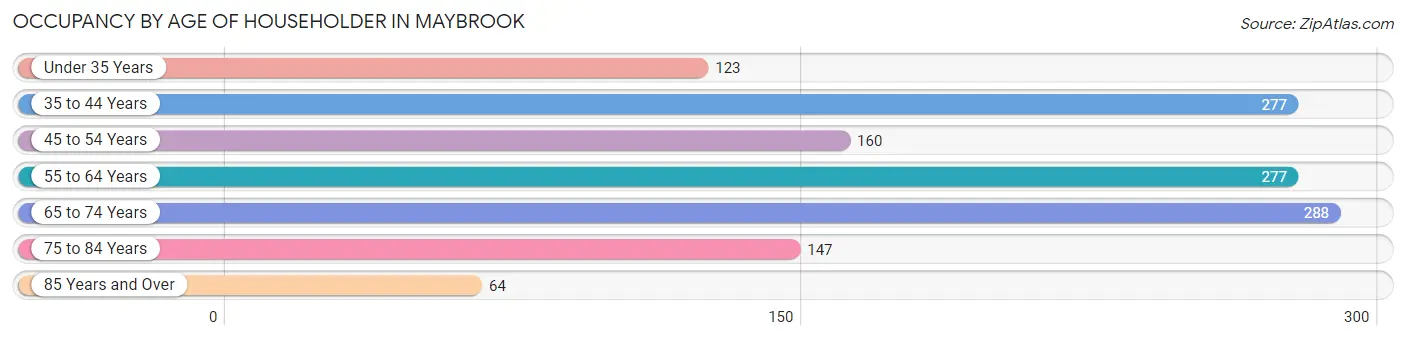
| Age Bracket | # Households | % Households |
| Under 35 Years | 123 | 9.2% |
| 35 to 44 Years | 277 | 20.7% |
| 45 to 54 Years | 160 | 12.0% |
| 55 to 64 Years | 277 | 20.7% |
| 65 to 74 Years | 288 | 21.6% |
| 75 to 84 Years | 147 | 11.0% |
| 85 Years and Over | 64 | 4.8% |
| Total | 1,336 | 100.0% |
Housing Finances in Maybrook
Median Income by Occupancy in Maybrook
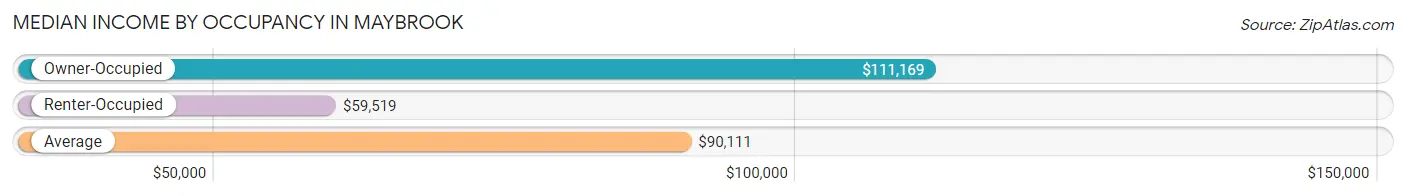
| Occupancy Type | # Households | Median Income |
| Owner-Occupied | 683 (51.1%) | $111,169 |
| Renter-Occupied | 653 (48.9%) | $59,519 |
| Average | 1,336 (100.0%) | $90,111 |
Occupancy by Householder Income Bracket in Maybrook
| Income Bracket | Owner-occupied | Renter-occupied |
| Less than $5,000 | 19 (2.8%) | 69 (10.6%) |
| $5,000 to $9,999 | 7 (1.0%) | 42 (6.4%) |
| $10,000 to $14,999 | 19 (2.8%) | 0 (0.0%) |
| $15,000 to $19,999 | 0 (0.0%) | 79 (12.1%) |
| $20,000 to $24,999 | 18 (2.6%) | 20 (3.1%) |
| $25,000 to $34,999 | 18 (2.6%) | 26 (4.0%) |
| $35,000 to $49,999 | 39 (5.7%) | 71 (10.9%) |
| $50,000 to $74,999 | 45 (6.6%) | 55 (8.4%) |
| $75,000 to $99,999 | 128 (18.7%) | 98 (15.0%) |
| $100,000 to $149,999 | 230 (33.7%) | 163 (25.0%) |
| $150,000 or more | 160 (23.4%) | 30 (4.6%) |
| Total | 683 (100.0%) | 653 (100.0%) |
Monthly Housing Cost Tiers in Maybrook
| Monthly Cost | Owner-occupied | Renter-occupied |
| Less than $300 | 10 (1.5%) | 13 (2.0%) |
| $300 to $499 | 0 (0.0%) | 26 (4.0%) |
| $500 to $799 | 124 (18.2%) | 65 (10.0%) |
| $800 to $999 | 36 (5.3%) | 49 (7.5%) |
| $1,000 to $1,499 | 139 (20.3%) | 147 (22.5%) |
| $1,500 to $1,999 | 159 (23.3%) | 319 (48.8%) |
| $2,000 to $2,499 | 122 (17.9%) | 11 (1.7%) |
| $2,500 to $2,999 | 77 (11.3%) | 0 (0.0%) |
| $3,000 or more | 16 (2.3%) | 23 (3.5%) |
| Total | 683 (100.0%) | 653 (100.0%) |
Physical Housing Characteristics in Maybrook
Housing Structures in Maybrook
| Structure Type | # Housing Units | % Housing Units |
| Single Unit, Detached | 379 | 28.4% |
| Single Unit, Attached | 295 | 22.1% |
| 2 Unit Apartments | 72 | 5.4% |
| 3 or 4 Unit Apartments | 157 | 11.7% |
| 5 to 9 Unit Apartments | 148 | 11.1% |
| 10 or more Apartments | 285 | 21.3% |
| Mobile Home / Other | 0 | 0.0% |
| Total | 1,336 | 100.0% |
Housing Structures by Occupancy in Maybrook
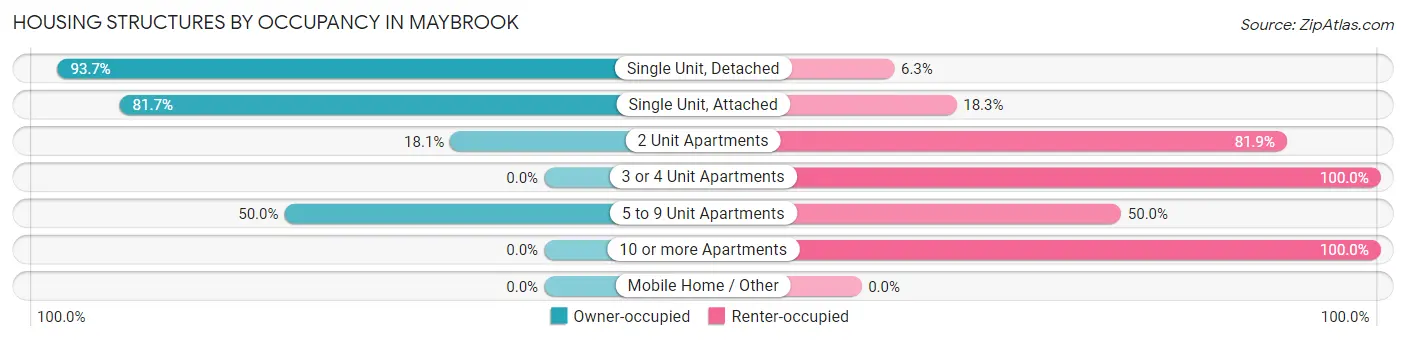
| Structure Type | Owner-occupied | Renter-occupied |
| Single Unit, Detached | 355 (93.7%) | 24 (6.3%) |
| Single Unit, Attached | 241 (81.7%) | 54 (18.3%) |
| 2 Unit Apartments | 13 (18.1%) | 59 (81.9%) |
| 3 or 4 Unit Apartments | 0 (0.0%) | 157 (100.0%) |
| 5 to 9 Unit Apartments | 74 (50.0%) | 74 (50.0%) |
| 10 or more Apartments | 0 (0.0%) | 285 (100.0%) |
| Mobile Home / Other | 0 (0.0%) | 0 (0.0%) |
| Total | 683 (51.1%) | 653 (48.9%) |
Housing Structures by Number of Rooms in Maybrook
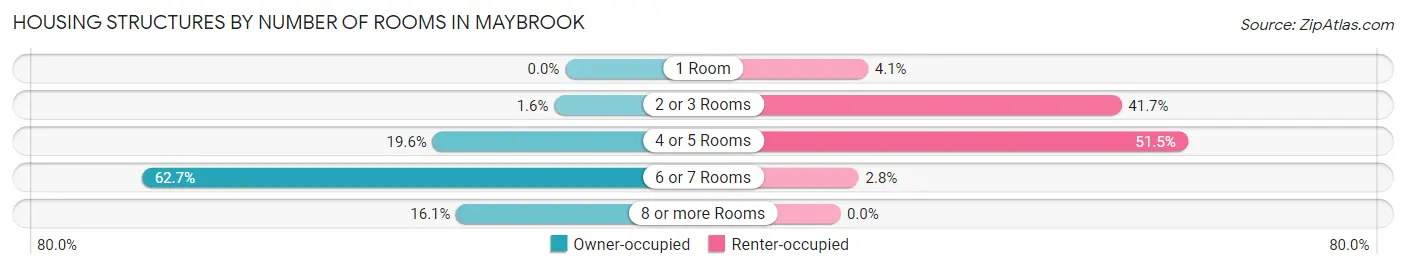
| Number of Rooms | Owner-occupied | Renter-occupied |
| 1 Room | 0 (0.0%) | 27 (4.1%) |
| 2 or 3 Rooms | 11 (1.6%) | 272 (41.6%) |
| 4 or 5 Rooms | 134 (19.6%) | 336 (51.4%) |
| 6 or 7 Rooms | 428 (62.7%) | 18 (2.8%) |
| 8 or more Rooms | 110 (16.1%) | 0 (0.0%) |
| Total | 683 (100.0%) | 653 (100.0%) |
Housing Structure by Heating Type in Maybrook
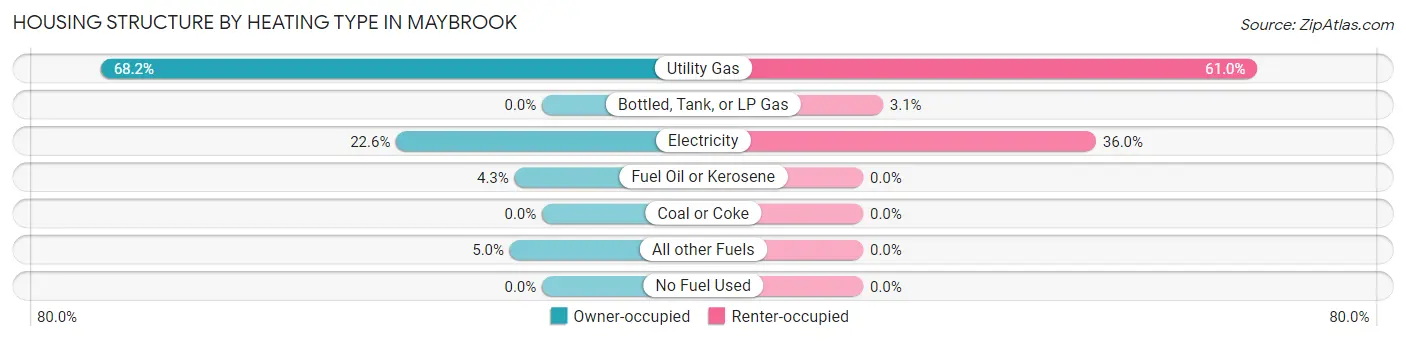
| Heating Type | Owner-occupied | Renter-occupied |
| Utility Gas | 466 (68.2%) | 398 (61.0%) |
| Bottled, Tank, or LP Gas | 0 (0.0%) | 20 (3.1%) |
| Electricity | 154 (22.6%) | 235 (36.0%) |
| Fuel Oil or Kerosene | 29 (4.3%) | 0 (0.0%) |
| Coal or Coke | 0 (0.0%) | 0 (0.0%) |
| All other Fuels | 34 (5.0%) | 0 (0.0%) |
| No Fuel Used | 0 (0.0%) | 0 (0.0%) |
| Total | 683 (100.0%) | 653 (100.0%) |
Household Vehicle Usage in Maybrook
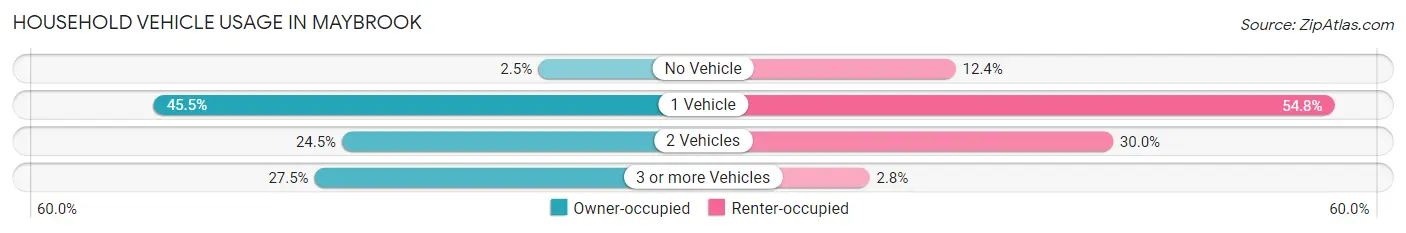
| Vehicles per Household | Owner-occupied | Renter-occupied |
| No Vehicle | 17 (2.5%) | 81 (12.4%) |
| 1 Vehicle | 311 (45.5%) | 358 (54.8%) |
| 2 Vehicles | 167 (24.4%) | 196 (30.0%) |
| 3 or more Vehicles | 188 (27.5%) | 18 (2.8%) |
| Total | 683 (100.0%) | 653 (100.0%) |
Real Estate & Mortgages in Maybrook
Real Estate and Mortgage Overview in Maybrook
| Characteristic | Without Mortgage | With Mortgage |
| Housing Units | 232 | 451 |
| Median Property Value | $184,800 | $246,800 |
| Median Household Income | $85,875 | $137 |
| Monthly Housing Costs | $705 | $16 |
| Real Estate Taxes | $4,949 | $11 |
Property Value by Mortgage Status in Maybrook
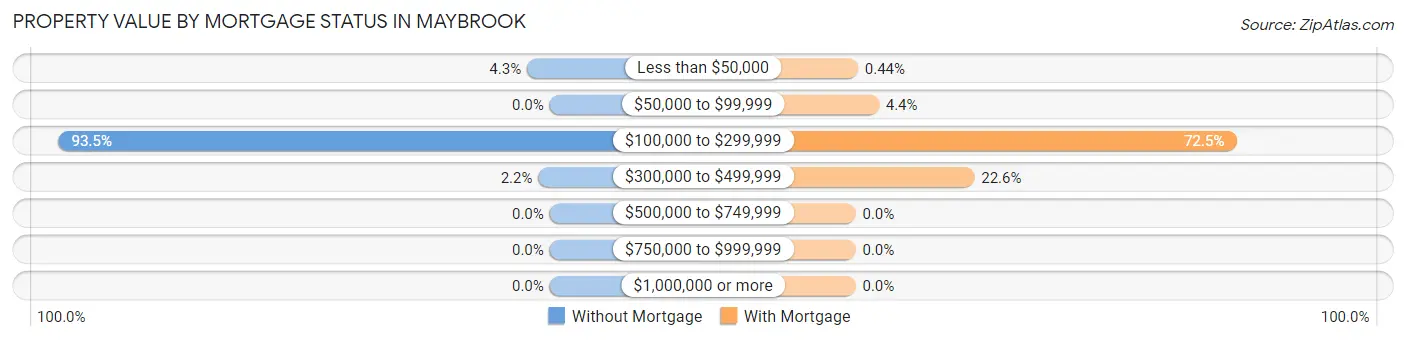
| Property Value | Without Mortgage | With Mortgage |
| Less than $50,000 | 10 (4.3%) | 2 (0.4%) |
| $50,000 to $99,999 | 0 (0.0%) | 20 (4.4%) |
| $100,000 to $299,999 | 217 (93.5%) | 327 (72.5%) |
| $300,000 to $499,999 | 5 (2.2%) | 102 (22.6%) |
| $500,000 to $749,999 | 0 (0.0%) | 0 (0.0%) |
| $750,000 to $999,999 | 0 (0.0%) | 0 (0.0%) |
| $1,000,000 or more | 0 (0.0%) | 0 (0.0%) |
| Total | 232 (100.0%) | 451 (100.0%) |
Household Income by Mortgage Status in Maybrook
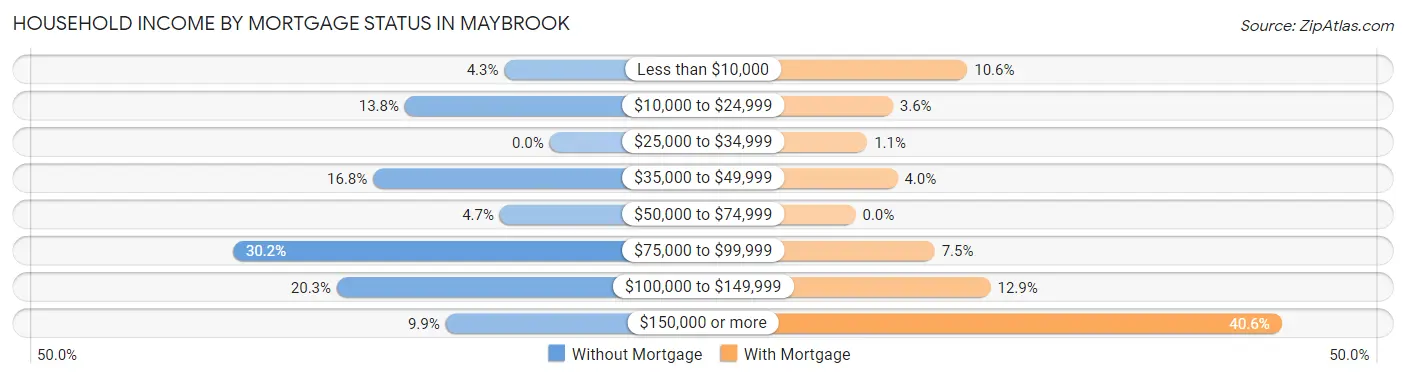
| Household Income | Without Mortgage | With Mortgage |
| Less than $10,000 | 10 (4.3%) | 48 (10.6%) |
| $10,000 to $24,999 | 32 (13.8%) | 16 (3.5%) |
| $25,000 to $34,999 | 0 (0.0%) | 5 (1.1%) |
| $35,000 to $49,999 | 39 (16.8%) | 18 (4.0%) |
| $50,000 to $74,999 | 11 (4.7%) | 0 (0.0%) |
| $75,000 to $99,999 | 70 (30.2%) | 34 (7.5%) |
| $100,000 to $149,999 | 47 (20.3%) | 58 (12.9%) |
| $150,000 or more | 23 (9.9%) | 183 (40.6%) |
| Total | 232 (100.0%) | 451 (100.0%) |
Property Value to Household Income Ratio in Maybrook
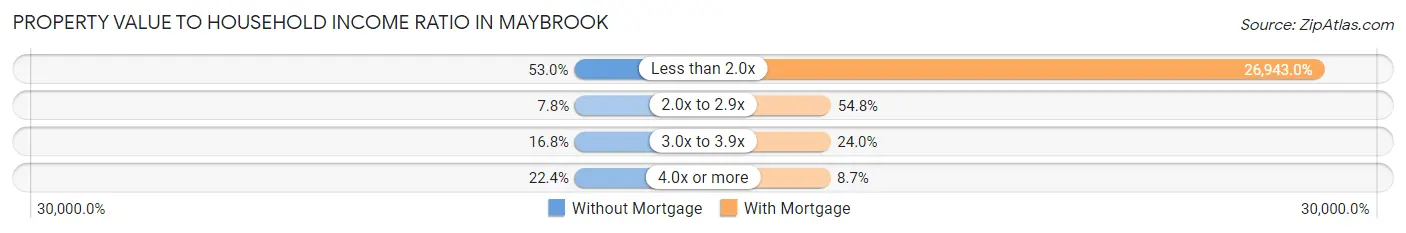
| Value-to-Income Ratio | Without Mortgage | With Mortgage |
| Less than 2.0x | 123 (53.0%) | 121,513 (26,943.0%) |
| 2.0x to 2.9x | 18 (7.8%) | 247 (54.8%) |
| 3.0x to 3.9x | 39 (16.8%) | 108 (23.9%) |
| 4.0x or more | 52 (22.4%) | 39 (8.6%) |
| Total | 232 (100.0%) | 451 (100.0%) |
Real Estate Taxes by Mortgage Status in Maybrook
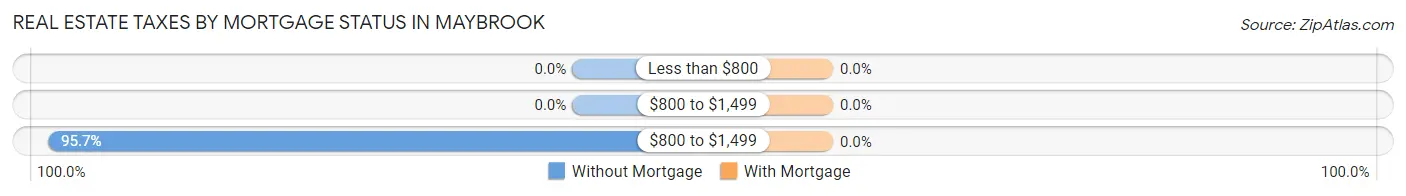
| Property Taxes | Without Mortgage | With Mortgage |
| Less than $800 | 0 (0.0%) | 0 (0.0%) |
| $800 to $1,499 | 0 (0.0%) | 0 (0.0%) |
| $800 to $1,499 | 222 (95.7%) | 0 (0.0%) |
| Total | 232 (100.0%) | 451 (100.0%) |
Health & Disability in Maybrook
Health Insurance Coverage by Age in Maybrook
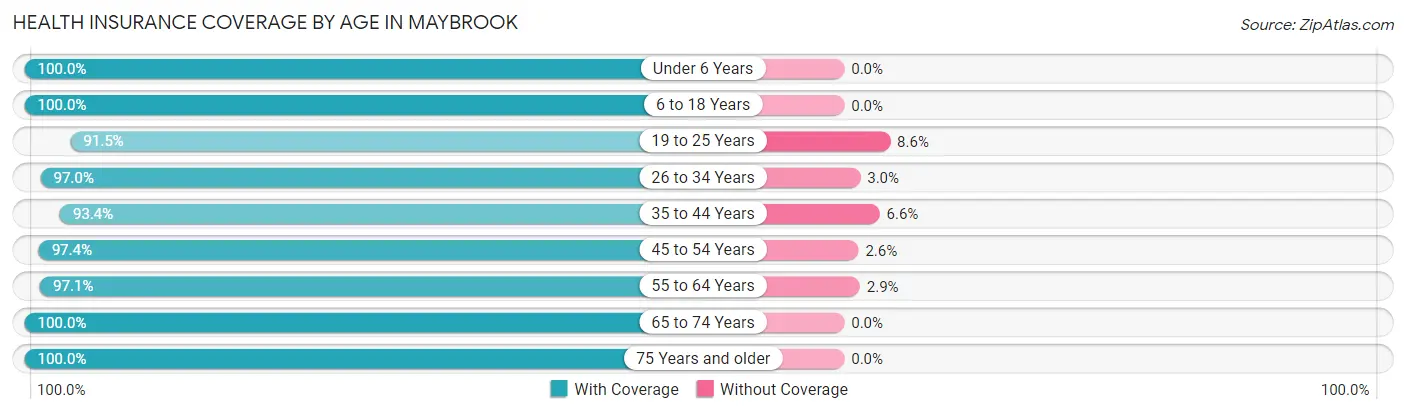
| Age Bracket | With Coverage | Without Coverage |
| Under 6 Years | 228 (100.0%) | 0 (0.0%) |
| 6 to 18 Years | 383 (100.0%) | 0 (0.0%) |
| 19 to 25 Years | 246 (91.4%) | 23 (8.6%) |
| 26 to 34 Years | 358 (97.0%) | 11 (3.0%) |
| 35 to 44 Years | 341 (93.4%) | 24 (6.6%) |
| 45 to 54 Years | 369 (97.4%) | 10 (2.6%) |
| 55 to 64 Years | 469 (97.1%) | 14 (2.9%) |
| 65 to 74 Years | 377 (100.0%) | 0 (0.0%) |
| 75 Years and older | 282 (100.0%) | 0 (0.0%) |
| Total | 3,053 (97.4%) | 82 (2.6%) |
Health Insurance Coverage by Citizenship Status in Maybrook
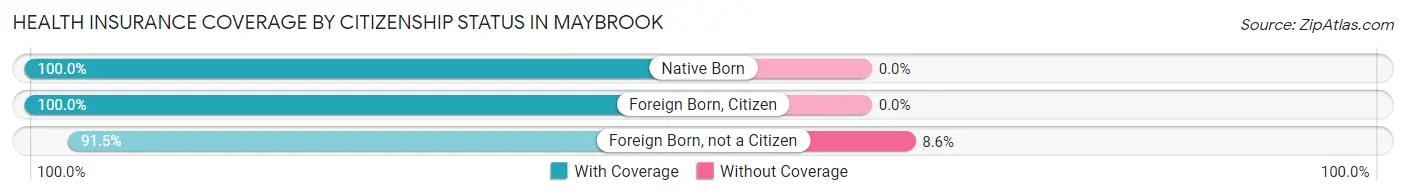
| Citizenship Status | With Coverage | Without Coverage |
| Native Born | 228 (100.0%) | 0 (0.0%) |
| Foreign Born, Citizen | 383 (100.0%) | 0 (0.0%) |
| Foreign Born, not a Citizen | 246 (91.4%) | 23 (8.6%) |
Health Insurance Coverage by Household Income in Maybrook
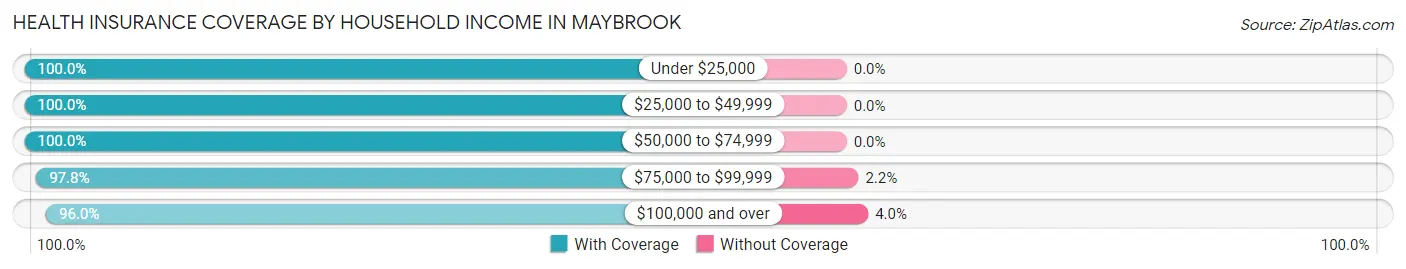
| Household Income | With Coverage | Without Coverage |
| Under $25,000 | 288 (100.0%) | 0 (0.0%) |
| $25,000 to $49,999 | 271 (100.0%) | 0 (0.0%) |
| $50,000 to $74,999 | 282 (100.0%) | 0 (0.0%) |
| $75,000 to $99,999 | 537 (97.8%) | 12 (2.2%) |
| $100,000 and over | 1,671 (96.0%) | 70 (4.0%) |
Public vs Private Health Insurance Coverage by Age in Maybrook
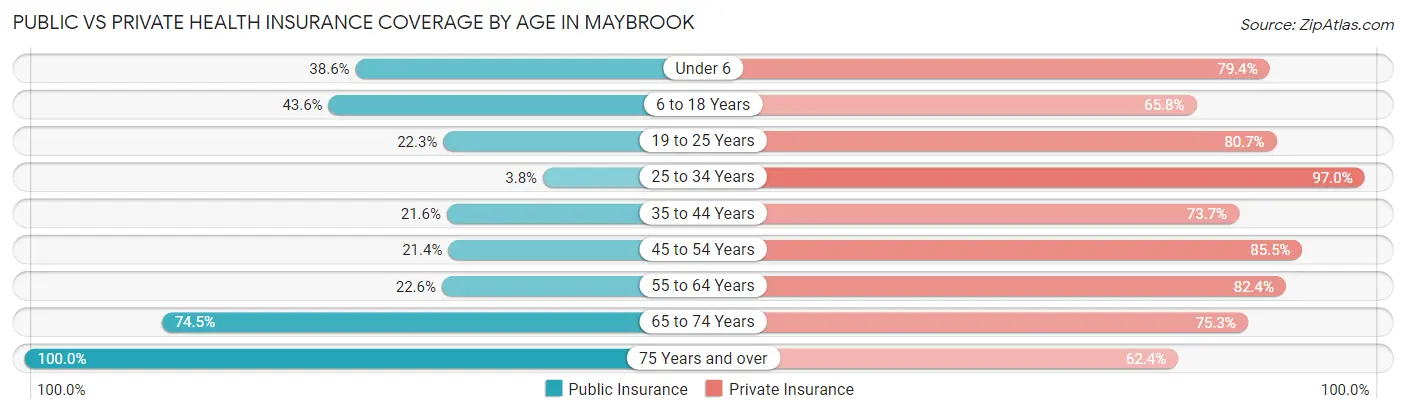
| Age Bracket | Public Insurance | Private Insurance |
| Under 6 | 88 (38.6%) | 181 (79.4%) |
| 6 to 18 Years | 167 (43.6%) | 252 (65.8%) |
| 19 to 25 Years | 60 (22.3%) | 217 (80.7%) |
| 25 to 34 Years | 14 (3.8%) | 358 (97.0%) |
| 35 to 44 Years | 79 (21.6%) | 269 (73.7%) |
| 45 to 54 Years | 81 (21.4%) | 324 (85.5%) |
| 55 to 64 Years | 109 (22.6%) | 398 (82.4%) |
| 65 to 74 Years | 281 (74.5%) | 284 (75.3%) |
| 75 Years and over | 282 (100.0%) | 176 (62.4%) |
| Total | 1,161 (37.0%) | 2,459 (78.4%) |
Disability Status by Sex by Age in Maybrook
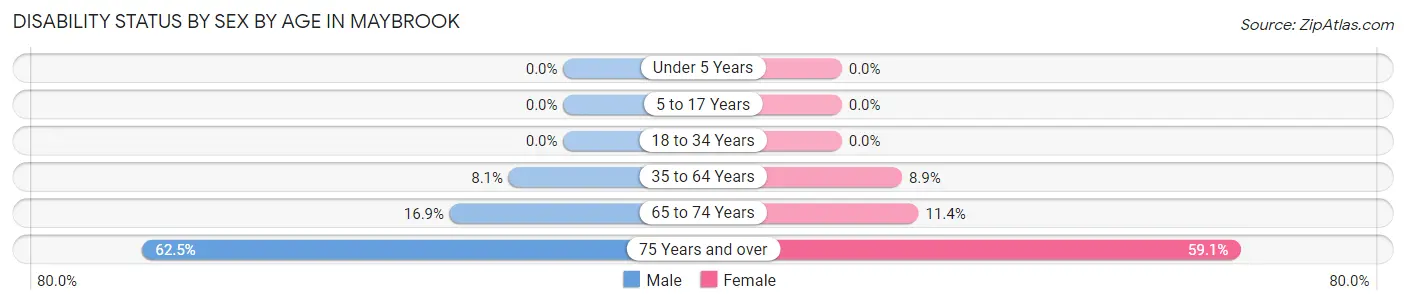
| Age Bracket | Male | Female |
| Under 5 Years | 0 (0.0%) | 0 (0.0%) |
| 5 to 17 Years | 0 (0.0%) | 0 (0.0%) |
| 18 to 34 Years | 0 (0.0%) | 0 (0.0%) |
| 35 to 64 Years | 45 (8.1%) | 60 (8.9%) |
| 65 to 74 Years | 31 (16.9%) | 22 (11.4%) |
| 75 Years and over | 60 (62.5%) | 110 (59.1%) |
Disability Class by Sex by Age in Maybrook
Disability Class: Hearing Difficulty
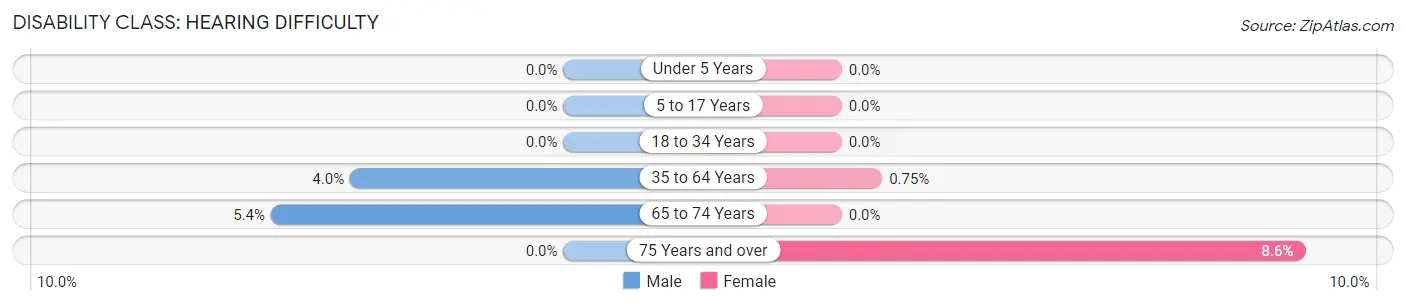
| Age Bracket | Male | Female |
| Under 5 Years | 0 (0.0%) | 0 (0.0%) |
| 5 to 17 Years | 0 (0.0%) | 0 (0.0%) |
| 18 to 34 Years | 0 (0.0%) | 0 (0.0%) |
| 35 to 64 Years | 22 (4.0%) | 5 (0.7%) |
| 65 to 74 Years | 10 (5.4%) | 0 (0.0%) |
| 75 Years and over | 0 (0.0%) | 16 (8.6%) |
Disability Class: Vision Difficulty
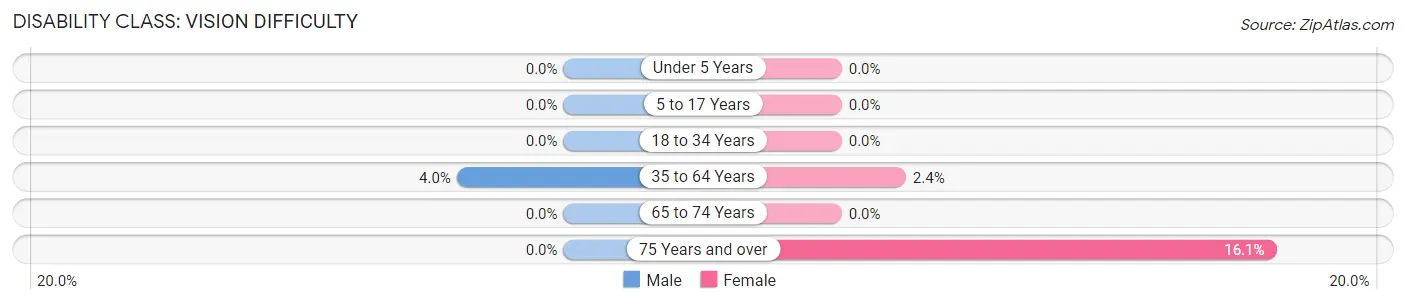
| Age Bracket | Male | Female |
| Under 5 Years | 0 (0.0%) | 0 (0.0%) |
| 5 to 17 Years | 0 (0.0%) | 0 (0.0%) |
| 18 to 34 Years | 0 (0.0%) | 0 (0.0%) |
| 35 to 64 Years | 22 (4.0%) | 16 (2.4%) |
| 65 to 74 Years | 0 (0.0%) | 0 (0.0%) |
| 75 Years and over | 0 (0.0%) | 30 (16.1%) |
Disability Class: Cognitive Difficulty
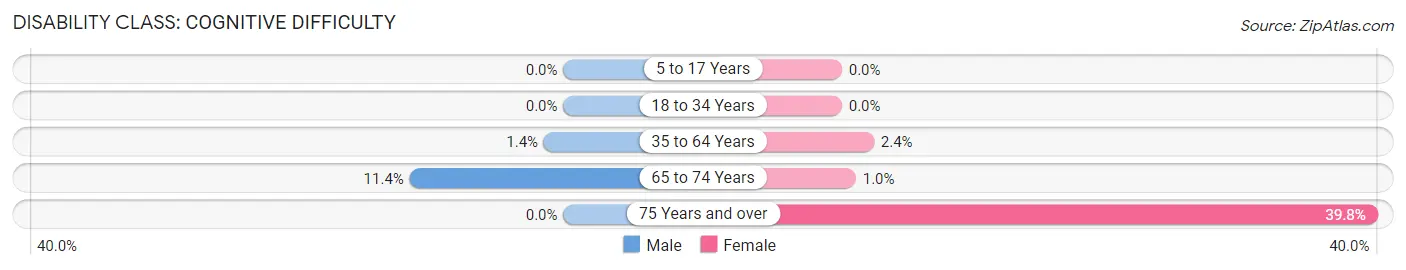
| Age Bracket | Male | Female |
| 5 to 17 Years | 0 (0.0%) | 0 (0.0%) |
| 18 to 34 Years | 0 (0.0%) | 0 (0.0%) |
| 35 to 64 Years | 8 (1.4%) | 16 (2.4%) |
| 65 to 74 Years | 21 (11.4%) | 2 (1.0%) |
| 75 Years and over | 0 (0.0%) | 74 (39.8%) |
Disability Class: Ambulatory Difficulty
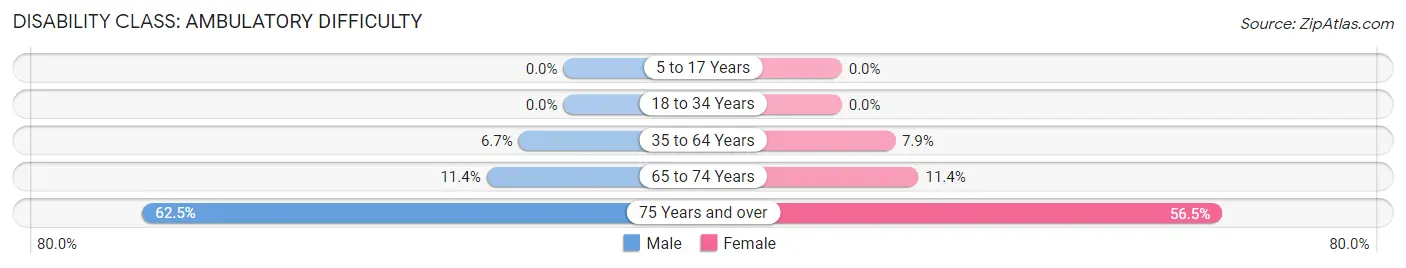
| Age Bracket | Male | Female |
| 5 to 17 Years | 0 (0.0%) | 0 (0.0%) |
| 18 to 34 Years | 0 (0.0%) | 0 (0.0%) |
| 35 to 64 Years | 37 (6.7%) | 53 (7.9%) |
| 65 to 74 Years | 21 (11.4%) | 22 (11.4%) |
| 75 Years and over | 60 (62.5%) | 105 (56.5%) |
Disability Class: Self-Care Difficulty
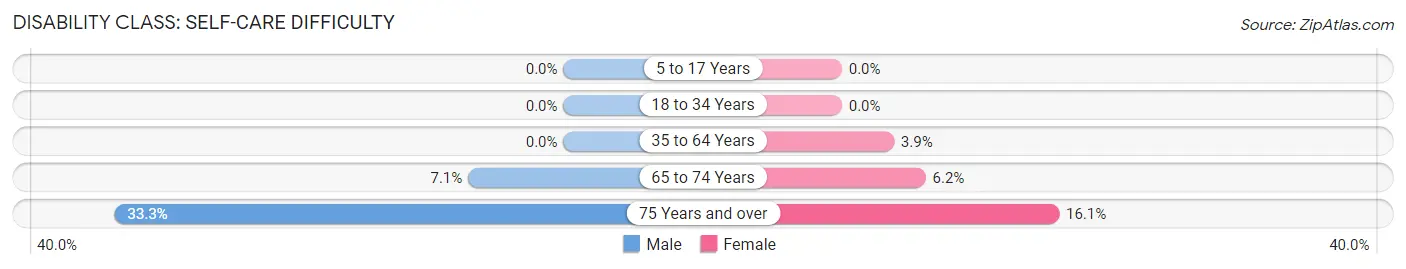
| Age Bracket | Male | Female |
| 5 to 17 Years | 0 (0.0%) | 0 (0.0%) |
| 18 to 34 Years | 0 (0.0%) | 0 (0.0%) |
| 35 to 64 Years | 0 (0.0%) | 26 (3.9%) |
| 65 to 74 Years | 13 (7.1%) | 12 (6.2%) |
| 75 Years and over | 32 (33.3%) | 30 (16.1%) |
Technology Access in Maybrook
Computing Device Access in Maybrook
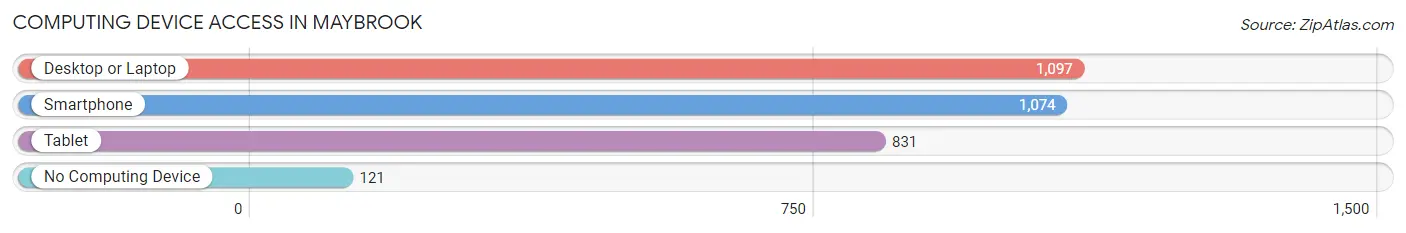
| Device Type | # Households | % Households |
| Desktop or Laptop | 1,097 | 82.1% |
| Smartphone | 1,074 | 80.4% |
| Tablet | 831 | 62.2% |
| No Computing Device | 121 | 9.1% |
| Total | 1,336 | 100.0% |
Internet Access in Maybrook
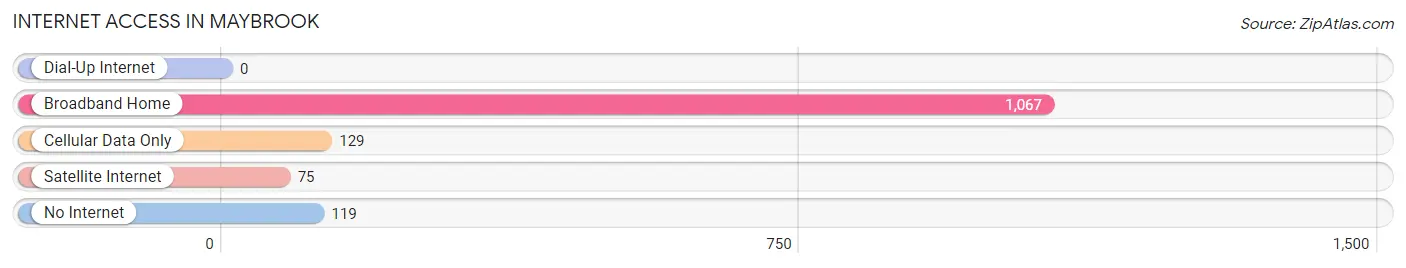
| Internet Type | # Households | % Households |
| Dial-Up Internet | 0 | 0.0% |
| Broadband Home | 1,067 | 79.9% |
| Cellular Data Only | 129 | 9.7% |
| Satellite Internet | 75 | 5.6% |
| No Internet | 119 | 8.9% |
| Total | 1,336 | 100.0% |
Maybrook Summary
Maybrook, NY is a village located in Orange County, New York. It is part of the Town of Montgomery and is situated on the Wallkill River. The village has a population of approximately 2,000 people and is located about 60 miles northwest of New York City.
History
Maybrook was first settled in 1720 by Dutch settlers. The village was originally known as “Mabrook” and was part of the Town of Montgomery. In 1848, the village was incorporated as the Village of Maybrook. The village was named after the Maybrook family, who were prominent landowners in the area.
The village grew rapidly in the late 19th century due to the construction of the New York, Ontario and Western Railway. The railway provided a direct connection to New York City and allowed for the transportation of goods and people. The village also became a popular destination for tourists due to its proximity to the Hudson River.
In the early 20th century, the village experienced a period of decline due to the decline of the railroad industry. The village was also affected by the Great Depression and World War II. However, the village experienced a resurgence in the late 20th century due to the development of the Maybrook Industrial Park. The industrial park provided jobs and economic growth to the village.
Geography
Maybrook is located in Orange County, New York. It is situated on the Wallkill River and is bordered by the Town of Montgomery to the north, the Town of Crawford to the east, the Town of Hamptonburgh to the south, and the Town of Newburgh to the west. The village has a total area of 1.2 square miles, all of which is land.
The village is located in the Hudson Valley region of New York and is part of the New York metropolitan area. The village is located about 60 miles northwest of New York City and is accessible via the New York State Thruway.
Economy
The economy of Maybrook is largely based on manufacturing and retail. The village is home to the Maybrook Industrial Park, which is home to several manufacturing companies. The industrial park provides jobs to many of the village’s residents.
The village is also home to several retail stores, including a grocery store, a hardware store, and a pharmacy. The village also has several restaurants and bars.
Demographics
As of the 2010 census, the population of Maybrook was 2,017. The racial makeup of the village was 87.3% White, 5.2% African American, 0.4% Native American, 0.7% Asian, and 4.4% from other races. Hispanic or Latino of any race were 8.2% of the population.
The median household income in Maybrook was $50,938 and the median family income was $60,938. The per capita income was $25,938. About 8.2% of families and 10.2% of the population were below the poverty line.
Maybrook is a small village with a rich history and a diverse population. The village has experienced a period of economic growth in recent years due to the development of the Maybrook Industrial Park. The village is a popular destination for tourists due to its proximity to the Hudson River and its easy access to New York City.
Common Questions
What is Per Capita Income in Maybrook?
Per Capita income in Maybrook is $44,685.
What is the Median Family Income in Maybrook?
Median Family Income in Maybrook is $111,131.
What is the Median Household income in Maybrook?
Median Household Income in Maybrook is $90,111.
What is Income or Wage Gap in Maybrook?
Income or Wage Gap in Maybrook is 15.8%.
Women in Maybrook earn 84.2 cents for every dollar earned by a man.
What is Inequality or Gini Index in Maybrook?
Inequality or Gini Index in Maybrook is 0.45.
What is the Total Population of Maybrook?
Total Population of Maybrook is 3,135.
What is the Total Male Population of Maybrook?
Total Male Population of Maybrook is 1,417.
What is the Total Female Population of Maybrook?
Total Female Population of Maybrook is 1,718.
What is the Ratio of Males per 100 Females in Maybrook?
There are 82.48 Males per 100 Females in Maybrook.
What is the Ratio of Females per 100 Males in Maybrook?
There are 121.24 Females per 100 Males in Maybrook.
What is the Median Population Age in Maybrook?
Median Population Age in Maybrook is 43.3 Years.
What is the Average Family Size in Maybrook
Average Family Size in Maybrook is 3.1 People.
What is the Average Household Size in Maybrook
Average Household Size in Maybrook is 2.3 People.
How Large is the Labor Force in Maybrook?
There are 1,720 People in the Labor Forcein in Maybrook.
What is the Percentage of People in the Labor Force in Maybrook?
66.3% of People are in the Labor Force in Maybrook.
What is the Unemployment Rate in Maybrook?
Unemployment Rate in Maybrook is 4.2%.