Hurley, NY Map & Demographics
Hurley Map
Hurley Overview
$53,718
PER CAPITA INCOME
$130,985
AVG FAMILY INCOME
$92,863
AVG HOUSEHOLD INCOME
23.1%
WAGE / INCOME GAP [ % ]
76.9¢/ $1
WAGE / INCOME GAP [ $ ]
0.41
INEQUALITY / GINI INDEX
3,370
TOTAL POPULATION
1,465
MALE POPULATION
1,905
FEMALE POPULATION
76.90
MALES / 100 FEMALES
130.03
FEMALES / 100 MALES
50.1
MEDIAN AGE
2.6
AVG FAMILY SIZE
2.3
AVG HOUSEHOLD SIZE
1,807
LABOR FORCE [ PEOPLE ]
62.3%
PERCENT IN LABOR FORCE
1.7%
UNEMPLOYMENT RATE
Hurley Zip Codes
Hurley Area Codes
Income in Hurley
Income Overview in Hurley
Per Capita Income in Hurley is $53,718, while median incomes of families and households are $130,985 and $92,863 respectively.
| Characteristic | Number | Measure |
| Per Capita Income | 3,370 | $53,718 |
| Median Family Income | 1,048 | $130,985 |
| Mean Family Income | 1,048 | $145,220 |
| Median Household Income | 1,473 | $92,863 |
| Mean Household Income | 1,473 | $123,308 |
| Income Deficit | 1,048 | $0 |
| Wage / Income Gap (%) | 3,370 | 23.13% |
| Wage / Income Gap ($) | 3,370 | 76.87¢ per $1 |
| Gini / Inequality Index | 3,370 | 0.41 |
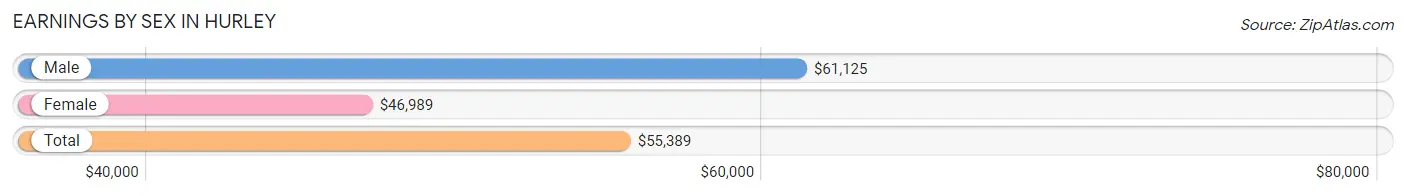
Earnings by Sex in Hurley
Average Earnings in Hurley are $55,389, $61,125 for men and $46,989 for women, a difference of 23.1%.
| Sex | Number | Average Earnings |
| Male | 924 (48.3%) | $61,125 |
| Female | 988 (51.7%) | $46,989 |
| Total | 1,912 (100.0%) | $55,389 |
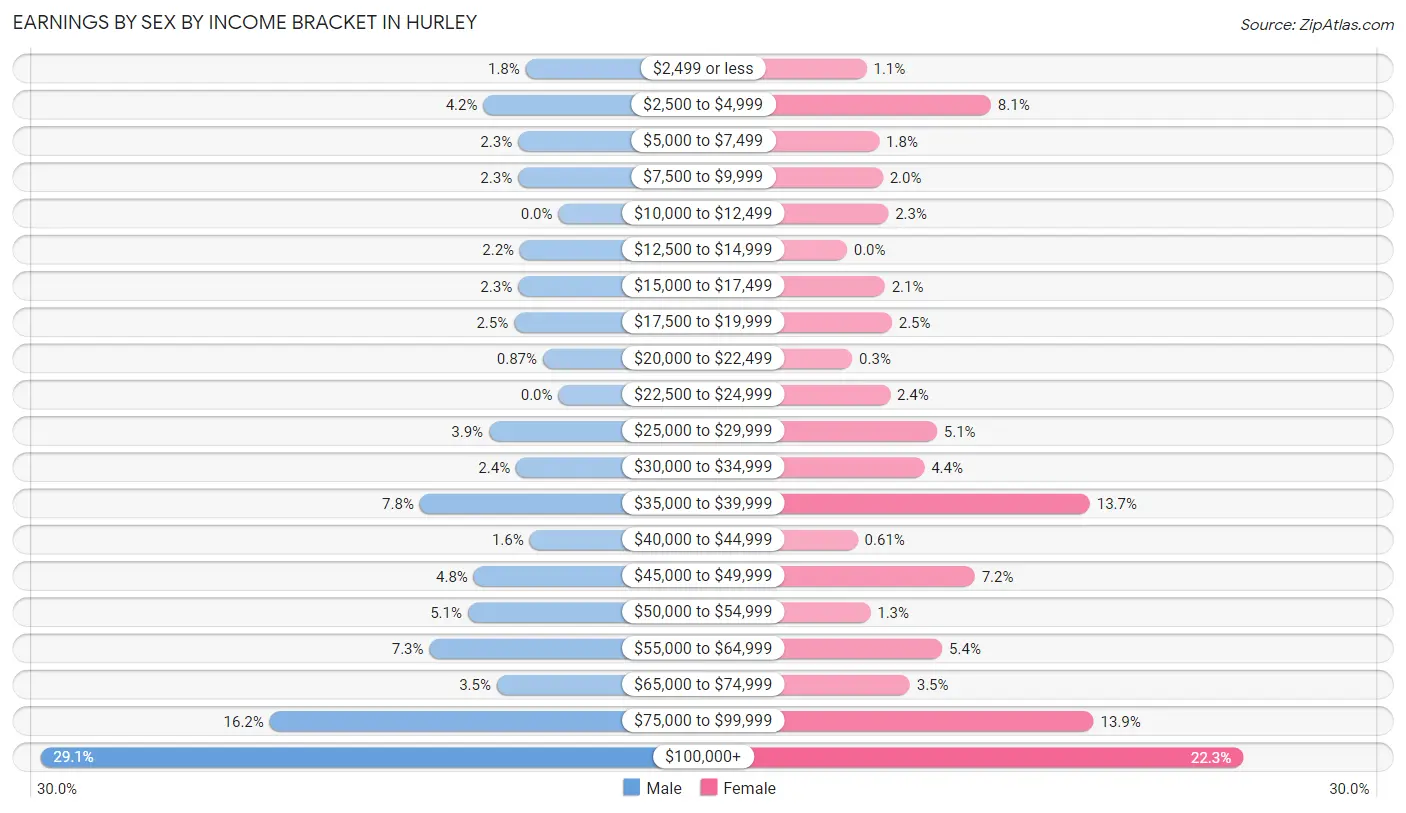
Earnings by Sex by Income Bracket in Hurley
The most common earnings brackets in Hurley are $100,000+ for men (269 | 29.1%) and $100,000+ for women (220 | 22.3%).
| Income | Male | Female |
| $2,499 or less | 17 (1.8%) | 11 (1.1%) |
| $2,500 to $4,999 | 39 (4.2%) | 80 (8.1%) |
| $5,000 to $7,499 | 21 (2.3%) | 18 (1.8%) |
| $7,500 to $9,999 | 21 (2.3%) | 20 (2.0%) |
| $10,000 to $12,499 | 0 (0.0%) | 23 (2.3%) |
| $12,500 to $14,999 | 20 (2.2%) | 0 (0.0%) |
| $15,000 to $17,499 | 21 (2.3%) | 21 (2.1%) |
| $17,500 to $19,999 | 23 (2.5%) | 25 (2.5%) |
| $20,000 to $22,499 | 8 (0.9%) | 3 (0.3%) |
| $22,500 to $24,999 | 0 (0.0%) | 24 (2.4%) |
| $25,000 to $29,999 | 36 (3.9%) | 50 (5.1%) |
| $30,000 to $34,999 | 22 (2.4%) | 43 (4.3%) |
| $35,000 to $39,999 | 72 (7.8%) | 135 (13.7%) |
| $40,000 to $44,999 | 15 (1.6%) | 6 (0.6%) |
| $45,000 to $49,999 | 44 (4.8%) | 71 (7.2%) |
| $50,000 to $54,999 | 47 (5.1%) | 13 (1.3%) |
| $55,000 to $64,999 | 67 (7.2%) | 53 (5.4%) |
| $65,000 to $74,999 | 32 (3.5%) | 35 (3.5%) |
| $75,000 to $99,999 | 150 (16.2%) | 137 (13.9%) |
| $100,000+ | 269 (29.1%) | 220 (22.3%) |
| Total | 924 (100.0%) | 988 (100.0%) |
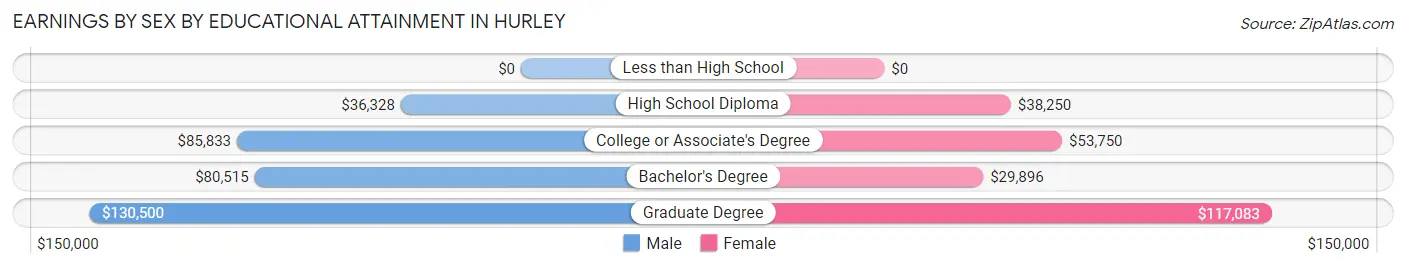
Earnings by Sex by Educational Attainment in Hurley
Average earnings in Hurley are $69,107 for men and $58,565 for women, a difference of 15.2%. Men with an educational attainment of graduate degree enjoy the highest average annual earnings of $130,500, while those with high school diploma education earn the least with $36,328. Women with an educational attainment of graduate degree earn the most with the average annual earnings of $117,083, while those with bachelor's degree education have the smallest earnings of $29,896.
| Educational Attainment | Male Income | Female Income |
| Less than High School | - | - |
| High School Diploma | $36,328 | $38,250 |
| College or Associate's Degree | $85,833 | $53,750 |
| Bachelor's Degree | $80,515 | $29,896 |
| Graduate Degree | $130,500 | $117,083 |
| Total | $69,107 | $58,565 |
Family Income in Hurley
Family Income Brackets in Hurley
According to the Hurley family income data, there are 249 families falling into the $200,000+ income range, which is the most common income bracket and makes up 23.8% of all families.
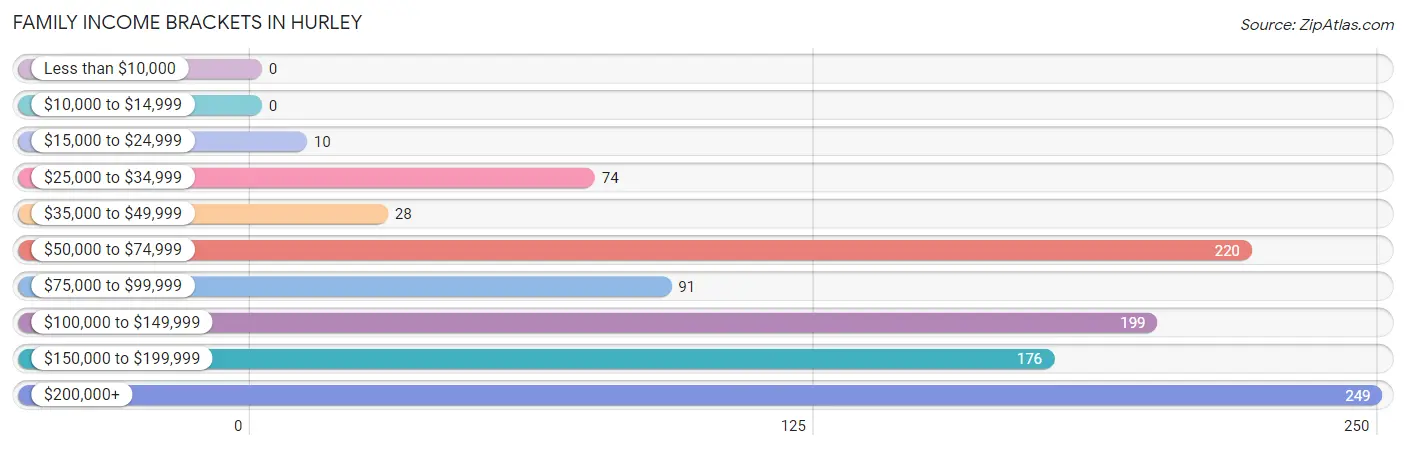
| Income Bracket | # Families | % Families |
| Less than $10,000 | 0 | 0.0% |
| $10,000 to $14,999 | 0 | 0.0% |
| $15,000 to $24,999 | 10 | 1.0% |
| $25,000 to $34,999 | 74 | 7.1% |
| $35,000 to $49,999 | 28 | 2.7% |
| $50,000 to $74,999 | 220 | 21.0% |
| $75,000 to $99,999 | 91 | 8.7% |
| $100,000 to $149,999 | 199 | 19.0% |
| $150,000 to $199,999 | 176 | 16.8% |
| $200,000+ | 249 | 23.8% |
Family Income by Famaliy Size in Hurley
4-person families (127 | 12.1%) account for the highest median family income in Hurley with $192,656 per family, while 2-person families (556 | 53.0%) have the highest median income of $48,542 per family member.
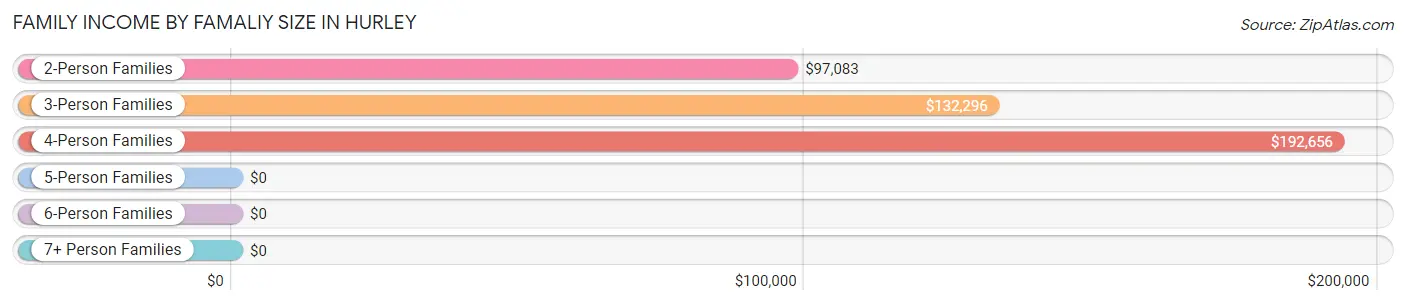
| Income Bracket | # Families | Median Income |
| 2-Person Families | 556 (53.0%) | $97,083 |
| 3-Person Families | 334 (31.9%) | $132,296 |
| 4-Person Families | 127 (12.1%) | $192,656 |
| 5-Person Families | 17 (1.6%) | $0 |
| 6-Person Families | 0 (0.0%) | $0 |
| 7+ Person Families | 14 (1.3%) | $0 |
| Total | 1,048 (100.0%) | $130,985 |
Family Income by Number of Earners in Hurley
The median family income in Hurley is $130,985, with families comprising 3+ earners (156) having the highest median family income of $221,088, while families with 1 earner (254) have the lowest median family income of $64,088, accounting for 14.9% and 24.2% of families, respectively.
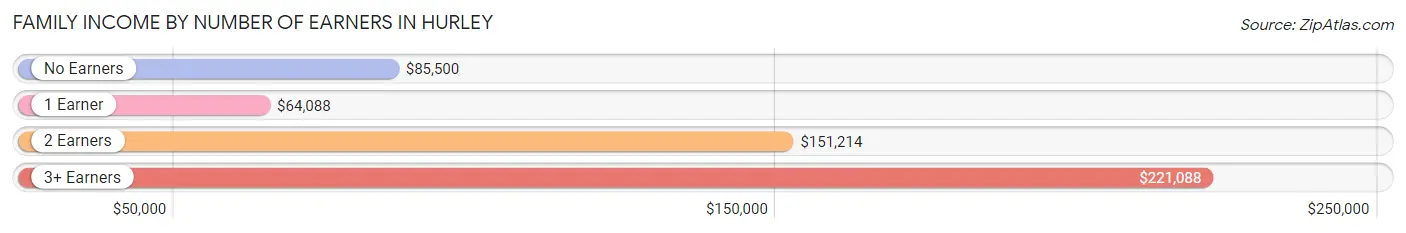
| Number of Earners | # Families | Median Income |
| No Earners | 176 (16.8%) | $85,500 |
| 1 Earner | 254 (24.2%) | $64,088 |
| 2 Earners | 462 (44.1%) | $151,214 |
| 3+ Earners | 156 (14.9%) | $221,088 |
| Total | 1,048 (100.0%) | $130,985 |
Household Income in Hurley
Household Income Brackets in Hurley
With 295 households falling in the category, the $50,000 to $74,999 income range is the most frequent in Hurley, accounting for 20.0% of all households.
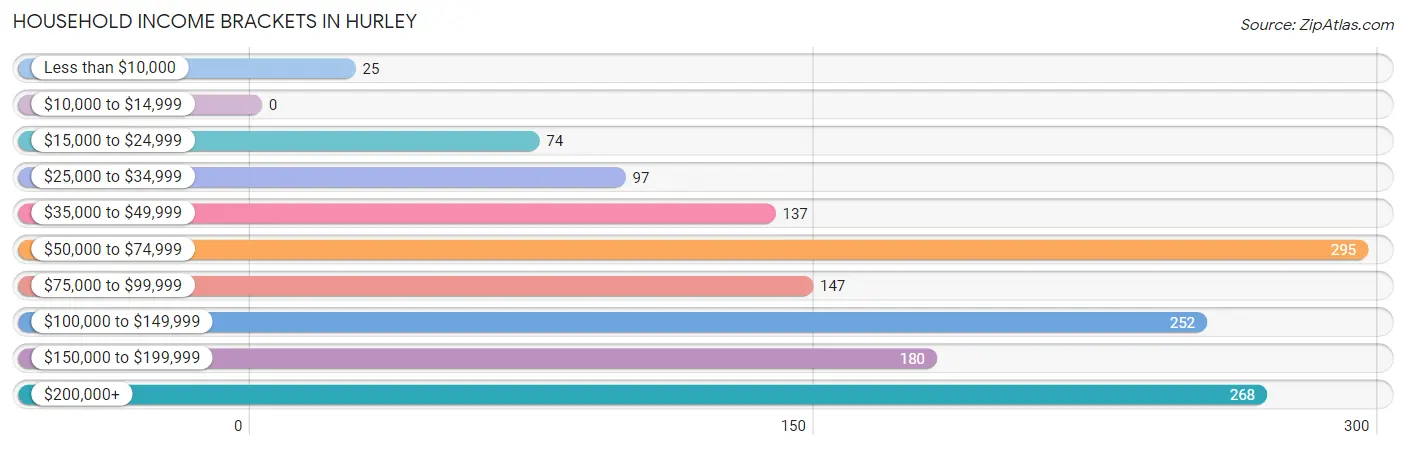
| Income Bracket | # Households | % Households |
| Less than $10,000 | 25 | 1.7% |
| $10,000 to $14,999 | 0 | 0.0% |
| $15,000 to $24,999 | 74 | 5.0% |
| $25,000 to $34,999 | 97 | 6.6% |
| $35,000 to $49,999 | 137 | 9.3% |
| $50,000 to $74,999 | 295 | 20.0% |
| $75,000 to $99,999 | 147 | 10.0% |
| $100,000 to $149,999 | 252 | 17.1% |
| $150,000 to $199,999 | 180 | 12.2% |
| $200,000+ | 268 | 18.2% |
Household Income by Householder Age in Hurley
The median household income in Hurley is $92,863, with the highest median household income of $143,158 found in the 45 to 64 years age bracket for the primary householder. A total of 626 households (42.5%) fall into this category. Meanwhile, the 15 to 24 years age bracket for the primary householder has the lowest median household income of $0, with 85 households (5.8%) in this group.
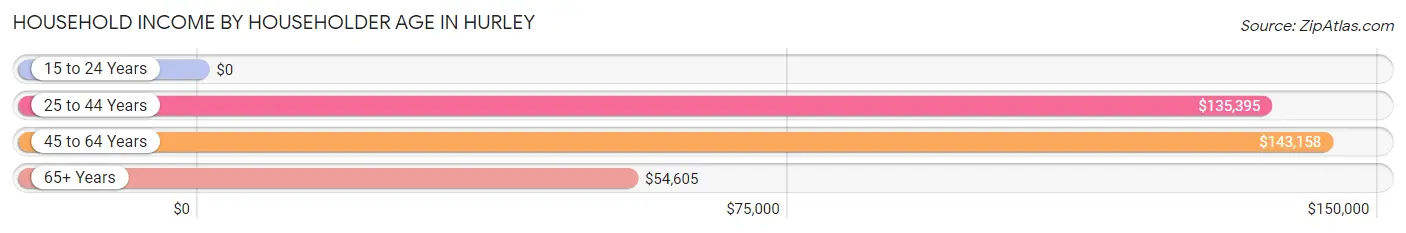
| Income Bracket | # Households | Median Income |
| 15 to 24 Years | 85 (5.8%) | $0 |
| 25 to 44 Years | 302 (20.5%) | $135,395 |
| 45 to 64 Years | 626 (42.5%) | $143,158 |
| 65+ Years | 460 (31.2%) | $54,605 |
| Total | 1,473 (100.0%) | $92,863 |
Poverty in Hurley
Income Below Poverty by Sex and Age in Hurley
With 4.1% poverty level for males and 7.2% for females among the residents of Hurley, 16 and 17 year old males and 12 to 14 year old females are the most vulnerable to poverty, with 12 males (100.0%) and 31 females (52.5%) in their respective age groups living below the poverty level.
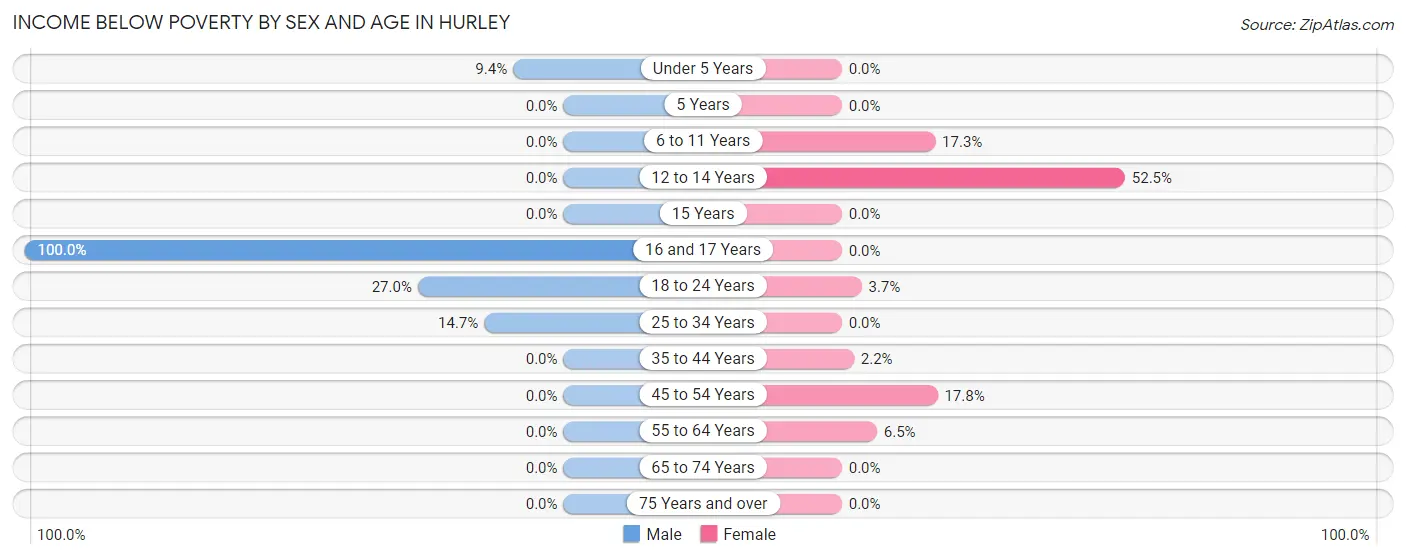
| Age Bracket | Male | Female |
| Under 5 Years | 13 (9.3%) | 0 (0.0%) |
| 5 Years | 0 (0.0%) | 0 (0.0%) |
| 6 to 11 Years | 0 (0.0%) | 13 (17.3%) |
| 12 to 14 Years | 0 (0.0%) | 31 (52.5%) |
| 15 Years | 0 (0.0%) | 0 (0.0%) |
| 16 and 17 Years | 12 (100.0%) | 0 (0.0%) |
| 18 to 24 Years | 10 (27.0%) | 6 (3.7%) |
| 25 to 34 Years | 25 (14.7%) | 0 (0.0%) |
| 35 to 44 Years | 0 (0.0%) | 6 (2.2%) |
| 45 to 54 Years | 0 (0.0%) | 54 (17.8%) |
| 55 to 64 Years | 0 (0.0%) | 25 (6.5%) |
| 65 to 74 Years | 0 (0.0%) | 0 (0.0%) |
| 75 Years and over | 0 (0.0%) | 0 (0.0%) |
| Total | 60 (4.1%) | 135 (7.2%) |
Income Above Poverty by Sex and Age in Hurley
According to the poverty statistics in Hurley, males aged 5 years and females aged under 5 years are the age groups that are most secure financially, with 100.0% of males and 100.0% of females in these age groups living above the poverty line.
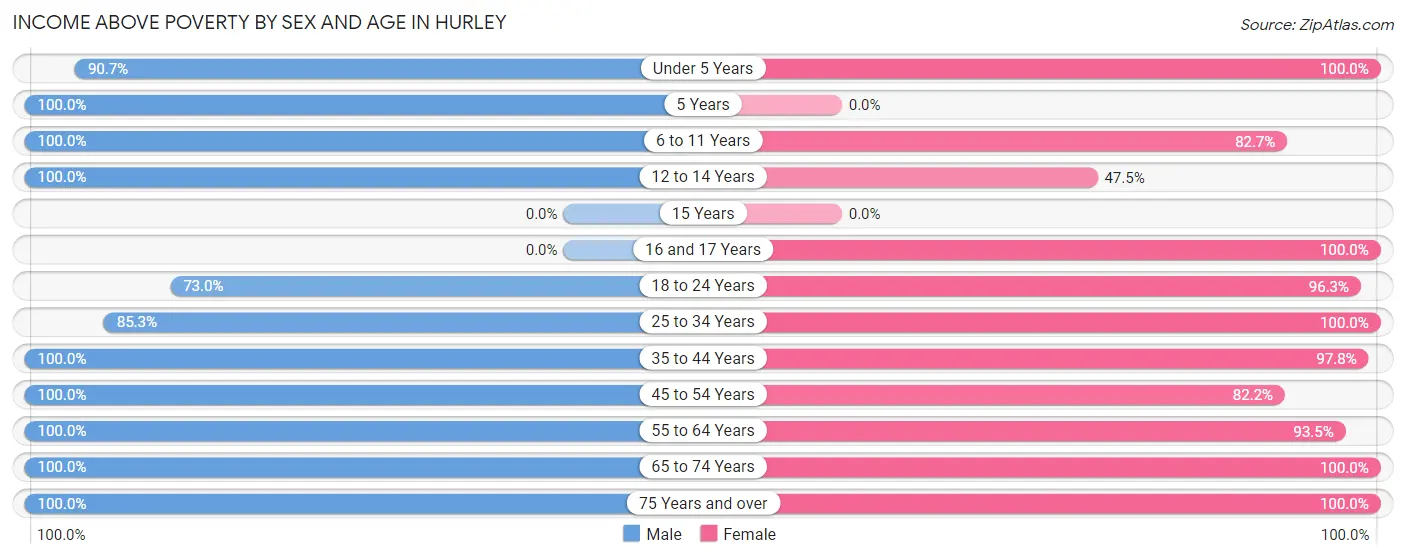
| Age Bracket | Male | Female |
| Under 5 Years | 126 (90.6%) | 71 (100.0%) |
| 5 Years | 36 (100.0%) | 0 (0.0%) |
| 6 to 11 Years | 60 (100.0%) | 62 (82.7%) |
| 12 to 14 Years | 3 (100.0%) | 28 (47.5%) |
| 15 Years | 0 (0.0%) | 0 (0.0%) |
| 16 and 17 Years | 0 (0.0%) | 5 (100.0%) |
| 18 to 24 Years | 27 (73.0%) | 158 (96.3%) |
| 25 to 34 Years | 145 (85.3%) | 156 (100.0%) |
| 35 to 44 Years | 234 (100.0%) | 262 (97.8%) |
| 45 to 54 Years | 245 (100.0%) | 250 (82.2%) |
| 55 to 64 Years | 254 (100.0%) | 359 (93.5%) |
| 65 to 74 Years | 135 (100.0%) | 172 (100.0%) |
| 75 Years and over | 140 (100.0%) | 220 (100.0%) |
| Total | 1,405 (95.9%) | 1,743 (92.8%) |
Income Below Poverty Among Married-Couple Families in Hurley
The poverty statistics for married-couple families in Hurley show that 1.6% or 14 of the total 860 families live below the poverty line. Families with 1 or 2 children have the highest poverty rate of 6.4%, comprising of 14 families. On the other hand, families with no children have the lowest poverty rate of 0.0%, which includes 0 families.
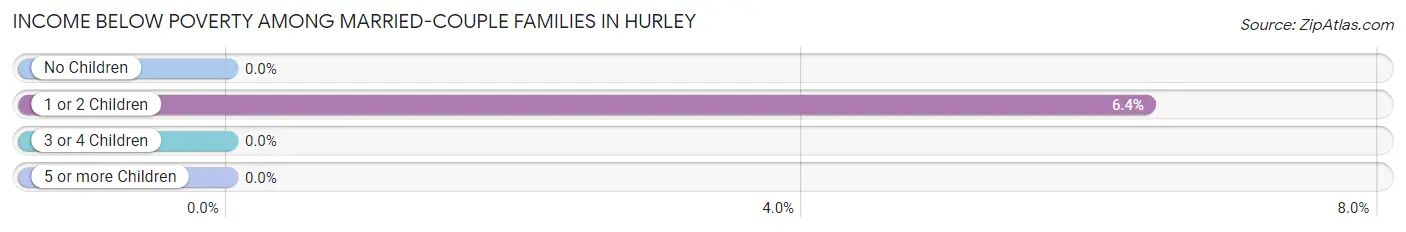
| Children | Above Poverty | Below Poverty |
| No Children | 624 (100.0%) | 0 (0.0%) |
| 1 or 2 Children | 205 (93.6%) | 14 (6.4%) |
| 3 or 4 Children | 17 (100.0%) | 0 (0.0%) |
| 5 or more Children | 0 (0.0%) | 0 (0.0%) |
| Total | 846 (98.4%) | 14 (1.6%) |
Income Below Poverty Among Single-Parent Households in Hurley
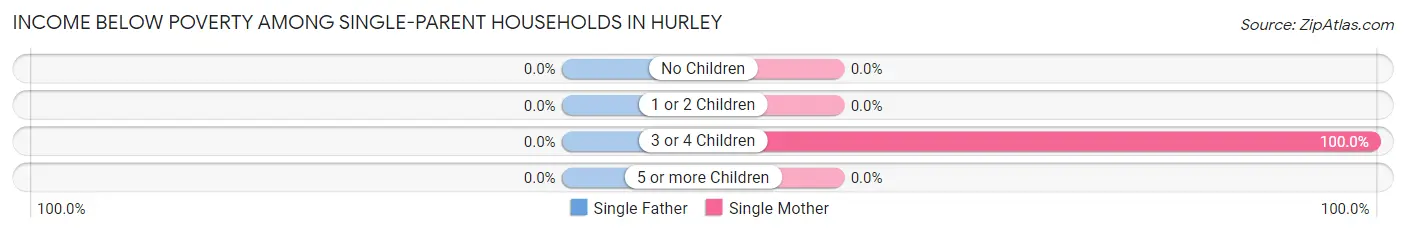
| Children | Single Father | Single Mother |
| No Children | 0 (0.0%) | 0 (0.0%) |
| 1 or 2 Children | 0 (0.0%) | 0 (0.0%) |
| 3 or 4 Children | 0 (0.0%) | 12 (100.0%) |
| 5 or more Children | 0 (0.0%) | 0 (0.0%) |
| Total | 0 (0.0%) | 12 (9.4%) |
Income Below Poverty Among Married-Couple vs Single-Parent Households in Hurley
The poverty data for Hurley shows that 14 of the married-couple family households (1.6%) and 12 of the single-parent households (6.4%) are living below the poverty level. Within the married-couple family households, those with 1 or 2 children have the highest poverty rate, with 14 households (6.4%) falling below the poverty line. Among the single-parent households, those with 3 or 4 children have the highest poverty rate, with 12 household (100.0%) living below poverty.
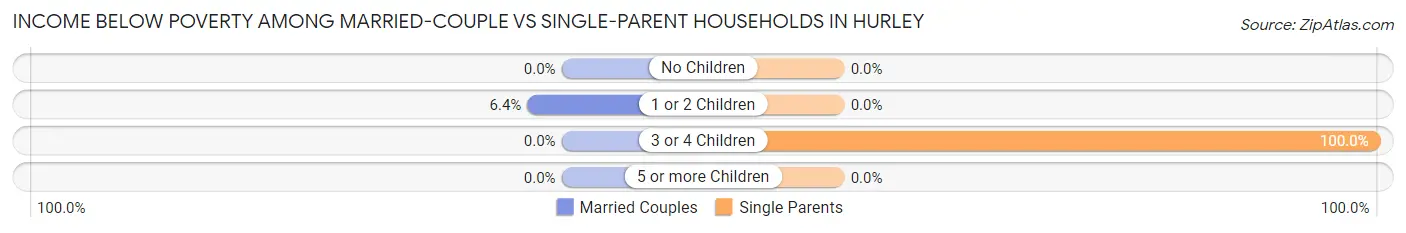
| Children | Married-Couple Families | Single-Parent Households |
| No Children | 0 (0.0%) | 0 (0.0%) |
| 1 or 2 Children | 14 (6.4%) | 0 (0.0%) |
| 3 or 4 Children | 0 (0.0%) | 12 (100.0%) |
| 5 or more Children | 0 (0.0%) | 0 (0.0%) |
| Total | 14 (1.6%) | 12 (6.4%) |
Race in Hurley
The most populous races in Hurley are White / Caucasian (2,896 | 85.9%), Hispanic or Latino (296 | 8.8%), and Two or more Races (224 | 6.7%).
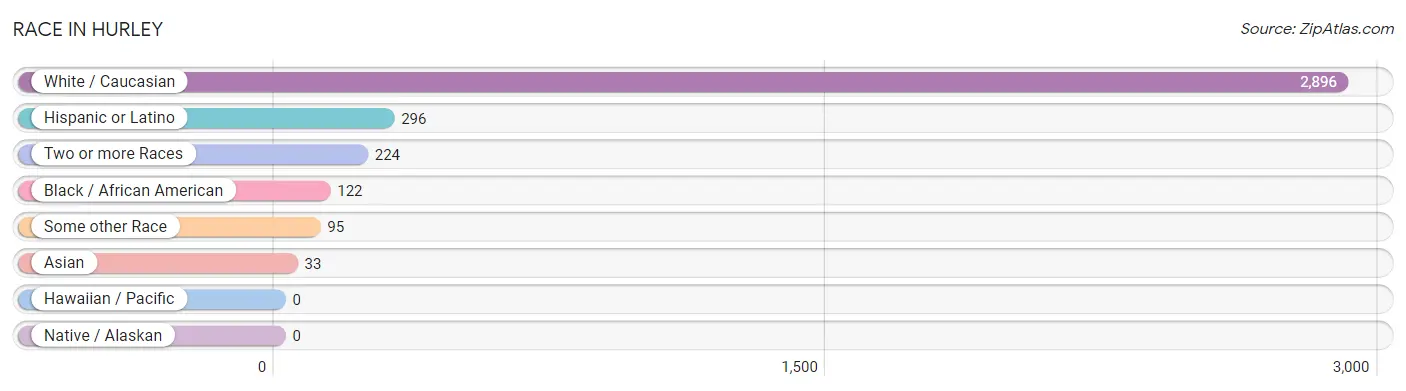
| Race | # Population | % Population |
| Asian | 33 | 1.0% |
| Black / African American | 122 | 3.6% |
| Hawaiian / Pacific | 0 | 0.0% |
| Hispanic or Latino | 296 | 8.8% |
| Native / Alaskan | 0 | 0.0% |
| White / Caucasian | 2,896 | 85.9% |
| Two or more Races | 224 | 6.7% |
| Some other Race | 95 | 2.8% |
| Total | 3,370 | 100.0% |
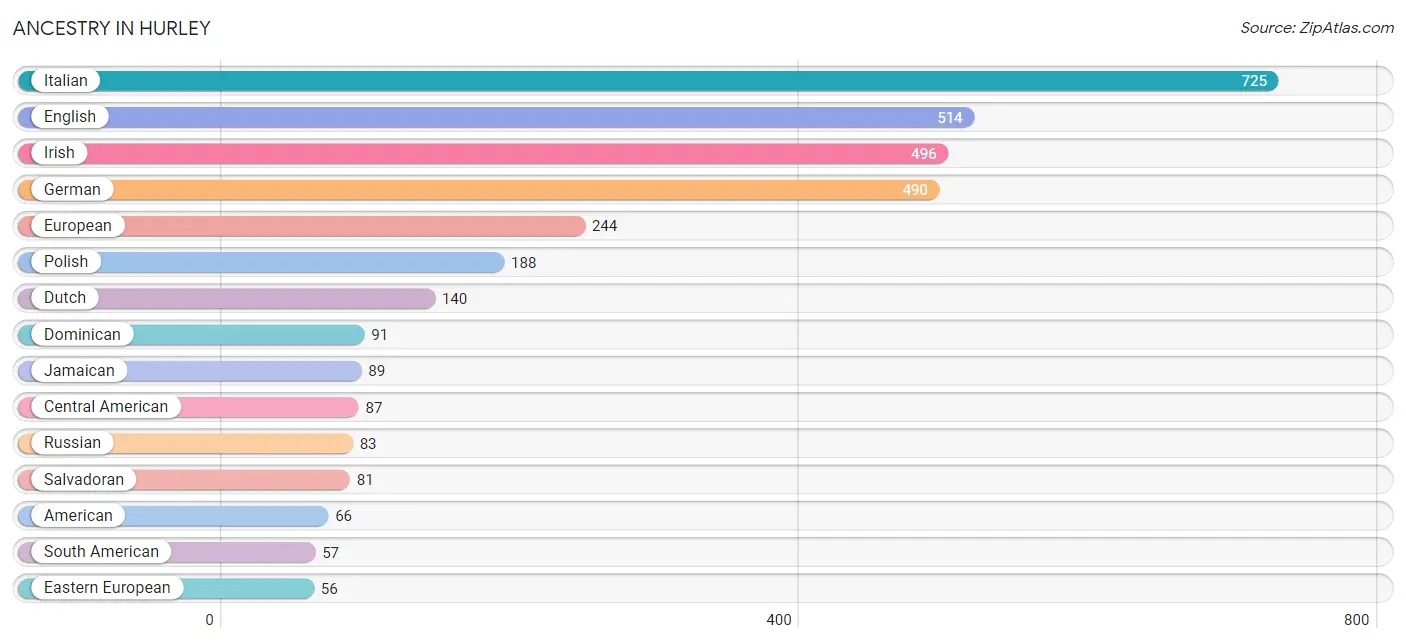
Ancestry in Hurley
The most populous ancestries reported in Hurley are Italian (725 | 21.5%), English (514 | 15.2%), Irish (496 | 14.7%), German (490 | 14.5%), and European (244 | 7.2%), together accounting for 73.3% of all Hurley residents.
| Ancestry | # Population | % Population |
| American | 66 | 2.0% |
| Austrian | 7 | 0.2% |
| Belgian | 13 | 0.4% |
| British | 9 | 0.3% |
| Canadian | 3 | 0.1% |
| Central American | 87 | 2.6% |
| Colombian | 29 | 0.9% |
| Czech | 17 | 0.5% |
| Czechoslovakian | 11 | 0.3% |
| Danish | 40 | 1.2% |
| Dominican | 91 | 2.7% |
| Dutch | 140 | 4.2% |
| Eastern European | 56 | 1.7% |
| English | 514 | 15.2% |
| European | 244 | 7.2% |
| Filipino | 14 | 0.4% |
| French | 24 | 0.7% |
| German | 490 | 14.5% |
| Greek | 6 | 0.2% |
| Honduran | 6 | 0.2% |
| Hungarian | 41 | 1.2% |
| Irish | 496 | 14.7% |
| Italian | 725 | 21.5% |
| Jamaican | 89 | 2.6% |
| Latvian | 8 | 0.2% |
| Mexican | 22 | 0.6% |
| Northern European | 10 | 0.3% |
| Norwegian | 46 | 1.4% |
| Peruvian | 12 | 0.4% |
| Polish | 188 | 5.6% |
| Portuguese | 3 | 0.1% |
| Puerto Rican | 32 | 0.9% |
| Russian | 83 | 2.5% |
| Salvadoran | 81 | 2.4% |
| Scandinavian | 37 | 1.1% |
| Scotch-Irish | 18 | 0.5% |
| Scottish | 26 | 0.8% |
| Slavic | 7 | 0.2% |
| South American | 57 | 1.7% |
| Swedish | 26 | 0.8% |
| Thai | 47 | 1.4% |
| Ukrainian | 28 | 0.8% |
| Venezuelan | 16 | 0.5% |
| Welsh | 10 | 0.3% |
| West Indian | 16 | 0.5% | View All 45 Rows |
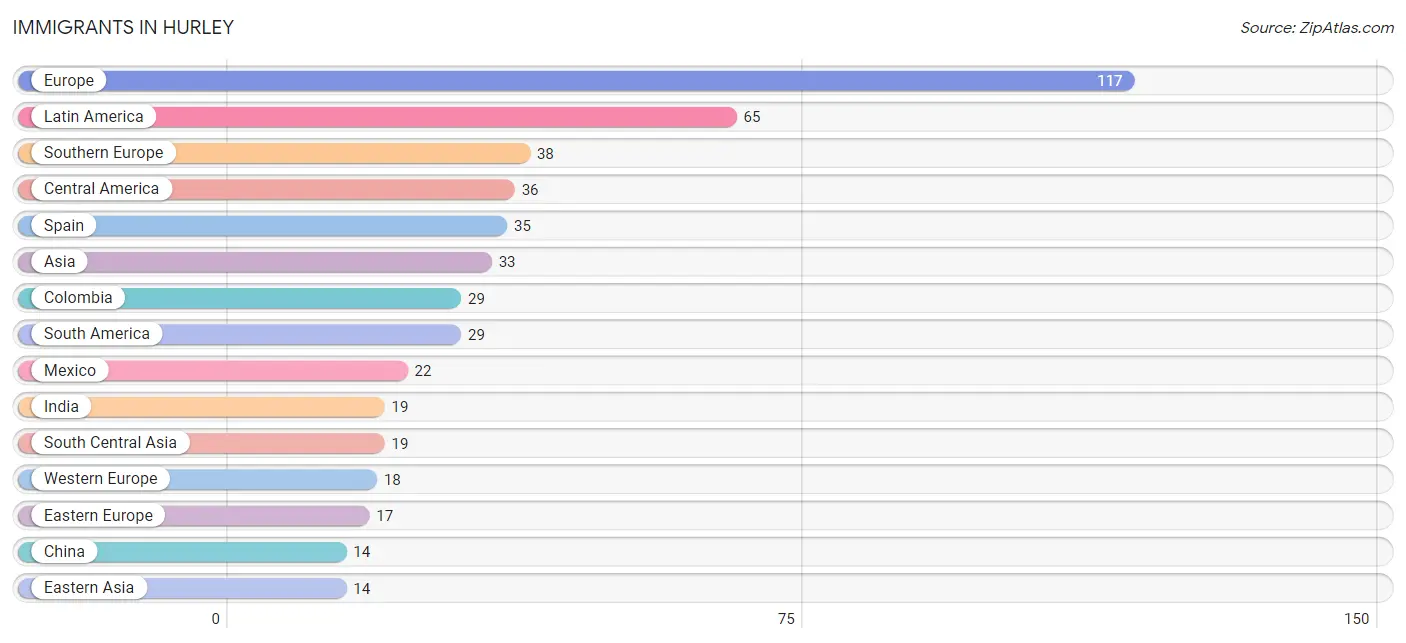
Immigrants in Hurley
The most numerous immigrant groups reported in Hurley came from Europe (117 | 3.5%), Latin America (65 | 1.9%), Southern Europe (38 | 1.1%), Central America (36 | 1.1%), and Spain (35 | 1.0%), together accounting for 8.6% of all Hurley residents.
| Immigration Origin | # Population | % Population |
| Asia | 33 | 1.0% |
| Central America | 36 | 1.1% |
| China | 14 | 0.4% |
| Colombia | 29 | 0.9% |
| Eastern Asia | 14 | 0.4% |
| Eastern Europe | 17 | 0.5% |
| El Salvador | 14 | 0.4% |
| Europe | 117 | 3.5% |
| Germany | 5 | 0.2% |
| India | 19 | 0.6% |
| Ireland | 10 | 0.3% |
| Latin America | 65 | 1.9% |
| Mexico | 22 | 0.6% |
| Northern Europe | 10 | 0.3% |
| Portugal | 3 | 0.1% |
| South America | 29 | 0.9% |
| South Central Asia | 19 | 0.6% |
| Southern Europe | 38 | 1.1% |
| Spain | 35 | 1.0% |
| Switzerland | 13 | 0.4% |
| Taiwan | 14 | 0.4% |
| Western Europe | 18 | 0.5% | View All 22 Rows |
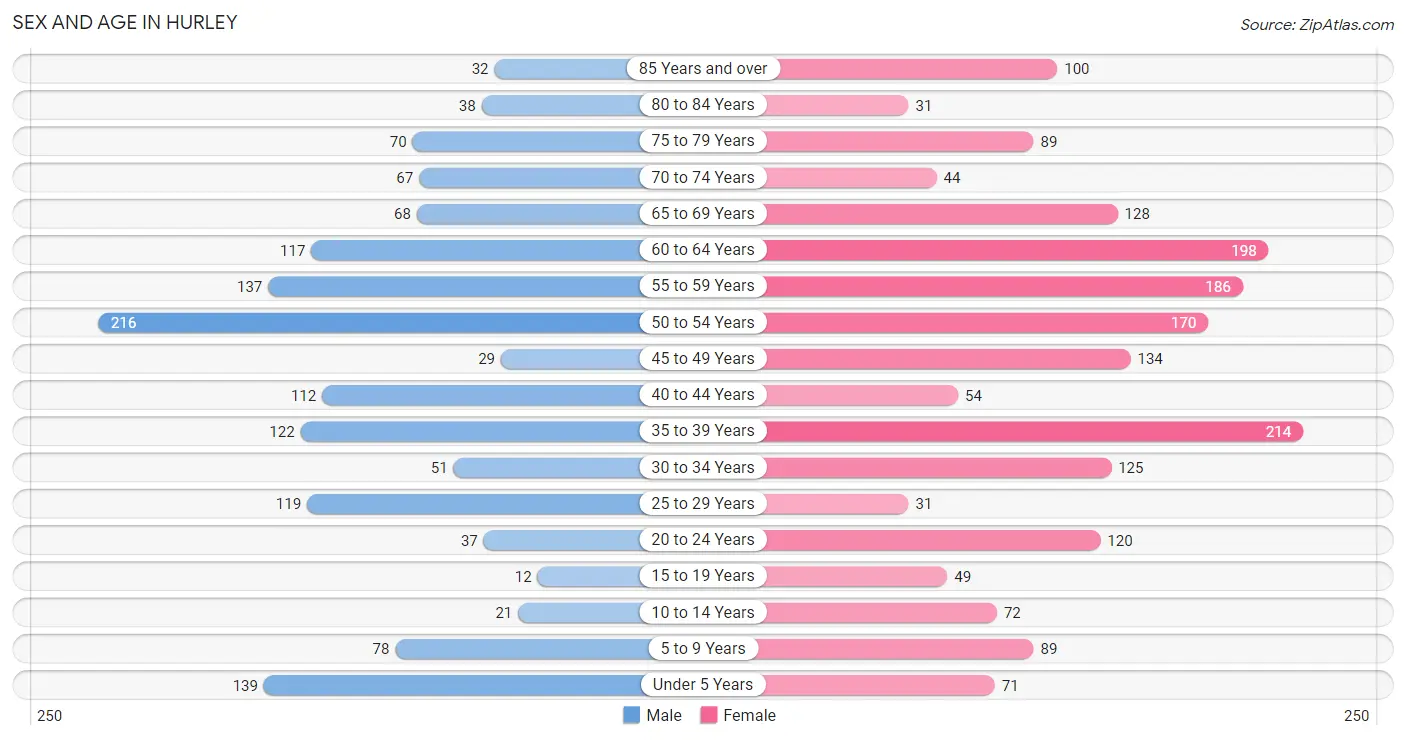
Sex and Age in Hurley
Sex and Age in Hurley
The most populous age groups in Hurley are 50 to 54 Years (216 | 14.7%) for men and 35 to 39 Years (214 | 11.2%) for women.
| Age Bracket | Male | Female |
| Under 5 Years | 139 (9.5%) | 71 (3.7%) |
| 5 to 9 Years | 78 (5.3%) | 89 (4.7%) |
| 10 to 14 Years | 21 (1.4%) | 72 (3.8%) |
| 15 to 19 Years | 12 (0.8%) | 49 (2.6%) |
| 20 to 24 Years | 37 (2.5%) | 120 (6.3%) |
| 25 to 29 Years | 119 (8.1%) | 31 (1.6%) |
| 30 to 34 Years | 51 (3.5%) | 125 (6.6%) |
| 35 to 39 Years | 122 (8.3%) | 214 (11.2%) |
| 40 to 44 Years | 112 (7.6%) | 54 (2.8%) |
| 45 to 49 Years | 29 (2.0%) | 134 (7.0%) |
| 50 to 54 Years | 216 (14.7%) | 170 (8.9%) |
| 55 to 59 Years | 137 (9.3%) | 186 (9.8%) |
| 60 to 64 Years | 117 (8.0%) | 198 (10.4%) |
| 65 to 69 Years | 68 (4.6%) | 128 (6.7%) |
| 70 to 74 Years | 67 (4.6%) | 44 (2.3%) |
| 75 to 79 Years | 70 (4.8%) | 89 (4.7%) |
| 80 to 84 Years | 38 (2.6%) | 31 (1.6%) |
| 85 Years and over | 32 (2.2%) | 100 (5.2%) |
| Total | 1,465 (100.0%) | 1,905 (100.0%) |
Families and Households in Hurley
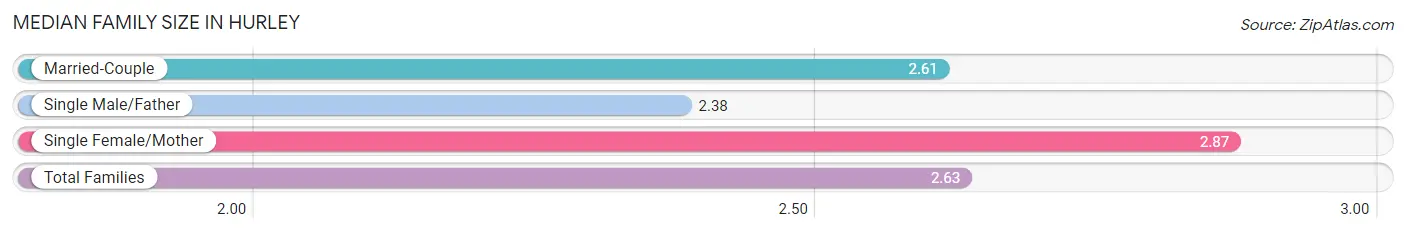
Median Family Size in Hurley
The median family size in Hurley is 2.63 persons per family, with single female/mother families (128 | 12.2%) accounting for the largest median family size of 2.87 persons per family. On the other hand, single male/father families (60 | 5.7%) represent the smallest median family size with 2.38 persons per family.
| Family Type | # Families | Family Size |
| Married-Couple | 860 (82.1%) | 2.61 |
| Single Male/Father | 60 (5.7%) | 2.38 |
| Single Female/Mother | 128 (12.2%) | 2.87 |
| Total Families | 1,048 (100.0%) | 2.63 |
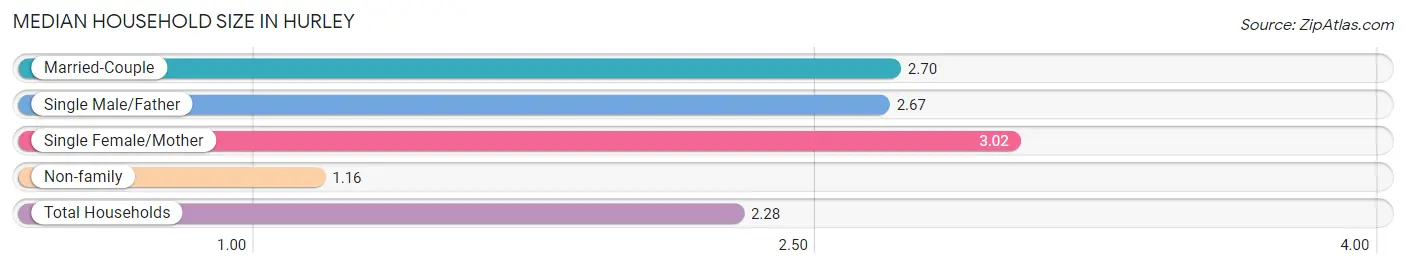
Median Household Size in Hurley
The median household size in Hurley is 2.28 persons per household, with single female/mother households (128 | 8.7%) accounting for the largest median household size of 3.02 persons per household. non-family households (425 | 28.8%) represent the smallest median household size with 1.16 persons per household.
| Household Type | # Households | Household Size |
| Married-Couple | 860 (58.4%) | 2.70 |
| Single Male/Father | 60 (4.1%) | 2.67 |
| Single Female/Mother | 128 (8.7%) | 3.02 |
| Non-family | 425 (28.8%) | 1.16 |
| Total Households | 1,473 (100.0%) | 2.28 |
Household Size by Marriage Status in Hurley
Out of a total of 1,473 households in Hurley, 1,048 (71.2%) are family households, while 425 (28.8%) are nonfamily households. The most numerous type of family households are 2-person households, comprising 525, and the most common type of nonfamily households are 1-person households, comprising 361.
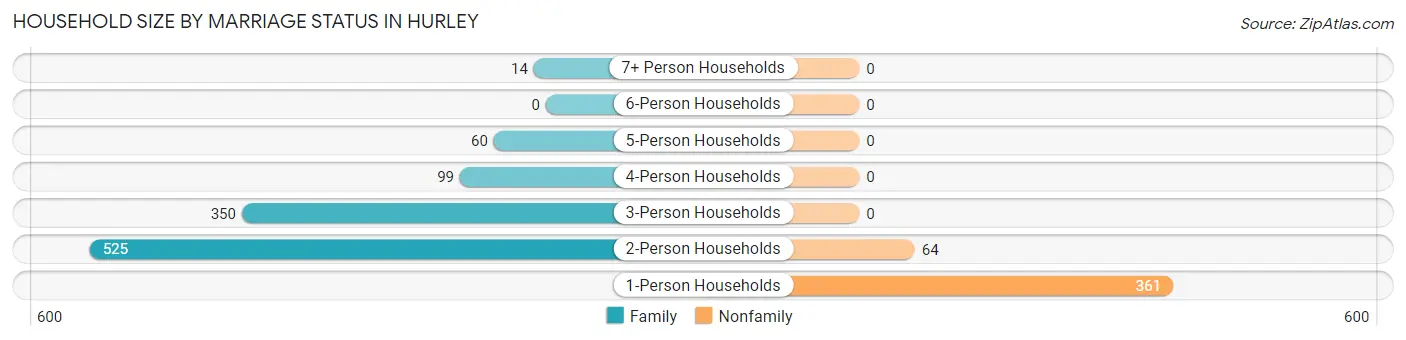
| Household Size | Family Households | Nonfamily Households |
| 1-Person Households | - | 361 (24.5%) |
| 2-Person Households | 525 (35.6%) | 64 (4.3%) |
| 3-Person Households | 350 (23.8%) | 0 (0.0%) |
| 4-Person Households | 99 (6.7%) | 0 (0.0%) |
| 5-Person Households | 60 (4.1%) | 0 (0.0%) |
| 6-Person Households | 0 (0.0%) | 0 (0.0%) |
| 7+ Person Households | 14 (0.9%) | 0 (0.0%) |
| Total | 1,048 (71.2%) | 425 (28.8%) |
Female Fertility in Hurley
Fertility by Age in Hurley
Average fertility rate in Hurley is 73.0 births per 1,000 women. Women in the age bracket of 20 to 34 years have the highest fertility rate with 149.0 births per 1,000 women. Women in the age bracket of 20 to 34 years acount for 74.6% of all women with births.
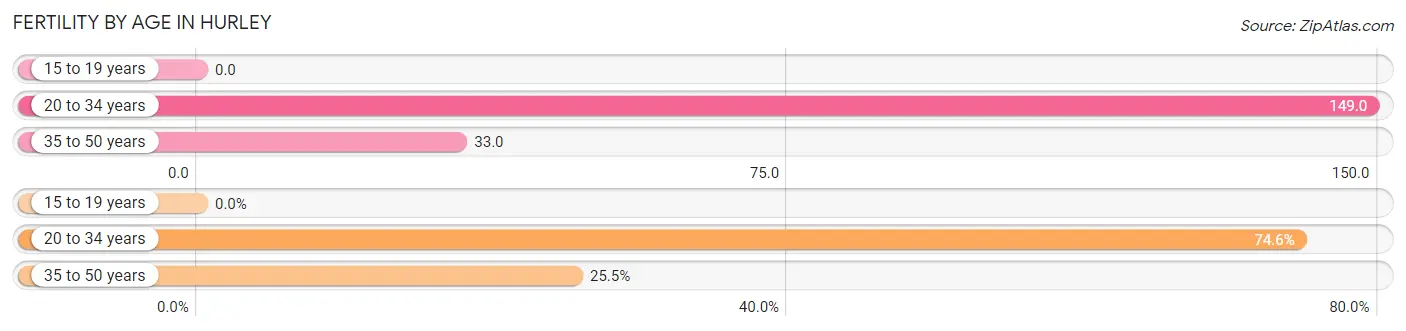
| Age Bracket | Women with Births | Births / 1,000 Women |
| 15 to 19 years | 0 (0.0%) | 0.0 |
| 20 to 34 years | 41 (74.6%) | 149.0 |
| 35 to 50 years | 14 (25.5%) | 33.0 |
| Total | 55 (100.0%) | 73.0 |
Fertility by Age by Marriage Status in Hurley
74.5% of women with births (55) in Hurley are married. The highest percentage of unmarried women with births falls into 35 to 50 years age bracket with 57.1% of them unmarried at the time of birth, while the lowest percentage of unmarried women with births belong to 20 to 34 years age bracket with 14.6% of them unmarried.
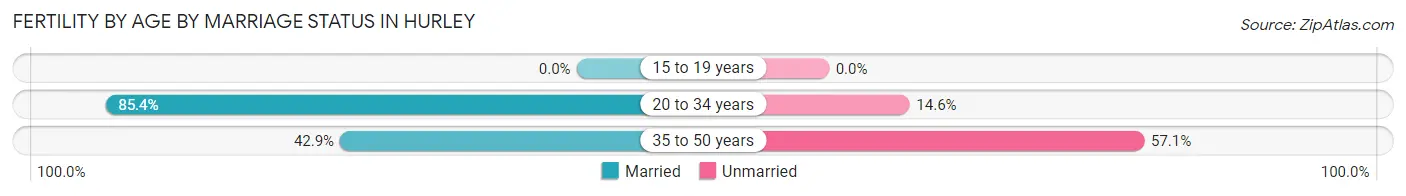
| Age Bracket | Married | Unmarried |
| 15 to 19 years | 0 (0.0%) | 0 (0.0%) |
| 20 to 34 years | 35 (85.4%) | 6 (14.6%) |
| 35 to 50 years | 6 (42.9%) | 8 (57.1%) |
| Total | 41 (74.6%) | 14 (25.5%) |
Fertility by Education in Hurley
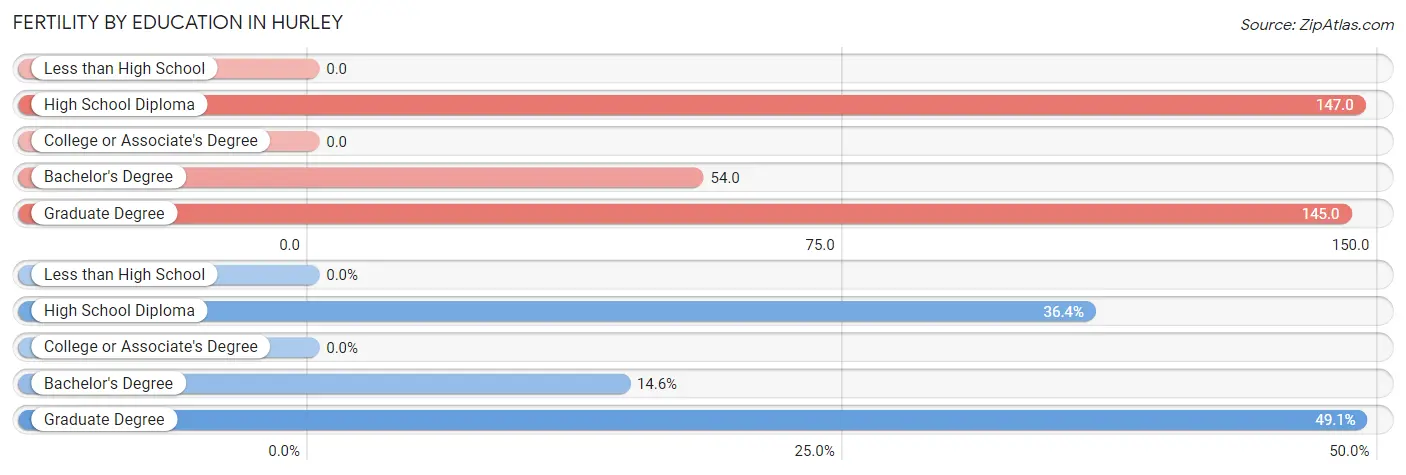
| Educational Attainment | Women with Births | Births / 1,000 Women |
| Less than High School | 0 (0.0%) | 0.0 |
| High School Diploma | 20 (36.4%) | 147.0 |
| College or Associate's Degree | 0 (0.0%) | 0.0 |
| Bachelor's Degree | 8 (14.5%) | 54.0 |
| Graduate Degree | 27 (49.1%) | 145.0 |
| Total | 55 (100.0%) | 73.0 |
Fertility by Education by Marriage Status in Hurley
25.5% of women with births in Hurley are unmarried. Women with the educational attainment of high school diploma are most likely to be married with 100.0% of them married at childbirth, while women with the educational attainment of bachelor's degree are least likely to be married with 100.0% of them unmarried at childbirth.
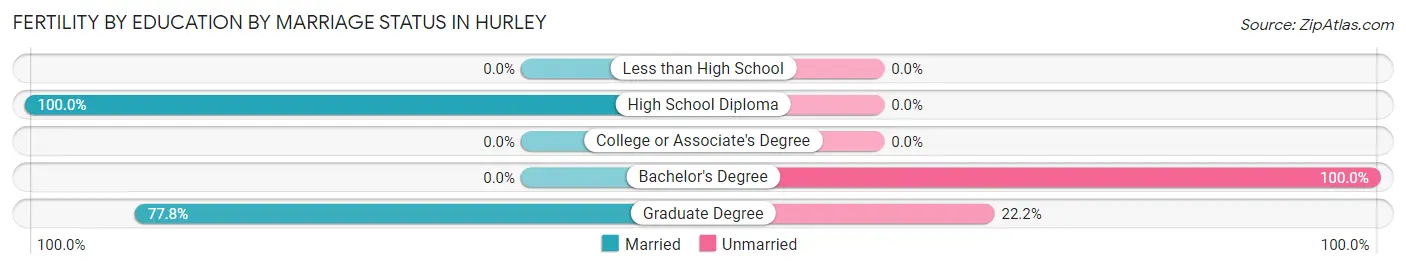
| Educational Attainment | Married | Unmarried |
| Less than High School | 0 (0.0%) | 0 (0.0%) |
| High School Diploma | 20 (100.0%) | 0 (0.0%) |
| College or Associate's Degree | 0 (0.0%) | 0 (0.0%) |
| Bachelor's Degree | 0 (0.0%) | 8 (100.0%) |
| Graduate Degree | 21 (77.8%) | 6 (22.2%) |
| Total | 41 (74.6%) | 14 (25.5%) |
Employment Characteristics in Hurley
Employment by Class of Employer in Hurley
Among the 1,606 employed individuals in Hurley, private company employees (783 | 48.7%), not-for-profit organizations (200 | 12.4%), and state government employees (187 | 11.6%) make up the most common classes of employment.
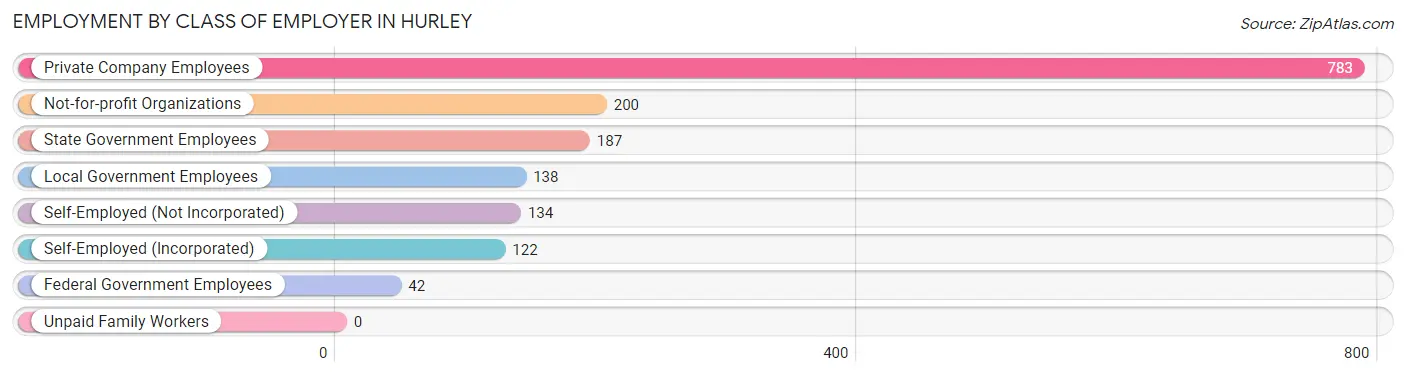
| Employer Class | # Employees | % Employees |
| Private Company Employees | 783 | 48.7% |
| Self-Employed (Incorporated) | 122 | 7.6% |
| Self-Employed (Not Incorporated) | 134 | 8.3% |
| Not-for-profit Organizations | 200 | 12.4% |
| Local Government Employees | 138 | 8.6% |
| State Government Employees | 187 | 11.6% |
| Federal Government Employees | 42 | 2.6% |
| Unpaid Family Workers | 0 | 0.0% |
| Total | 1,606 | 100.0% |
Employment Status by Age in Hurley
According to the labor force statistics for Hurley, out of the total population over 16 years of age (2,900), 62.3% or 1,807 individuals are in the labor force, with 1.7% or 31 of them unemployed. The age group with the highest labor force participation rate is 45 to 54 years, with 92.2% or 506 individuals in the labor force. Within the labor force, the 60 to 64 years age range has the highest percentage of unemployed individuals, with 13.4% or 16 of them being unemployed.
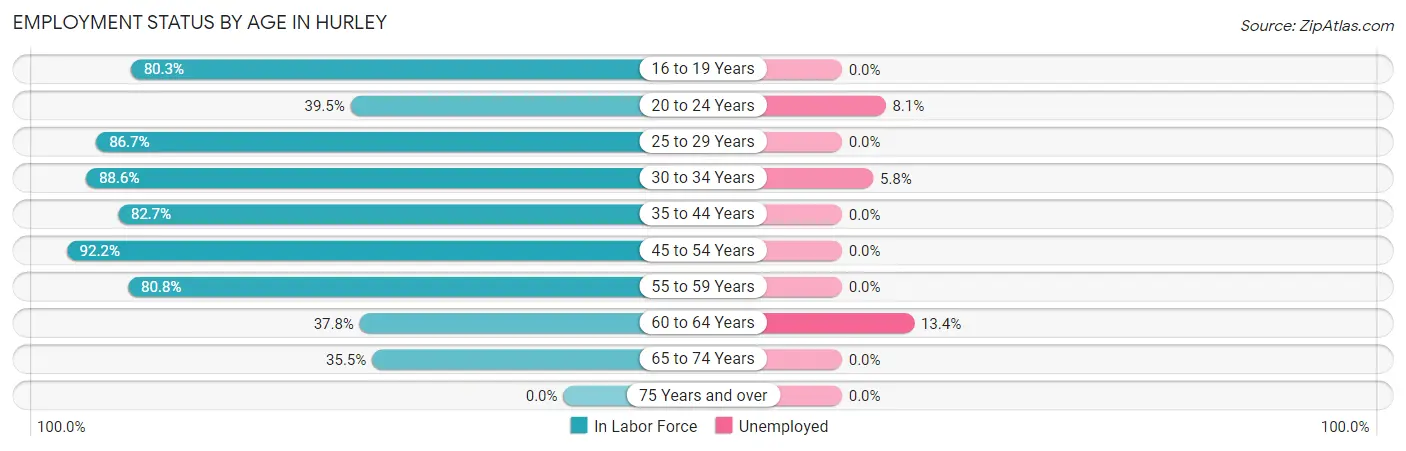
| Age Bracket | In Labor Force | Unemployed |
| 16 to 19 Years | 49 (80.3%) | 0 (0.0%) |
| 20 to 24 Years | 62 (39.5%) | 5 (8.1%) |
| 25 to 29 Years | 130 (86.7%) | 0 (0.0%) |
| 30 to 34 Years | 156 (88.6%) | 9 (5.8%) |
| 35 to 44 Years | 415 (82.7%) | 0 (0.0%) |
| 45 to 54 Years | 506 (92.2%) | 0 (0.0%) |
| 55 to 59 Years | 261 (80.8%) | 0 (0.0%) |
| 60 to 64 Years | 119 (37.8%) | 16 (13.4%) |
| 65 to 74 Years | 109 (35.5%) | 0 (0.0%) |
| 75 Years and over | 0 (0.0%) | 0 (0.0%) |
| Total | 1,807 (62.3%) | 31 (1.7%) |
Employment Status by Educational Attainment in Hurley
According to labor force statistics for Hurley, 78.8% of individuals (1,588) out of the total population between 25 and 64 years of age (2,015) are in the labor force, with 1.6% or 25 of them being unemployed. The group with the highest labor force participation rate are those with the educational attainment of bachelor's degree or higher, with 90.8% or 797 individuals in the labor force. Within the labor force, individuals with college / associate degree education have the highest percentage of unemployment, with 3.8% or 16 of them being unemployed.
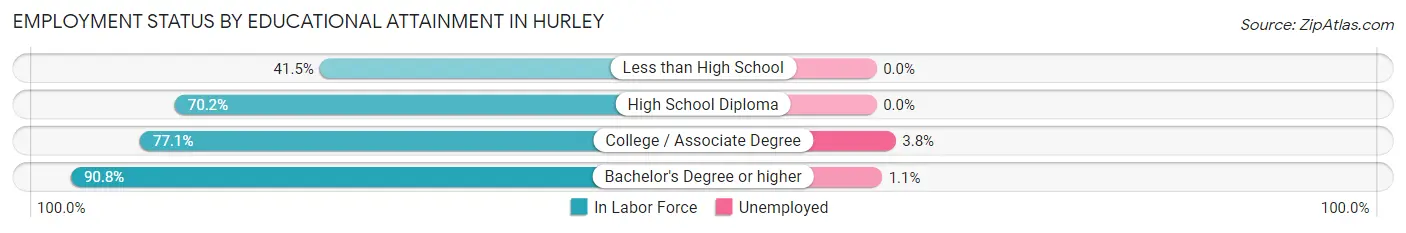
| Educational Attainment | In Labor Force | Unemployed |
| Less than High School | 66 (41.5%) | 0 (0.0%) |
| High School Diploma | 306 (70.2%) | 0 (0.0%) |
| College / Associate Degree | 418 (77.1%) | 21 (3.8%) |
| Bachelor's Degree or higher | 797 (90.8%) | 10 (1.1%) |
| Total | 1,588 (78.8%) | 32 (1.6%) |
Employment Occupations by Sex in Hurley
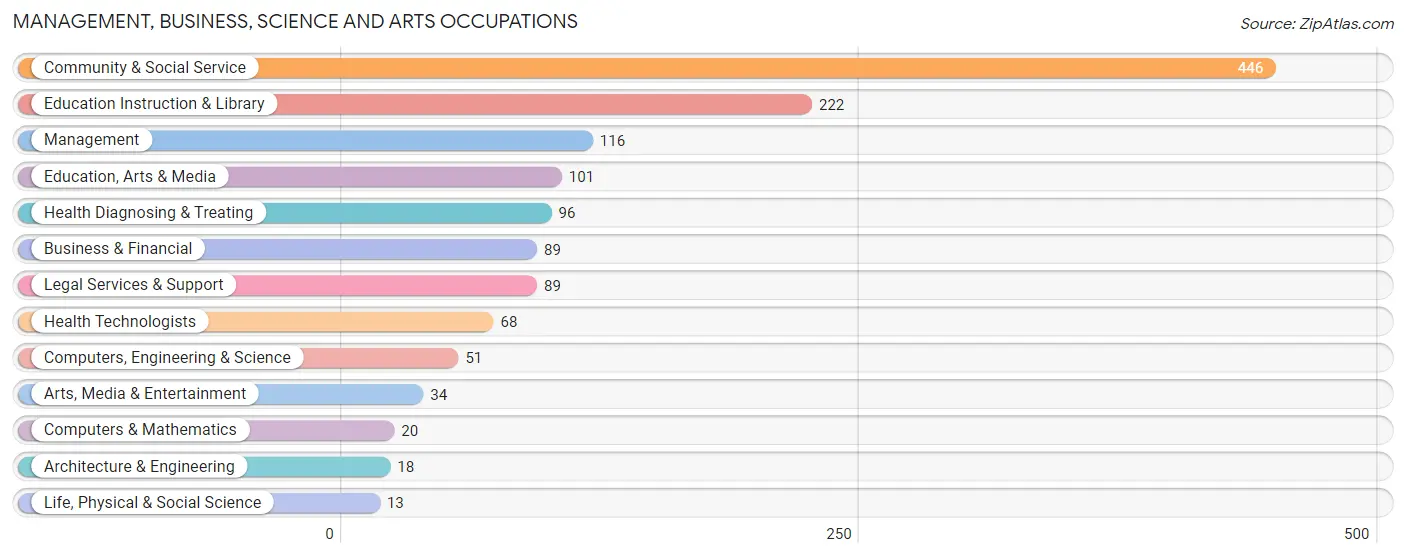
Management, Business, Science and Arts Occupations
The most common Management, Business, Science and Arts occupations in Hurley are Community & Social Service (446 | 25.1%), Education Instruction & Library (222 | 12.5%), Management (116 | 6.5%), Education, Arts & Media (101 | 5.7%), and Health Diagnosing & Treating (96 | 5.4%).
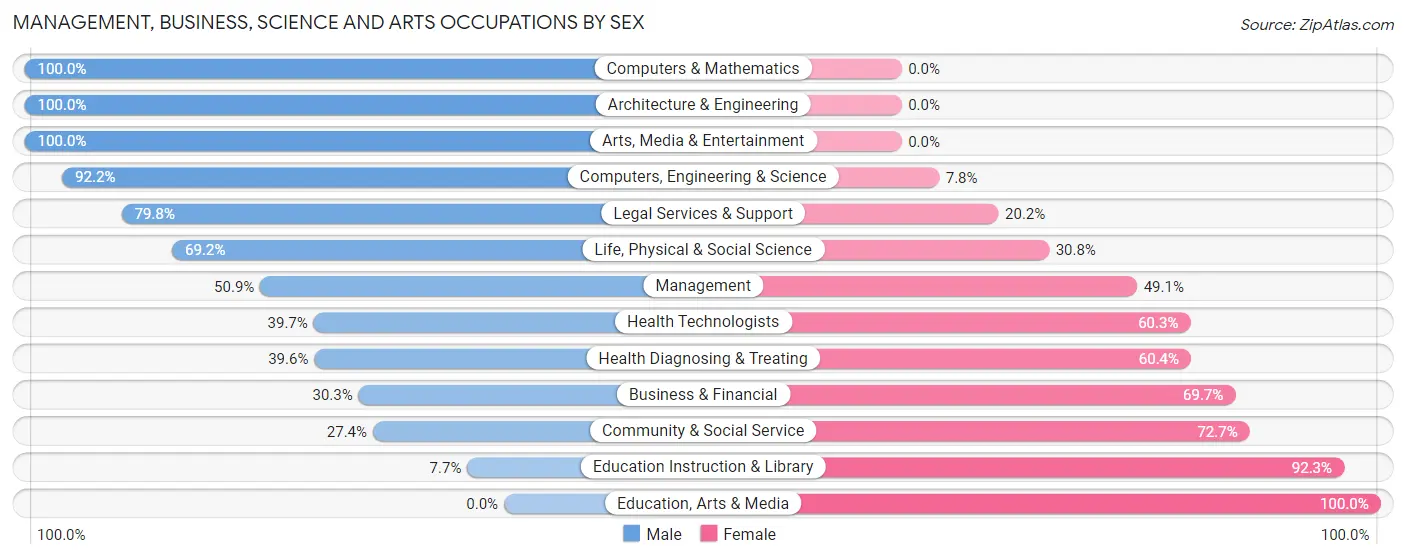
Management, Business, Science and Arts Occupations by Sex
Within the Management, Business, Science and Arts occupations in Hurley, the most male-oriented occupations are Computers & Mathematics (100.0%), Architecture & Engineering (100.0%), and Arts, Media & Entertainment (100.0%), while the most female-oriented occupations are Education, Arts & Media (100.0%), Education Instruction & Library (92.3%), and Community & Social Service (72.7%).
| Occupation | Male | Female |
| Management | 59 (50.9%) | 57 (49.1%) |
| Business & Financial | 27 (30.3%) | 62 (69.7%) |
| Computers, Engineering & Science | 47 (92.2%) | 4 (7.8%) |
| Computers & Mathematics | 20 (100.0%) | 0 (0.0%) |
| Architecture & Engineering | 18 (100.0%) | 0 (0.0%) |
| Life, Physical & Social Science | 9 (69.2%) | 4 (30.8%) |
| Community & Social Service | 122 (27.4%) | 324 (72.7%) |
| Education, Arts & Media | 0 (0.0%) | 101 (100.0%) |
| Legal Services & Support | 71 (79.8%) | 18 (20.2%) |
| Education Instruction & Library | 17 (7.7%) | 205 (92.3%) |
| Arts, Media & Entertainment | 34 (100.0%) | 0 (0.0%) |
| Health Diagnosing & Treating | 38 (39.6%) | 58 (60.4%) |
| Health Technologists | 27 (39.7%) | 41 (60.3%) |
| Total (Category) | 293 (36.7%) | 505 (63.3%) |
| Total (Overall) | 883 (49.7%) | 894 (50.3%) |
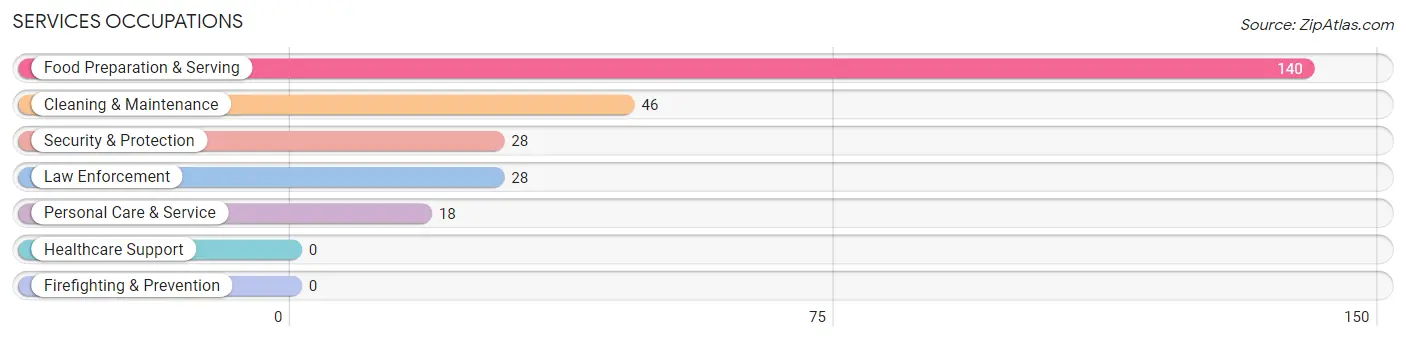
Services Occupations
The most common Services occupations in Hurley are Food Preparation & Serving (140 | 7.9%), Cleaning & Maintenance (46 | 2.6%), Security & Protection (28 | 1.6%), Law Enforcement (28 | 1.6%), and Personal Care & Service (18 | 1.0%).
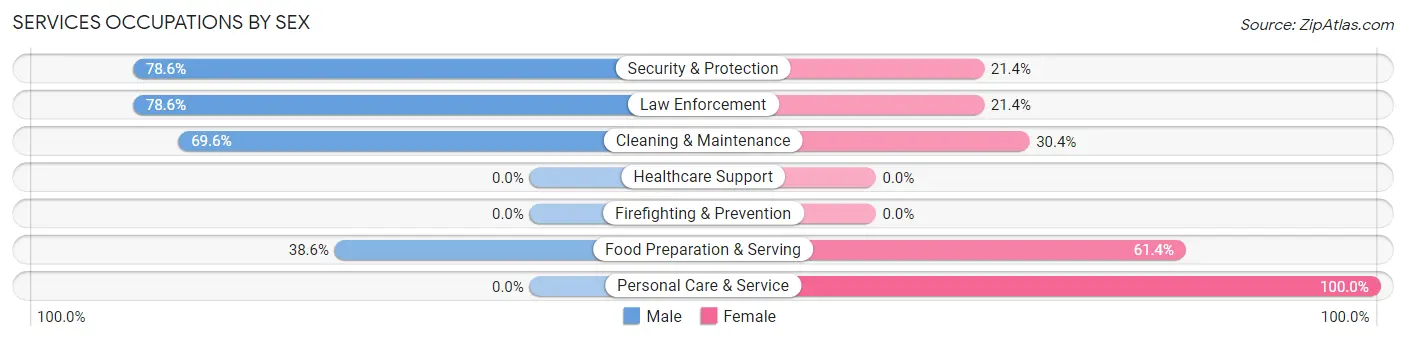
Services Occupations by Sex
Within the Services occupations in Hurley, the most male-oriented occupations are Security & Protection (78.6%), Law Enforcement (78.6%), and Cleaning & Maintenance (69.6%), while the most female-oriented occupations are Personal Care & Service (100.0%), Food Preparation & Serving (61.4%), and Cleaning & Maintenance (30.4%).
| Occupation | Male | Female |
| Healthcare Support | 0 (0.0%) | 0 (0.0%) |
| Security & Protection | 22 (78.6%) | 6 (21.4%) |
| Firefighting & Prevention | 0 (0.0%) | 0 (0.0%) |
| Law Enforcement | 22 (78.6%) | 6 (21.4%) |
| Food Preparation & Serving | 54 (38.6%) | 86 (61.4%) |
| Cleaning & Maintenance | 32 (69.6%) | 14 (30.4%) |
| Personal Care & Service | 0 (0.0%) | 18 (100.0%) |
| Total (Category) | 108 (46.6%) | 124 (53.4%) |
| Total (Overall) | 883 (49.7%) | 894 (50.3%) |
Sales and Office Occupations
The most common Sales and Office occupations in Hurley are Office & Administration (251 | 14.1%), and Sales & Related (116 | 6.5%).
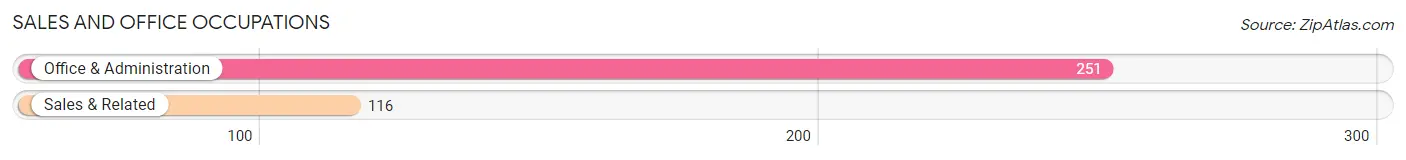
Sales and Office Occupations by Sex
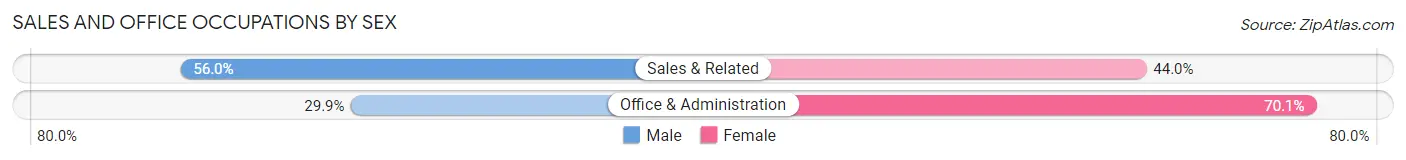
| Occupation | Male | Female |
| Sales & Related | 65 (56.0%) | 51 (44.0%) |
| Office & Administration | 75 (29.9%) | 176 (70.1%) |
| Total (Category) | 140 (38.2%) | 227 (61.9%) |
| Total (Overall) | 883 (49.7%) | 894 (50.3%) |
Natural Resources, Construction and Maintenance Occupations
The most common Natural Resources, Construction and Maintenance occupations in Hurley are Installation, Maintenance & Repair (165 | 9.3%), and Construction & Extraction (119 | 6.7%).
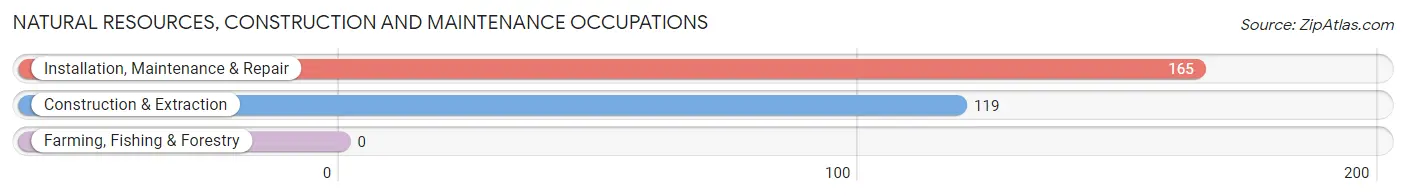
Natural Resources, Construction and Maintenance Occupations by Sex
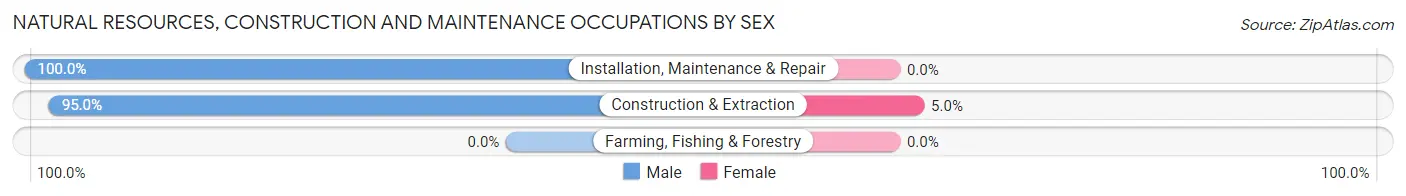
| Occupation | Male | Female |
| Farming, Fishing & Forestry | 0 (0.0%) | 0 (0.0%) |
| Construction & Extraction | 113 (95.0%) | 6 (5.0%) |
| Installation, Maintenance & Repair | 165 (100.0%) | 0 (0.0%) |
| Total (Category) | 278 (97.9%) | 6 (2.1%) |
| Total (Overall) | 883 (49.7%) | 894 (50.3%) |
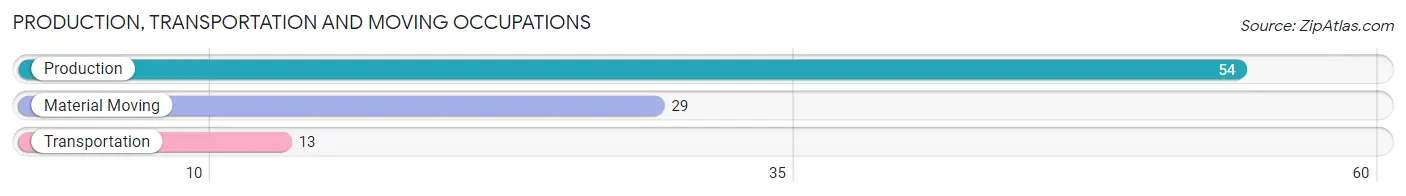
Production, Transportation and Moving Occupations
The most common Production, Transportation and Moving occupations in Hurley are Production (54 | 3.0%), Material Moving (29 | 1.6%), and Transportation (13 | 0.7%).
Production, Transportation and Moving Occupations by Sex
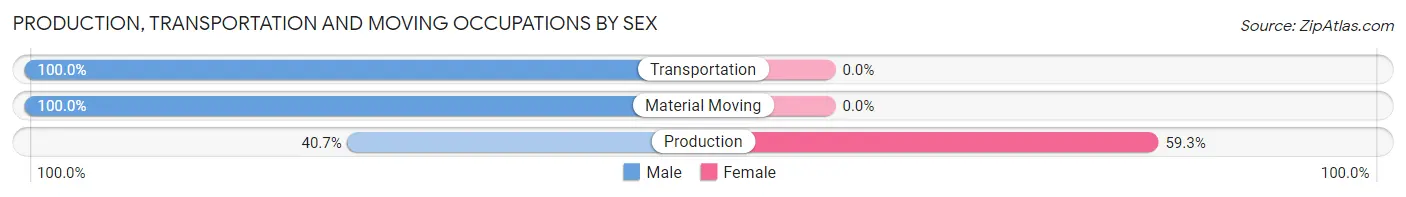
| Occupation | Male | Female |
| Production | 22 (40.7%) | 32 (59.3%) |
| Transportation | 13 (100.0%) | 0 (0.0%) |
| Material Moving | 29 (100.0%) | 0 (0.0%) |
| Total (Category) | 64 (66.7%) | 32 (33.3%) |
| Total (Overall) | 883 (49.7%) | 894 (50.3%) |
Employment Industries by Sex in Hurley
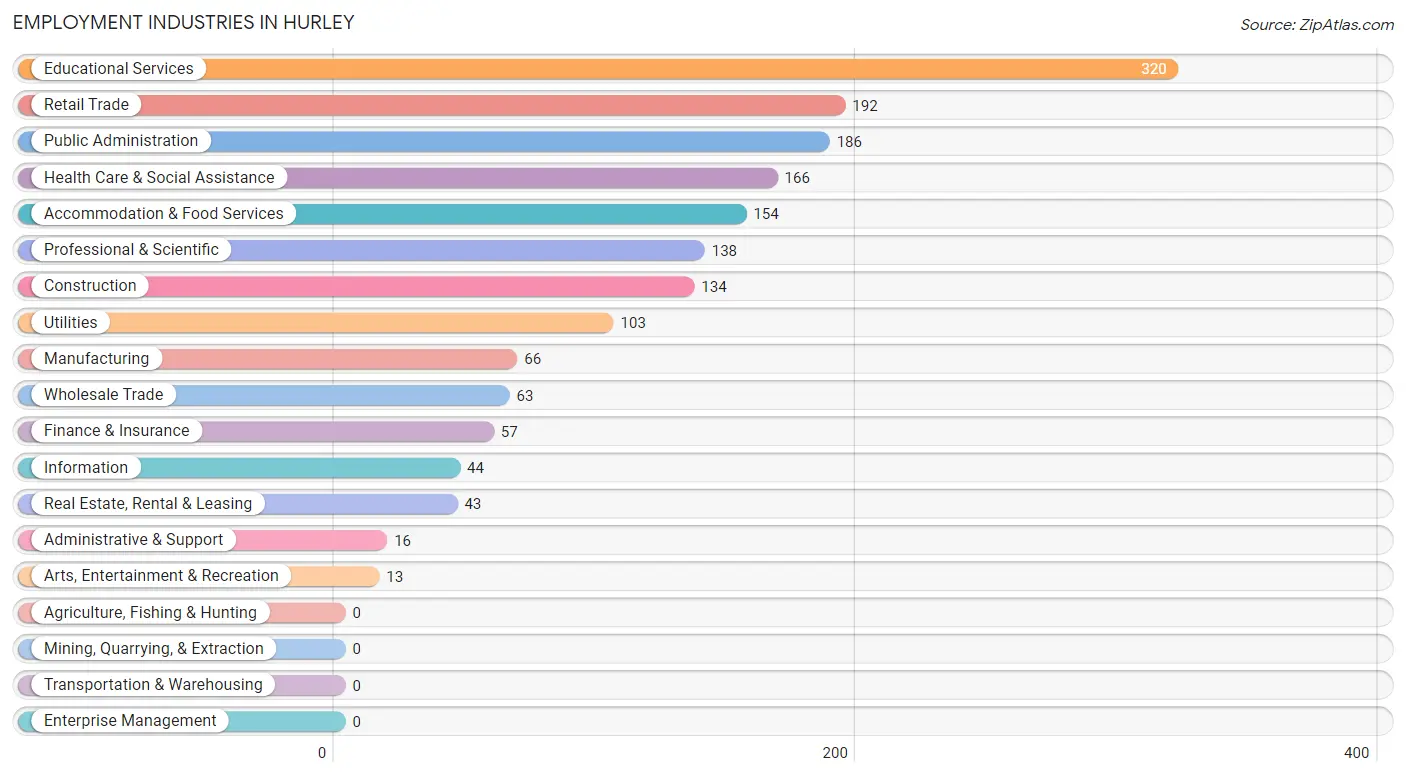
Employment Industries in Hurley
The major employment industries in Hurley include Educational Services (320 | 18.0%), Retail Trade (192 | 10.8%), Public Administration (186 | 10.5%), Health Care & Social Assistance (166 | 9.3%), and Accommodation & Food Services (154 | 8.7%).
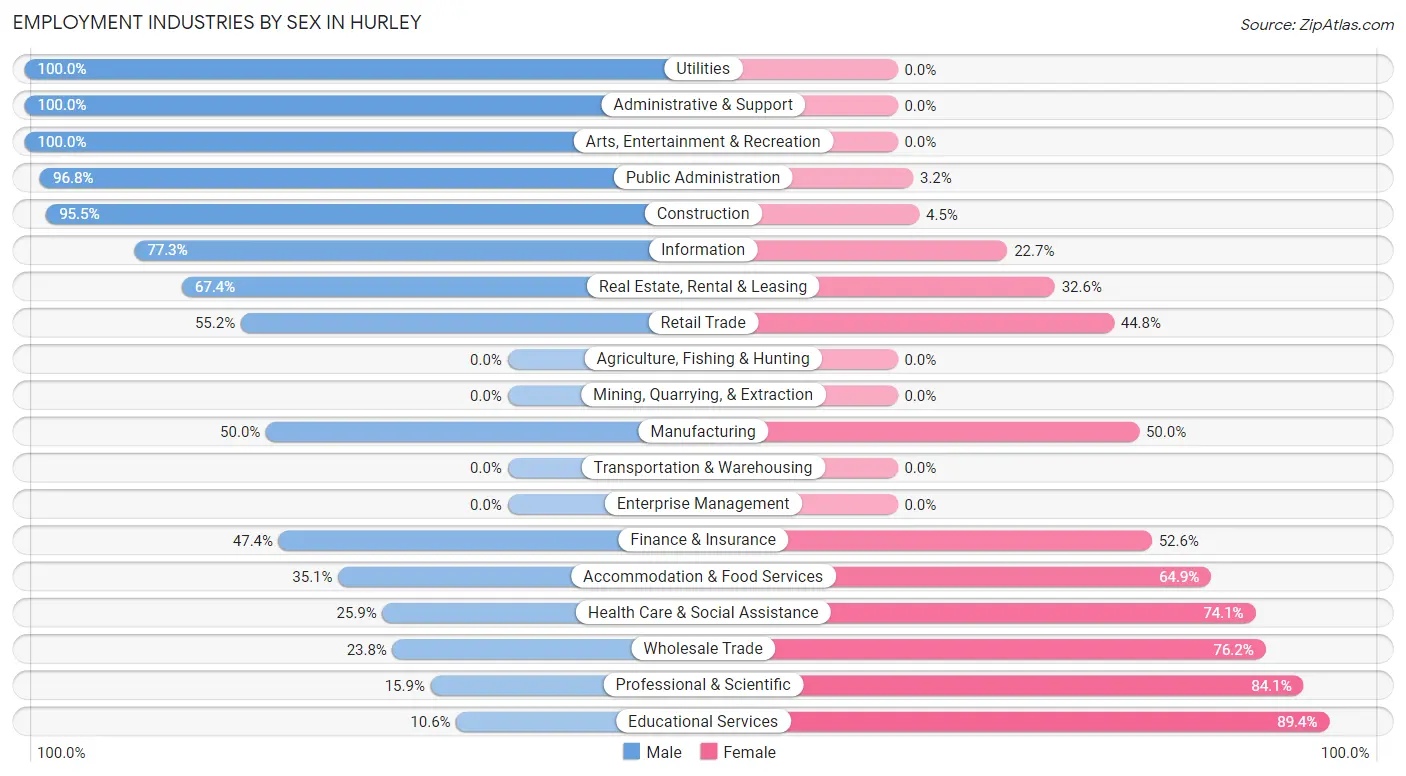
Employment Industries by Sex in Hurley
The Hurley industries that see more men than women are Utilities (100.0%), Administrative & Support (100.0%), and Arts, Entertainment & Recreation (100.0%), whereas the industries that tend to have a higher number of women are Educational Services (89.4%), Professional & Scientific (84.1%), and Wholesale Trade (76.2%).
| Industry | Male | Female |
| Agriculture, Fishing & Hunting | 0 (0.0%) | 0 (0.0%) |
| Mining, Quarrying, & Extraction | 0 (0.0%) | 0 (0.0%) |
| Construction | 128 (95.5%) | 6 (4.5%) |
| Manufacturing | 33 (50.0%) | 33 (50.0%) |
| Wholesale Trade | 15 (23.8%) | 48 (76.2%) |
| Retail Trade | 106 (55.2%) | 86 (44.8%) |
| Transportation & Warehousing | 0 (0.0%) | 0 (0.0%) |
| Utilities | 103 (100.0%) | 0 (0.0%) |
| Information | 34 (77.3%) | 10 (22.7%) |
| Finance & Insurance | 27 (47.4%) | 30 (52.6%) |
| Real Estate, Rental & Leasing | 29 (67.4%) | 14 (32.6%) |
| Professional & Scientific | 22 (15.9%) | 116 (84.1%) |
| Enterprise Management | 0 (0.0%) | 0 (0.0%) |
| Administrative & Support | 16 (100.0%) | 0 (0.0%) |
| Educational Services | 34 (10.6%) | 286 (89.4%) |
| Health Care & Social Assistance | 43 (25.9%) | 123 (74.1%) |
| Arts, Entertainment & Recreation | 13 (100.0%) | 0 (0.0%) |
| Accommodation & Food Services | 54 (35.1%) | 100 (64.9%) |
| Public Administration | 180 (96.8%) | 6 (3.2%) |
| Total | 883 (49.7%) | 894 (50.3%) |
Education in Hurley
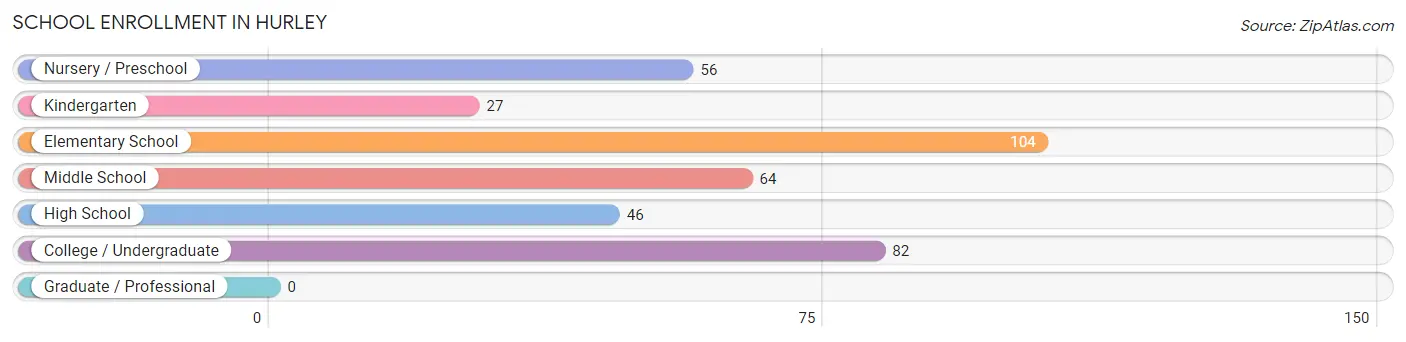
School Enrollment in Hurley
The most common levels of schooling among the 379 students in Hurley are elementary school (104 | 27.4%), college / undergraduate (82 | 21.6%), and middle school (64 | 16.9%).
| School Level | # Students | % Students |
| Nursery / Preschool | 56 | 14.8% |
| Kindergarten | 27 | 7.1% |
| Elementary School | 104 | 27.4% |
| Middle School | 64 | 16.9% |
| High School | 46 | 12.1% |
| College / Undergraduate | 82 | 21.6% |
| Graduate / Professional | 0 | 0.0% |
| Total | 379 | 100.0% |
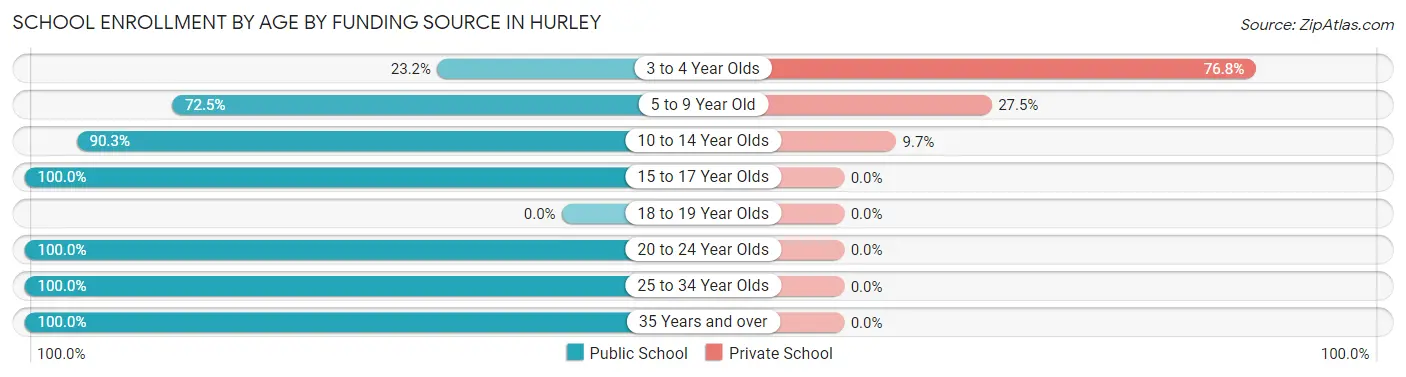
School Enrollment by Age by Funding Source in Hurley
Out of a total of 379 students who are enrolled in schools in Hurley, 88 (23.2%) attend a private institution, while the remaining 291 (76.8%) are enrolled in public schools. The age group of 3 to 4 year olds has the highest likelihood of being enrolled in private schools, with 43 (76.8% in the age bracket) enrolled. Conversely, the age group of 15 to 17 year olds has the lowest likelihood of being enrolled in a private school, with 17 (100.0% in the age bracket) attending a public institution.
| Age Bracket | Public School | Private School |
| 3 to 4 Year Olds | 13 (23.2%) | 43 (76.8%) |
| 5 to 9 Year Old | 95 (72.5%) | 36 (27.5%) |
| 10 to 14 Year Olds | 84 (90.3%) | 9 (9.7%) |
| 15 to 17 Year Olds | 17 (100.0%) | 0 (0.0%) |
| 18 to 19 Year Olds | 0 (0.0%) | 0 (0.0%) |
| 20 to 24 Year Olds | 43 (100.0%) | 0 (0.0%) |
| 25 to 34 Year Olds | 27 (100.0%) | 0 (0.0%) |
| 35 Years and over | 12 (100.0%) | 0 (0.0%) |
| Total | 291 (76.8%) | 88 (23.2%) |
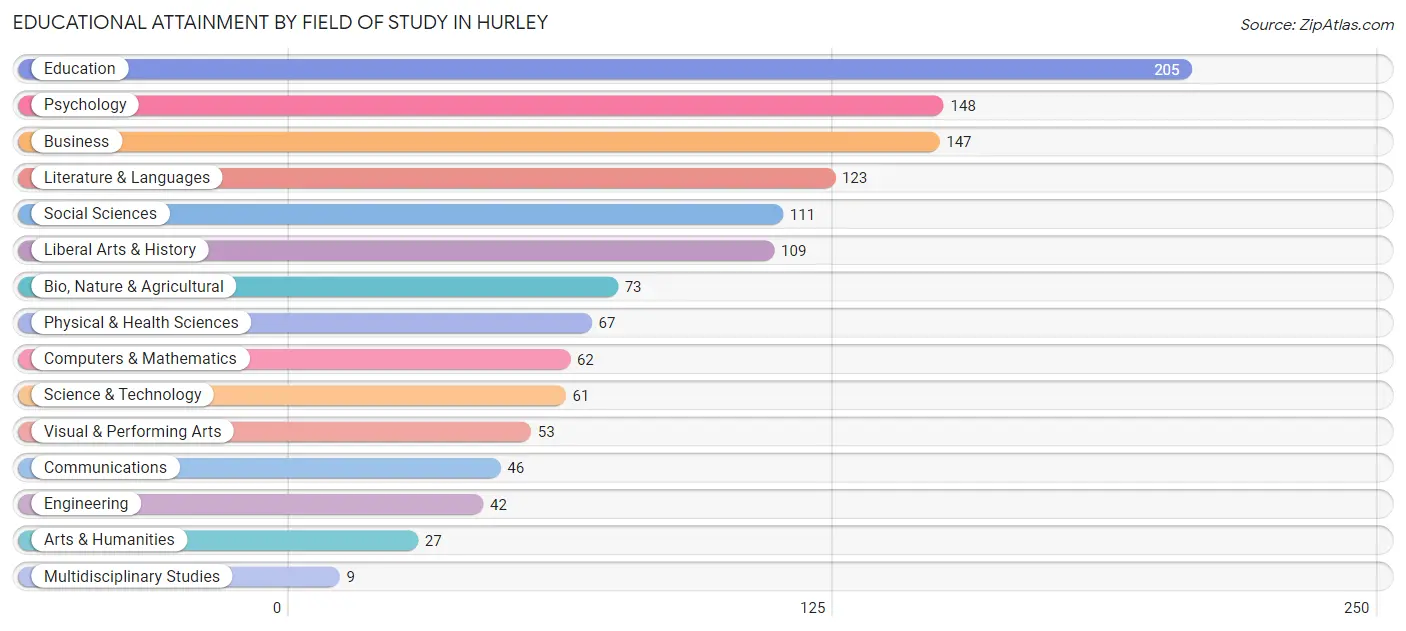
Educational Attainment by Field of Study in Hurley
Education (205 | 16.0%), psychology (148 | 11.5%), business (147 | 11.5%), literature & languages (123 | 9.6%), and social sciences (111 | 8.6%) are the most common fields of study among 1,283 individuals in Hurley who have obtained a bachelor's degree or higher.
| Field of Study | # Graduates | % Graduates |
| Computers & Mathematics | 62 | 4.8% |
| Bio, Nature & Agricultural | 73 | 5.7% |
| Physical & Health Sciences | 67 | 5.2% |
| Psychology | 148 | 11.5% |
| Social Sciences | 111 | 8.6% |
| Engineering | 42 | 3.3% |
| Multidisciplinary Studies | 9 | 0.7% |
| Science & Technology | 61 | 4.8% |
| Business | 147 | 11.5% |
| Education | 205 | 16.0% |
| Literature & Languages | 123 | 9.6% |
| Liberal Arts & History | 109 | 8.5% |
| Visual & Performing Arts | 53 | 4.1% |
| Communications | 46 | 3.6% |
| Arts & Humanities | 27 | 2.1% |
| Total | 1,283 | 100.0% |
Transportation & Commute in Hurley
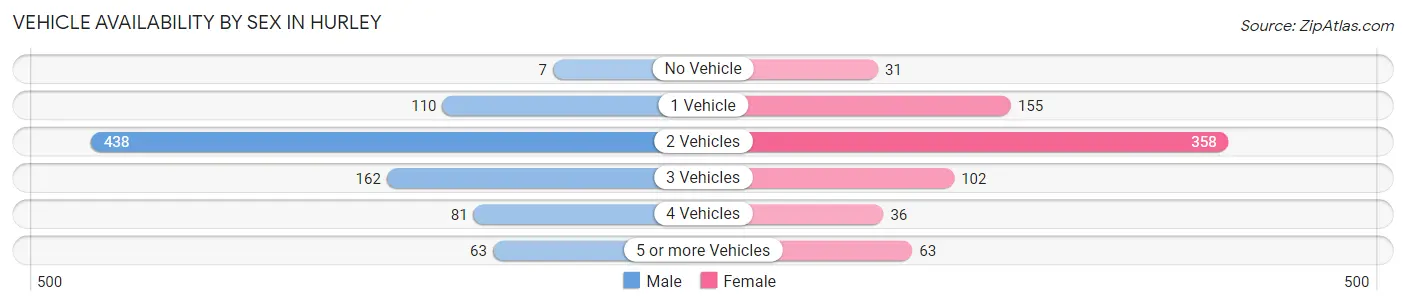
Vehicle Availability by Sex in Hurley
The most prevalent vehicle ownership categories in Hurley are males with 2 vehicles (438, accounting for 50.9%) and females with 2 vehicles (358, making up 58.8%).
| Vehicles Available | Male | Female |
| No Vehicle | 7 (0.8%) | 31 (4.2%) |
| 1 Vehicle | 110 (12.8%) | 155 (20.8%) |
| 2 Vehicles | 438 (50.9%) | 358 (48.0%) |
| 3 Vehicles | 162 (18.8%) | 102 (13.7%) |
| 4 Vehicles | 81 (9.4%) | 36 (4.8%) |
| 5 or more Vehicles | 63 (7.3%) | 63 (8.5%) |
| Total | 861 (100.0%) | 745 (100.0%) |
Commute Time in Hurley
The most frequently occuring commute durations in Hurley are 15 to 19 minutes (443 commuters, 31.4%), 10 to 14 minutes (225 commuters, 15.9%), and 20 to 24 minutes (177 commuters, 12.5%).
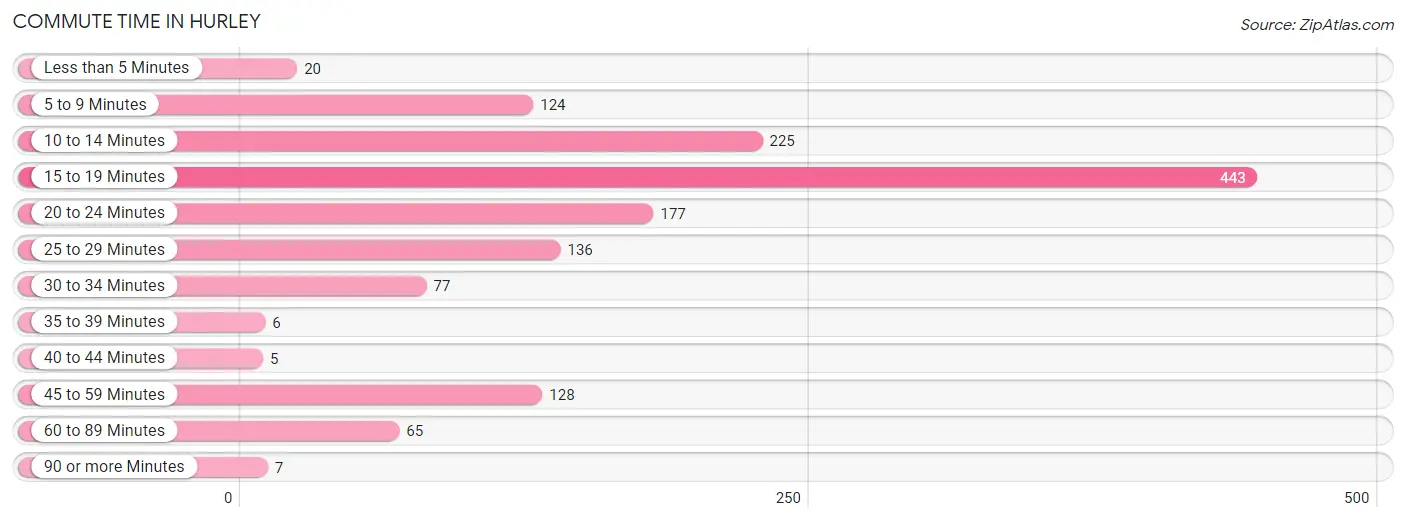
| Commute Time | # Commuters | % Commuters |
| Less than 5 Minutes | 20 | 1.4% |
| 5 to 9 Minutes | 124 | 8.8% |
| 10 to 14 Minutes | 225 | 15.9% |
| 15 to 19 Minutes | 443 | 31.4% |
| 20 to 24 Minutes | 177 | 12.5% |
| 25 to 29 Minutes | 136 | 9.6% |
| 30 to 34 Minutes | 77 | 5.4% |
| 35 to 39 Minutes | 6 | 0.4% |
| 40 to 44 Minutes | 5 | 0.4% |
| 45 to 59 Minutes | 128 | 9.1% |
| 60 to 89 Minutes | 65 | 4.6% |
| 90 or more Minutes | 7 | 0.5% |
Commute Time by Sex in Hurley
The most common commute times in Hurley are 15 to 19 minutes (261 commuters, 33.8%) for males and 15 to 19 minutes (182 commuters, 28.4%) for females.
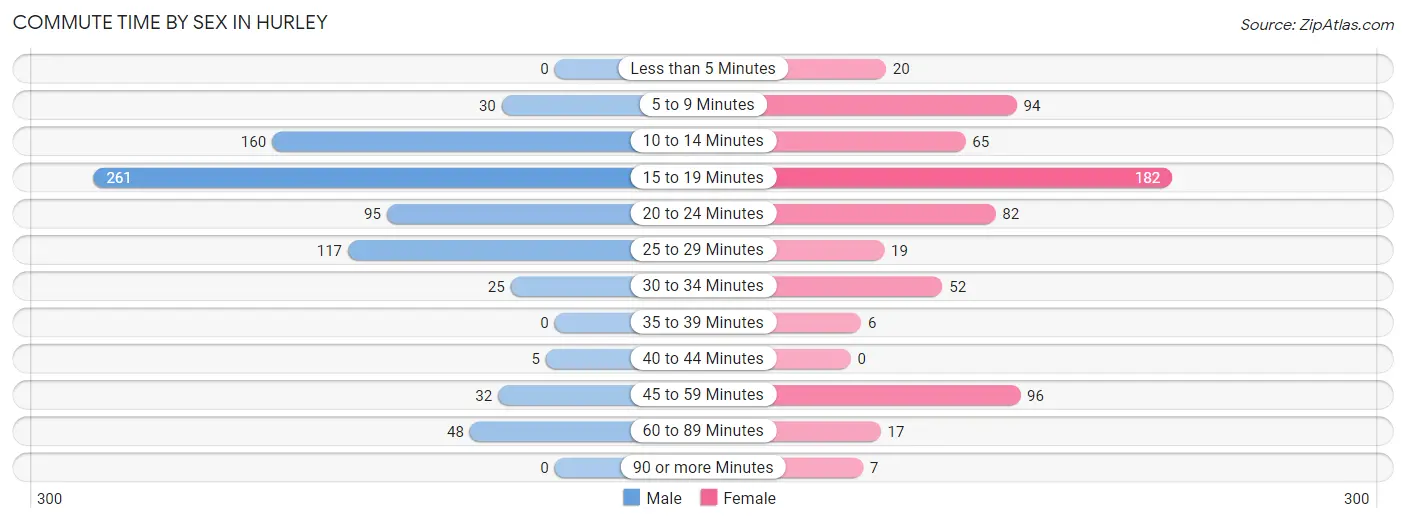
| Commute Time | Male | Female |
| Less than 5 Minutes | 0 (0.0%) | 20 (3.1%) |
| 5 to 9 Minutes | 30 (3.9%) | 94 (14.7%) |
| 10 to 14 Minutes | 160 (20.7%) | 65 (10.2%) |
| 15 to 19 Minutes | 261 (33.8%) | 182 (28.4%) |
| 20 to 24 Minutes | 95 (12.3%) | 82 (12.8%) |
| 25 to 29 Minutes | 117 (15.1%) | 19 (3.0%) |
| 30 to 34 Minutes | 25 (3.2%) | 52 (8.1%) |
| 35 to 39 Minutes | 0 (0.0%) | 6 (0.9%) |
| 40 to 44 Minutes | 5 (0.6%) | 0 (0.0%) |
| 45 to 59 Minutes | 32 (4.1%) | 96 (15.0%) |
| 60 to 89 Minutes | 48 (6.2%) | 17 (2.7%) |
| 90 or more Minutes | 0 (0.0%) | 7 (1.1%) |
Time of Departure to Work by Sex in Hurley
The most frequent times of departure to work in Hurley are 6:30 AM to 6:59 AM (139, 18.0%) for males and 7:00 AM to 7:29 AM (155, 24.2%) for females.
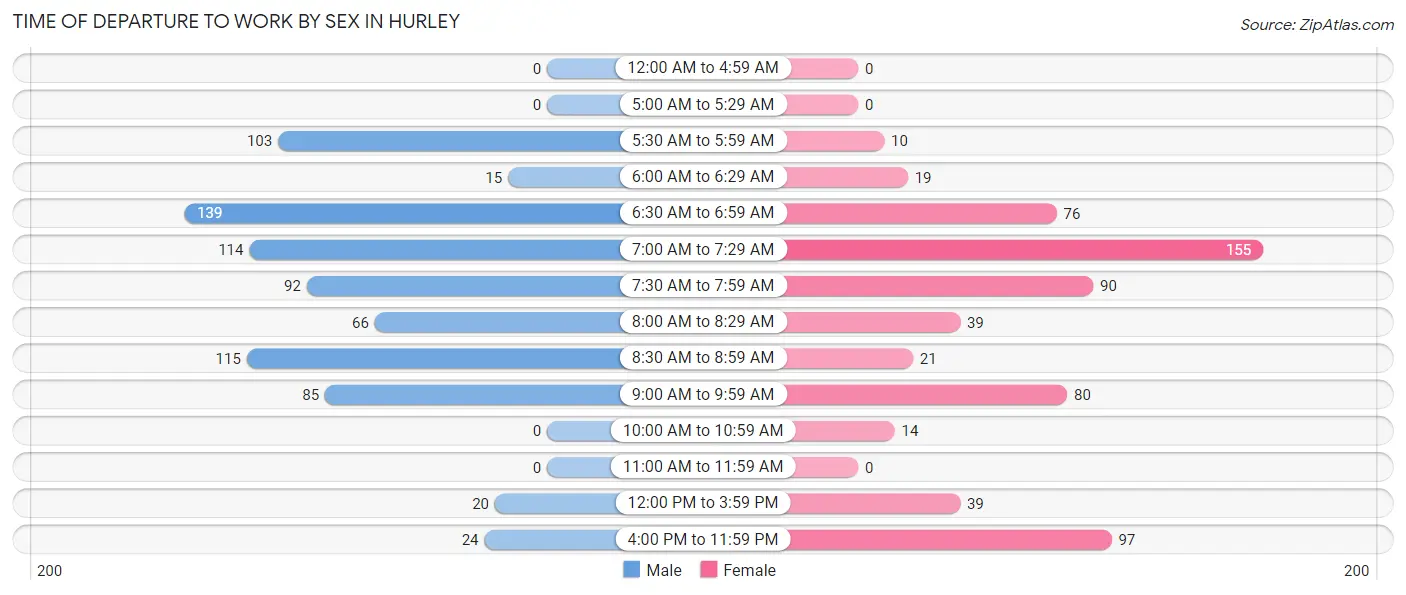
| Time of Departure | Male | Female |
| 12:00 AM to 4:59 AM | 0 (0.0%) | 0 (0.0%) |
| 5:00 AM to 5:29 AM | 0 (0.0%) | 0 (0.0%) |
| 5:30 AM to 5:59 AM | 103 (13.3%) | 10 (1.6%) |
| 6:00 AM to 6:29 AM | 15 (1.9%) | 19 (3.0%) |
| 6:30 AM to 6:59 AM | 139 (18.0%) | 76 (11.9%) |
| 7:00 AM to 7:29 AM | 114 (14.7%) | 155 (24.2%) |
| 7:30 AM to 7:59 AM | 92 (11.9%) | 90 (14.1%) |
| 8:00 AM to 8:29 AM | 66 (8.5%) | 39 (6.1%) |
| 8:30 AM to 8:59 AM | 115 (14.9%) | 21 (3.3%) |
| 9:00 AM to 9:59 AM | 85 (11.0%) | 80 (12.5%) |
| 10:00 AM to 10:59 AM | 0 (0.0%) | 14 (2.2%) |
| 11:00 AM to 11:59 AM | 0 (0.0%) | 0 (0.0%) |
| 12:00 PM to 3:59 PM | 20 (2.6%) | 39 (6.1%) |
| 4:00 PM to 11:59 PM | 24 (3.1%) | 97 (15.2%) |
| Total | 773 (100.0%) | 640 (100.0%) |
Housing Occupancy in Hurley
Occupancy by Ownership in Hurley
Of the total 1,473 dwellings in Hurley, owner-occupied units account for 1,377 (93.5%), while renter-occupied units make up 96 (6.5%).
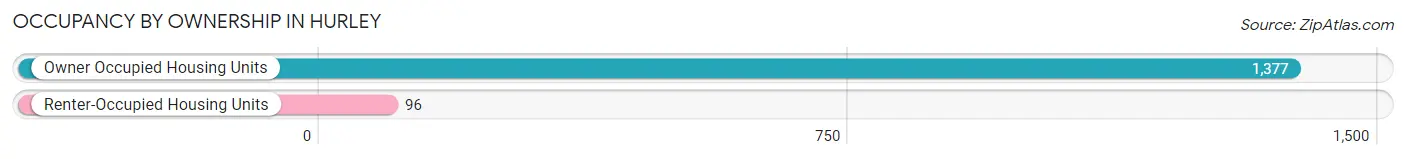
| Occupancy | # Housing Units | % Housing Units |
| Owner Occupied Housing Units | 1,377 | 93.5% |
| Renter-Occupied Housing Units | 96 | 6.5% |
| Total Occupied Housing Units | 1,473 | 100.0% |
Occupancy by Household Size in Hurley
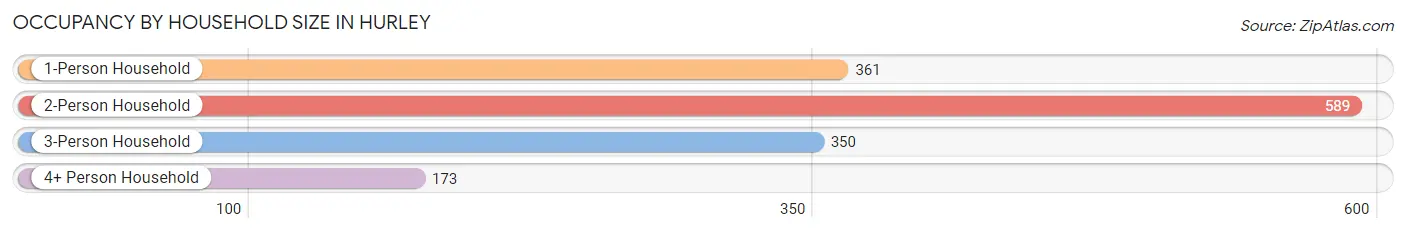
| Household Size | # Housing Units | % Housing Units |
| 1-Person Household | 361 | 24.5% |
| 2-Person Household | 589 | 40.0% |
| 3-Person Household | 350 | 23.8% |
| 4+ Person Household | 173 | 11.7% |
| Total Housing Units | 1,473 | 100.0% |
Occupancy by Ownership by Household Size in Hurley
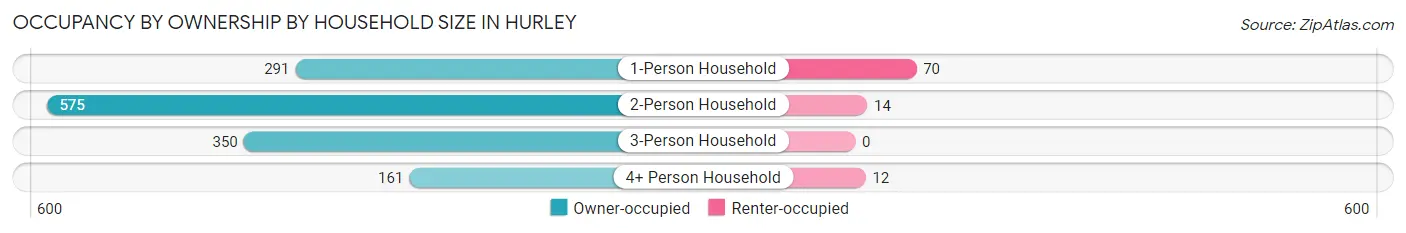
| Household Size | Owner-occupied | Renter-occupied |
| 1-Person Household | 291 (80.6%) | 70 (19.4%) |
| 2-Person Household | 575 (97.6%) | 14 (2.4%) |
| 3-Person Household | 350 (100.0%) | 0 (0.0%) |
| 4+ Person Household | 161 (93.1%) | 12 (6.9%) |
| Total Housing Units | 1,377 (93.5%) | 96 (6.5%) |
Occupancy by Educational Attainment in Hurley
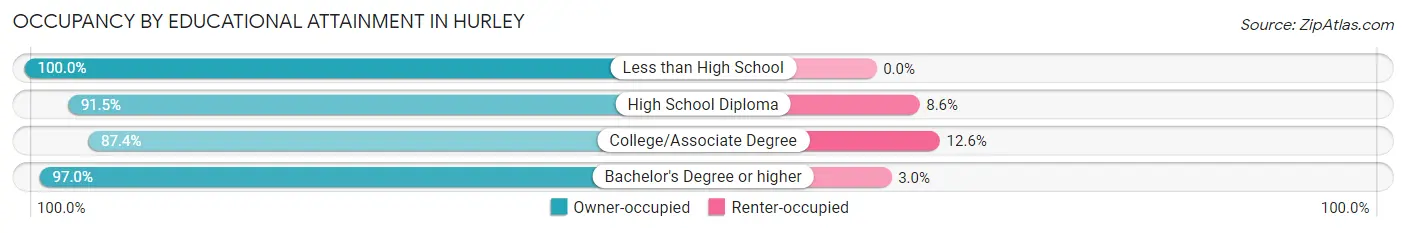
| Household Size | Owner-occupied | Renter-occupied |
| Less than High School | 35 (100.0%) | 0 (0.0%) |
| High School Diploma | 246 (91.4%) | 23 (8.6%) |
| College/Associate Degree | 347 (87.4%) | 50 (12.6%) |
| Bachelor's Degree or higher | 749 (97.0%) | 23 (3.0%) |
Occupancy by Age of Householder in Hurley
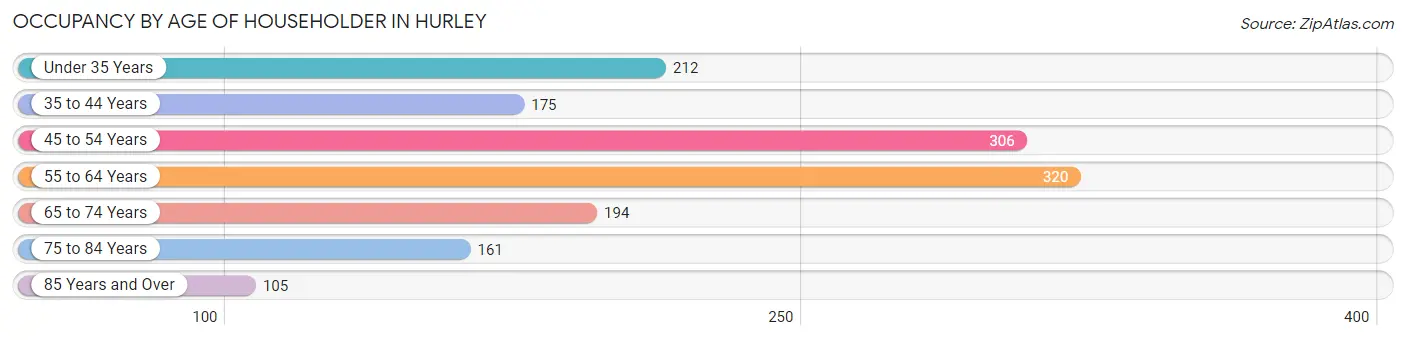
| Age Bracket | # Households | % Households |
| Under 35 Years | 212 | 14.4% |
| 35 to 44 Years | 175 | 11.9% |
| 45 to 54 Years | 306 | 20.8% |
| 55 to 64 Years | 320 | 21.7% |
| 65 to 74 Years | 194 | 13.2% |
| 75 to 84 Years | 161 | 10.9% |
| 85 Years and Over | 105 | 7.1% |
| Total | 1,473 | 100.0% |
Housing Finances in Hurley
Median Income by Occupancy in Hurley
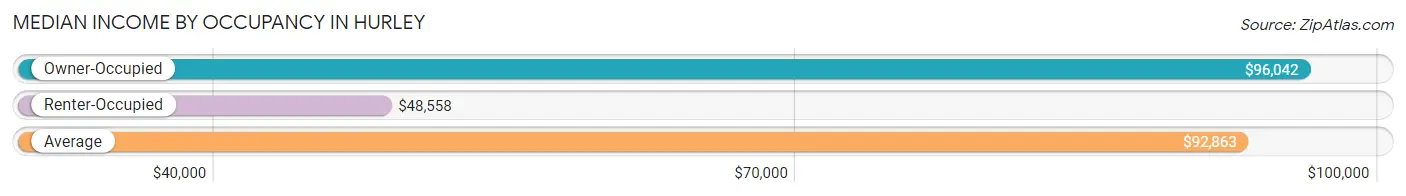
| Occupancy Type | # Households | Median Income |
| Owner-Occupied | 1,377 (93.5%) | $96,042 |
| Renter-Occupied | 96 (6.5%) | $48,558 |
| Average | 1,473 (100.0%) | $92,863 |
Occupancy by Householder Income Bracket in Hurley
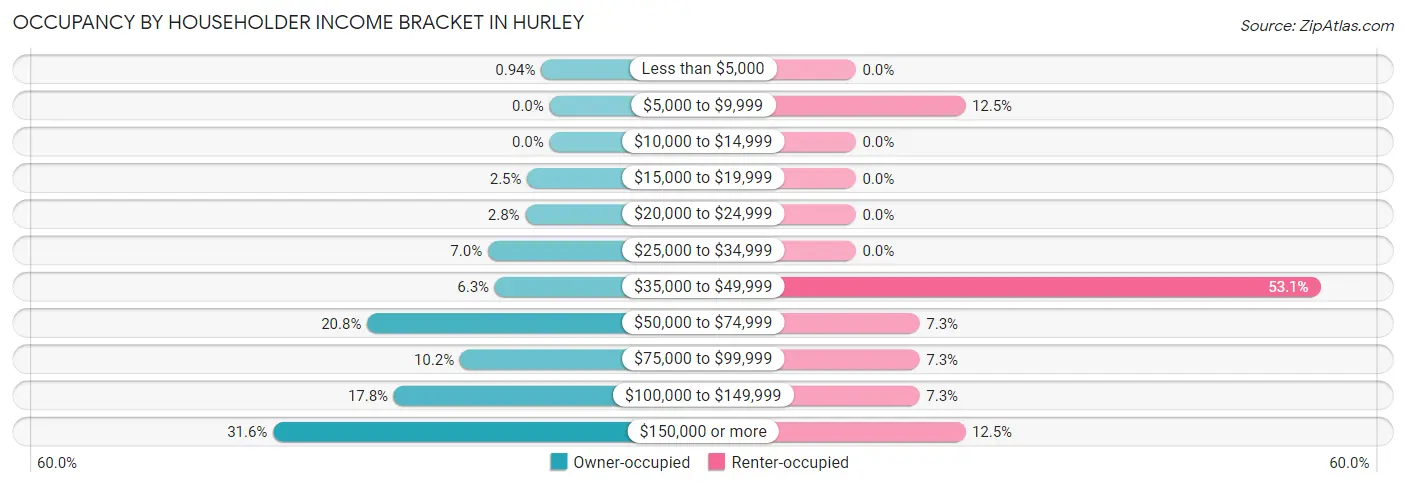
| Income Bracket | Owner-occupied | Renter-occupied |
| Less than $5,000 | 13 (0.9%) | 0 (0.0%) |
| $5,000 to $9,999 | 0 (0.0%) | 12 (12.5%) |
| $10,000 to $14,999 | 0 (0.0%) | 0 (0.0%) |
| $15,000 to $19,999 | 35 (2.5%) | 0 (0.0%) |
| $20,000 to $24,999 | 38 (2.8%) | 0 (0.0%) |
| $25,000 to $34,999 | 97 (7.0%) | 0 (0.0%) |
| $35,000 to $49,999 | 86 (6.2%) | 51 (53.1%) |
| $50,000 to $74,999 | 287 (20.8%) | 7 (7.3%) |
| $75,000 to $99,999 | 141 (10.2%) | 7 (7.3%) |
| $100,000 to $149,999 | 245 (17.8%) | 7 (7.3%) |
| $150,000 or more | 435 (31.6%) | 12 (12.5%) |
| Total | 1,377 (100.0%) | 96 (100.0%) |
Monthly Housing Cost Tiers in Hurley
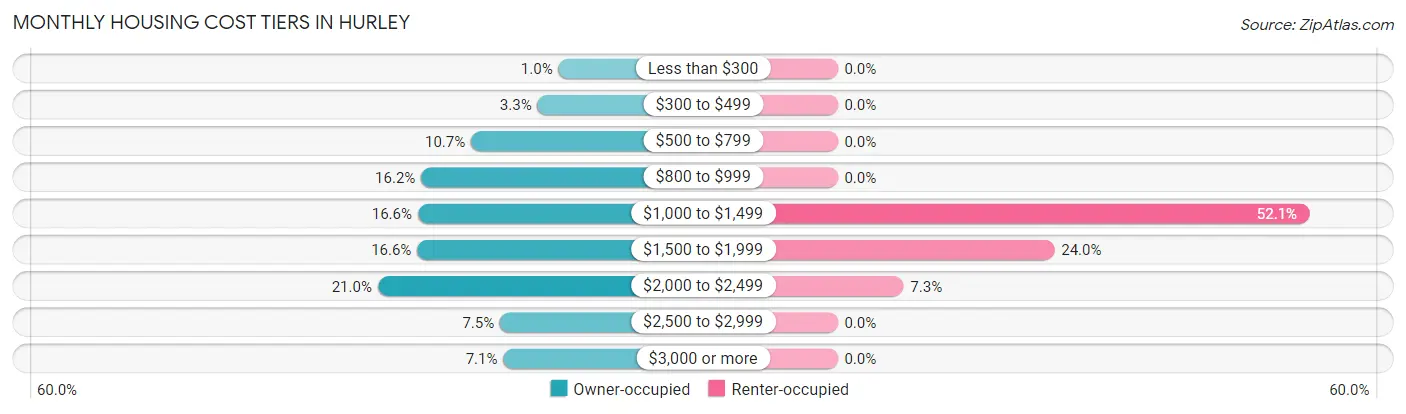
| Monthly Cost | Owner-occupied | Renter-occupied |
| Less than $300 | 14 (1.0%) | 0 (0.0%) |
| $300 to $499 | 46 (3.3%) | 0 (0.0%) |
| $500 to $799 | 147 (10.7%) | 0 (0.0%) |
| $800 to $999 | 223 (16.2%) | 0 (0.0%) |
| $1,000 to $1,499 | 228 (16.6%) | 50 (52.1%) |
| $1,500 to $1,999 | 229 (16.6%) | 23 (24.0%) |
| $2,000 to $2,499 | 289 (21.0%) | 7 (7.3%) |
| $2,500 to $2,999 | 103 (7.5%) | 0 (0.0%) |
| $3,000 or more | 98 (7.1%) | 0 (0.0%) |
| Total | 1,377 (100.0%) | 96 (100.0%) |
Physical Housing Characteristics in Hurley
Housing Structures in Hurley
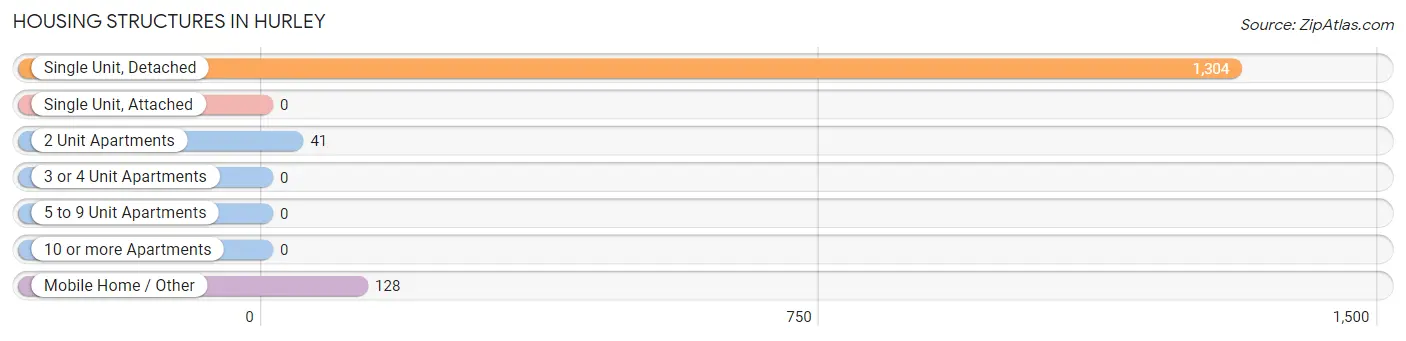
| Structure Type | # Housing Units | % Housing Units |
| Single Unit, Detached | 1,304 | 88.5% |
| Single Unit, Attached | 0 | 0.0% |
| 2 Unit Apartments | 41 | 2.8% |
| 3 or 4 Unit Apartments | 0 | 0.0% |
| 5 to 9 Unit Apartments | 0 | 0.0% |
| 10 or more Apartments | 0 | 0.0% |
| Mobile Home / Other | 128 | 8.7% |
| Total | 1,473 | 100.0% |
Housing Structures by Occupancy in Hurley
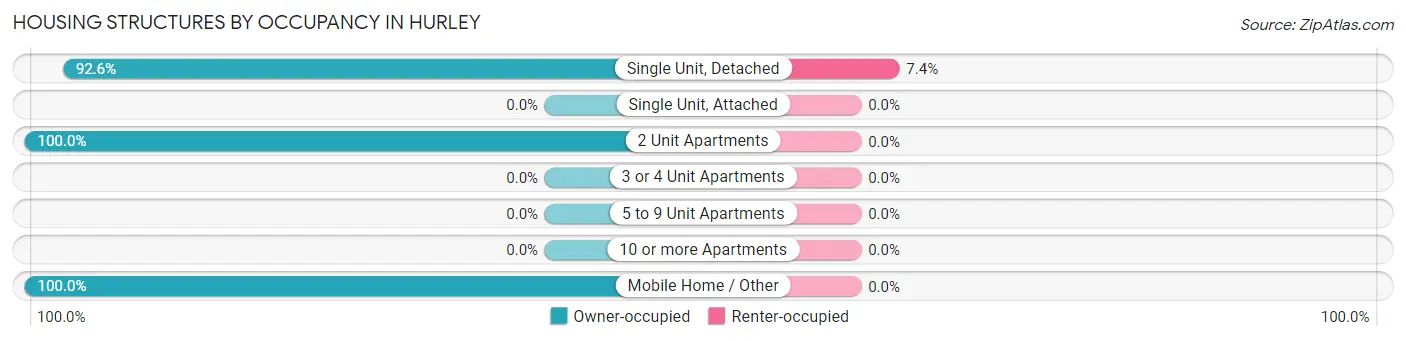
| Structure Type | Owner-occupied | Renter-occupied |
| Single Unit, Detached | 1,208 (92.6%) | 96 (7.4%) |
| Single Unit, Attached | 0 (0.0%) | 0 (0.0%) |
| 2 Unit Apartments | 41 (100.0%) | 0 (0.0%) |
| 3 or 4 Unit Apartments | 0 (0.0%) | 0 (0.0%) |
| 5 to 9 Unit Apartments | 0 (0.0%) | 0 (0.0%) |
| 10 or more Apartments | 0 (0.0%) | 0 (0.0%) |
| Mobile Home / Other | 128 (100.0%) | 0 (0.0%) |
| Total | 1,377 (93.5%) | 96 (6.5%) |
Housing Structures by Number of Rooms in Hurley
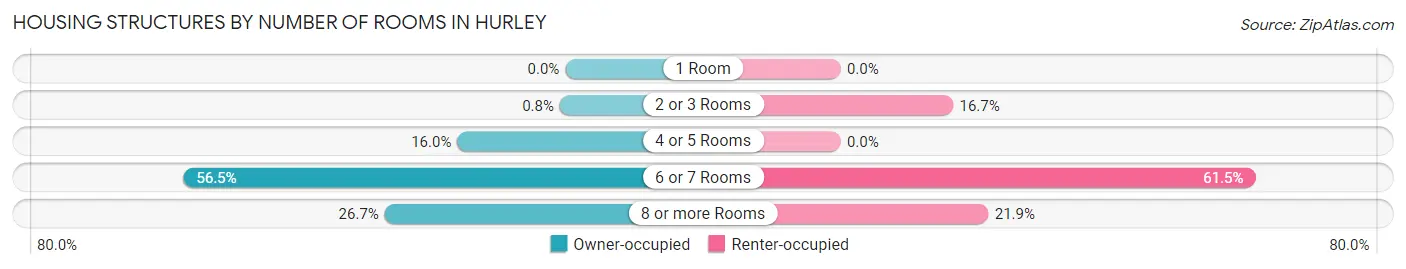
| Number of Rooms | Owner-occupied | Renter-occupied |
| 1 Room | 0 (0.0%) | 0 (0.0%) |
| 2 or 3 Rooms | 11 (0.8%) | 16 (16.7%) |
| 4 or 5 Rooms | 220 (16.0%) | 0 (0.0%) |
| 6 or 7 Rooms | 778 (56.5%) | 59 (61.5%) |
| 8 or more Rooms | 368 (26.7%) | 21 (21.9%) |
| Total | 1,377 (100.0%) | 96 (100.0%) |
Housing Structure by Heating Type in Hurley
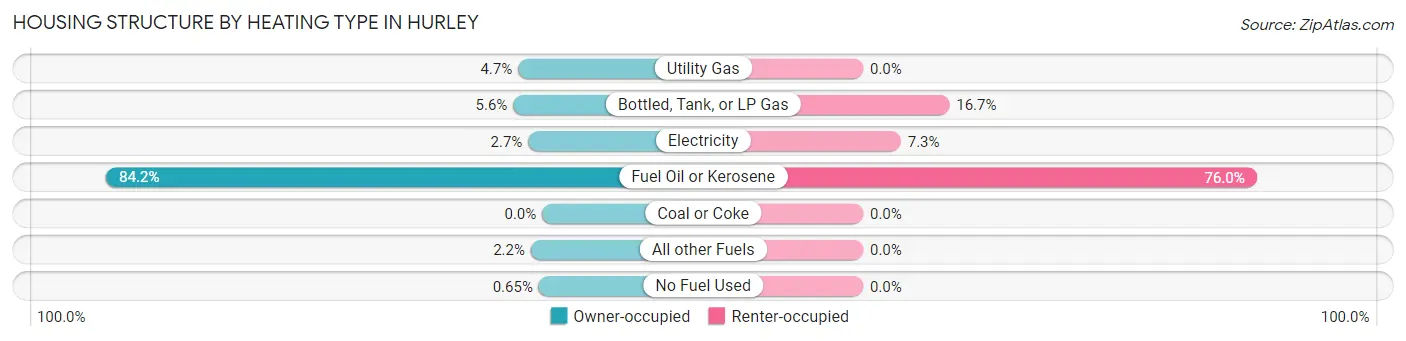
| Heating Type | Owner-occupied | Renter-occupied |
| Utility Gas | 64 (4.6%) | 0 (0.0%) |
| Bottled, Tank, or LP Gas | 77 (5.6%) | 16 (16.7%) |
| Electricity | 37 (2.7%) | 7 (7.3%) |
| Fuel Oil or Kerosene | 1,160 (84.2%) | 73 (76.0%) |
| Coal or Coke | 0 (0.0%) | 0 (0.0%) |
| All other Fuels | 30 (2.2%) | 0 (0.0%) |
| No Fuel Used | 9 (0.6%) | 0 (0.0%) |
| Total | 1,377 (100.0%) | 96 (100.0%) |
Household Vehicle Usage in Hurley
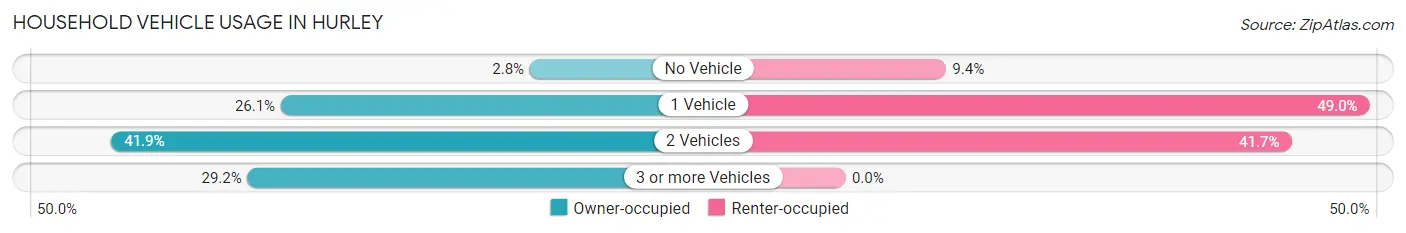
| Vehicles per Household | Owner-occupied | Renter-occupied |
| No Vehicle | 39 (2.8%) | 9 (9.4%) |
| 1 Vehicle | 359 (26.1%) | 47 (49.0%) |
| 2 Vehicles | 577 (41.9%) | 40 (41.7%) |
| 3 or more Vehicles | 402 (29.2%) | 0 (0.0%) |
| Total | 1,377 (100.0%) | 96 (100.0%) |
Real Estate & Mortgages in Hurley
Real Estate and Mortgage Overview in Hurley
| Characteristic | Without Mortgage | With Mortgage |
| Housing Units | 635 | 742 |
| Median Property Value | $233,800 | $315,400 |
| Median Household Income | $64,217 | $356 |
| Monthly Housing Costs | $939 | $98 |
| Real Estate Taxes | $5,340 | $10 |
Property Value by Mortgage Status in Hurley
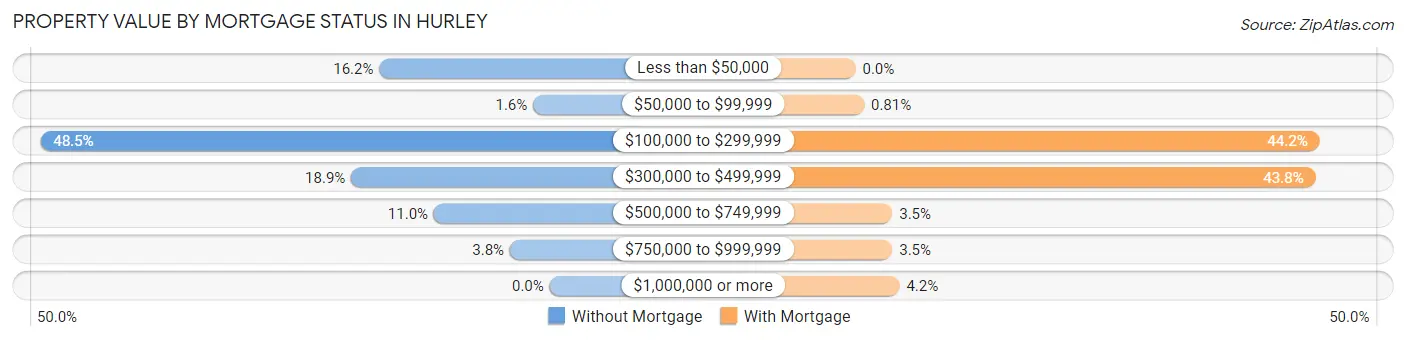
| Property Value | Without Mortgage | With Mortgage |
| Less than $50,000 | 103 (16.2%) | 0 (0.0%) |
| $50,000 to $99,999 | 10 (1.6%) | 6 (0.8%) |
| $100,000 to $299,999 | 308 (48.5%) | 328 (44.2%) |
| $300,000 to $499,999 | 120 (18.9%) | 325 (43.8%) |
| $500,000 to $749,999 | 70 (11.0%) | 26 (3.5%) |
| $750,000 to $999,999 | 24 (3.8%) | 26 (3.5%) |
| $1,000,000 or more | 0 (0.0%) | 31 (4.2%) |
| Total | 635 (100.0%) | 742 (100.0%) |
Household Income by Mortgage Status in Hurley
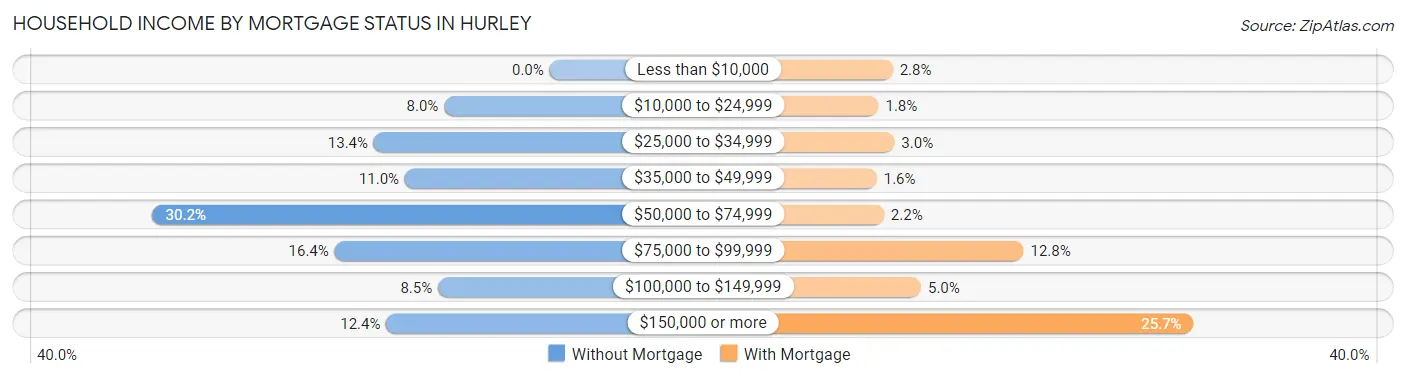
| Household Income | Without Mortgage | With Mortgage |
| Less than $10,000 | 0 (0.0%) | 21 (2.8%) |
| $10,000 to $24,999 | 51 (8.0%) | 13 (1.8%) |
| $25,000 to $34,999 | 85 (13.4%) | 22 (3.0%) |
| $35,000 to $49,999 | 70 (11.0%) | 12 (1.6%) |
| $50,000 to $74,999 | 192 (30.2%) | 16 (2.2%) |
| $75,000 to $99,999 | 104 (16.4%) | 95 (12.8%) |
| $100,000 to $149,999 | 54 (8.5%) | 37 (5.0%) |
| $150,000 or more | 79 (12.4%) | 191 (25.7%) |
| Total | 635 (100.0%) | 742 (100.0%) |
Property Value to Household Income Ratio in Hurley
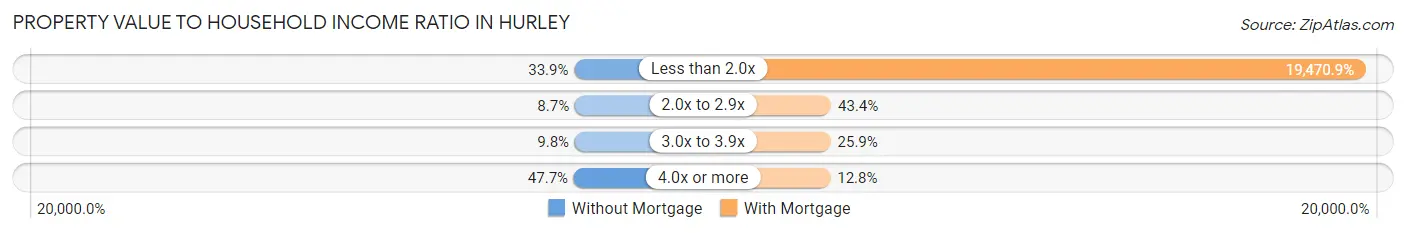
| Value-to-Income Ratio | Without Mortgage | With Mortgage |
| Less than 2.0x | 215 (33.9%) | 144,474 (19,470.9%) |
| 2.0x to 2.9x | 55 (8.7%) | 322 (43.4%) |
| 3.0x to 3.9x | 62 (9.8%) | 192 (25.9%) |
| 4.0x or more | 303 (47.7%) | 95 (12.8%) |
| Total | 635 (100.0%) | 742 (100.0%) |
Real Estate Taxes by Mortgage Status in Hurley
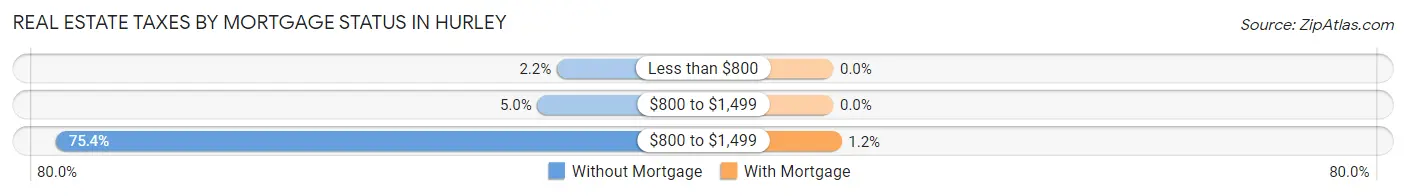
| Property Taxes | Without Mortgage | With Mortgage |
| Less than $800 | 14 (2.2%) | 0 (0.0%) |
| $800 to $1,499 | 32 (5.0%) | 0 (0.0%) |
| $800 to $1,499 | 479 (75.4%) | 9 (1.2%) |
| Total | 635 (100.0%) | 742 (100.0%) |
Health & Disability in Hurley
Health Insurance Coverage by Age in Hurley
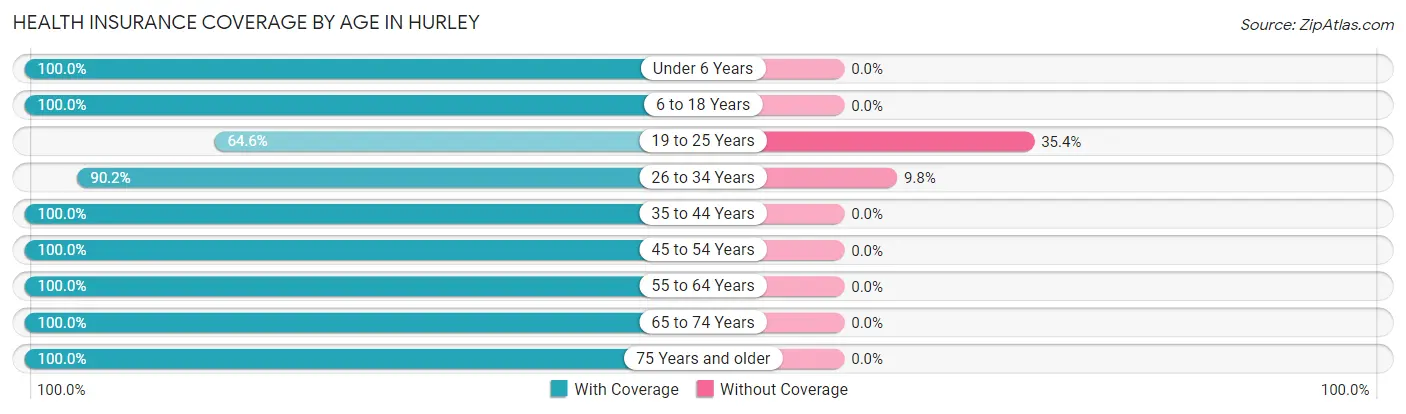
| Age Bracket | With Coverage | Without Coverage |
| Under 6 Years | 246 (100.0%) | 0 (0.0%) |
| 6 to 18 Years | 264 (100.0%) | 0 (0.0%) |
| 19 to 25 Years | 135 (64.6%) | 74 (35.4%) |
| 26 to 34 Years | 266 (90.2%) | 29 (9.8%) |
| 35 to 44 Years | 502 (100.0%) | 0 (0.0%) |
| 45 to 54 Years | 549 (100.0%) | 0 (0.0%) |
| 55 to 64 Years | 638 (100.0%) | 0 (0.0%) |
| 65 to 74 Years | 307 (100.0%) | 0 (0.0%) |
| 75 Years and older | 360 (100.0%) | 0 (0.0%) |
| Total | 3,267 (96.9%) | 103 (3.1%) |
Health Insurance Coverage by Citizenship Status in Hurley
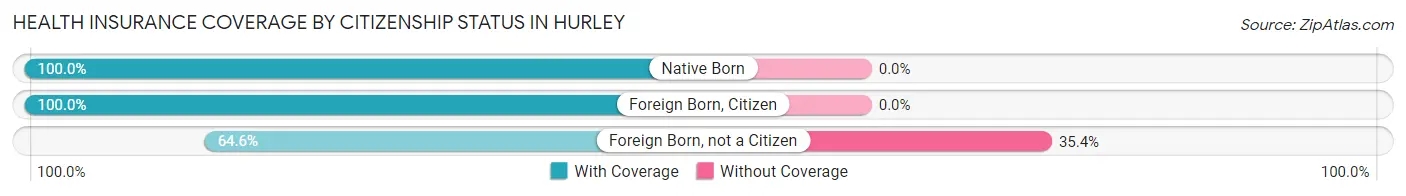
| Citizenship Status | With Coverage | Without Coverage |
| Native Born | 246 (100.0%) | 0 (0.0%) |
| Foreign Born, Citizen | 264 (100.0%) | 0 (0.0%) |
| Foreign Born, not a Citizen | 135 (64.6%) | 74 (35.4%) |
Health Insurance Coverage by Household Income in Hurley
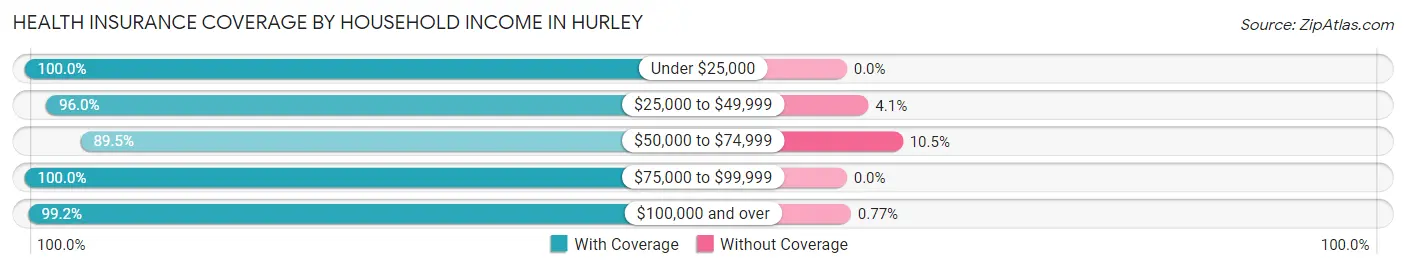
| Household Income | With Coverage | Without Coverage |
| Under $25,000 | 120 (100.0%) | 0 (0.0%) |
| $25,000 to $49,999 | 332 (96.0%) | 14 (4.1%) |
| $50,000 to $74,999 | 632 (89.5%) | 74 (10.5%) |
| $75,000 to $99,999 | 244 (100.0%) | 0 (0.0%) |
| $100,000 and over | 1,925 (99.2%) | 15 (0.8%) |
Public vs Private Health Insurance Coverage by Age in Hurley
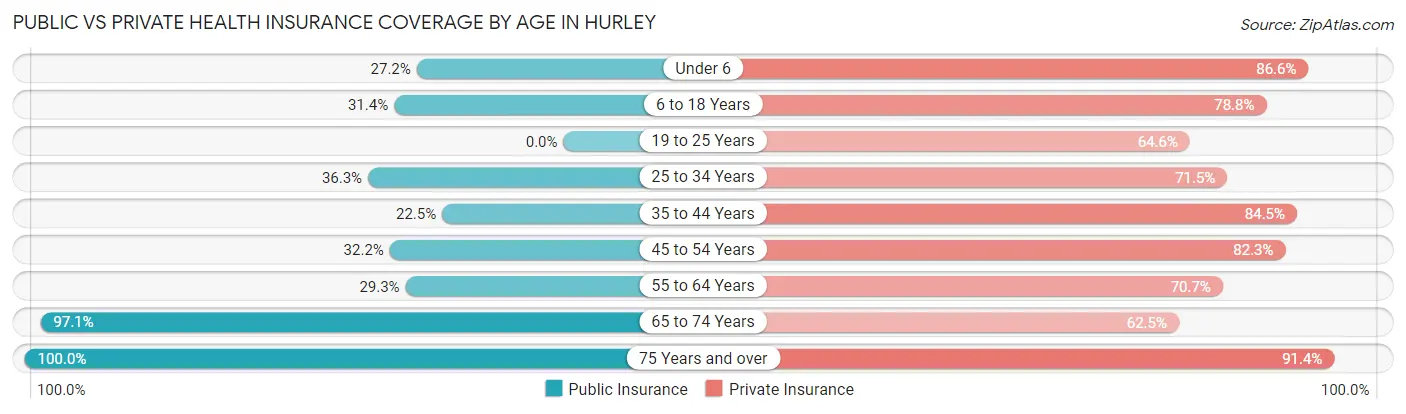
| Age Bracket | Public Insurance | Private Insurance |
| Under 6 | 67 (27.2%) | 213 (86.6%) |
| 6 to 18 Years | 83 (31.4%) | 208 (78.8%) |
| 19 to 25 Years | 0 (0.0%) | 135 (64.6%) |
| 25 to 34 Years | 107 (36.3%) | 211 (71.5%) |
| 35 to 44 Years | 113 (22.5%) | 424 (84.5%) |
| 45 to 54 Years | 177 (32.2%) | 452 (82.3%) |
| 55 to 64 Years | 187 (29.3%) | 451 (70.7%) |
| 65 to 74 Years | 298 (97.1%) | 192 (62.5%) |
| 75 Years and over | 360 (100.0%) | 329 (91.4%) |
| Total | 1,392 (41.3%) | 2,615 (77.6%) |
Disability Status by Sex by Age in Hurley
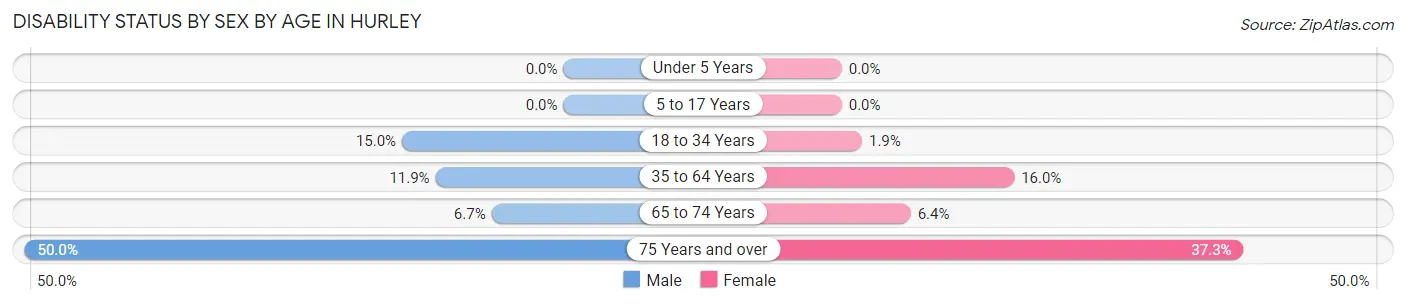
| Age Bracket | Male | Female |
| Under 5 Years | 0 (0.0%) | 0 (0.0%) |
| 5 to 17 Years | 0 (0.0%) | 0 (0.0%) |
| 18 to 34 Years | 31 (15.0%) | 6 (1.9%) |
| 35 to 64 Years | 87 (11.9%) | 153 (16.0%) |
| 65 to 74 Years | 9 (6.7%) | 11 (6.4%) |
| 75 Years and over | 70 (50.0%) | 82 (37.3%) |
Disability Class by Sex by Age in Hurley
Disability Class: Hearing Difficulty
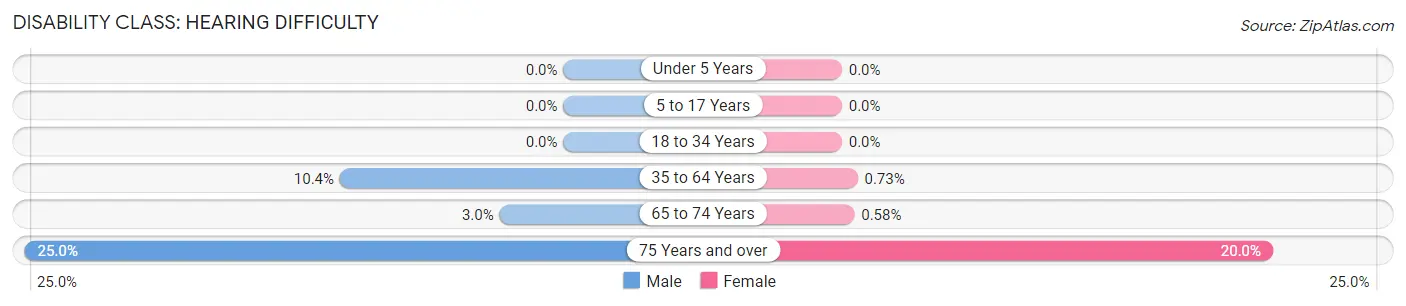
| Age Bracket | Male | Female |
| Under 5 Years | 0 (0.0%) | 0 (0.0%) |
| 5 to 17 Years | 0 (0.0%) | 0 (0.0%) |
| 18 to 34 Years | 0 (0.0%) | 0 (0.0%) |
| 35 to 64 Years | 76 (10.4%) | 7 (0.7%) |
| 65 to 74 Years | 4 (3.0%) | 1 (0.6%) |
| 75 Years and over | 35 (25.0%) | 44 (20.0%) |
Disability Class: Vision Difficulty
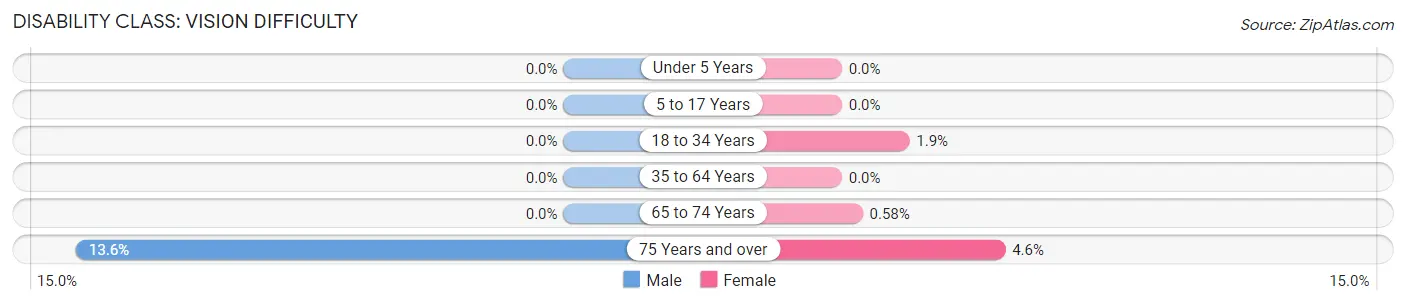
| Age Bracket | Male | Female |
| Under 5 Years | 0 (0.0%) | 0 (0.0%) |
| 5 to 17 Years | 0 (0.0%) | 0 (0.0%) |
| 18 to 34 Years | 0 (0.0%) | 6 (1.9%) |
| 35 to 64 Years | 0 (0.0%) | 0 (0.0%) |
| 65 to 74 Years | 0 (0.0%) | 1 (0.6%) |
| 75 Years and over | 19 (13.6%) | 10 (4.5%) |
Disability Class: Cognitive Difficulty
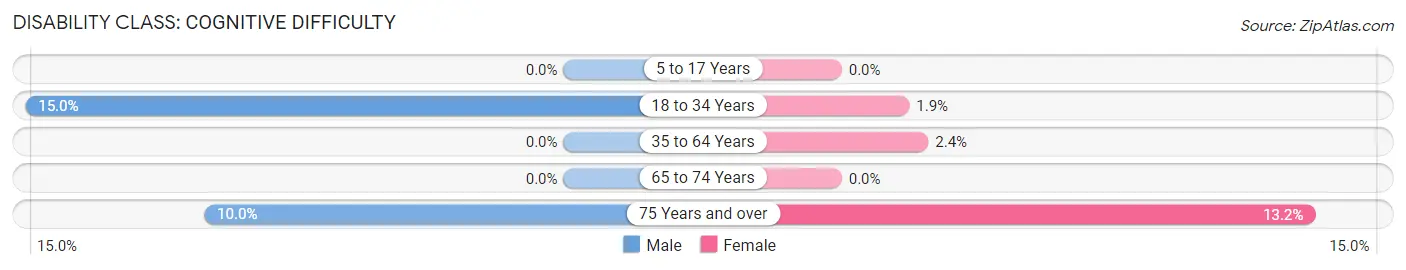
| Age Bracket | Male | Female |
| 5 to 17 Years | 0 (0.0%) | 0 (0.0%) |
| 18 to 34 Years | 31 (15.0%) | 6 (1.9%) |
| 35 to 64 Years | 0 (0.0%) | 23 (2.4%) |
| 65 to 74 Years | 0 (0.0%) | 0 (0.0%) |
| 75 Years and over | 14 (10.0%) | 29 (13.2%) |
Disability Class: Ambulatory Difficulty
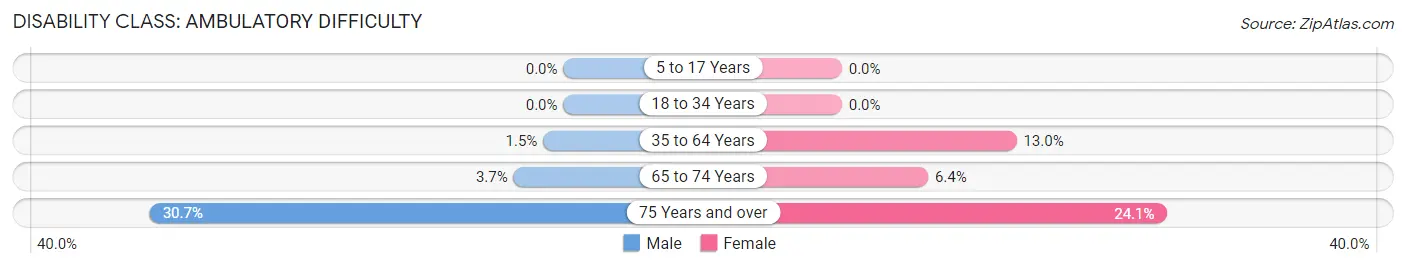
| Age Bracket | Male | Female |
| 5 to 17 Years | 0 (0.0%) | 0 (0.0%) |
| 18 to 34 Years | 0 (0.0%) | 0 (0.0%) |
| 35 to 64 Years | 11 (1.5%) | 124 (13.0%) |
| 65 to 74 Years | 5 (3.7%) | 11 (6.4%) |
| 75 Years and over | 43 (30.7%) | 53 (24.1%) |
Disability Class: Self-Care Difficulty
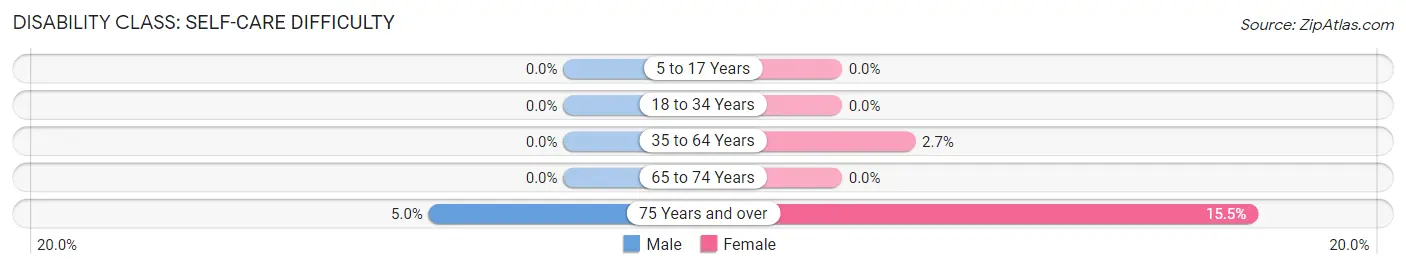
| Age Bracket | Male | Female |
| 5 to 17 Years | 0 (0.0%) | 0 (0.0%) |
| 18 to 34 Years | 0 (0.0%) | 0 (0.0%) |
| 35 to 64 Years | 0 (0.0%) | 26 (2.7%) |
| 65 to 74 Years | 0 (0.0%) | 0 (0.0%) |
| 75 Years and over | 7 (5.0%) | 34 (15.4%) |
Technology Access in Hurley
Computing Device Access in Hurley
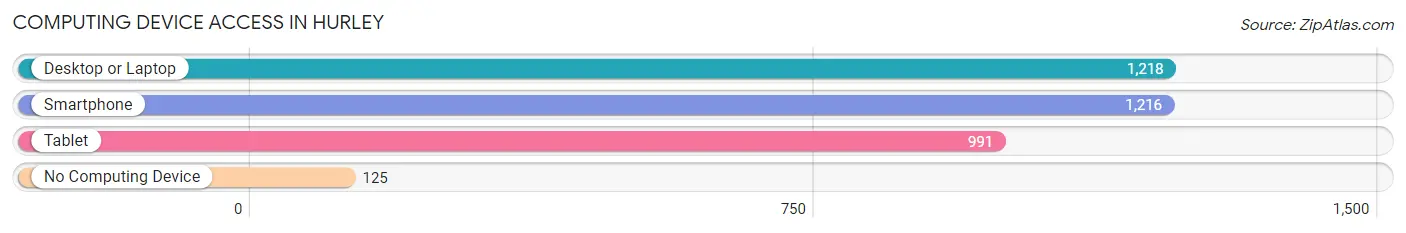
| Device Type | # Households | % Households |
| Desktop or Laptop | 1,218 | 82.7% |
| Smartphone | 1,216 | 82.6% |
| Tablet | 991 | 67.3% |
| No Computing Device | 125 | 8.5% |
| Total | 1,473 | 100.0% |
Internet Access in Hurley
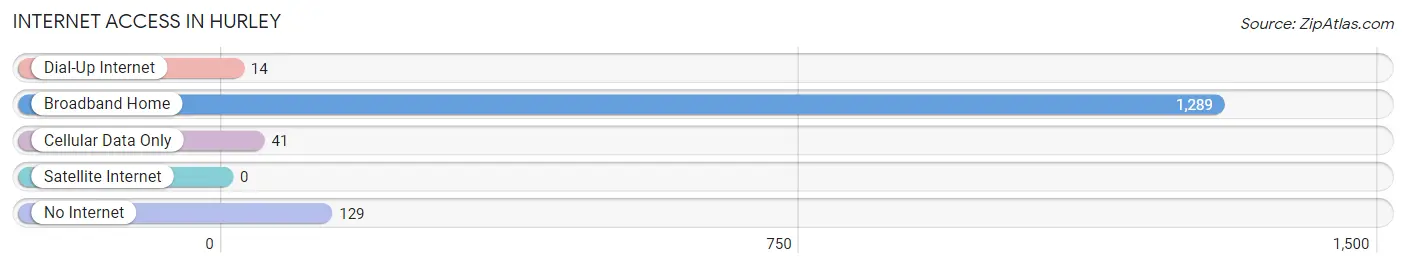
| Internet Type | # Households | % Households |
| Dial-Up Internet | 14 | 0.9% |
| Broadband Home | 1,289 | 87.5% |
| Cellular Data Only | 41 | 2.8% |
| Satellite Internet | 0 | 0.0% |
| No Internet | 129 | 8.8% |
| Total | 1,473 | 100.0% |
Hurley Summary
Hurley, New York is a small town located in Ulster County, New York. It is situated in the Catskill Mountains, about two hours north of New York City. The town was founded in 1714 and is one of the oldest towns in the state. It is home to a population of approximately 2,500 people.
History
Hurley was founded in 1714 by Dutch settlers who were looking for a place to settle and farm. The town was originally called Nieuw Dorp, which translates to “New Village” in Dutch. The town was later renamed Hurley after the Hurley family, who were among the first settlers.
The town was an important center of industry during the 19th century. It was home to several iron ore mines, as well as a number of mills and factories. The town was also home to a large number of immigrants, including Irish, German, and Italian immigrants.
Geography
Hurley is located in the Catskill Mountains, about two hours north of New York City. The town is situated on the banks of the Wallkill River, which flows through the town. The town is surrounded by forests and mountains, making it a popular destination for outdoor activities such as hiking, camping, and fishing.
Economy
The economy of Hurley is largely based on tourism. The town is home to a number of bed and breakfasts, as well as a number of restaurants and shops. The town is also home to a number of art galleries and antique stores.
The town is also home to a number of small businesses, including a number of farms and orchards. The town is also home to a number of manufacturing companies, including a number of furniture and woodworking companies.
Demographics
As of the 2010 census, the population of Hurley was 2,521. The town is predominantly white, with approximately 90% of the population being white. The town is also home to a small number of African American, Hispanic, and Asian residents.
The median household income in Hurley is $50,000, which is slightly lower than the national average. The town has a poverty rate of approximately 10%, which is slightly higher than the national average.
Conclusion
Hurley, New York is a small town located in Ulster County, New York. It is situated in the Catskill Mountains, about two hours north of New York City. The town was founded in 1714 and is one of the oldest towns in the state. It is home to a population of approximately 2,500 people. The town is largely based on tourism, with a number of bed and breakfasts, restaurants, and shops. The town is also home to a number of small businesses, including a number of farms and orchards. The town is predominantly white, with a median household income of $50,000 and a poverty rate of approximately 10%.
Common Questions
What is Per Capita Income in Hurley?
Per Capita income in Hurley is $53,718.
What is the Median Family Income in Hurley?
Median Family Income in Hurley is $130,985.
What is the Median Household income in Hurley?
Median Household Income in Hurley is $92,863.
What is Income or Wage Gap in Hurley?
Income or Wage Gap in Hurley is 23.1%.
Women in Hurley earn 76.9 cents for every dollar earned by a man.
What is Inequality or Gini Index in Hurley?
Inequality or Gini Index in Hurley is 0.41.
What is the Total Population of Hurley?
Total Population of Hurley is 3,370.
What is the Total Male Population of Hurley?
Total Male Population of Hurley is 1,465.
What is the Total Female Population of Hurley?
Total Female Population of Hurley is 1,905.
What is the Ratio of Males per 100 Females in Hurley?
There are 76.90 Males per 100 Females in Hurley.
What is the Ratio of Females per 100 Males in Hurley?
There are 130.03 Females per 100 Males in Hurley.
What is the Median Population Age in Hurley?
Median Population Age in Hurley is 50.1 Years.
What is the Average Family Size in Hurley
Average Family Size in Hurley is 2.6 People.
What is the Average Household Size in Hurley
Average Household Size in Hurley is 2.3 People.
How Large is the Labor Force in Hurley?
There are 1,807 People in the Labor Forcein in Hurley.
What is the Percentage of People in the Labor Force in Hurley?
62.3% of People are in the Labor Force in Hurley.
What is the Unemployment Rate in Hurley?
Unemployment Rate in Hurley is 1.7%.