High Falls, NY Map & Demographics
High Falls Map
High Falls Overview
$29,771
PER CAPITA INCOME
$69,500
AVG FAMILY INCOME
$57,105
AVG HOUSEHOLD INCOME
0.36
INEQUALITY / GINI INDEX
482
TOTAL POPULATION
202
MALE POPULATION
280
FEMALE POPULATION
72.14
MALES / 100 FEMALES
138.61
FEMALES / 100 MALES
52.3
MEDIAN AGE
3.2
AVG FAMILY SIZE
2.4
AVG HOUSEHOLD SIZE
240
LABOR FORCE [ PEOPLE ]
59.7%
PERCENT IN LABOR FORCE
8.3%
UNEMPLOYMENT RATE
High Falls Zip Codes
High Falls Area Codes
Income in High Falls
Income Overview in High Falls
Per Capita Income in High Falls is $29,771, while median incomes of families and households are $69,500 and $57,105 respectively.
| Characteristic | Number | Measure |
| Per Capita Income | 482 | $29,771 |
| Median Family Income | 126 | $69,500 |
| Mean Family Income | 126 | $88,112 |
| Median Household Income | 198 | $57,105 |
| Mean Household Income | 198 | $70,136 |
| Income Deficit | 126 | $0 |
| Wage / Income Gap (%) | 482 | 0.00% |
| Wage / Income Gap ($) | 482 | 100.00¢ per $1 |
| Gini / Inequality Index | 482 | 0.36 |
Earnings by Sex in High Falls
| Sex | Number | Average Earnings |
| Male | 112 (44.6%) | $0 |
| Female | 139 (55.4%) | $0 |
| Total | 251 (100.0%) | $0 |
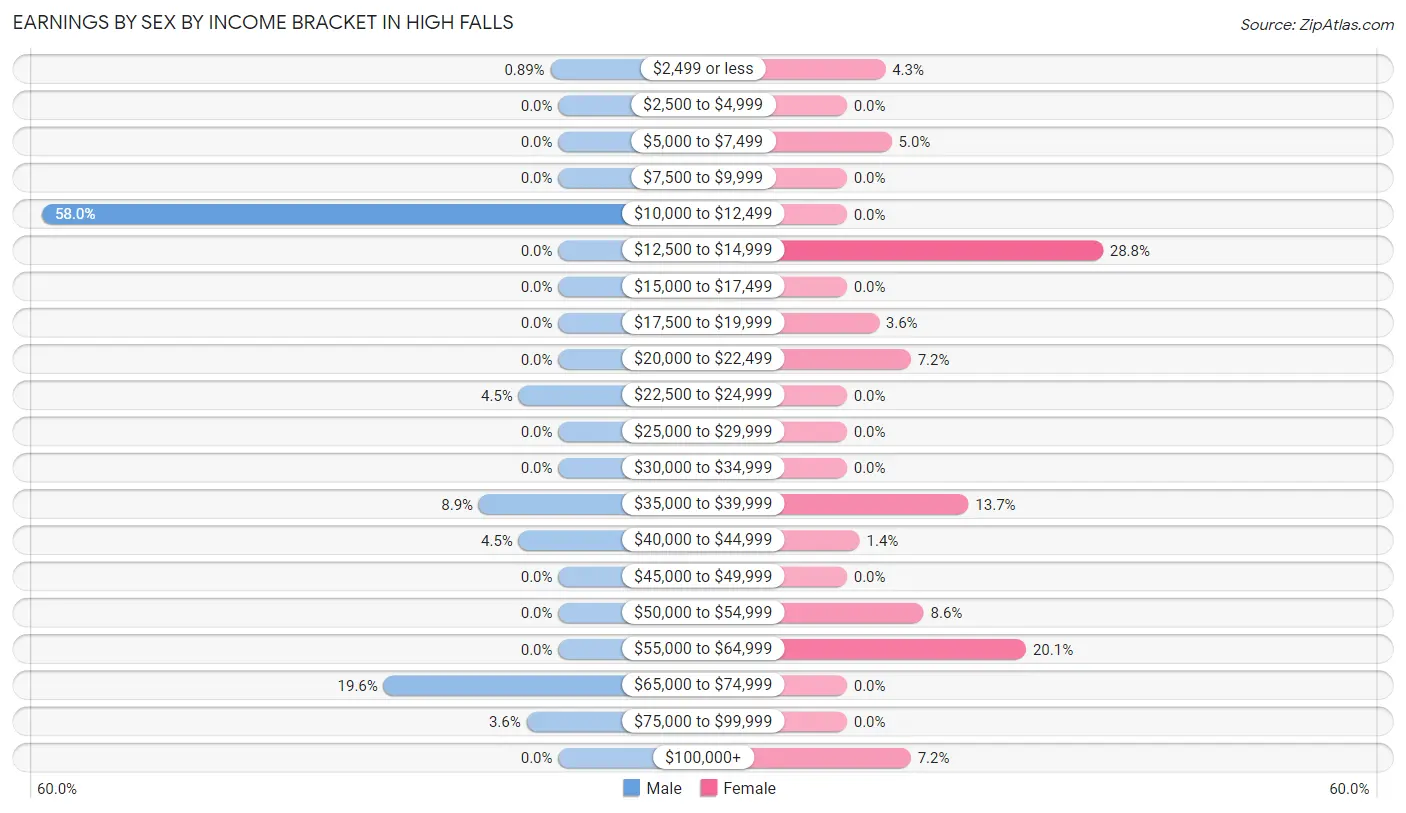
Earnings by Sex by Income Bracket in High Falls
The most common earnings brackets in High Falls are $10,000 to $12,499 for men (65 | 58.0%) and $12,500 to $14,999 for women (40 | 28.8%).
| Income | Male | Female |
| $2,499 or less | 1 (0.9%) | 6 (4.3%) |
| $2,500 to $4,999 | 0 (0.0%) | 0 (0.0%) |
| $5,000 to $7,499 | 0 (0.0%) | 7 (5.0%) |
| $7,500 to $9,999 | 0 (0.0%) | 0 (0.0%) |
| $10,000 to $12,499 | 65 (58.0%) | 0 (0.0%) |
| $12,500 to $14,999 | 0 (0.0%) | 40 (28.8%) |
| $15,000 to $17,499 | 0 (0.0%) | 0 (0.0%) |
| $17,500 to $19,999 | 0 (0.0%) | 5 (3.6%) |
| $20,000 to $22,499 | 0 (0.0%) | 10 (7.2%) |
| $22,500 to $24,999 | 5 (4.5%) | 0 (0.0%) |
| $25,000 to $29,999 | 0 (0.0%) | 0 (0.0%) |
| $30,000 to $34,999 | 0 (0.0%) | 0 (0.0%) |
| $35,000 to $39,999 | 10 (8.9%) | 19 (13.7%) |
| $40,000 to $44,999 | 5 (4.5%) | 2 (1.4%) |
| $45,000 to $49,999 | 0 (0.0%) | 0 (0.0%) |
| $50,000 to $54,999 | 0 (0.0%) | 12 (8.6%) |
| $55,000 to $64,999 | 0 (0.0%) | 28 (20.1%) |
| $65,000 to $74,999 | 22 (19.6%) | 0 (0.0%) |
| $75,000 to $99,999 | 4 (3.6%) | 0 (0.0%) |
| $100,000+ | 0 (0.0%) | 10 (7.2%) |
| Total | 112 (100.0%) | 139 (100.0%) |
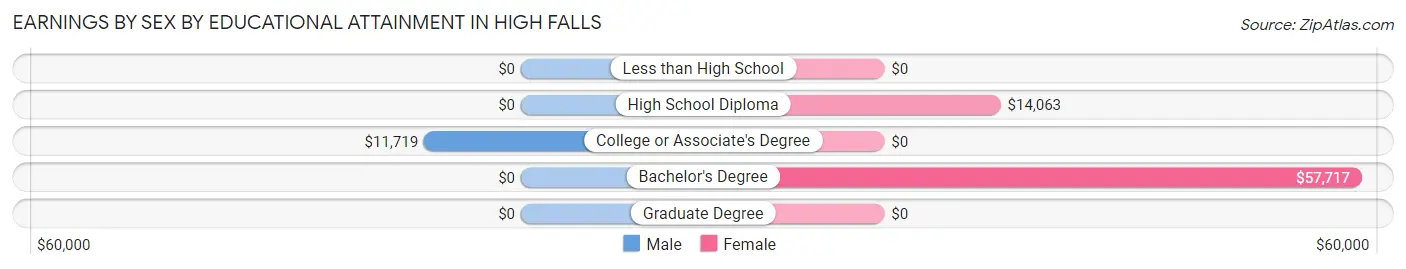
Earnings by Sex by Educational Attainment in High Falls
| Educational Attainment | Male Income | Female Income |
| Less than High School | - | - |
| High School Diploma | - | - |
| College or Associate's Degree | $11,719 | $0 |
| Bachelor's Degree | - | - |
| Graduate Degree | - | - |
| Total | - | - |
Family Income in High Falls
Family Income Brackets in High Falls
According to the High Falls family income data, there are 55 families falling into the $50,000 to $74,999 income range, which is the most common income bracket and makes up 43.6% of all families.
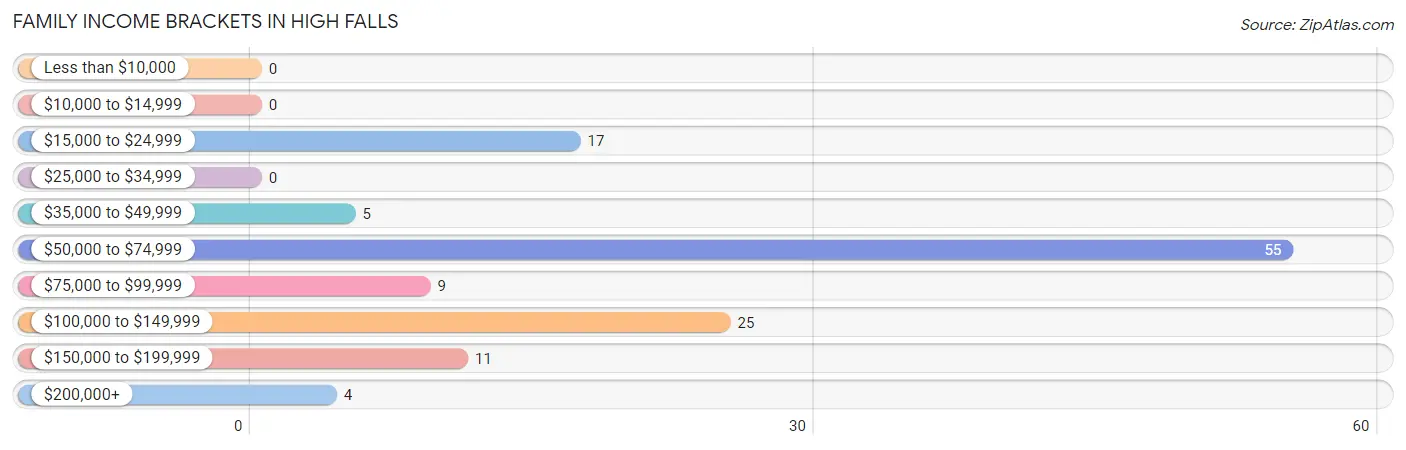
| Income Bracket | # Families | % Families |
| Less than $10,000 | 0 | 0.0% |
| $10,000 to $14,999 | 0 | 0.0% |
| $15,000 to $24,999 | 17 | 13.5% |
| $25,000 to $34,999 | 0 | 0.0% |
| $35,000 to $49,999 | 5 | 4.0% |
| $50,000 to $74,999 | 55 | 43.7% |
| $75,000 to $99,999 | 9 | 7.1% |
| $100,000 to $149,999 | 25 | 19.8% |
| $150,000 to $199,999 | 11 | 8.7% |
| $200,000+ | 4 | 3.2% |
Family Income by Famaliy Size in High Falls
2-person families (49 | 38.9%) account for the highest median family income in High Falls with $69,813 per family, while 2-person families (49 | 38.9%) have the highest median income of $34,906 per family member.
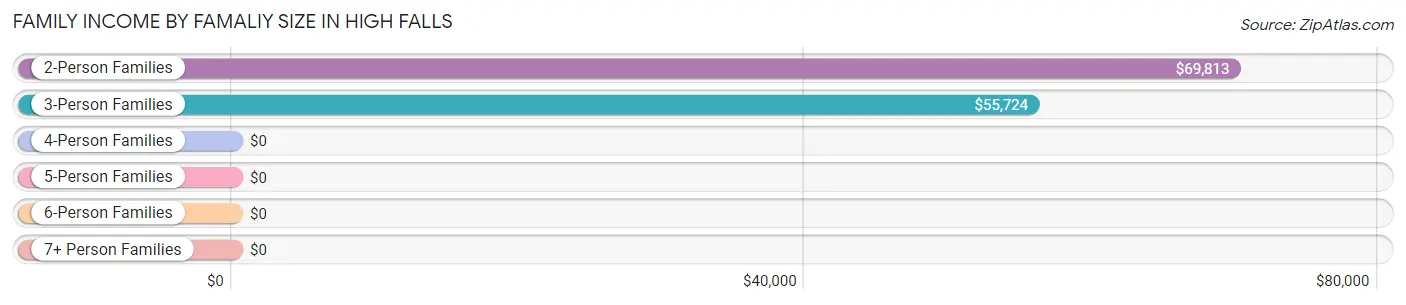
| Income Bracket | # Families | Median Income |
| 2-Person Families | 49 (38.9%) | $69,813 |
| 3-Person Families | 45 (35.7%) | $55,724 |
| 4-Person Families | 11 (8.7%) | $0 |
| 5-Person Families | 12 (9.5%) | $0 |
| 6-Person Families | 5 (4.0%) | $0 |
| 7+ Person Families | 4 (3.2%) | $0 |
| Total | 126 (100.0%) | $69,500 |
Family Income by Number of Earners in High Falls
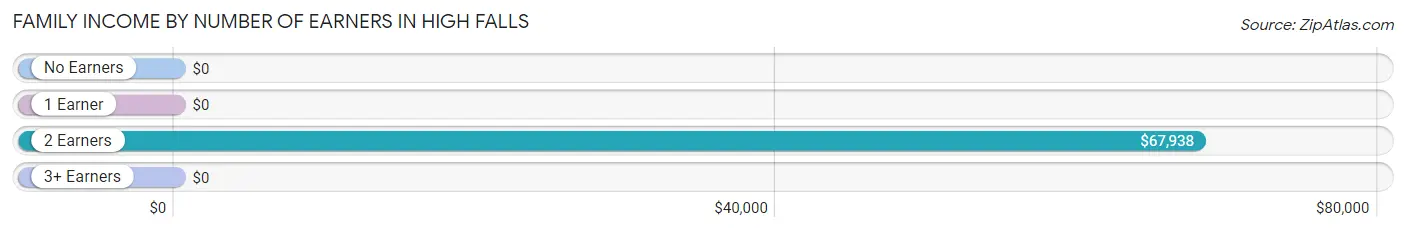
| Number of Earners | # Families | Median Income |
| No Earners | 7 (5.6%) | $0 |
| 1 Earner | 26 (20.6%) | $0 |
| 2 Earners | 89 (70.6%) | $67,938 |
| 3+ Earners | 4 (3.2%) | $0 |
| Total | 126 (100.0%) | $69,500 |
Household Income in High Falls
Household Income Brackets in High Falls
With 68 households falling in the category, the $50,000 to $74,999 income range is the most frequent in High Falls, accounting for 34.3% of all households.
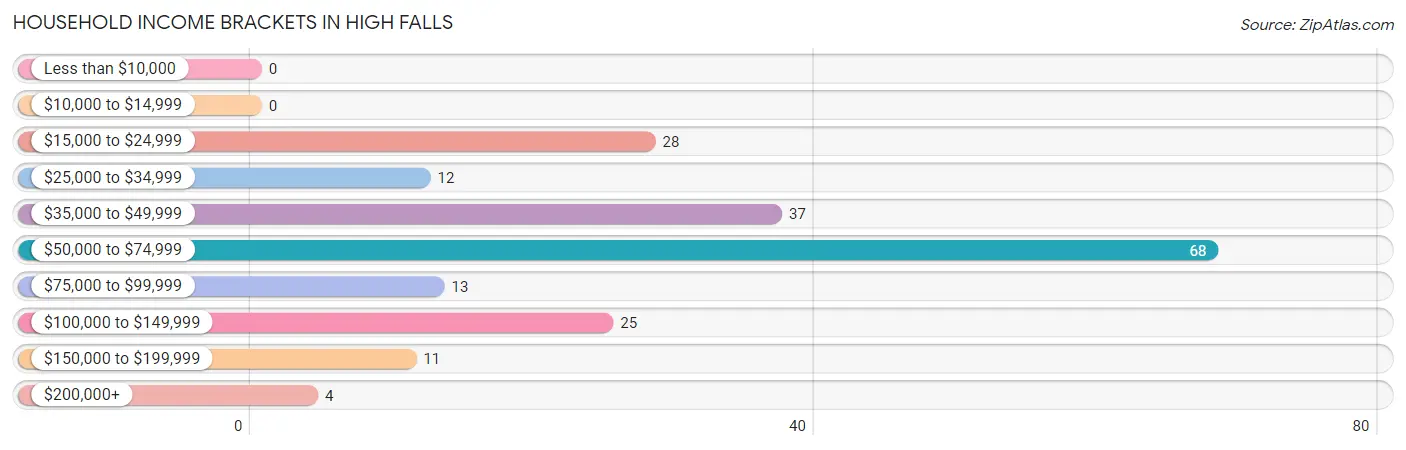
| Income Bracket | # Households | % Households |
| Less than $10,000 | 0 | 0.0% |
| $10,000 to $14,999 | 0 | 0.0% |
| $15,000 to $24,999 | 28 | 14.1% |
| $25,000 to $34,999 | 12 | 6.1% |
| $35,000 to $49,999 | 37 | 18.7% |
| $50,000 to $74,999 | 68 | 34.3% |
| $75,000 to $99,999 | 13 | 6.6% |
| $100,000 to $149,999 | 25 | 12.6% |
| $150,000 to $199,999 | 11 | 5.6% |
| $200,000+ | 4 | 2.0% |
Household Income by Householder Age in High Falls
The median household income in High Falls is $57,105, with the highest median household income of $56,184 found in the 45 to 64 years age bracket for the primary householder. A total of 94 households (47.5%) fall into this category.
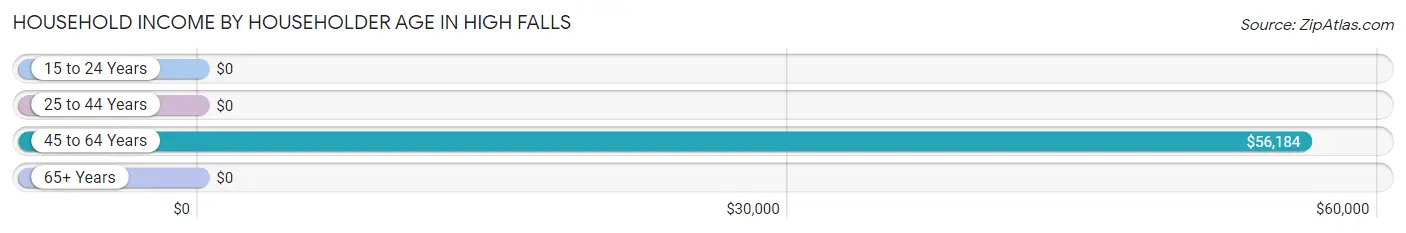
| Income Bracket | # Households | Median Income |
| 15 to 24 Years | 0 (0.0%) | $0 |
| 25 to 44 Years | 17 (8.6%) | $0 |
| 45 to 64 Years | 94 (47.5%) | $56,184 |
| 65+ Years | 87 (43.9%) | $0 |
| Total | 198 (100.0%) | $57,105 |
Poverty in High Falls
Income Below Poverty by Sex and Age in High Falls
With 20.6% poverty level for males and 2.5% for females among the residents of High Falls, 45 to 54 year old males and 16 and 17 year old females are the most vulnerable to poverty, with 41 males (49.4%) and 7 females (100.0%) in their respective age groups living below the poverty level.
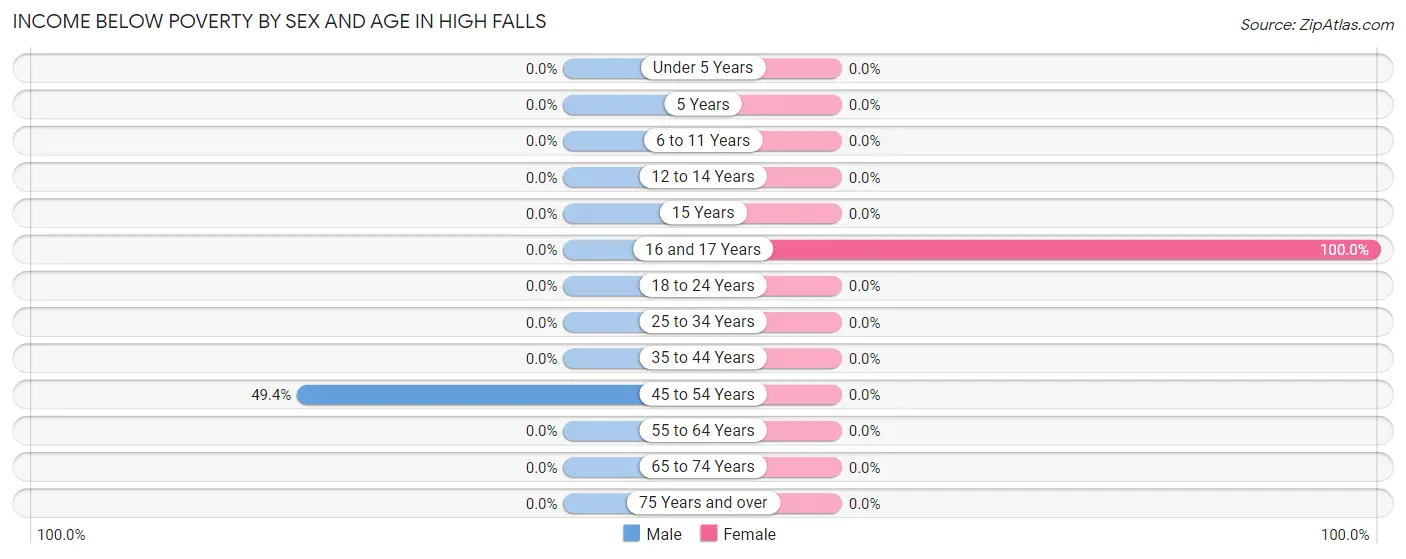
| Age Bracket | Male | Female |
| Under 5 Years | 0 (0.0%) | 0 (0.0%) |
| 5 Years | 0 (0.0%) | 0 (0.0%) |
| 6 to 11 Years | 0 (0.0%) | 0 (0.0%) |
| 12 to 14 Years | 0 (0.0%) | 0 (0.0%) |
| 15 Years | 0 (0.0%) | 0 (0.0%) |
| 16 and 17 Years | 0 (0.0%) | 7 (100.0%) |
| 18 to 24 Years | 0 (0.0%) | 0 (0.0%) |
| 25 to 34 Years | 0 (0.0%) | 0 (0.0%) |
| 35 to 44 Years | 0 (0.0%) | 0 (0.0%) |
| 45 to 54 Years | 41 (49.4%) | 0 (0.0%) |
| 55 to 64 Years | 0 (0.0%) | 0 (0.0%) |
| 65 to 74 Years | 0 (0.0%) | 0 (0.0%) |
| 75 Years and over | 0 (0.0%) | 0 (0.0%) |
| Total | 41 (20.6%) | 7 (2.5%) |
Income Above Poverty by Sex and Age in High Falls
According to the poverty statistics in High Falls, males aged under 5 years and females aged 5 years are the age groups that are most secure financially, with 100.0% of males and 100.0% of females in these age groups living above the poverty line.
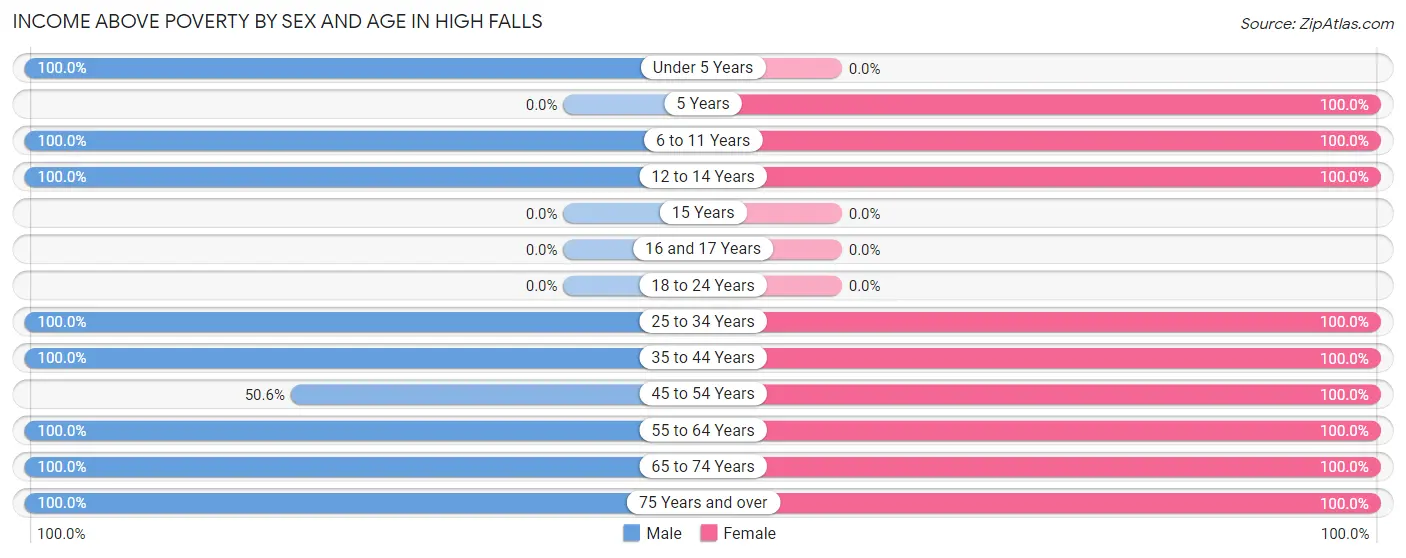
| Age Bracket | Male | Female |
| Under 5 Years | 10 (100.0%) | 0 (0.0%) |
| 5 Years | 0 (0.0%) | 13 (100.0%) |
| 6 to 11 Years | 10 (100.0%) | 29 (100.0%) |
| 12 to 14 Years | 5 (100.0%) | 11 (100.0%) |
| 15 Years | 0 (0.0%) | 0 (0.0%) |
| 16 and 17 Years | 0 (0.0%) | 0 (0.0%) |
| 18 to 24 Years | 0 (0.0%) | 0 (0.0%) |
| 25 to 34 Years | 5 (100.0%) | 31 (100.0%) |
| 35 to 44 Years | 21 (100.0%) | 12 (100.0%) |
| 45 to 54 Years | 42 (50.6%) | 35 (100.0%) |
| 55 to 64 Years | 24 (100.0%) | 55 (100.0%) |
| 65 to 74 Years | 27 (100.0%) | 78 (100.0%) |
| 75 Years and over | 14 (100.0%) | 7 (100.0%) |
| Total | 158 (79.4%) | 271 (97.5%) |
Income Below Poverty Among Married-Couple Families in High Falls
The poverty statistics for married-couple families in High Falls show that 13.8% or 17 of the total 123 families live below the poverty line. Families with 1 or 2 children have the highest poverty rate of 53.1%, comprising of 17 families. On the other hand, families with no children have the lowest poverty rate of 0.0%, which includes 0 families.
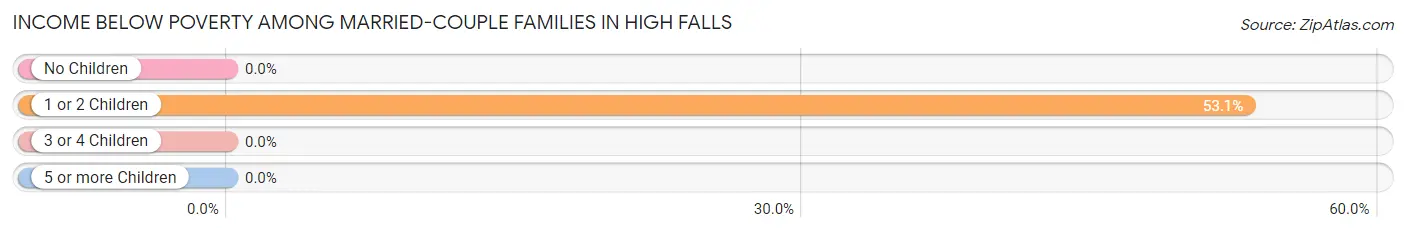
| Children | Above Poverty | Below Poverty |
| No Children | 74 (100.0%) | 0 (0.0%) |
| 1 or 2 Children | 15 (46.9%) | 17 (53.1%) |
| 3 or 4 Children | 17 (100.0%) | 0 (0.0%) |
| 5 or more Children | 0 (0.0%) | 0 (0.0%) |
| Total | 106 (86.2%) | 17 (13.8%) |
Income Below Poverty Among Single-Parent Households in High Falls
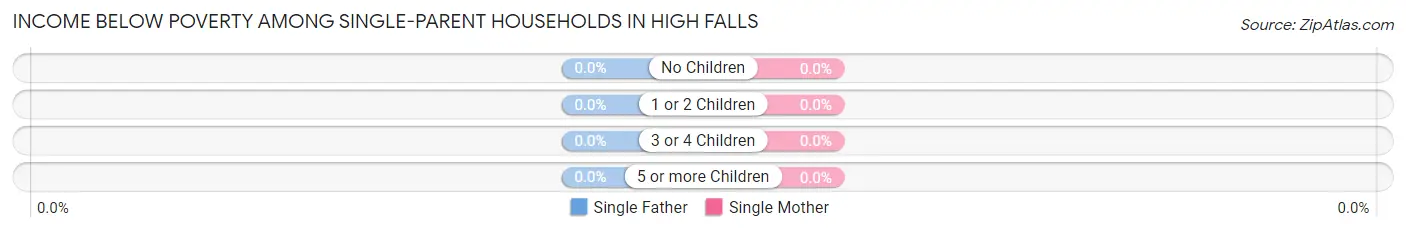
| Children | Single Father | Single Mother |
| No Children | 0 (0.0%) | 0 (0.0%) |
| 1 or 2 Children | 0 (0.0%) | 0 (0.0%) |
| 3 or 4 Children | 0 (0.0%) | 0 (0.0%) |
| 5 or more Children | 0 (0.0%) | 0 (0.0%) |
| Total | 0 (0.0%) | 0 (0.0%) |
Income Below Poverty Among Married-Couple vs Single-Parent Households in High Falls
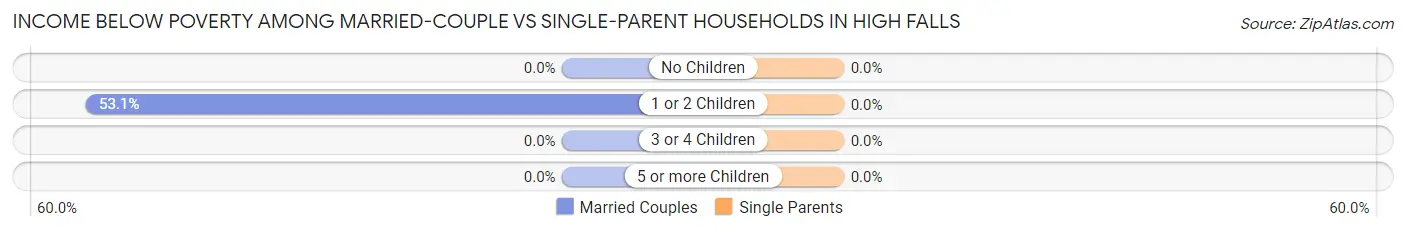
| Children | Married-Couple Families | Single-Parent Households |
| No Children | 0 (0.0%) | 0 (0.0%) |
| 1 or 2 Children | 17 (53.1%) | 0 (0.0%) |
| 3 or 4 Children | 0 (0.0%) | 0 (0.0%) |
| 5 or more Children | 0 (0.0%) | 0 (0.0%) |
| Total | 17 (13.8%) | 0 (0.0%) |
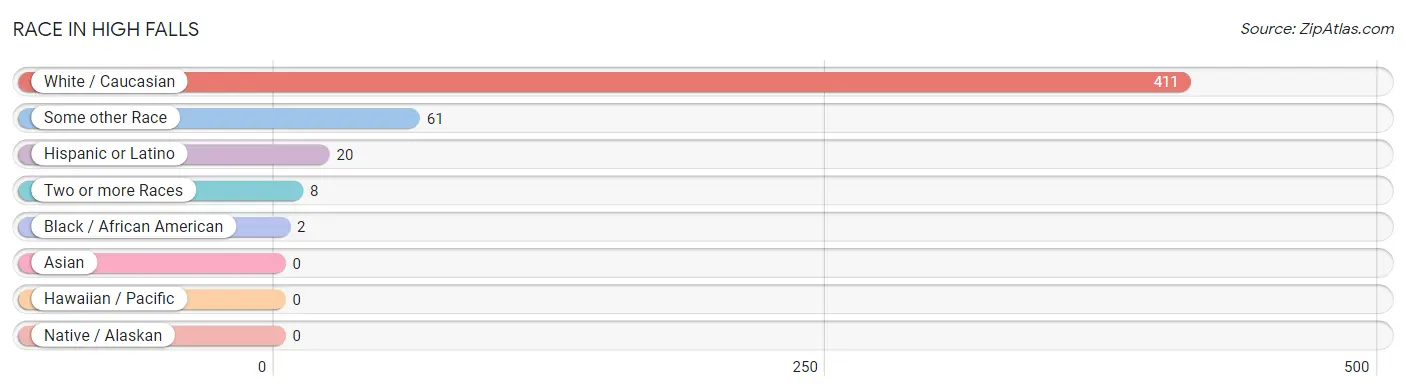
Race in High Falls
The most populous races in High Falls are White / Caucasian (411 | 85.3%), Some other Race (61 | 12.7%), and Hispanic or Latino (20 | 4.2%).
| Race | # Population | % Population |
| Asian | 0 | 0.0% |
| Black / African American | 2 | 0.4% |
| Hawaiian / Pacific | 0 | 0.0% |
| Hispanic or Latino | 20 | 4.2% |
| Native / Alaskan | 0 | 0.0% |
| White / Caucasian | 411 | 85.3% |
| Two or more Races | 8 | 1.7% |
| Some other Race | 61 | 12.7% |
| Total | 482 | 100.0% |
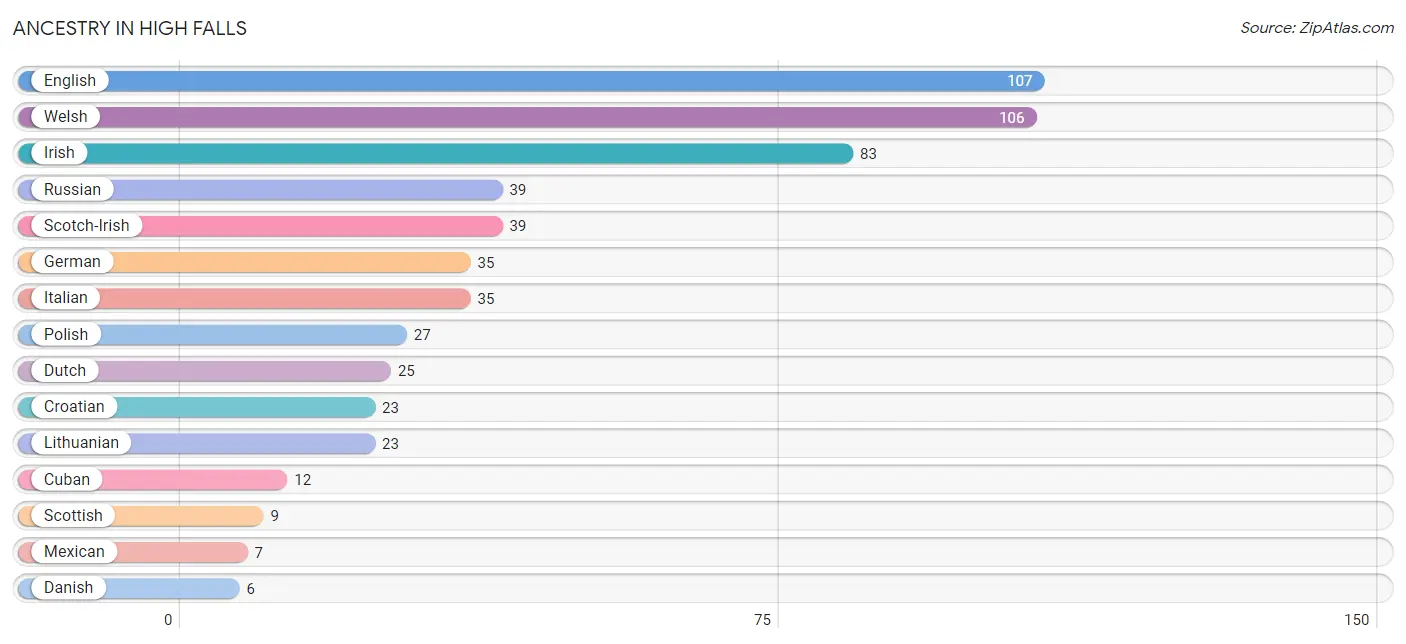
Ancestry in High Falls
The most populous ancestries reported in High Falls are English (107 | 22.2%), Welsh (106 | 22.0%), Irish (83 | 17.2%), Russian (39 | 8.1%), and Scotch-Irish (39 | 8.1%), together accounting for 77.6% of all High Falls residents.
| Ancestry | # Population | % Population |
| American | 1 | 0.2% |
| Croatian | 23 | 4.8% |
| Cuban | 12 | 2.5% |
| Danish | 6 | 1.2% |
| Dutch | 25 | 5.2% |
| English | 107 | 22.2% |
| French | 6 | 1.2% |
| German | 35 | 7.3% |
| Greek | 2 | 0.4% |
| Irish | 83 | 17.2% |
| Italian | 35 | 7.3% |
| Lithuanian | 23 | 4.8% |
| Mexican | 7 | 1.5% |
| Polish | 27 | 5.6% |
| Puerto Rican | 1 | 0.2% |
| Russian | 39 | 8.1% |
| Scotch-Irish | 39 | 8.1% |
| Scottish | 9 | 1.9% |
| Welsh | 106 | 22.0% | View All 19 Rows |
Immigrants in High Falls

| Immigration Origin | # Population | % Population | View All 0 Rows |
Sex and Age in High Falls
Sex and Age in High Falls
The most populous age groups in High Falls are 50 to 54 Years (59 | 29.2%) for men and 70 to 74 Years (51 | 18.2%) for women.
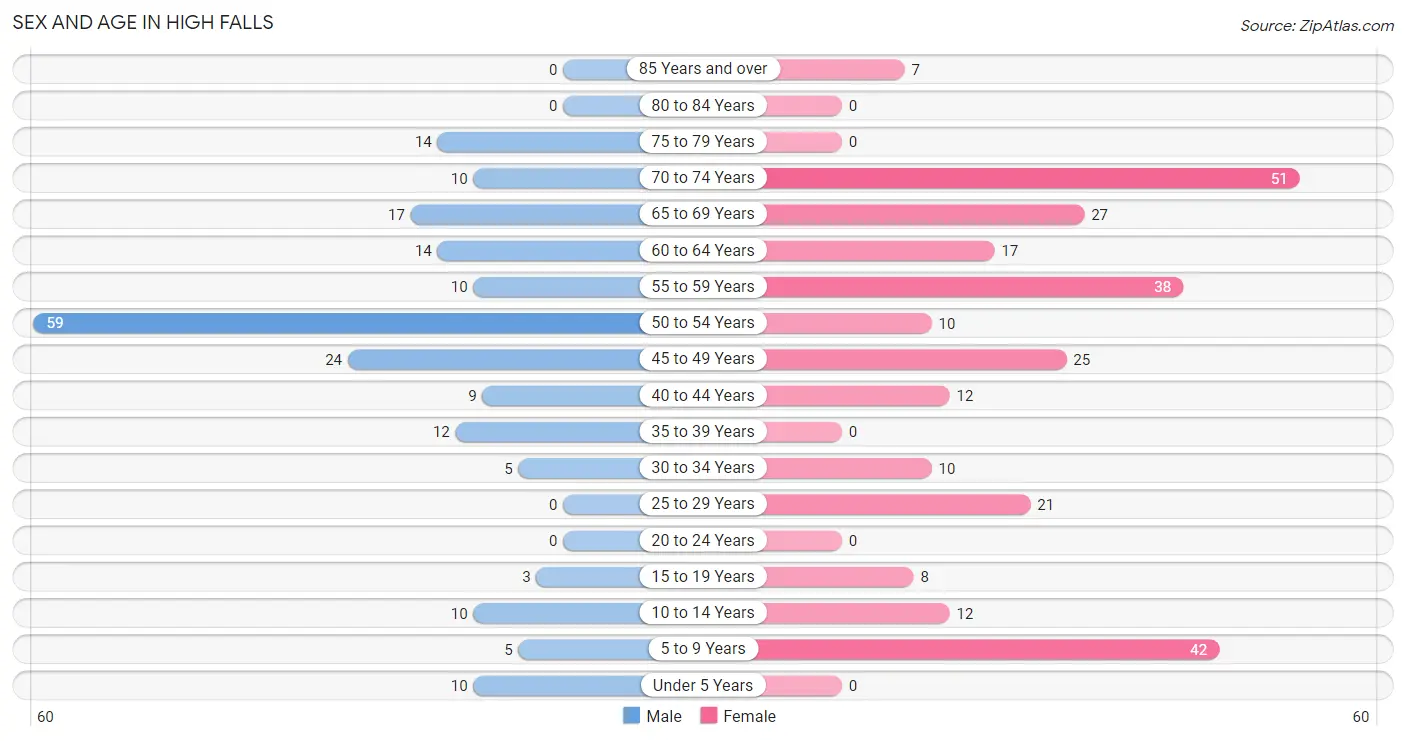
| Age Bracket | Male | Female |
| Under 5 Years | 10 (5.0%) | 0 (0.0%) |
| 5 to 9 Years | 5 (2.5%) | 42 (15.0%) |
| 10 to 14 Years | 10 (5.0%) | 12 (4.3%) |
| 15 to 19 Years | 3 (1.5%) | 8 (2.9%) |
| 20 to 24 Years | 0 (0.0%) | 0 (0.0%) |
| 25 to 29 Years | 0 (0.0%) | 21 (7.5%) |
| 30 to 34 Years | 5 (2.5%) | 10 (3.6%) |
| 35 to 39 Years | 12 (5.9%) | 0 (0.0%) |
| 40 to 44 Years | 9 (4.5%) | 12 (4.3%) |
| 45 to 49 Years | 24 (11.9%) | 25 (8.9%) |
| 50 to 54 Years | 59 (29.2%) | 10 (3.6%) |
| 55 to 59 Years | 10 (5.0%) | 38 (13.6%) |
| 60 to 64 Years | 14 (6.9%) | 17 (6.1%) |
| 65 to 69 Years | 17 (8.4%) | 27 (9.6%) |
| 70 to 74 Years | 10 (5.0%) | 51 (18.2%) |
| 75 to 79 Years | 14 (6.9%) | 0 (0.0%) |
| 80 to 84 Years | 0 (0.0%) | 0 (0.0%) |
| 85 Years and over | 0 (0.0%) | 7 (2.5%) |
| Total | 202 (100.0%) | 280 (100.0%) |
Families and Households in High Falls
Median Family Size in High Falls
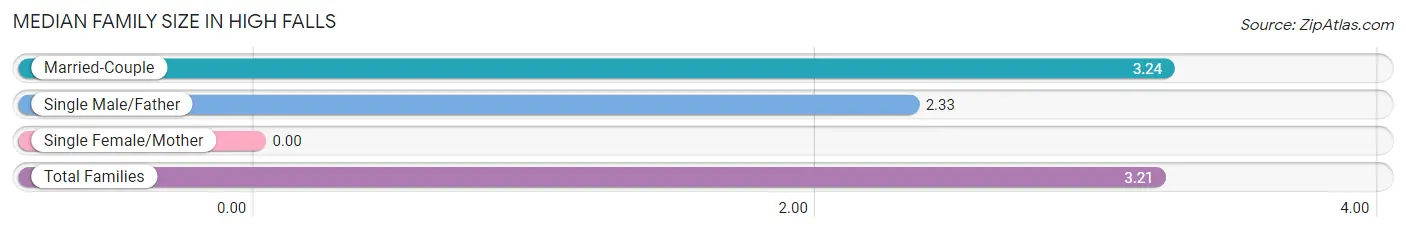
| Family Type | # Families | Family Size |
| Married-Couple | 123 (97.6%) | 3.24 |
| Single Male/Father | 3 (2.4%) | 2.33 |
| Single Female/Mother | 0 (0.0%) | - |
| Total Families | 126 (100.0%) | 3.21 |
Median Household Size in High Falls
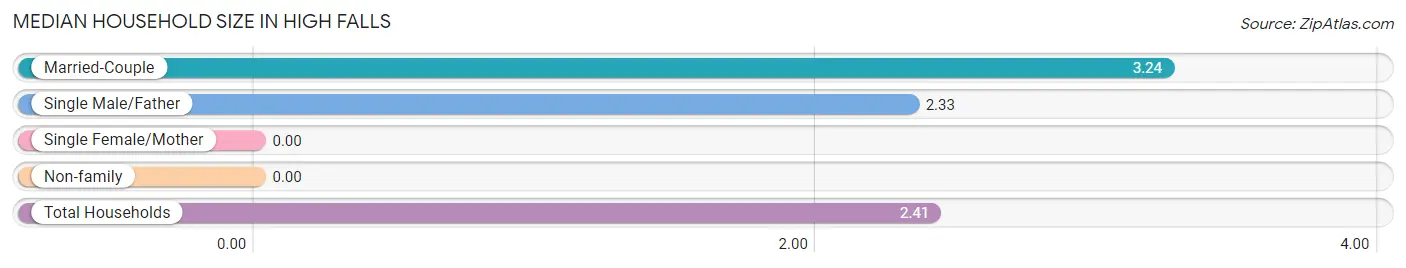
| Household Type | # Households | Household Size |
| Married-Couple | 123 (62.1%) | 3.24 |
| Single Male/Father | 3 (1.5%) | 2.33 |
| Single Female/Mother | 0 (0.0%) | - |
| Non-family | 72 (36.4%) | - |
| Total Households | 198 (100.0%) | 2.41 |
Household Size by Marriage Status in High Falls
Out of a total of 198 households in High Falls, 126 (63.6%) are family households, while 72 (36.4%) are nonfamily households. The most numerous type of family households are 2-person households, comprising 49, and the most common type of nonfamily households are 1-person households, comprising 72.
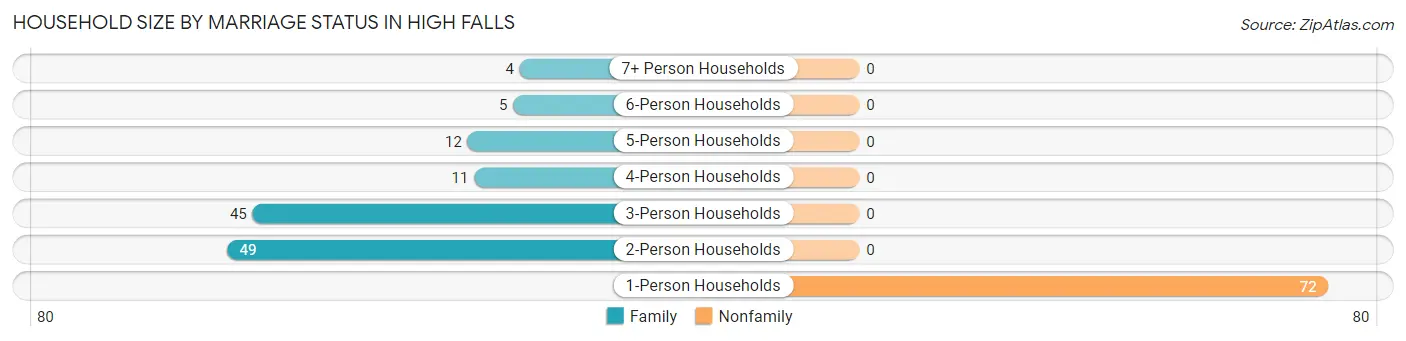
| Household Size | Family Households | Nonfamily Households |
| 1-Person Households | - | 72 (36.4%) |
| 2-Person Households | 49 (24.7%) | 0 (0.0%) |
| 3-Person Households | 45 (22.7%) | 0 (0.0%) |
| 4-Person Households | 11 (5.6%) | 0 (0.0%) |
| 5-Person Households | 12 (6.1%) | 0 (0.0%) |
| 6-Person Households | 5 (2.5%) | 0 (0.0%) |
| 7+ Person Households | 4 (2.0%) | 0 (0.0%) |
| Total | 126 (63.6%) | 72 (36.4%) |
Female Fertility in High Falls
Fertility by Age in High Falls
| Age Bracket | Women with Births | Births / 1,000 Women |
| 15 to 19 years | 0 (0.0%) | 0.0 |
| 20 to 34 years | 0 (0.0%) | 0.0 |
| 35 to 50 years | 0 (0.0%) | 0.0 |
| Total | 0 (0.0%) | 0.0 |
Fertility by Age by Marriage Status in High Falls
| Age Bracket | Married | Unmarried |
| 15 to 19 years | 0 (0.0%) | 0 (0.0%) |
| 20 to 34 years | 0 (0.0%) | 0 (0.0%) |
| 35 to 50 years | 0 (0.0%) | 0 (0.0%) |
| Total | 0 (0.0%) | 0 (0.0%) |
Fertility by Education in High Falls
| Educational Attainment | Women with Births | Births / 1,000 Women |
| Less than High School | 0 (0.0%) | 0.0 |
| High School Diploma | 0 (0.0%) | 0.0 |
| College or Associate's Degree | 0 (0.0%) | 0.0 |
| Bachelor's Degree | 0 (0.0%) | 0.0 |
| Graduate Degree | 0 (0.0%) | 0.0 |
| Total | 0 (0.0%) | 0.0 |
Fertility by Education by Marriage Status in High Falls
| Educational Attainment | Married | Unmarried |
| Less than High School | 0 (0.0%) | 0 (0.0%) |
| High School Diploma | 0 (0.0%) | 0 (0.0%) |
| College or Associate's Degree | 0 (0.0%) | 0 (0.0%) |
| Bachelor's Degree | 0 (0.0%) | 0 (0.0%) |
| Graduate Degree | 0 (0.0%) | 0 (0.0%) |
| Total | 0 (0.0%) | 0 (0.0%) |
Employment Characteristics in High Falls
Employment by Class of Employer in High Falls
Among the 206 employed individuals in High Falls, private company employees (103 | 50.0%), self-employed (not incorporated) (50 | 24.3%), and not-for-profit organizations (29 | 14.1%) make up the most common classes of employment.
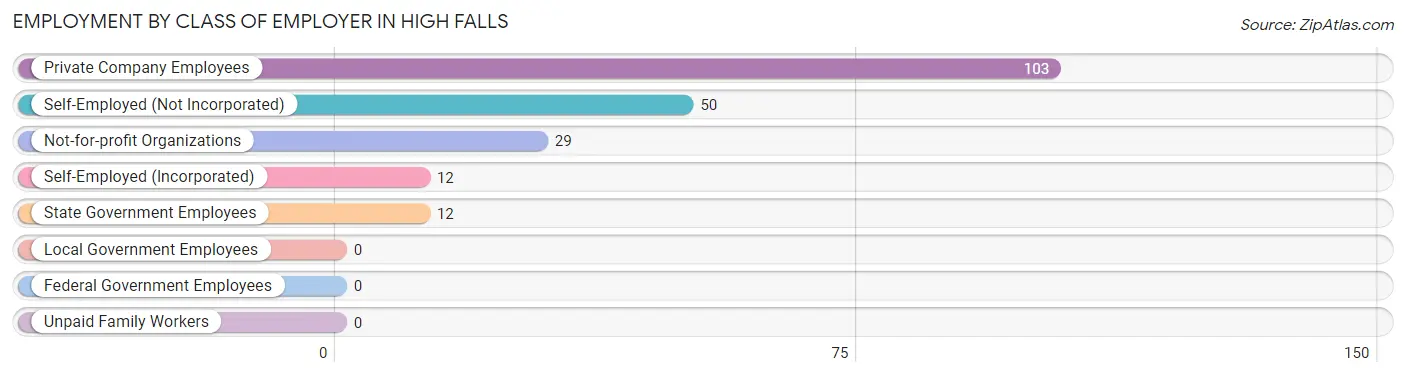
| Employer Class | # Employees | % Employees |
| Private Company Employees | 103 | 50.0% |
| Self-Employed (Incorporated) | 12 | 5.8% |
| Self-Employed (Not Incorporated) | 50 | 24.3% |
| Not-for-profit Organizations | 29 | 14.1% |
| Local Government Employees | 0 | 0.0% |
| State Government Employees | 12 | 5.8% |
| Federal Government Employees | 0 | 0.0% |
| Unpaid Family Workers | 0 | 0.0% |
| Total | 206 | 100.0% |
Employment Status by Age in High Falls
According to the labor force statistics for High Falls, out of the total population over 16 years of age (402), 59.7% or 240 individuals are in the labor force, with 8.3% or 20 of them unemployed. The age group with the highest labor force participation rate is 25 to 29 years, with 100.0% or 21 individuals in the labor force. Within the labor force, the 45 to 54 years age range has the highest percentage of unemployed individuals, with 20.0% or 20 of them being unemployed.
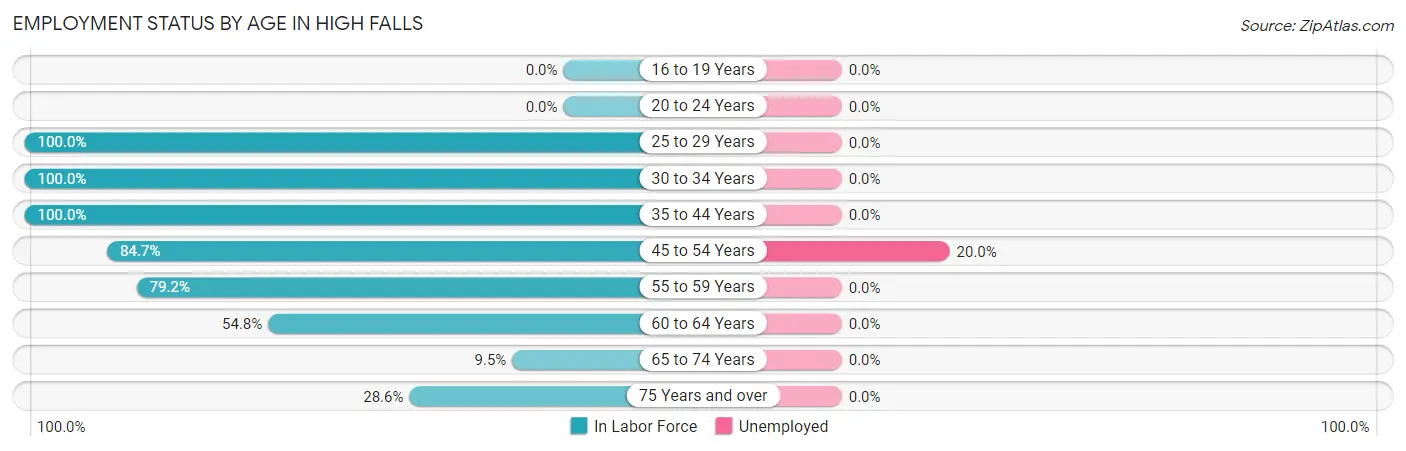
| Age Bracket | In Labor Force | Unemployed |
| 16 to 19 Years | 0 (0.0%) | 0 (0.0%) |
| 20 to 24 Years | 0 (0.0%) | 0 (0.0%) |
| 25 to 29 Years | 21 (100.0%) | 0 (0.0%) |
| 30 to 34 Years | 15 (100.0%) | 0 (0.0%) |
| 35 to 44 Years | 33 (100.0%) | 0 (0.0%) |
| 45 to 54 Years | 100 (84.7%) | 20 (20.0%) |
| 55 to 59 Years | 38 (79.2%) | 0 (0.0%) |
| 60 to 64 Years | 17 (54.8%) | 0 (0.0%) |
| 65 to 74 Years | 10 (9.5%) | 0 (0.0%) |
| 75 Years and over | 6 (28.6%) | 0 (0.0%) |
| Total | 240 (59.7%) | 20 (8.3%) |
Employment Status by Educational Attainment in High Falls
According to labor force statistics for High Falls, 84.2% of individuals (224) out of the total population between 25 and 64 years of age (266) are in the labor force, with 8.9% or 20 of them being unemployed. The group with the highest labor force participation rate are those with the educational attainment of bachelor's degree or higher, with 100.0% or 110 individuals in the labor force. Within the labor force, individuals with college / associate degree education have the highest percentage of unemployment, with 55.6% or 20 of them being unemployed.
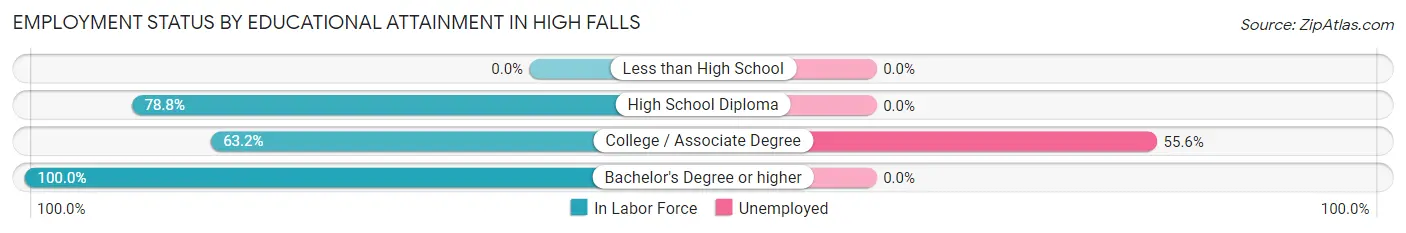
| Educational Attainment | In Labor Force | Unemployed |
| Less than High School | 0 (0.0%) | 0 (0.0%) |
| High School Diploma | 78 (78.8%) | 0 (0.0%) |
| College / Associate Degree | 36 (63.2%) | 32 (55.6%) |
| Bachelor's Degree or higher | 110 (100.0%) | 0 (0.0%) |
| Total | 224 (84.2%) | 24 (8.9%) |
Employment Occupations by Sex in High Falls
Management, Business, Science and Arts Occupations
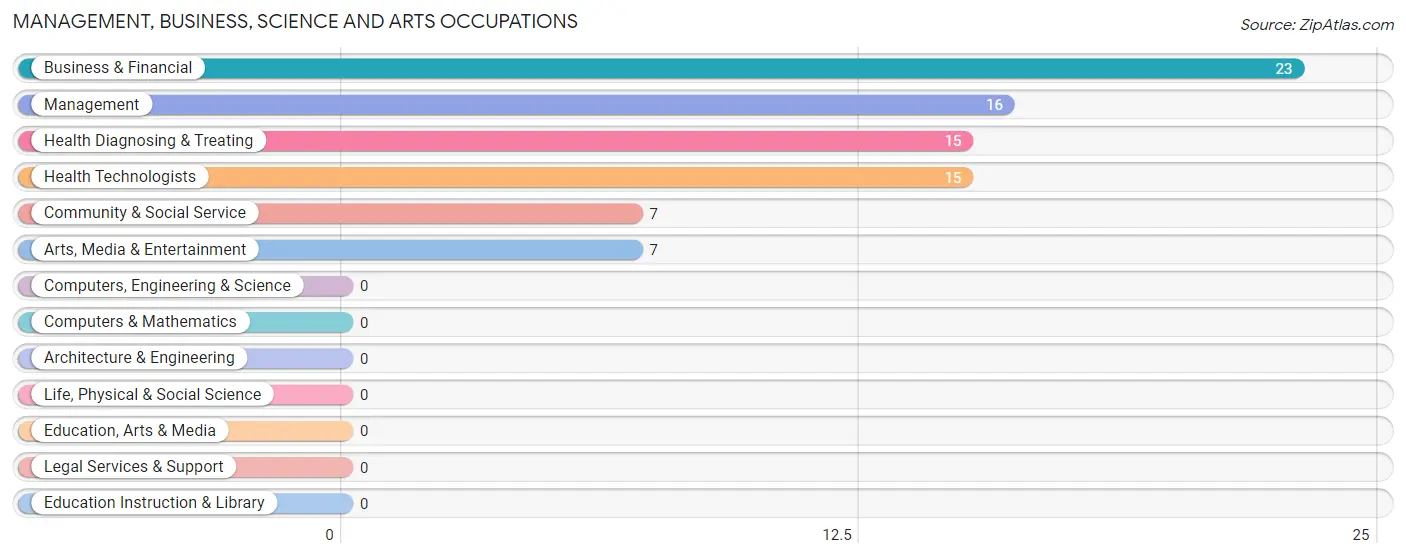
The most common Management, Business, Science and Arts occupations in High Falls are Business & Financial (23 | 10.4%), Management (16 | 7.3%), Health Diagnosing & Treating (15 | 6.8%), Health Technologists (15 | 6.8%), and Community & Social Service (7 | 3.2%).
Management, Business, Science and Arts Occupations by Sex
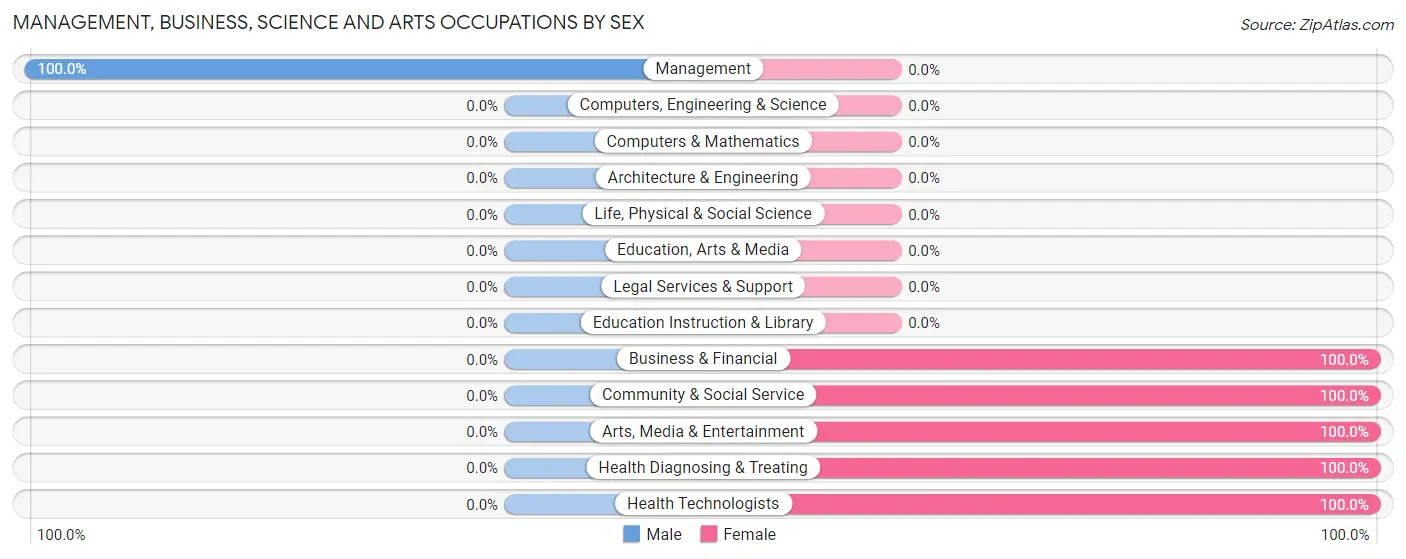
| Occupation | Male | Female |
| Management | 16 (100.0%) | 0 (0.0%) |
| Business & Financial | 0 (0.0%) | 23 (100.0%) |
| Computers, Engineering & Science | 0 (0.0%) | 0 (0.0%) |
| Computers & Mathematics | 0 (0.0%) | 0 (0.0%) |
| Architecture & Engineering | 0 (0.0%) | 0 (0.0%) |
| Life, Physical & Social Science | 0 (0.0%) | 0 (0.0%) |
| Community & Social Service | 0 (0.0%) | 7 (100.0%) |
| Education, Arts & Media | 0 (0.0%) | 0 (0.0%) |
| Legal Services & Support | 0 (0.0%) | 0 (0.0%) |
| Education Instruction & Library | 0 (0.0%) | 0 (0.0%) |
| Arts, Media & Entertainment | 0 (0.0%) | 7 (100.0%) |
| Health Diagnosing & Treating | 0 (0.0%) | 15 (100.0%) |
| Health Technologists | 0 (0.0%) | 15 (100.0%) |
| Total (Category) | 16 (26.2%) | 45 (73.8%) |
| Total (Overall) | 91 (41.4%) | 129 (58.6%) |
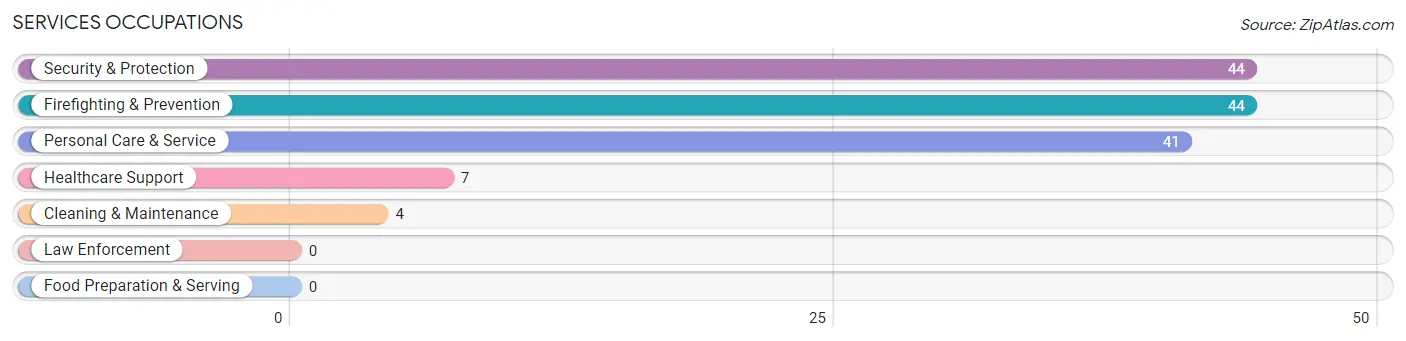
Services Occupations
The most common Services occupations in High Falls are Security & Protection (44 | 20.0%), Firefighting & Prevention (44 | 20.0%), Personal Care & Service (41 | 18.6%), Healthcare Support (7 | 3.2%), and Cleaning & Maintenance (4 | 1.8%).
Services Occupations by Sex
Within the Services occupations in High Falls, the most male-oriented occupations are Cleaning & Maintenance (100.0%), Personal Care & Service (100.0%), and Security & Protection (9.1%), while the most female-oriented occupations are Healthcare Support (100.0%), Security & Protection (90.9%), and Firefighting & Prevention (90.9%).
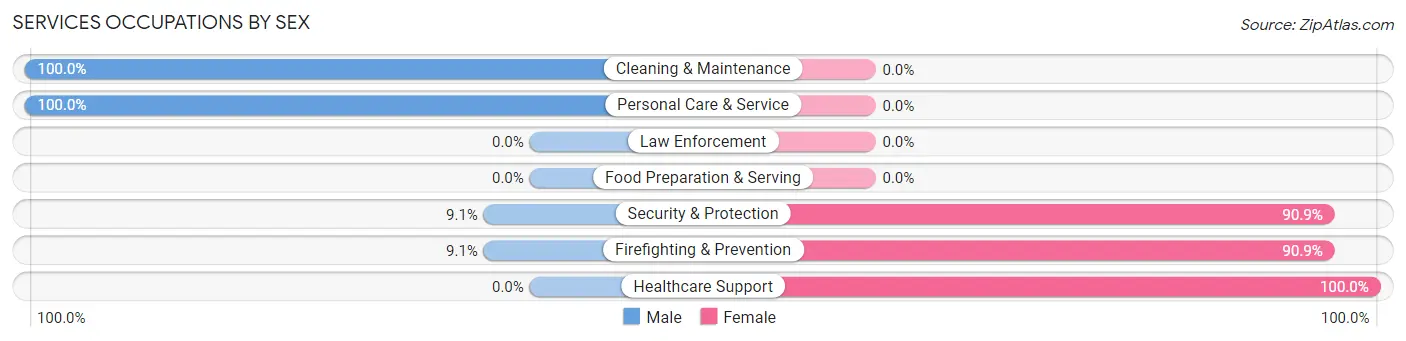
| Occupation | Male | Female |
| Healthcare Support | 0 (0.0%) | 7 (100.0%) |
| Security & Protection | 4 (9.1%) | 40 (90.9%) |
| Firefighting & Prevention | 4 (9.1%) | 40 (90.9%) |
| Law Enforcement | 0 (0.0%) | 0 (0.0%) |
| Food Preparation & Serving | 0 (0.0%) | 0 (0.0%) |
| Cleaning & Maintenance | 4 (100.0%) | 0 (0.0%) |
| Personal Care & Service | 41 (100.0%) | 0 (0.0%) |
| Total (Category) | 49 (51.0%) | 47 (49.0%) |
| Total (Overall) | 91 (41.4%) | 129 (58.6%) |
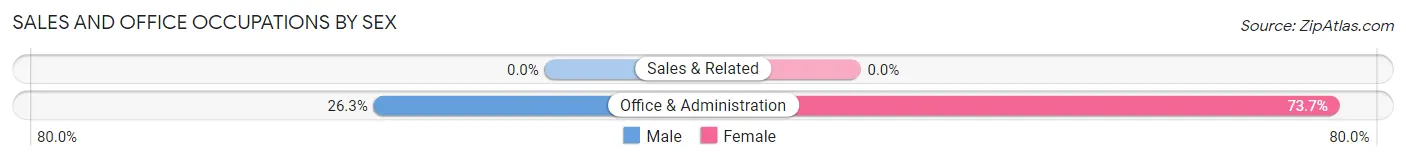
Sales and Office Occupations
The most common Sales and Office occupations in High Falls are , and Office & Administration (38 | 17.3%).
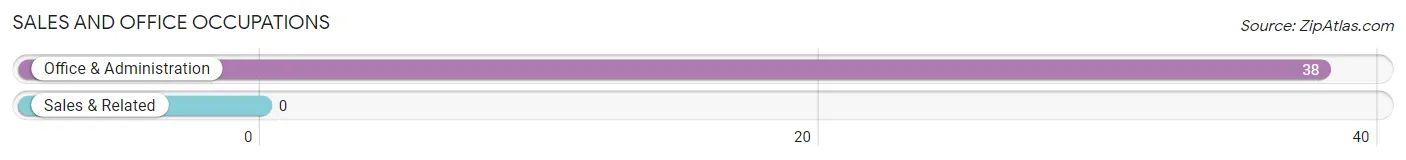
Sales and Office Occupations by Sex
| Occupation | Male | Female |
| Sales & Related | 0 (0.0%) | 0 (0.0%) |
| Office & Administration | 10 (26.3%) | 28 (73.7%) |
| Total (Category) | 10 (26.3%) | 28 (73.7%) |
| Total (Overall) | 91 (41.4%) | 129 (58.6%) |
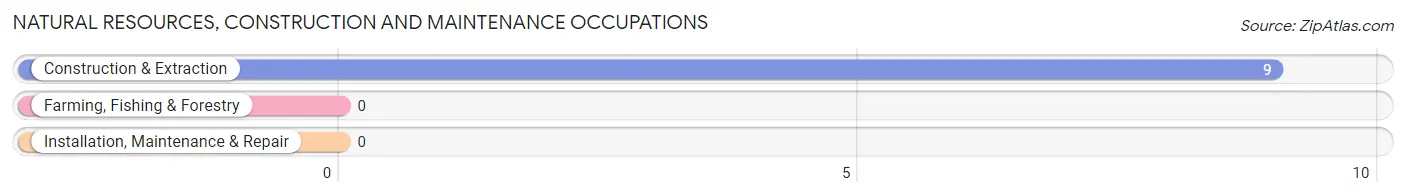
Natural Resources, Construction and Maintenance Occupations
The most common Natural Resources, Construction and Maintenance occupations in High Falls are , and Construction & Extraction (9 | 4.1%).
Natural Resources, Construction and Maintenance Occupations by Sex
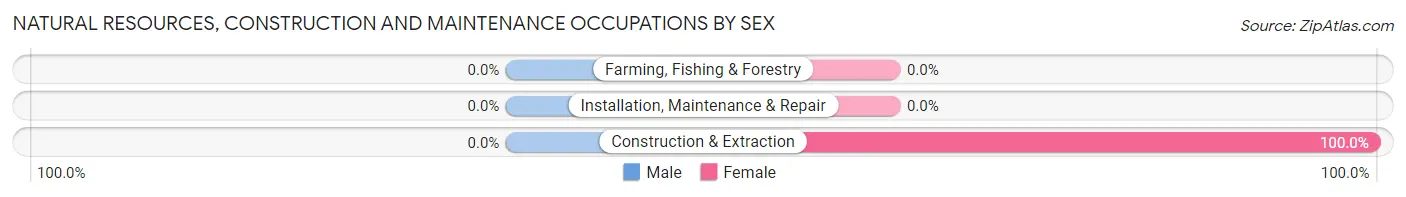
| Occupation | Male | Female |
| Farming, Fishing & Forestry | 0 (0.0%) | 0 (0.0%) |
| Construction & Extraction | 0 (0.0%) | 9 (100.0%) |
| Installation, Maintenance & Repair | 0 (0.0%) | 0 (0.0%) |
| Total (Category) | 0 (0.0%) | 9 (100.0%) |
| Total (Overall) | 91 (41.4%) | 129 (58.6%) |
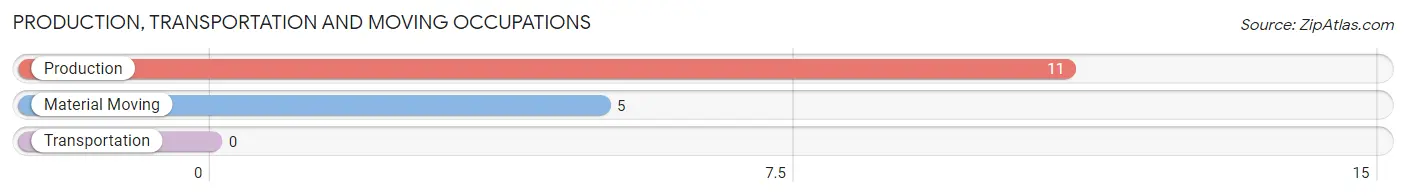
Production, Transportation and Moving Occupations
The most common Production, Transportation and Moving occupations in High Falls are Production (11 | 5.0%), and Material Moving (5 | 2.3%).
Production, Transportation and Moving Occupations by Sex
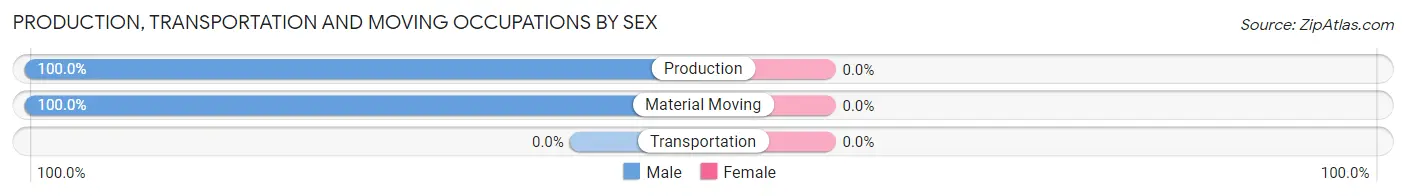
| Occupation | Male | Female |
| Production | 11 (100.0%) | 0 (0.0%) |
| Transportation | 0 (0.0%) | 0 (0.0%) |
| Material Moving | 5 (100.0%) | 0 (0.0%) |
| Total (Category) | 16 (100.0%) | 0 (0.0%) |
| Total (Overall) | 91 (41.4%) | 129 (58.6%) |
Employment Industries by Sex in High Falls
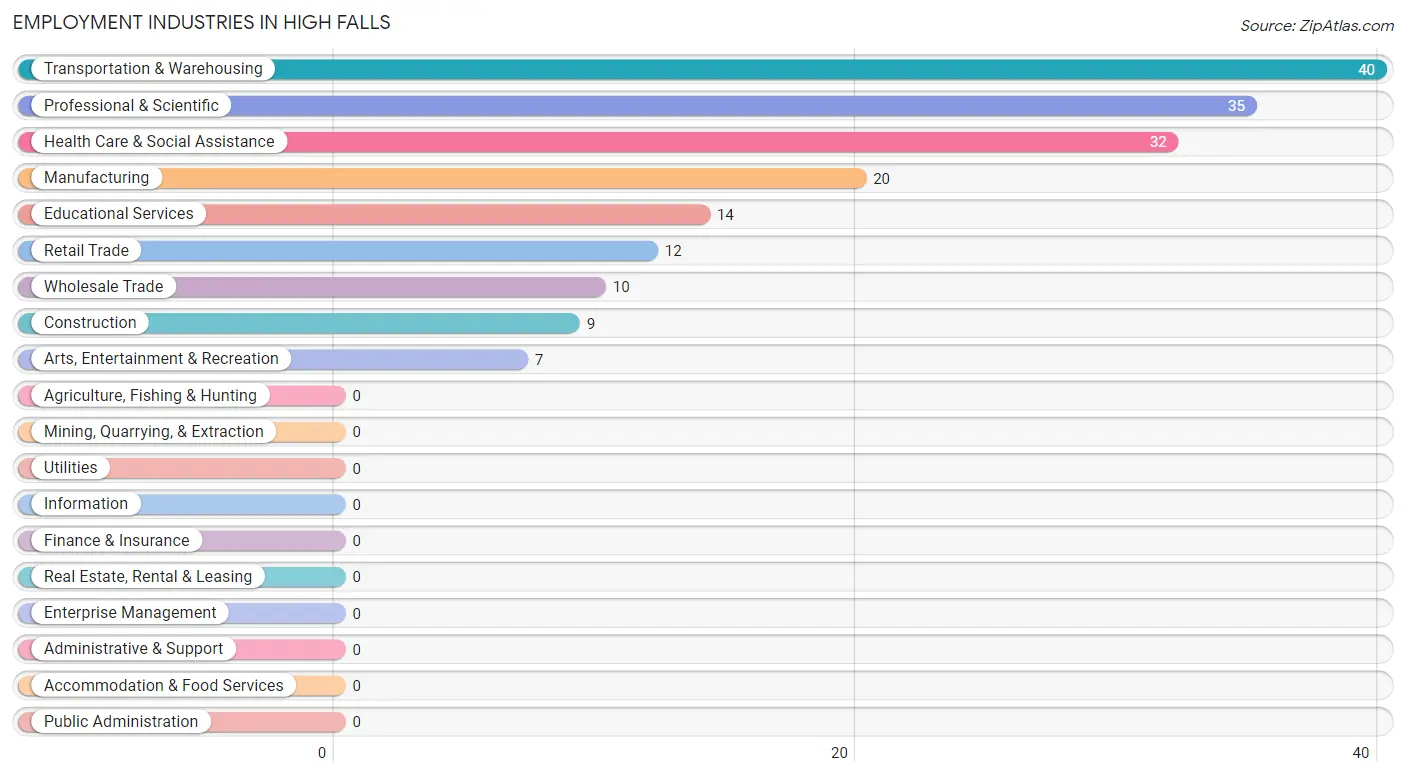
Employment Industries in High Falls
The major employment industries in High Falls include Transportation & Warehousing (40 | 18.2%), Professional & Scientific (35 | 15.9%), Health Care & Social Assistance (32 | 14.5%), Manufacturing (20 | 9.1%), and Educational Services (14 | 6.4%).
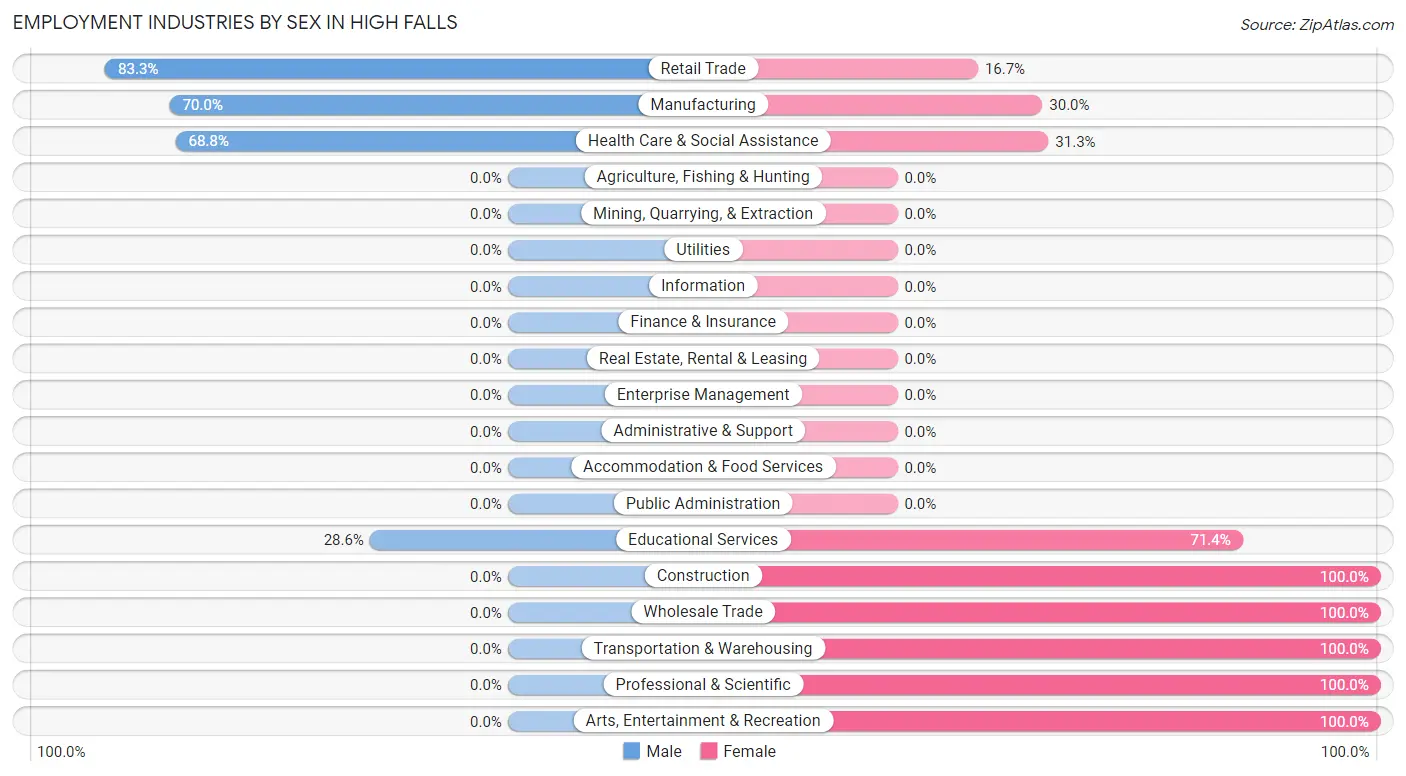
Employment Industries by Sex in High Falls
The High Falls industries that see more men than women are Retail Trade (83.3%), Manufacturing (70.0%), and Health Care & Social Assistance (68.8%), whereas the industries that tend to have a higher number of women are Construction (100.0%), Wholesale Trade (100.0%), and Transportation & Warehousing (100.0%).
| Industry | Male | Female |
| Agriculture, Fishing & Hunting | 0 (0.0%) | 0 (0.0%) |
| Mining, Quarrying, & Extraction | 0 (0.0%) | 0 (0.0%) |
| Construction | 0 (0.0%) | 9 (100.0%) |
| Manufacturing | 14 (70.0%) | 6 (30.0%) |
| Wholesale Trade | 0 (0.0%) | 10 (100.0%) |
| Retail Trade | 10 (83.3%) | 2 (16.7%) |
| Transportation & Warehousing | 0 (0.0%) | 40 (100.0%) |
| Utilities | 0 (0.0%) | 0 (0.0%) |
| Information | 0 (0.0%) | 0 (0.0%) |
| Finance & Insurance | 0 (0.0%) | 0 (0.0%) |
| Real Estate, Rental & Leasing | 0 (0.0%) | 0 (0.0%) |
| Professional & Scientific | 0 (0.0%) | 35 (100.0%) |
| Enterprise Management | 0 (0.0%) | 0 (0.0%) |
| Administrative & Support | 0 (0.0%) | 0 (0.0%) |
| Educational Services | 4 (28.6%) | 10 (71.4%) |
| Health Care & Social Assistance | 22 (68.8%) | 10 (31.2%) |
| Arts, Entertainment & Recreation | 0 (0.0%) | 7 (100.0%) |
| Accommodation & Food Services | 0 (0.0%) | 0 (0.0%) |
| Public Administration | 0 (0.0%) | 0 (0.0%) |
| Total | 91 (41.4%) | 129 (58.6%) |
Education in High Falls
School Enrollment in High Falls
The most common levels of schooling among the 85 students in High Falls are elementary school (24 | 28.2%), kindergarten (23 | 27.1%), and middle school (22 | 25.9%).
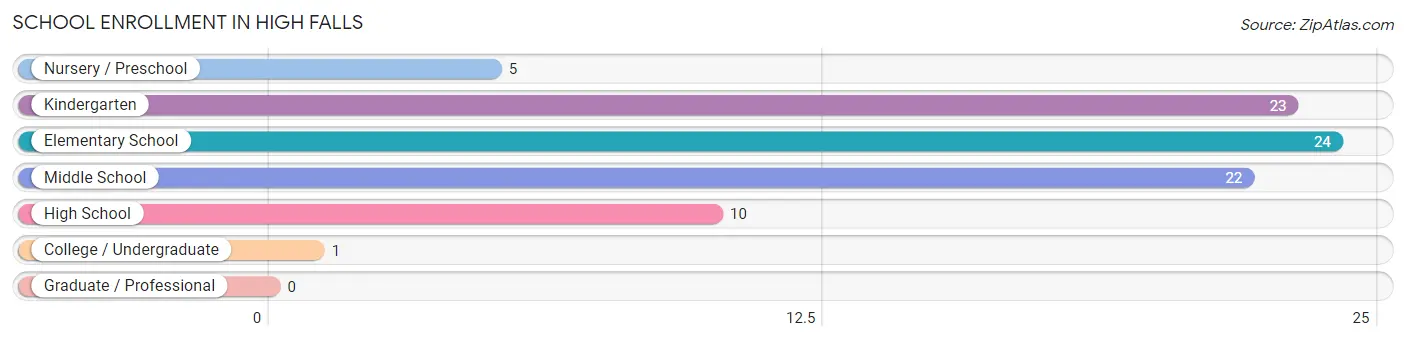
| School Level | # Students | % Students |
| Nursery / Preschool | 5 | 5.9% |
| Kindergarten | 23 | 27.1% |
| Elementary School | 24 | 28.2% |
| Middle School | 22 | 25.9% |
| High School | 10 | 11.8% |
| College / Undergraduate | 1 | 1.2% |
| Graduate / Professional | 0 | 0.0% |
| Total | 85 | 100.0% |
School Enrollment by Age by Funding Source in High Falls
Out of a total of 85 students who are enrolled in schools in High Falls, 17 (20.0%) attend a private institution, while the remaining 68 (80.0%) are enrolled in public schools. The age group of 10 to 14 year olds has the highest likelihood of being enrolled in private schools, with 16 (72.7% in the age bracket) enrolled. Conversely, the age group of 3 to 4 year olds has the lowest likelihood of being enrolled in a private school, with 5 (100.0% in the age bracket) attending a public institution.
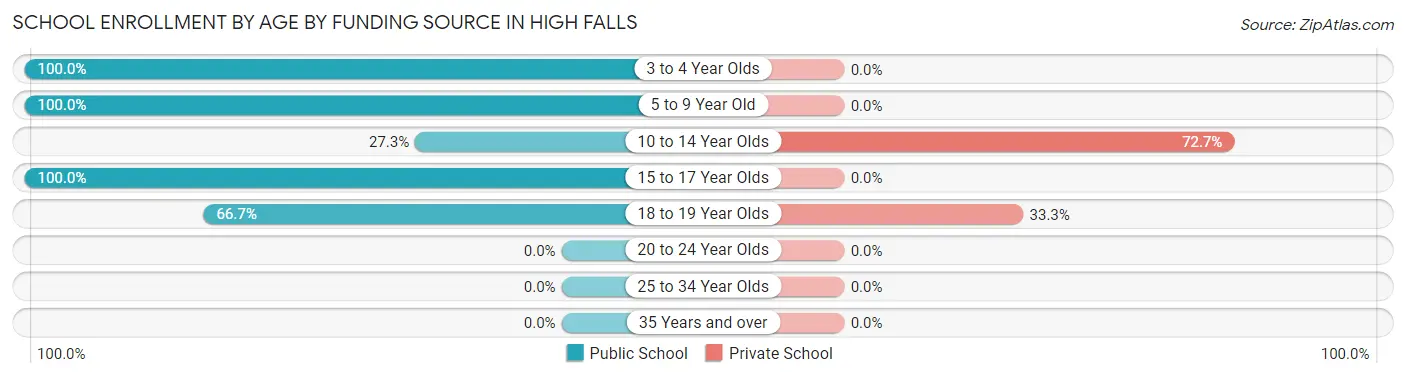
| Age Bracket | Public School | Private School |
| 3 to 4 Year Olds | 5 (100.0%) | 0 (0.0%) |
| 5 to 9 Year Old | 47 (100.0%) | 0 (0.0%) |
| 10 to 14 Year Olds | 6 (27.3%) | 16 (72.7%) |
| 15 to 17 Year Olds | 8 (100.0%) | 0 (0.0%) |
| 18 to 19 Year Olds | 2 (66.7%) | 1 (33.3%) |
| 20 to 24 Year Olds | 0 (0.0%) | 0 (0.0%) |
| 25 to 34 Year Olds | 0 (0.0%) | 0 (0.0%) |
| 35 Years and over | 0 (0.0%) | 0 (0.0%) |
| Total | 68 (80.0%) | 17 (20.0%) |
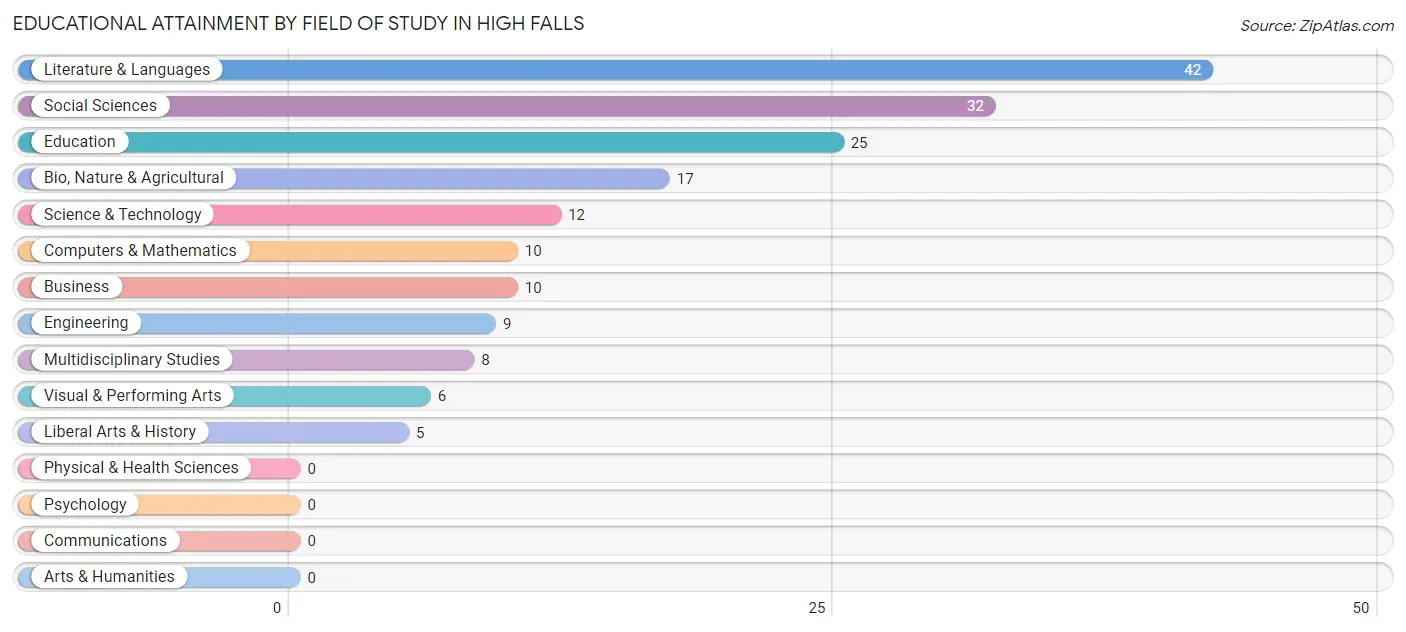
Educational Attainment by Field of Study in High Falls
Literature & languages (42 | 23.9%), social sciences (32 | 18.2%), education (25 | 14.2%), bio, nature & agricultural (17 | 9.7%), and science & technology (12 | 6.8%) are the most common fields of study among 176 individuals in High Falls who have obtained a bachelor's degree or higher.
| Field of Study | # Graduates | % Graduates |
| Computers & Mathematics | 10 | 5.7% |
| Bio, Nature & Agricultural | 17 | 9.7% |
| Physical & Health Sciences | 0 | 0.0% |
| Psychology | 0 | 0.0% |
| Social Sciences | 32 | 18.2% |
| Engineering | 9 | 5.1% |
| Multidisciplinary Studies | 8 | 4.5% |
| Science & Technology | 12 | 6.8% |
| Business | 10 | 5.7% |
| Education | 25 | 14.2% |
| Literature & Languages | 42 | 23.9% |
| Liberal Arts & History | 5 | 2.8% |
| Visual & Performing Arts | 6 | 3.4% |
| Communications | 0 | 0.0% |
| Arts & Humanities | 0 | 0.0% |
| Total | 176 | 100.0% |
Transportation & Commute in High Falls
Vehicle Availability by Sex in High Falls
The most prevalent vehicle ownership categories in High Falls are males with 3 vehicles (51, accounting for 58.6%) and females with 3 vehicles (40, making up 42.9%).
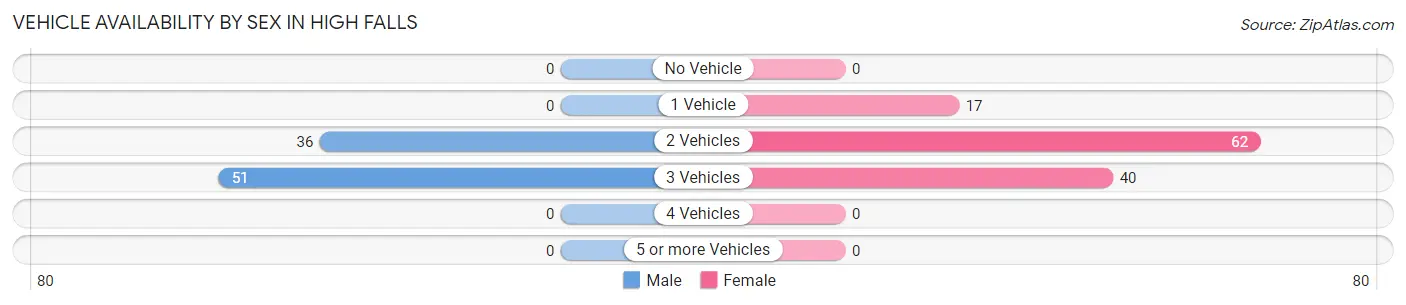
| Vehicles Available | Male | Female |
| No Vehicle | 0 (0.0%) | 0 (0.0%) |
| 1 Vehicle | 0 (0.0%) | 17 (14.3%) |
| 2 Vehicles | 36 (41.4%) | 62 (52.1%) |
| 3 Vehicles | 51 (58.6%) | 40 (33.6%) |
| 4 Vehicles | 0 (0.0%) | 0 (0.0%) |
| 5 or more Vehicles | 0 (0.0%) | 0 (0.0%) |
| Total | 87 (100.0%) | 119 (100.0%) |
Commute Time in High Falls
The most frequently occuring commute durations in High Falls are 10 to 14 minutes (89 commuters, 52.0%), 15 to 19 minutes (19 commuters, 11.1%), and 20 to 24 minutes (19 commuters, 11.1%).
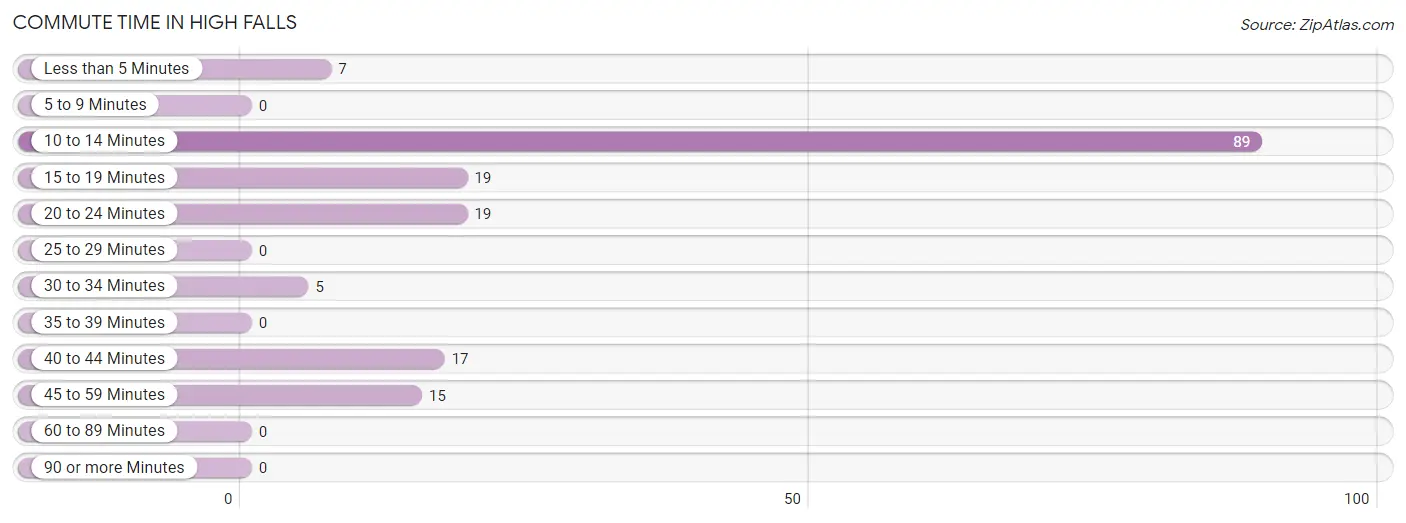
| Commute Time | # Commuters | % Commuters |
| Less than 5 Minutes | 7 | 4.1% |
| 5 to 9 Minutes | 0 | 0.0% |
| 10 to 14 Minutes | 89 | 52.0% |
| 15 to 19 Minutes | 19 | 11.1% |
| 20 to 24 Minutes | 19 | 11.1% |
| 25 to 29 Minutes | 0 | 0.0% |
| 30 to 34 Minutes | 5 | 2.9% |
| 35 to 39 Minutes | 0 | 0.0% |
| 40 to 44 Minutes | 17 | 9.9% |
| 45 to 59 Minutes | 15 | 8.8% |
| 60 to 89 Minutes | 0 | 0.0% |
| 90 or more Minutes | 0 | 0.0% |
Commute Time by Sex in High Falls
The most common commute times in High Falls are 10 to 14 minutes (66 commuters, 81.5%) for males and 10 to 14 minutes (23 commuters, 25.6%) for females.
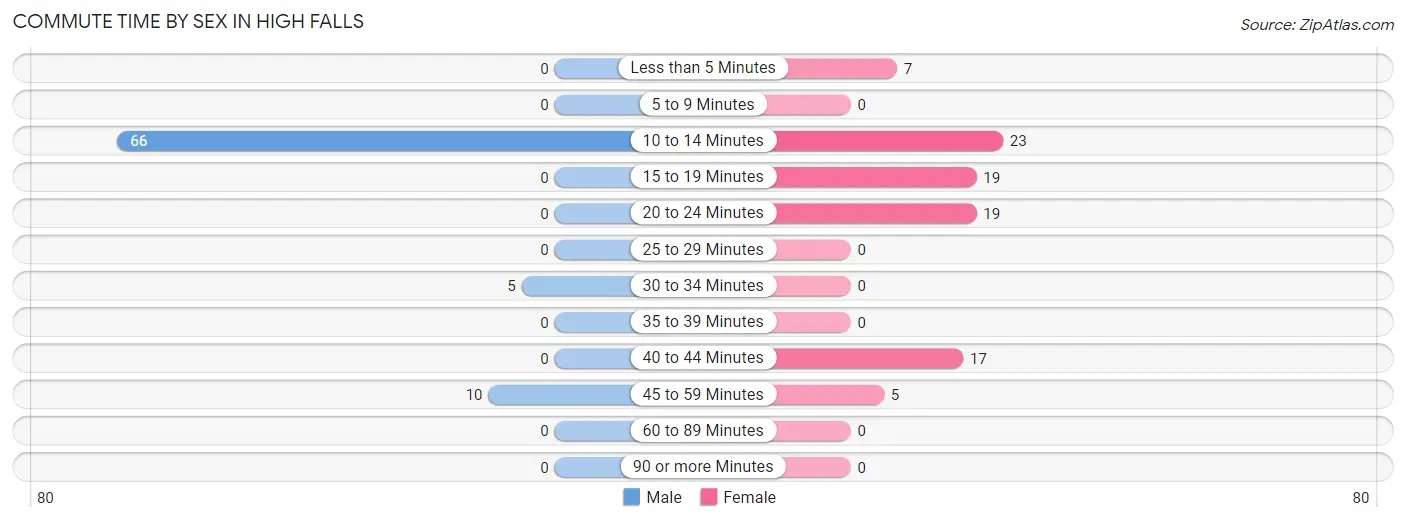
| Commute Time | Male | Female |
| Less than 5 Minutes | 0 (0.0%) | 7 (7.8%) |
| 5 to 9 Minutes | 0 (0.0%) | 0 (0.0%) |
| 10 to 14 Minutes | 66 (81.5%) | 23 (25.6%) |
| 15 to 19 Minutes | 0 (0.0%) | 19 (21.1%) |
| 20 to 24 Minutes | 0 (0.0%) | 19 (21.1%) |
| 25 to 29 Minutes | 0 (0.0%) | 0 (0.0%) |
| 30 to 34 Minutes | 5 (6.2%) | 0 (0.0%) |
| 35 to 39 Minutes | 0 (0.0%) | 0 (0.0%) |
| 40 to 44 Minutes | 0 (0.0%) | 17 (18.9%) |
| 45 to 59 Minutes | 10 (12.3%) | 5 (5.6%) |
| 60 to 89 Minutes | 0 (0.0%) | 0 (0.0%) |
| 90 or more Minutes | 0 (0.0%) | 0 (0.0%) |
Time of Departure to Work by Sex in High Falls
The most frequent times of departure to work in High Falls are 8:00 AM to 8:29 AM (34, 42.0%) for males and 6:00 AM to 6:29 AM (31, 34.4%) for females.
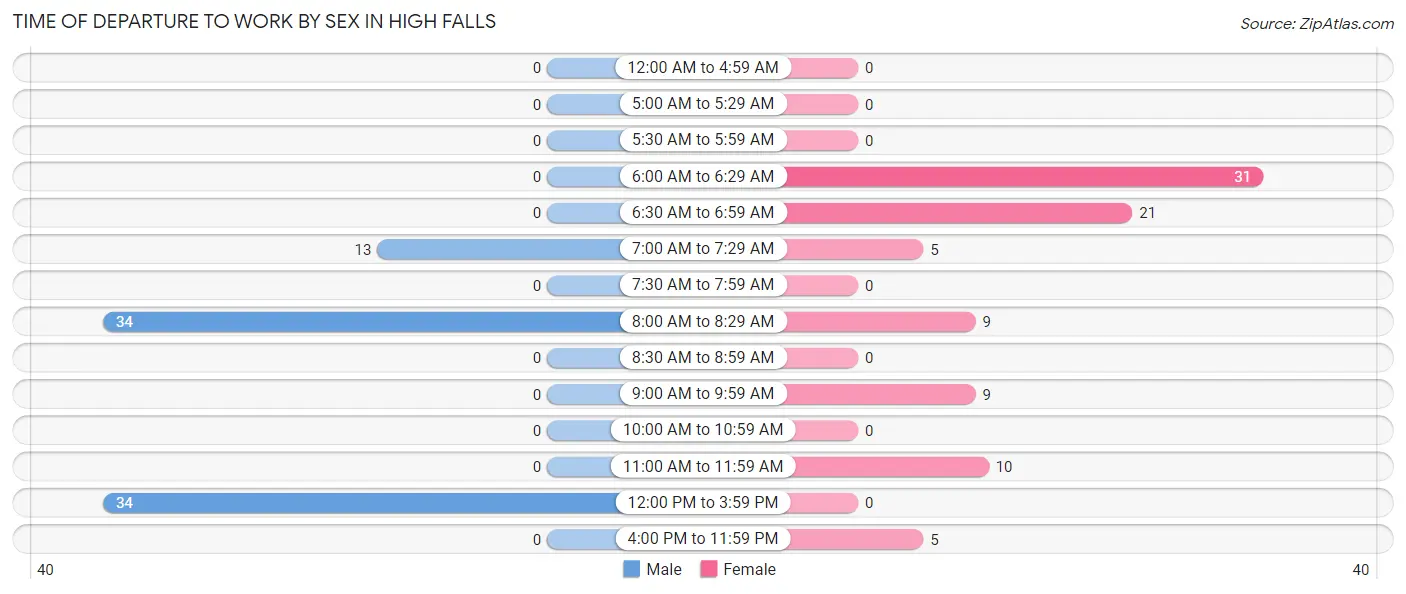
| Time of Departure | Male | Female |
| 12:00 AM to 4:59 AM | 0 (0.0%) | 0 (0.0%) |
| 5:00 AM to 5:29 AM | 0 (0.0%) | 0 (0.0%) |
| 5:30 AM to 5:59 AM | 0 (0.0%) | 0 (0.0%) |
| 6:00 AM to 6:29 AM | 0 (0.0%) | 31 (34.4%) |
| 6:30 AM to 6:59 AM | 0 (0.0%) | 21 (23.3%) |
| 7:00 AM to 7:29 AM | 13 (16.1%) | 5 (5.6%) |
| 7:30 AM to 7:59 AM | 0 (0.0%) | 0 (0.0%) |
| 8:00 AM to 8:29 AM | 34 (42.0%) | 9 (10.0%) |
| 8:30 AM to 8:59 AM | 0 (0.0%) | 0 (0.0%) |
| 9:00 AM to 9:59 AM | 0 (0.0%) | 9 (10.0%) |
| 10:00 AM to 10:59 AM | 0 (0.0%) | 0 (0.0%) |
| 11:00 AM to 11:59 AM | 0 (0.0%) | 10 (11.1%) |
| 12:00 PM to 3:59 PM | 34 (42.0%) | 0 (0.0%) |
| 4:00 PM to 11:59 PM | 0 (0.0%) | 5 (5.6%) |
| Total | 81 (100.0%) | 90 (100.0%) |
Housing Occupancy in High Falls
Occupancy by Ownership in High Falls
Of the total 198 dwellings in High Falls, owner-occupied units account for 186 (93.9%), while renter-occupied units make up 12 (6.1%).
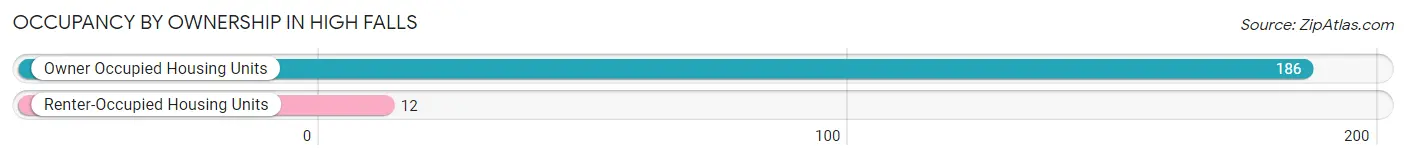
| Occupancy | # Housing Units | % Housing Units |
| Owner Occupied Housing Units | 186 | 93.9% |
| Renter-Occupied Housing Units | 12 | 6.1% |
| Total Occupied Housing Units | 198 | 100.0% |
Occupancy by Household Size in High Falls
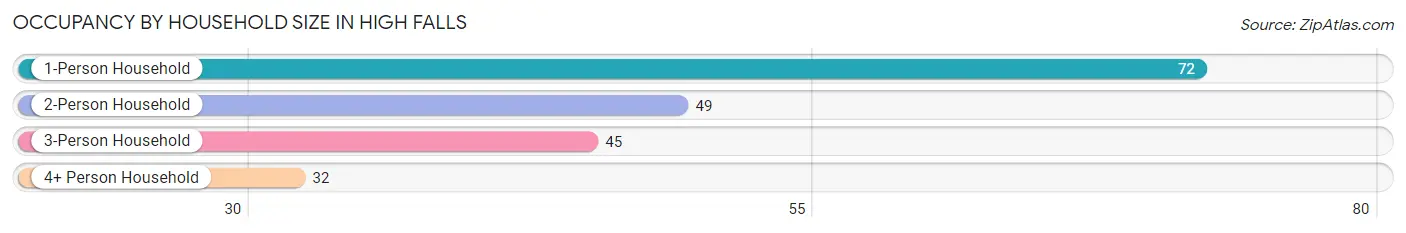
| Household Size | # Housing Units | % Housing Units |
| 1-Person Household | 72 | 36.4% |
| 2-Person Household | 49 | 24.7% |
| 3-Person Household | 45 | 22.7% |
| 4+ Person Household | 32 | 16.2% |
| Total Housing Units | 198 | 100.0% |
Occupancy by Ownership by Household Size in High Falls
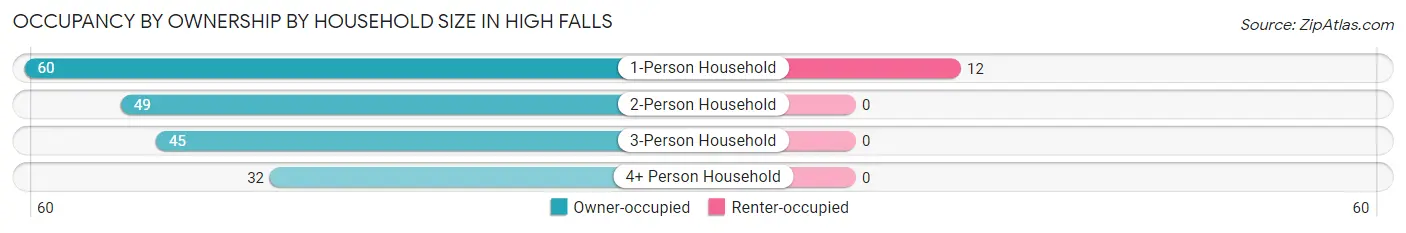
| Household Size | Owner-occupied | Renter-occupied |
| 1-Person Household | 60 (83.3%) | 12 (16.7%) |
| 2-Person Household | 49 (100.0%) | 0 (0.0%) |
| 3-Person Household | 45 (100.0%) | 0 (0.0%) |
| 4+ Person Household | 32 (100.0%) | 0 (0.0%) |
| Total Housing Units | 186 (93.9%) | 12 (6.1%) |
Occupancy by Educational Attainment in High Falls
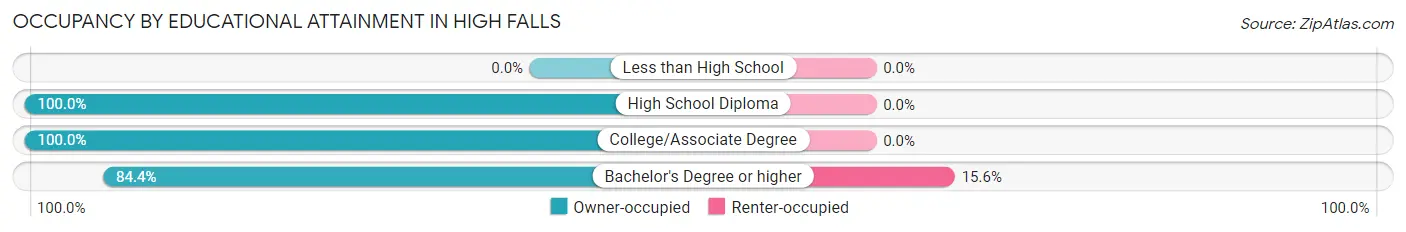
| Household Size | Owner-occupied | Renter-occupied |
| Less than High School | 0 (0.0%) | 0 (0.0%) |
| High School Diploma | 73 (100.0%) | 0 (0.0%) |
| College/Associate Degree | 48 (100.0%) | 0 (0.0%) |
| Bachelor's Degree or higher | 65 (84.4%) | 12 (15.6%) |
Occupancy by Age of Householder in High Falls
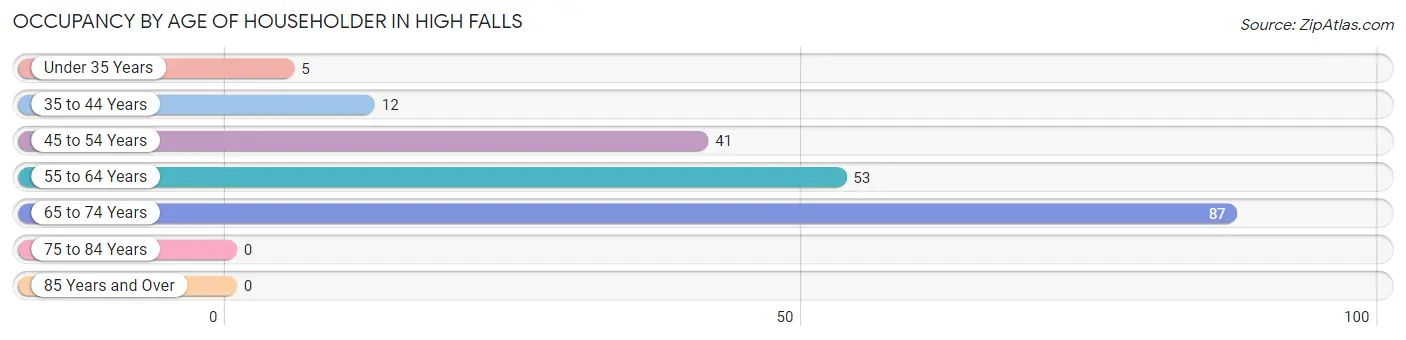
| Age Bracket | # Households | % Households |
| Under 35 Years | 5 | 2.5% |
| 35 to 44 Years | 12 | 6.1% |
| 45 to 54 Years | 41 | 20.7% |
| 55 to 64 Years | 53 | 26.8% |
| 65 to 74 Years | 87 | 43.9% |
| 75 to 84 Years | 0 | 0.0% |
| 85 Years and Over | 0 | 0.0% |
| Total | 198 | 100.0% |
Housing Finances in High Falls
Median Income by Occupancy in High Falls
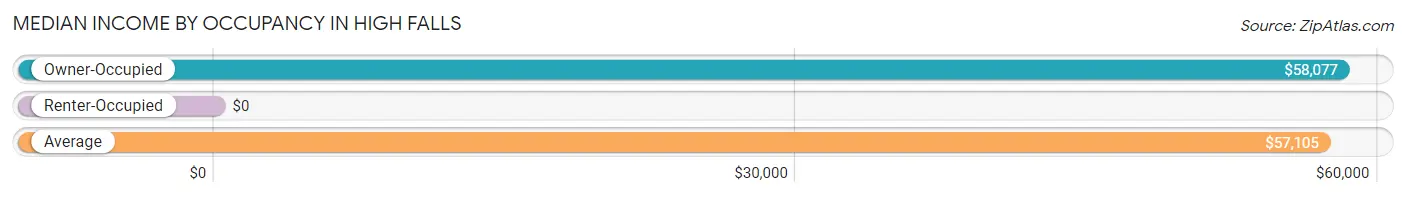
| Occupancy Type | # Households | Median Income |
| Owner-Occupied | 186 (93.9%) | $58,077 |
| Renter-Occupied | 12 (6.1%) | $0 |
| Average | 198 (100.0%) | $57,105 |
Occupancy by Householder Income Bracket in High Falls
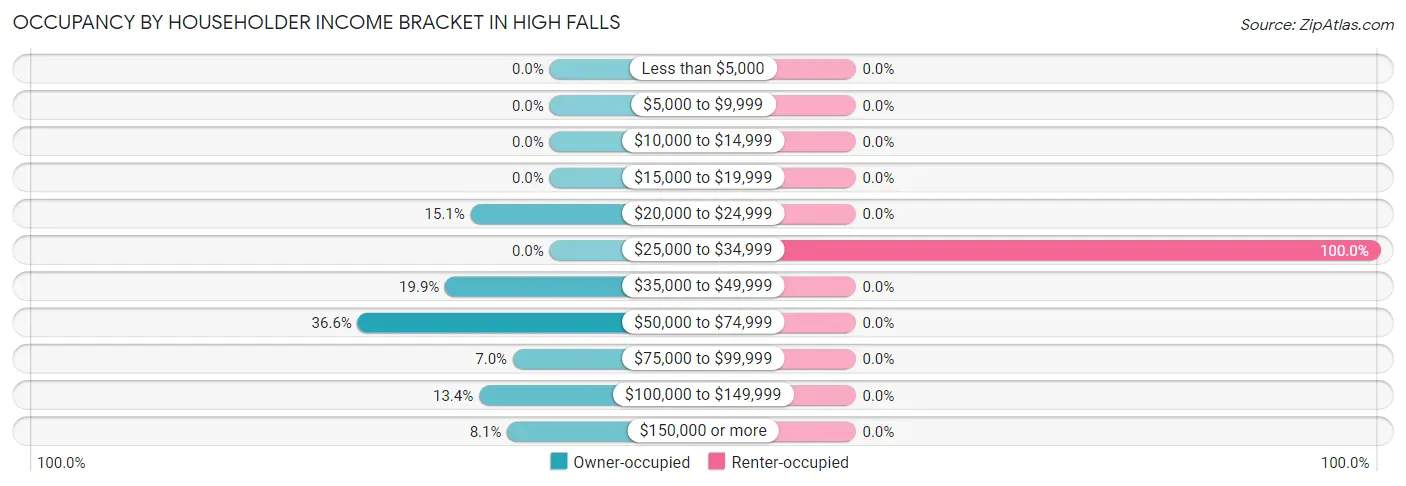
| Income Bracket | Owner-occupied | Renter-occupied |
| Less than $5,000 | 0 (0.0%) | 0 (0.0%) |
| $5,000 to $9,999 | 0 (0.0%) | 0 (0.0%) |
| $10,000 to $14,999 | 0 (0.0%) | 0 (0.0%) |
| $15,000 to $19,999 | 0 (0.0%) | 0 (0.0%) |
| $20,000 to $24,999 | 28 (15.0%) | 0 (0.0%) |
| $25,000 to $34,999 | 0 (0.0%) | 12 (100.0%) |
| $35,000 to $49,999 | 37 (19.9%) | 0 (0.0%) |
| $50,000 to $74,999 | 68 (36.6%) | 0 (0.0%) |
| $75,000 to $99,999 | 13 (7.0%) | 0 (0.0%) |
| $100,000 to $149,999 | 25 (13.4%) | 0 (0.0%) |
| $150,000 or more | 15 (8.1%) | 0 (0.0%) |
| Total | 186 (100.0%) | 12 (100.0%) |
Monthly Housing Cost Tiers in High Falls
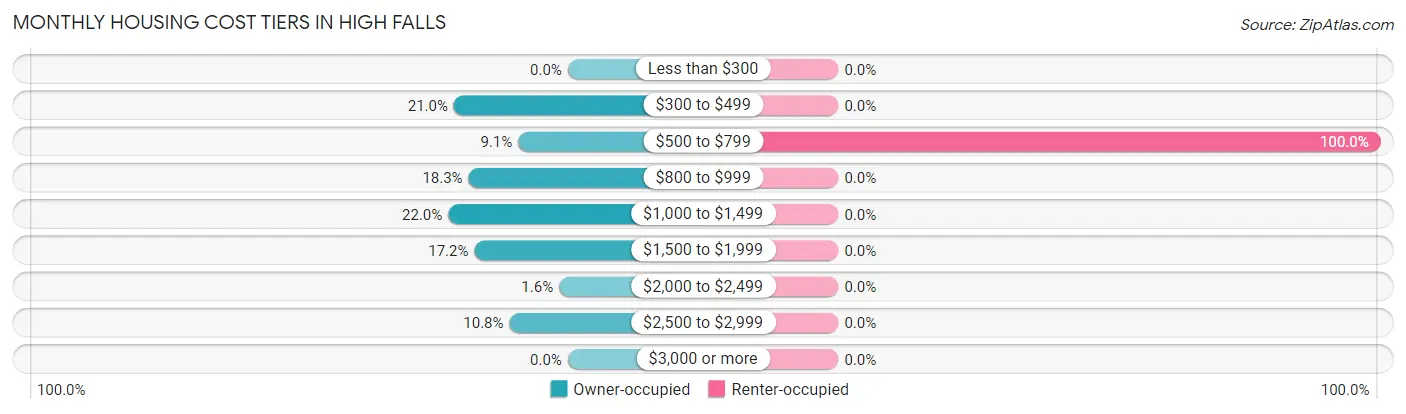
| Monthly Cost | Owner-occupied | Renter-occupied |
| Less than $300 | 0 (0.0%) | 0 (0.0%) |
| $300 to $499 | 39 (21.0%) | 0 (0.0%) |
| $500 to $799 | 17 (9.1%) | 12 (100.0%) |
| $800 to $999 | 34 (18.3%) | 0 (0.0%) |
| $1,000 to $1,499 | 41 (22.0%) | 0 (0.0%) |
| $1,500 to $1,999 | 32 (17.2%) | 0 (0.0%) |
| $2,000 to $2,499 | 3 (1.6%) | 0 (0.0%) |
| $2,500 to $2,999 | 20 (10.7%) | 0 (0.0%) |
| $3,000 or more | 0 (0.0%) | 0 (0.0%) |
| Total | 186 (100.0%) | 12 (100.0%) |
Physical Housing Characteristics in High Falls
Housing Structures in High Falls
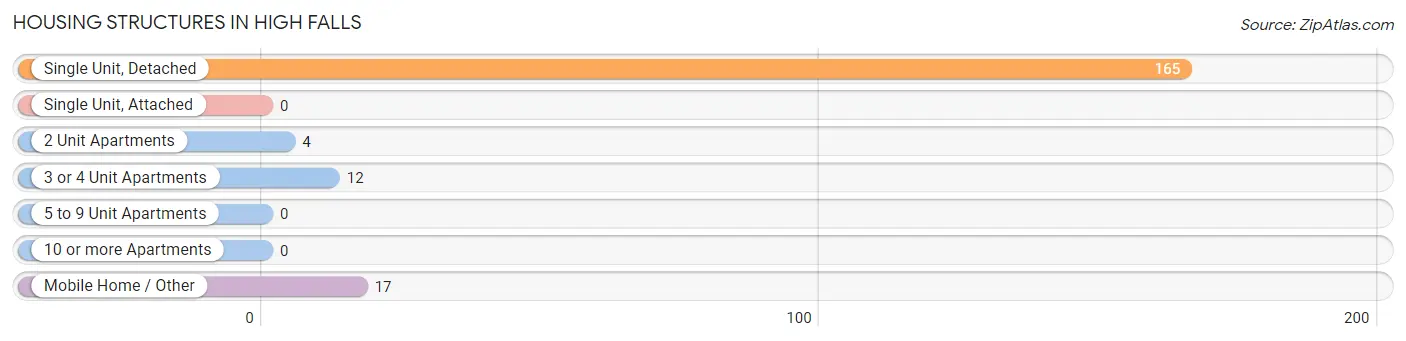
| Structure Type | # Housing Units | % Housing Units |
| Single Unit, Detached | 165 | 83.3% |
| Single Unit, Attached | 0 | 0.0% |
| 2 Unit Apartments | 4 | 2.0% |
| 3 or 4 Unit Apartments | 12 | 6.1% |
| 5 to 9 Unit Apartments | 0 | 0.0% |
| 10 or more Apartments | 0 | 0.0% |
| Mobile Home / Other | 17 | 8.6% |
| Total | 198 | 100.0% |
Housing Structures by Occupancy in High Falls
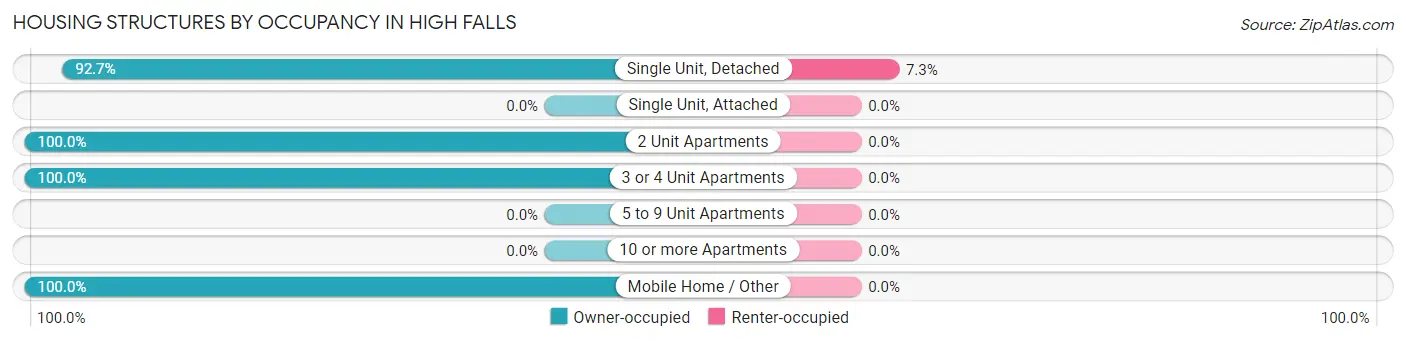
| Structure Type | Owner-occupied | Renter-occupied |
| Single Unit, Detached | 153 (92.7%) | 12 (7.3%) |
| Single Unit, Attached | 0 (0.0%) | 0 (0.0%) |
| 2 Unit Apartments | 4 (100.0%) | 0 (0.0%) |
| 3 or 4 Unit Apartments | 12 (100.0%) | 0 (0.0%) |
| 5 to 9 Unit Apartments | 0 (0.0%) | 0 (0.0%) |
| 10 or more Apartments | 0 (0.0%) | 0 (0.0%) |
| Mobile Home / Other | 17 (100.0%) | 0 (0.0%) |
| Total | 186 (93.9%) | 12 (6.1%) |
Housing Structures by Number of Rooms in High Falls
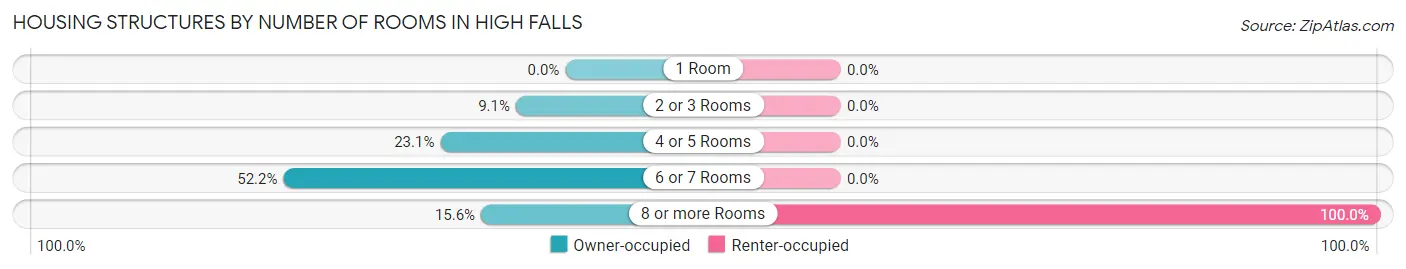
| Number of Rooms | Owner-occupied | Renter-occupied |
| 1 Room | 0 (0.0%) | 0 (0.0%) |
| 2 or 3 Rooms | 17 (9.1%) | 0 (0.0%) |
| 4 or 5 Rooms | 43 (23.1%) | 0 (0.0%) |
| 6 or 7 Rooms | 97 (52.1%) | 0 (0.0%) |
| 8 or more Rooms | 29 (15.6%) | 12 (100.0%) |
| Total | 186 (100.0%) | 12 (100.0%) |
Housing Structure by Heating Type in High Falls
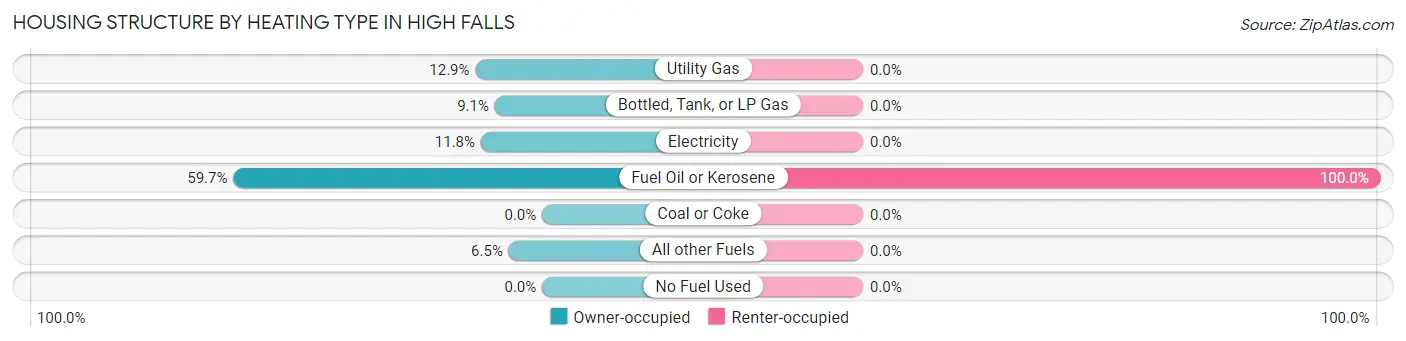
| Heating Type | Owner-occupied | Renter-occupied |
| Utility Gas | 24 (12.9%) | 0 (0.0%) |
| Bottled, Tank, or LP Gas | 17 (9.1%) | 0 (0.0%) |
| Electricity | 22 (11.8%) | 0 (0.0%) |
| Fuel Oil or Kerosene | 111 (59.7%) | 12 (100.0%) |
| Coal or Coke | 0 (0.0%) | 0 (0.0%) |
| All other Fuels | 12 (6.5%) | 0 (0.0%) |
| No Fuel Used | 0 (0.0%) | 0 (0.0%) |
| Total | 186 (100.0%) | 12 (100.0%) |
Household Vehicle Usage in High Falls
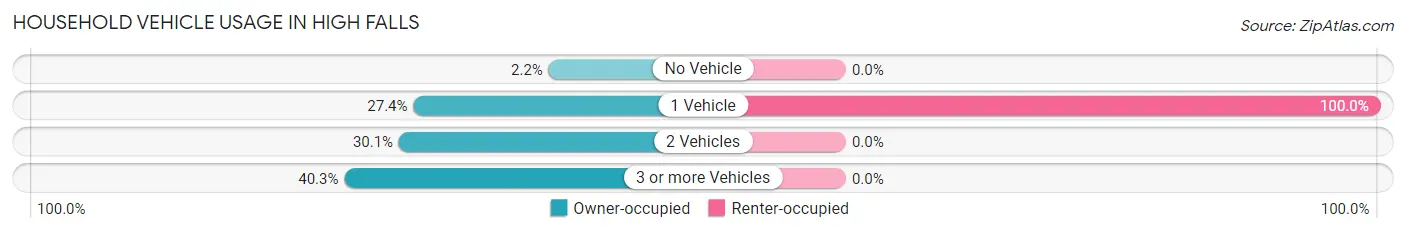
| Vehicles per Household | Owner-occupied | Renter-occupied |
| No Vehicle | 4 (2.1%) | 0 (0.0%) |
| 1 Vehicle | 51 (27.4%) | 12 (100.0%) |
| 2 Vehicles | 56 (30.1%) | 0 (0.0%) |
| 3 or more Vehicles | 75 (40.3%) | 0 (0.0%) |
| Total | 186 (100.0%) | 12 (100.0%) |
Real Estate & Mortgages in High Falls
Real Estate and Mortgage Overview in High Falls
| Characteristic | Without Mortgage | With Mortgage |
| Housing Units | 90 | 96 |
| Median Property Value | $262,500 | $184,400 |
| Median Household Income | - | - |
| Monthly Housing Costs | - | - |
| Real Estate Taxes | $3,455 | $0 |
Property Value by Mortgage Status in High Falls
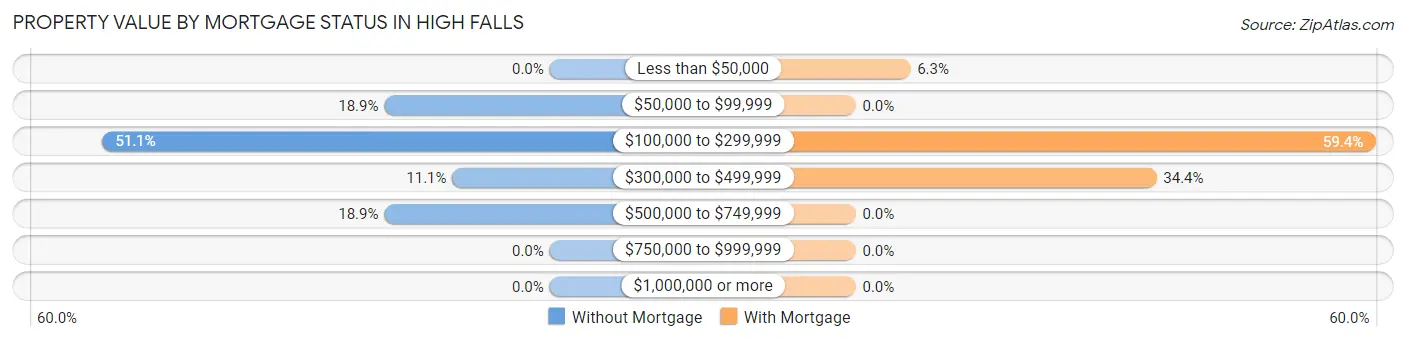
| Property Value | Without Mortgage | With Mortgage |
| Less than $50,000 | 0 (0.0%) | 6 (6.2%) |
| $50,000 to $99,999 | 17 (18.9%) | 0 (0.0%) |
| $100,000 to $299,999 | 46 (51.1%) | 57 (59.4%) |
| $300,000 to $499,999 | 10 (11.1%) | 33 (34.4%) |
| $500,000 to $749,999 | 17 (18.9%) | 0 (0.0%) |
| $750,000 to $999,999 | 0 (0.0%) | 0 (0.0%) |
| $1,000,000 or more | 0 (0.0%) | 0 (0.0%) |
| Total | 90 (100.0%) | 96 (100.0%) |
Household Income by Mortgage Status in High Falls
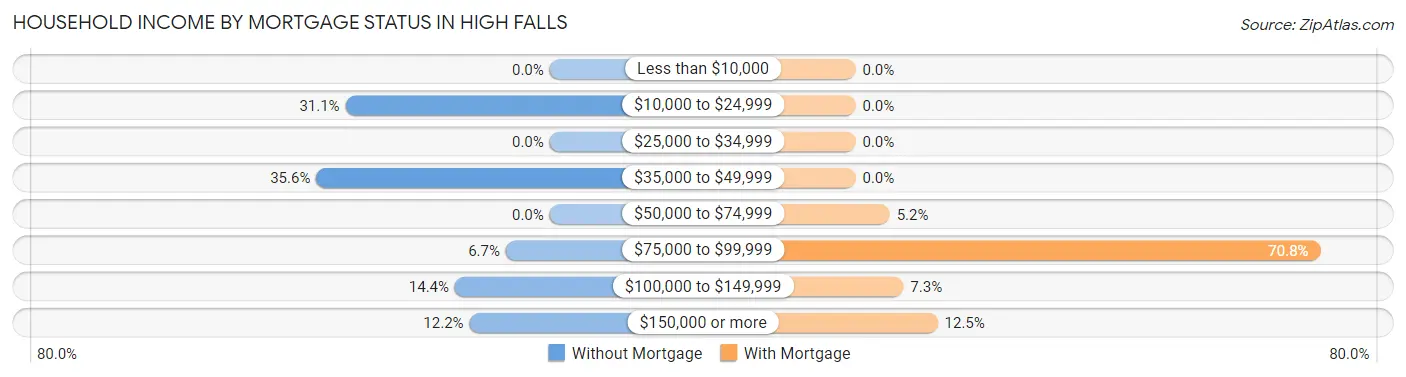
| Household Income | Without Mortgage | With Mortgage |
| Less than $10,000 | 0 (0.0%) | 0 (0.0%) |
| $10,000 to $24,999 | 28 (31.1%) | 0 (0.0%) |
| $25,000 to $34,999 | 0 (0.0%) | 0 (0.0%) |
| $35,000 to $49,999 | 32 (35.6%) | 0 (0.0%) |
| $50,000 to $74,999 | 0 (0.0%) | 5 (5.2%) |
| $75,000 to $99,999 | 6 (6.7%) | 68 (70.8%) |
| $100,000 to $149,999 | 13 (14.4%) | 7 (7.3%) |
| $150,000 or more | 11 (12.2%) | 12 (12.5%) |
| Total | 90 (100.0%) | 96 (100.0%) |
Property Value to Household Income Ratio in High Falls
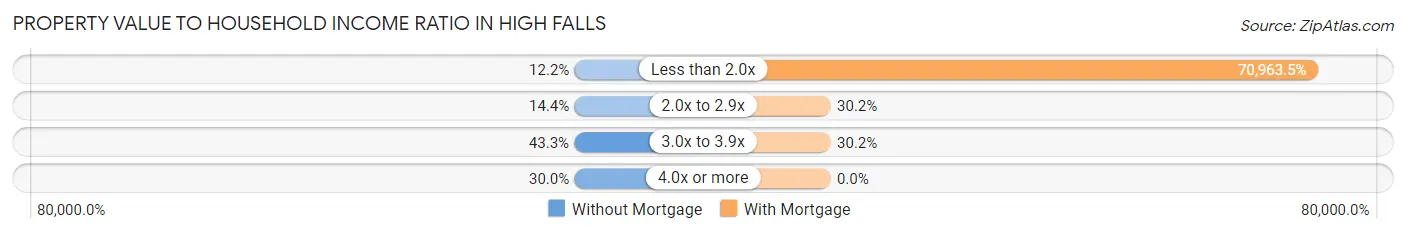
| Value-to-Income Ratio | Without Mortgage | With Mortgage |
| Less than 2.0x | 11 (12.2%) | 68,125 (70,963.5%) |
| 2.0x to 2.9x | 13 (14.4%) | 29 (30.2%) |
| 3.0x to 3.9x | 39 (43.3%) | 29 (30.2%) |
| 4.0x or more | 27 (30.0%) | 0 (0.0%) |
| Total | 90 (100.0%) | 96 (100.0%) |
Real Estate Taxes by Mortgage Status in High Falls
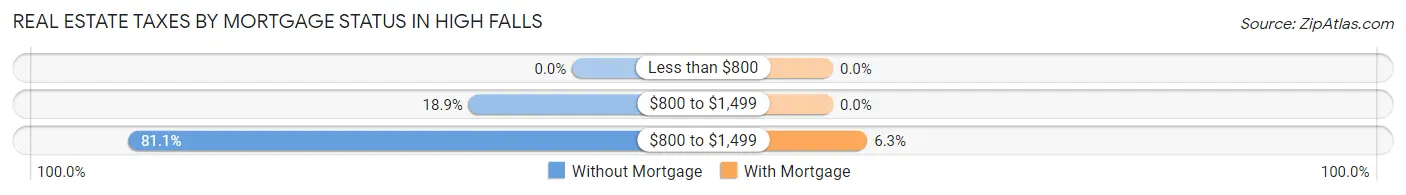
| Property Taxes | Without Mortgage | With Mortgage |
| Less than $800 | 0 (0.0%) | 0 (0.0%) |
| $800 to $1,499 | 17 (18.9%) | 0 (0.0%) |
| $800 to $1,499 | 73 (81.1%) | 6 (6.2%) |
| Total | 90 (100.0%) | 96 (100.0%) |
Health & Disability in High Falls
Health Insurance Coverage by Age in High Falls
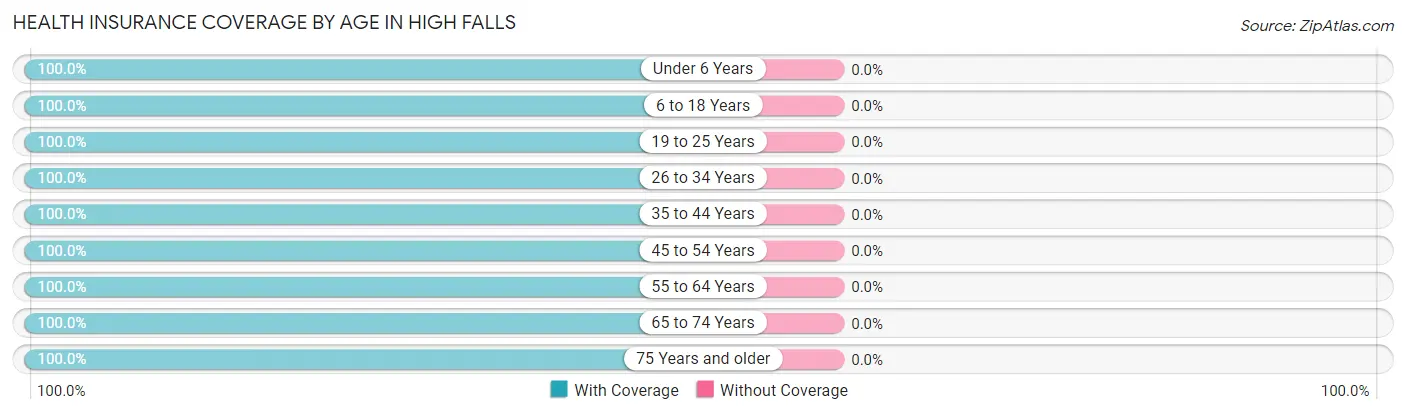
| Age Bracket | With Coverage | Without Coverage |
| Under 6 Years | 23 (100.0%) | 0 (0.0%) |
| 6 to 18 Years | 62 (100.0%) | 0 (0.0%) |
| 19 to 25 Years | 21 (100.0%) | 0 (0.0%) |
| 26 to 34 Years | 15 (100.0%) | 0 (0.0%) |
| 35 to 44 Years | 33 (100.0%) | 0 (0.0%) |
| 45 to 54 Years | 118 (100.0%) | 0 (0.0%) |
| 55 to 64 Years | 79 (100.0%) | 0 (0.0%) |
| 65 to 74 Years | 105 (100.0%) | 0 (0.0%) |
| 75 Years and older | 21 (100.0%) | 0 (0.0%) |
| Total | 477 (100.0%) | 0 (0.0%) |
Health Insurance Coverage by Citizenship Status in High Falls
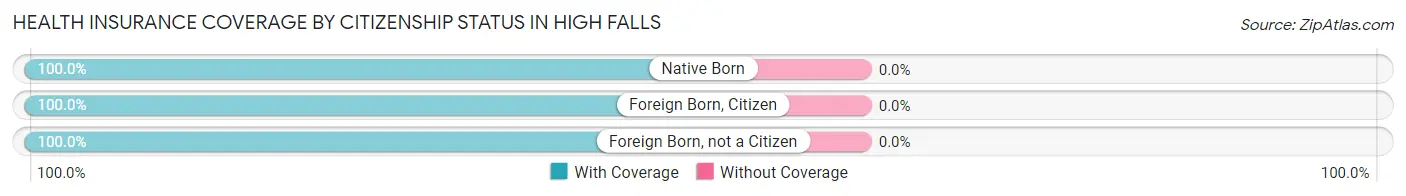
| Citizenship Status | With Coverage | Without Coverage |
| Native Born | 23 (100.0%) | 0 (0.0%) |
| Foreign Born, Citizen | 62 (100.0%) | 0 (0.0%) |
| Foreign Born, not a Citizen | 21 (100.0%) | 0 (0.0%) |
Health Insurance Coverage by Household Income in High Falls
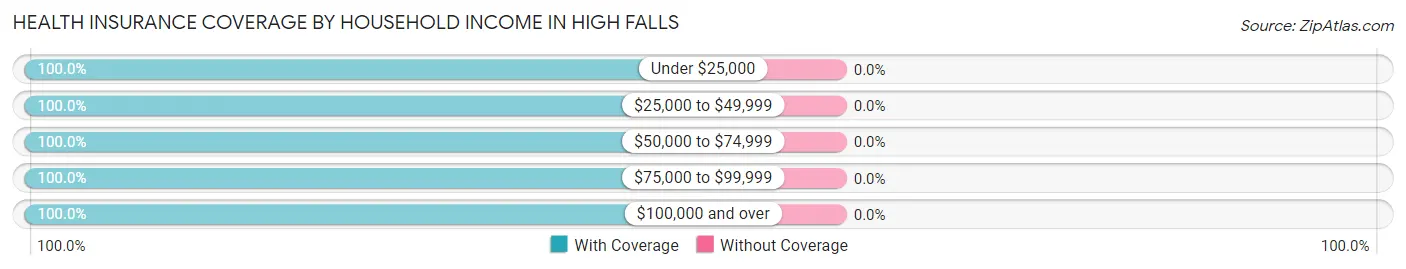
| Household Income | With Coverage | Without Coverage |
| Under $25,000 | 59 (100.0%) | 0 (0.0%) |
| $25,000 to $49,999 | 74 (100.0%) | 0 (0.0%) |
| $50,000 to $74,999 | 149 (100.0%) | 0 (0.0%) |
| $75,000 to $99,999 | 31 (100.0%) | 0 (0.0%) |
| $100,000 and over | 164 (100.0%) | 0 (0.0%) |
Public vs Private Health Insurance Coverage by Age in High Falls
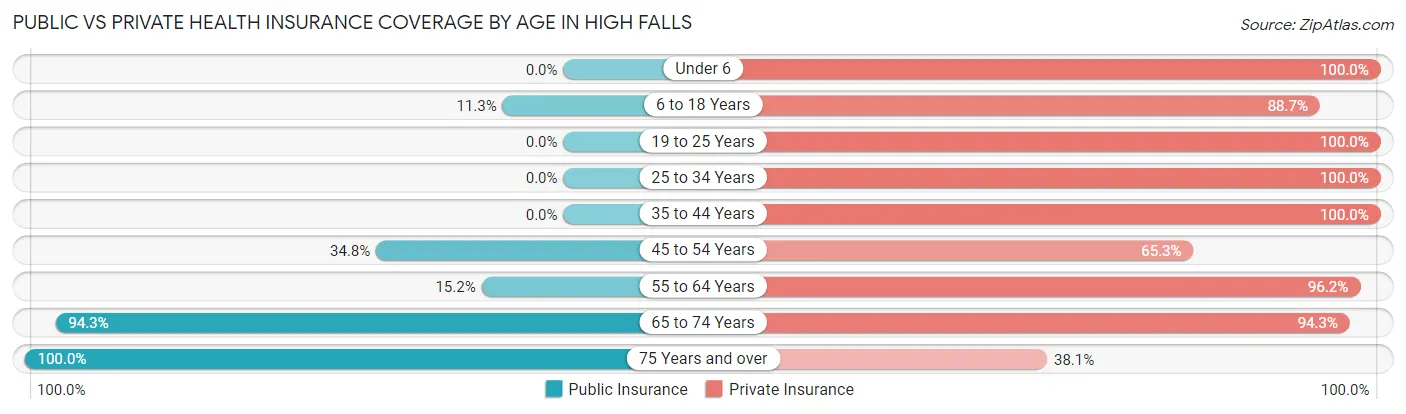
| Age Bracket | Public Insurance | Private Insurance |
| Under 6 | 0 (0.0%) | 23 (100.0%) |
| 6 to 18 Years | 7 (11.3%) | 55 (88.7%) |
| 19 to 25 Years | 0 (0.0%) | 21 (100.0%) |
| 25 to 34 Years | 0 (0.0%) | 15 (100.0%) |
| 35 to 44 Years | 0 (0.0%) | 33 (100.0%) |
| 45 to 54 Years | 41 (34.7%) | 77 (65.2%) |
| 55 to 64 Years | 12 (15.2%) | 76 (96.2%) |
| 65 to 74 Years | 99 (94.3%) | 99 (94.3%) |
| 75 Years and over | 21 (100.0%) | 8 (38.1%) |
| Total | 180 (37.7%) | 407 (85.3%) |
Disability Status by Sex by Age in High Falls
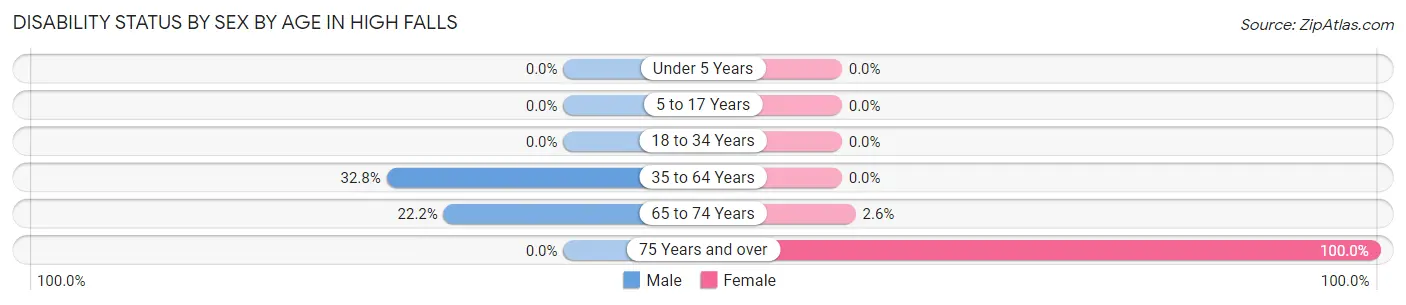
| Age Bracket | Male | Female |
| Under 5 Years | 0 (0.0%) | 0 (0.0%) |
| 5 to 17 Years | 0 (0.0%) | 0 (0.0%) |
| 18 to 34 Years | 0 (0.0%) | 0 (0.0%) |
| 35 to 64 Years | 42 (32.8%) | 0 (0.0%) |
| 65 to 74 Years | 6 (22.2%) | 2 (2.6%) |
| 75 Years and over | 0 (0.0%) | 7 (100.0%) |
Disability Class by Sex by Age in High Falls
Disability Class: Hearing Difficulty
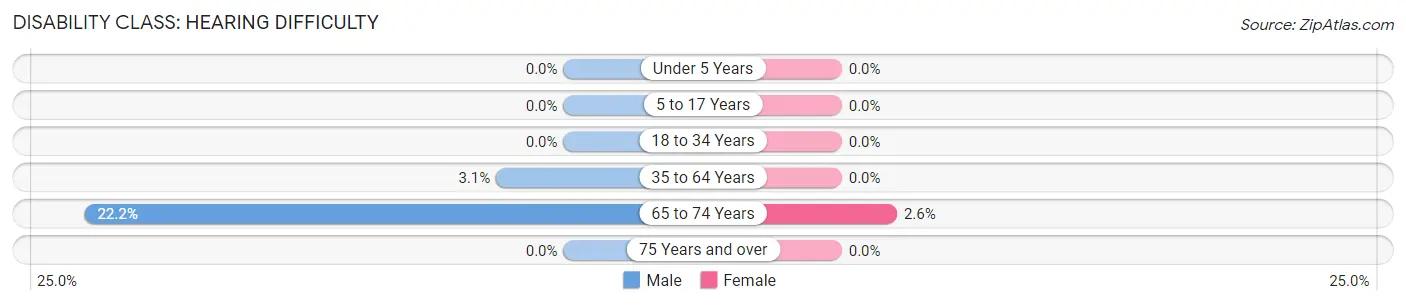
| Age Bracket | Male | Female |
| Under 5 Years | 0 (0.0%) | 0 (0.0%) |
| 5 to 17 Years | 0 (0.0%) | 0 (0.0%) |
| 18 to 34 Years | 0 (0.0%) | 0 (0.0%) |
| 35 to 64 Years | 4 (3.1%) | 0 (0.0%) |
| 65 to 74 Years | 6 (22.2%) | 2 (2.6%) |
| 75 Years and over | 0 (0.0%) | 0 (0.0%) |
Disability Class: Vision Difficulty
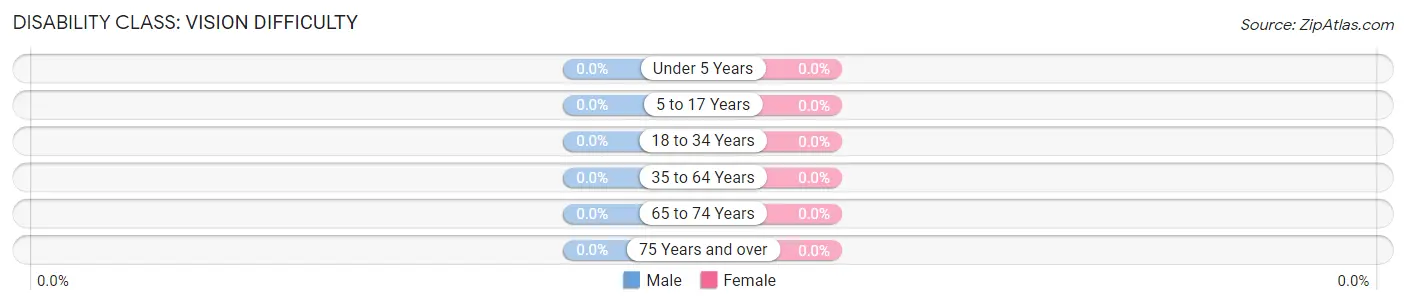
| Age Bracket | Male | Female |
| Under 5 Years | 0 (0.0%) | 0 (0.0%) |
| 5 to 17 Years | 0 (0.0%) | 0 (0.0%) |
| 18 to 34 Years | 0 (0.0%) | 0 (0.0%) |
| 35 to 64 Years | 0 (0.0%) | 0 (0.0%) |
| 65 to 74 Years | 0 (0.0%) | 0 (0.0%) |
| 75 Years and over | 0 (0.0%) | 0 (0.0%) |
Disability Class: Cognitive Difficulty
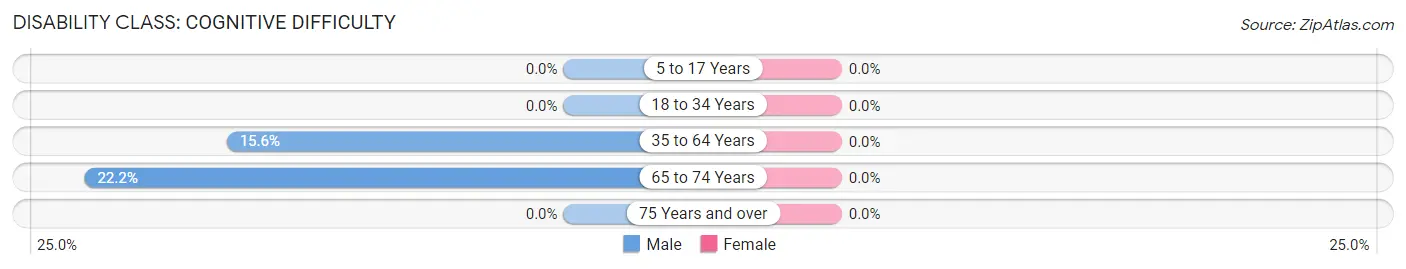
| Age Bracket | Male | Female |
| 5 to 17 Years | 0 (0.0%) | 0 (0.0%) |
| 18 to 34 Years | 0 (0.0%) | 0 (0.0%) |
| 35 to 64 Years | 20 (15.6%) | 0 (0.0%) |
| 65 to 74 Years | 6 (22.2%) | 0 (0.0%) |
| 75 Years and over | 0 (0.0%) | 0 (0.0%) |
Disability Class: Ambulatory Difficulty
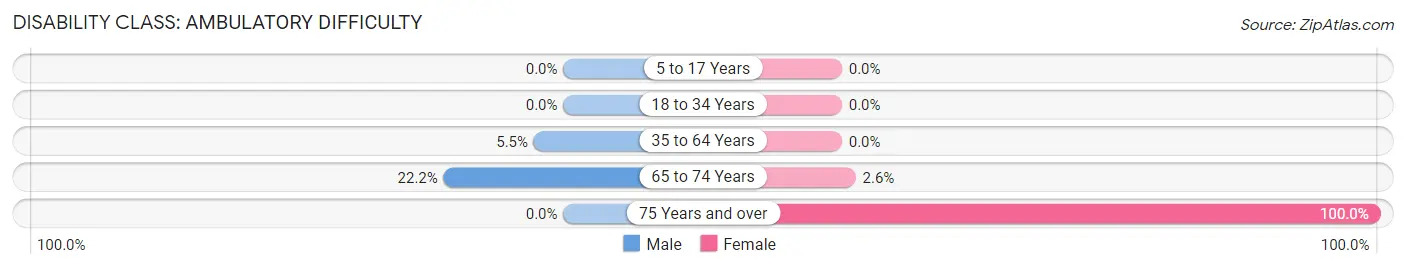
| Age Bracket | Male | Female |
| 5 to 17 Years | 0 (0.0%) | 0 (0.0%) |
| 18 to 34 Years | 0 (0.0%) | 0 (0.0%) |
| 35 to 64 Years | 7 (5.5%) | 0 (0.0%) |
| 65 to 74 Years | 6 (22.2%) | 2 (2.6%) |
| 75 Years and over | 0 (0.0%) | 7 (100.0%) |
Disability Class: Self-Care Difficulty
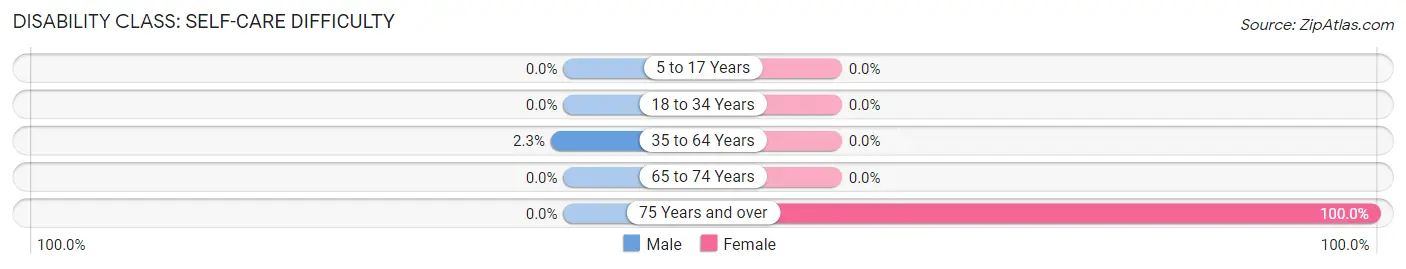
| Age Bracket | Male | Female |
| 5 to 17 Years | 0 (0.0%) | 0 (0.0%) |
| 18 to 34 Years | 0 (0.0%) | 0 (0.0%) |
| 35 to 64 Years | 3 (2.3%) | 0 (0.0%) |
| 65 to 74 Years | 0 (0.0%) | 0 (0.0%) |
| 75 Years and over | 0 (0.0%) | 7 (100.0%) |
Technology Access in High Falls
Computing Device Access in High Falls
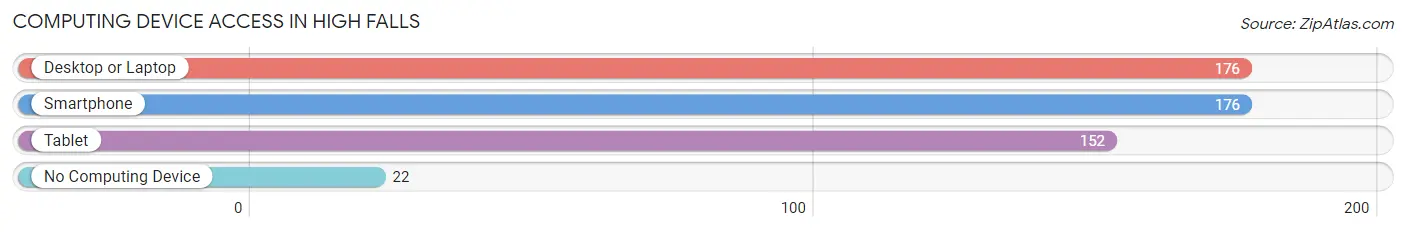
| Device Type | # Households | % Households |
| Desktop or Laptop | 176 | 88.9% |
| Smartphone | 176 | 88.9% |
| Tablet | 152 | 76.8% |
| No Computing Device | 22 | 11.1% |
| Total | 198 | 100.0% |
Internet Access in High Falls
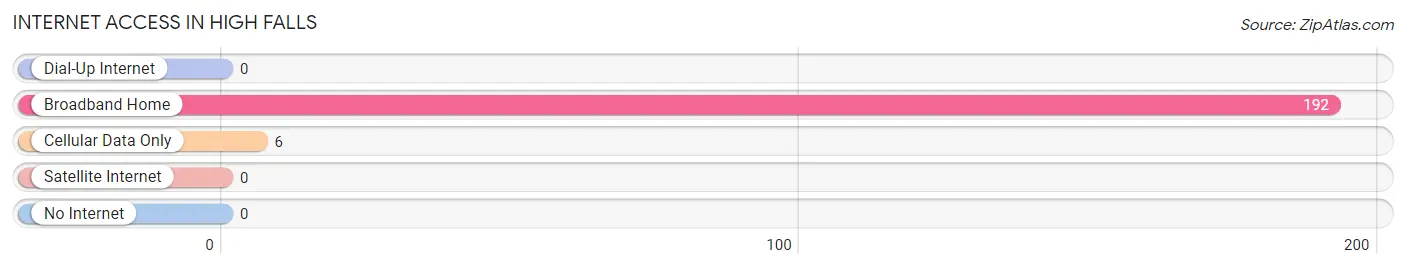
| Internet Type | # Households | % Households |
| Dial-Up Internet | 0 | 0.0% |
| Broadband Home | 192 | 97.0% |
| Cellular Data Only | 6 | 3.0% |
| Satellite Internet | 0 | 0.0% |
| No Internet | 0 | 0.0% |
| Total | 198 | 100.0% |
High Falls Summary
History
High Falls, New York is a small hamlet located in the town of Marbletown in Ulster County. It is situated on the banks of the Rondout Creek, which is a tributary of the Hudson River. The hamlet was first settled in the late 17th century by Dutch and English settlers. The area was originally known as “Rondout”, which is derived from the Dutch word “Rondout” meaning “round out”. The name was changed to High Falls in the early 19th century when a grist mill was built on the banks of the creek.
The hamlet was an important stop on the Delaware and Hudson Canal, which was built in the early 19th century to transport coal from Pennsylvania to New York City. The canal was a major source of economic activity in the area and helped to spur the growth of the hamlet. The canal was eventually replaced by the Ulster and Delaware Railroad in the late 19th century.
High Falls was also home to a number of industries, including a paper mill, a tannery, a brickyard, and a sawmill. The paper mill was the largest employer in the area and was in operation until the early 20th century. The tannery was also an important employer in the area and was in operation until the mid-20th century.
The hamlet was also home to a number of churches, including the Dutch Reformed Church, the Methodist Episcopal Church, and the Episcopal Church. The Dutch Reformed Church was the first church in the area and was established in 1790. The Methodist Episcopal Church was established in 1820 and the Episcopal Church was established in 1845.
Geography
High Falls is located in the town of Marbletown in Ulster County, New York. It is situated on the banks of the Rondout Creek, which is a tributary of the Hudson River. The hamlet is located approximately 70 miles north of New York City and is bordered by the towns of Rosendale, Hurley, and Marbletown.
The hamlet is located in the Catskill Mountains and is surrounded by rolling hills and forests. The area is known for its scenic beauty and is a popular destination for outdoor activities such as hiking, camping, fishing, and hunting.
Economy
High Falls is a small hamlet with a population of approximately 1,000 people. The hamlet is primarily a residential community and does not have a large commercial or industrial base. The primary sources of employment in the area are in the service sector, with many residents working in retail, hospitality, and healthcare.
The hamlet is also home to a number of small businesses, including restaurants, cafes, and shops. The hamlet is also home to a number of art galleries and studios, as well as a number of antique stores.
Demographics
As of the 2010 census, the population of High Falls was 1,039. The racial makeup of the hamlet was 94.3% White, 2.2% African American, 0.3% Native American, 0.7% Asian, 0.1% Pacific Islander, 0.7% from other races, and 1.7% from two or more races. Hispanic or Latino of any race were 3.2% of the population.
The median household income in High Falls was $50,972, and the median family income was $60,000. The per capita income in the hamlet was $25,972. About 8.3% of families and 10.2% of the population were below the poverty line, including 14.3% of those under age 18 and 5.2% of those age 65 or over.
Common Questions
What is Per Capita Income in High Falls?
Per Capita income in High Falls is $29,771.
What is the Median Family Income in High Falls?
Median Family Income in High Falls is $69,500.
What is the Median Household income in High Falls?
Median Household Income in High Falls is $57,105.
What is Inequality or Gini Index in High Falls?
Inequality or Gini Index in High Falls is 0.36.
What is the Total Population of High Falls?
Total Population of High Falls is 482.
What is the Total Male Population of High Falls?
Total Male Population of High Falls is 202.
What is the Total Female Population of High Falls?
Total Female Population of High Falls is 280.
What is the Ratio of Males per 100 Females in High Falls?
There are 72.14 Males per 100 Females in High Falls.
What is the Ratio of Females per 100 Males in High Falls?
There are 138.61 Females per 100 Males in High Falls.
What is the Median Population Age in High Falls?
Median Population Age in High Falls is 52.3 Years.
What is the Average Family Size in High Falls
Average Family Size in High Falls is 3.2 People.
What is the Average Household Size in High Falls
Average Household Size in High Falls is 2.4 People.
How Large is the Labor Force in High Falls?
There are 240 People in the Labor Forcein in High Falls.
What is the Percentage of People in the Labor Force in High Falls?
59.7% of People are in the Labor Force in High Falls.
What is the Unemployment Rate in High Falls?
Unemployment Rate in High Falls is 8.3%.