Ellenville, NY Map & Demographics
Ellenville Map
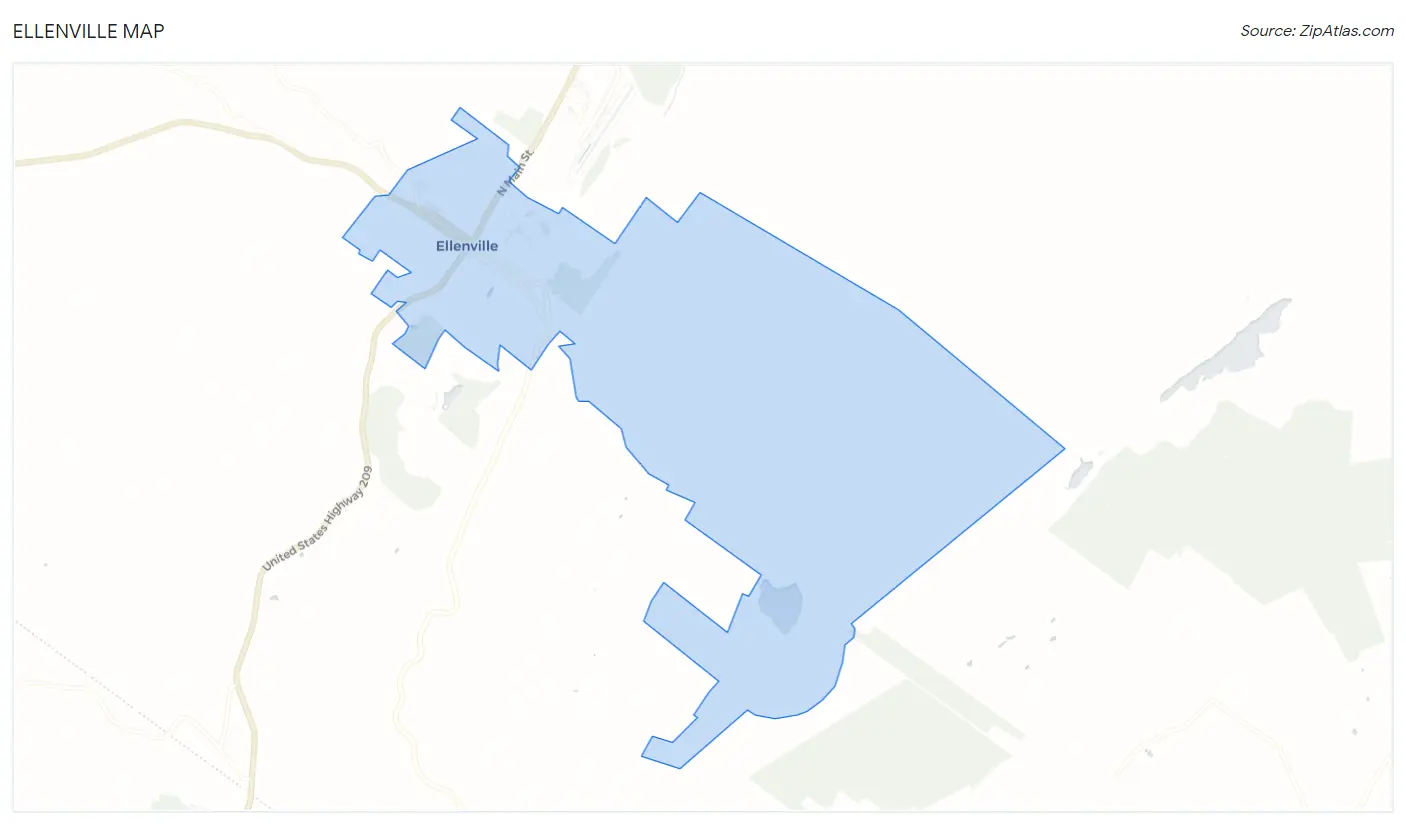
Ellenville Overview
$33,275
PER CAPITA INCOME
$105,065
AVG FAMILY INCOME
$77,125
AVG HOUSEHOLD INCOME
49.7%
WAGE / INCOME GAP [ % ]
50.3¢/ $1
WAGE / INCOME GAP [ $ ]
0.42
INEQUALITY / GINI INDEX
4,213
TOTAL POPULATION
2,332
MALE POPULATION
1,881
FEMALE POPULATION
123.98
MALES / 100 FEMALES
80.66
FEMALES / 100 MALES
38.9
MEDIAN AGE
3.5
AVG FAMILY SIZE
2.5
AVG HOUSEHOLD SIZE
1,697
LABOR FORCE [ PEOPLE ]
50.7%
PERCENT IN LABOR FORCE
0.6%
UNEMPLOYMENT RATE
Ellenville Zip Codes
Ellenville Area Codes
Income in Ellenville
Income Overview in Ellenville
Per Capita Income in Ellenville is $33,275, while median incomes of families and households are $105,065 and $77,125 respectively.
| Characteristic | Number | Measure |
| Per Capita Income | 4,213 | $33,275 |
| Median Family Income | 931 | $105,065 |
| Mean Family Income | 931 | $93,944 |
| Median Household Income | 1,671 | $77,125 |
| Mean Household Income | 1,671 | $78,308 |
| Income Deficit | 931 | $0 |
| Wage / Income Gap (%) | 4,213 | 49.72% |
| Wage / Income Gap ($) | 4,213 | 50.28¢ per $1 |
| Gini / Inequality Index | 4,213 | 0.42 |
Earnings by Sex in Ellenville
Average Earnings in Ellenville are $48,409, $75,893 for men and $38,160 for women, a difference of 49.7%.
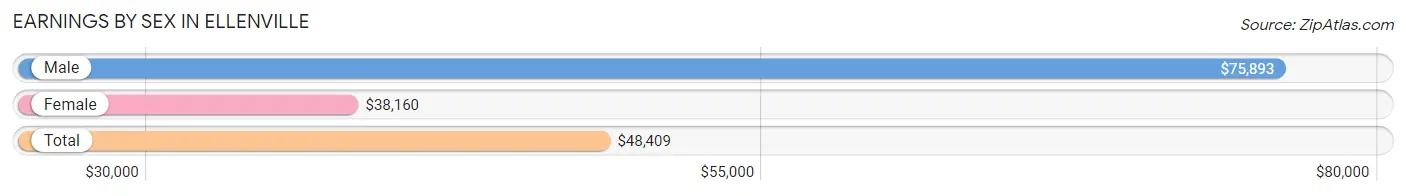
| Sex | Number | Average Earnings |
| Male | 1,000 (52.2%) | $75,893 |
| Female | 916 (47.8%) | $38,160 |
| Total | 1,916 (100.0%) | $48,409 |
Earnings by Sex by Income Bracket in Ellenville
The most common earnings brackets in Ellenville are $75,000 to $99,999 for men (328 | 32.8%) and $40,000 to $44,999 for women (114 | 12.4%).
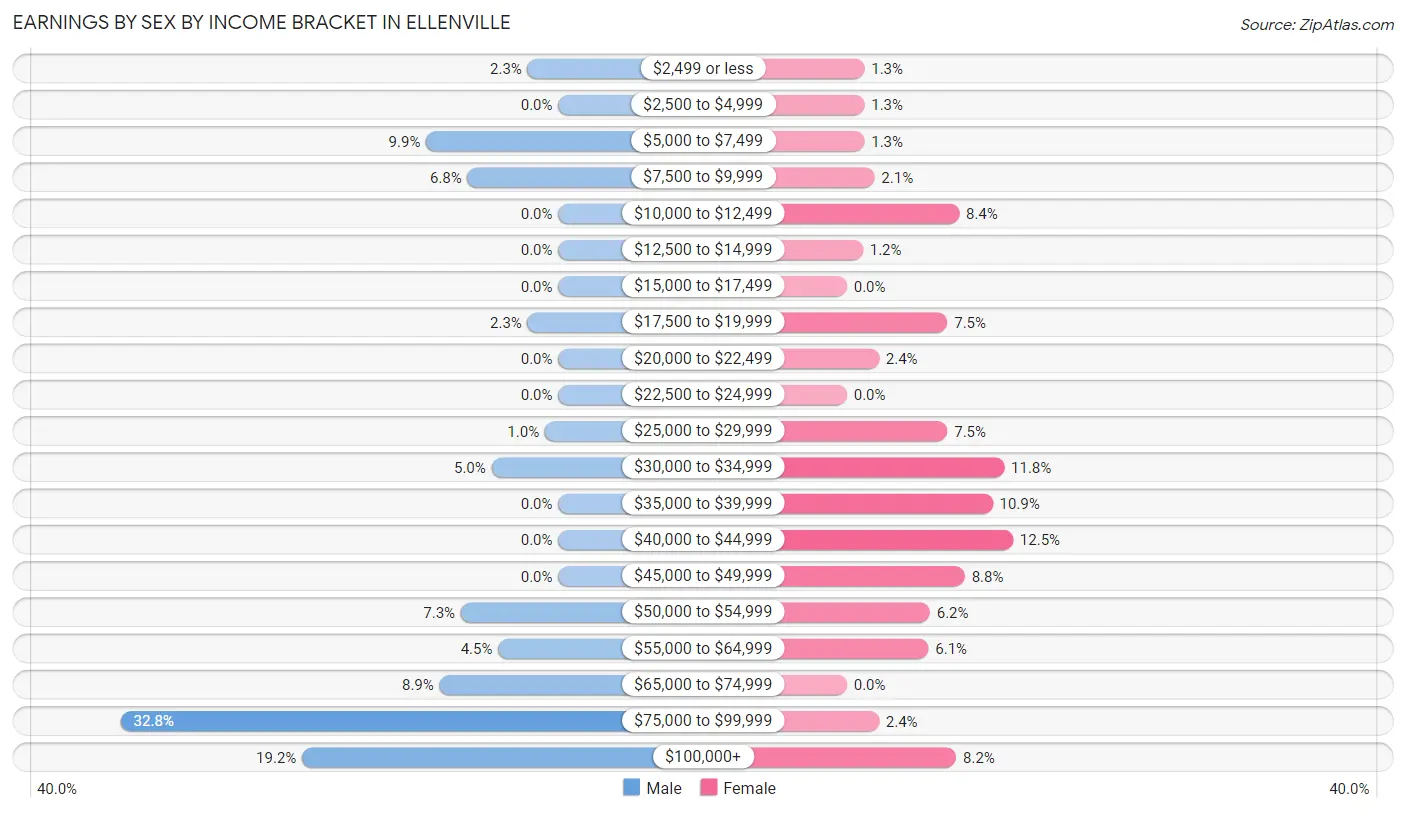
| Income | Male | Female |
| $2,499 or less | 23 (2.3%) | 12 (1.3%) |
| $2,500 to $4,999 | 0 (0.0%) | 12 (1.3%) |
| $5,000 to $7,499 | 99 (9.9%) | 12 (1.3%) |
| $7,500 to $9,999 | 68 (6.8%) | 19 (2.1%) |
| $10,000 to $12,499 | 0 (0.0%) | 77 (8.4%) |
| $12,500 to $14,999 | 0 (0.0%) | 11 (1.2%) |
| $15,000 to $17,499 | 0 (0.0%) | 0 (0.0%) |
| $17,500 to $19,999 | 23 (2.3%) | 69 (7.5%) |
| $20,000 to $22,499 | 0 (0.0%) | 22 (2.4%) |
| $22,500 to $24,999 | 0 (0.0%) | 0 (0.0%) |
| $25,000 to $29,999 | 10 (1.0%) | 69 (7.5%) |
| $30,000 to $34,999 | 50 (5.0%) | 108 (11.8%) |
| $35,000 to $39,999 | 0 (0.0%) | 100 (10.9%) |
| $40,000 to $44,999 | 0 (0.0%) | 114 (12.4%) |
| $45,000 to $49,999 | 0 (0.0%) | 81 (8.8%) |
| $50,000 to $54,999 | 73 (7.3%) | 57 (6.2%) |
| $55,000 to $64,999 | 45 (4.5%) | 56 (6.1%) |
| $65,000 to $74,999 | 89 (8.9%) | 0 (0.0%) |
| $75,000 to $99,999 | 328 (32.8%) | 22 (2.4%) |
| $100,000+ | 192 (19.2%) | 75 (8.2%) |
| Total | 1,000 (100.0%) | 916 (100.0%) |
Earnings by Sex by Educational Attainment in Ellenville
Average earnings in Ellenville are $77,500 for men and $39,583 for women, a difference of 48.9%. Men with an educational attainment of college or associate's degree enjoy the highest average annual earnings of $97,907, while those with graduate degree education earn the least with $76,603. Women with an educational attainment of bachelor's degree earn the most with the average annual earnings of $45,257, while those with high school diploma education have the smallest earnings of $40,104.
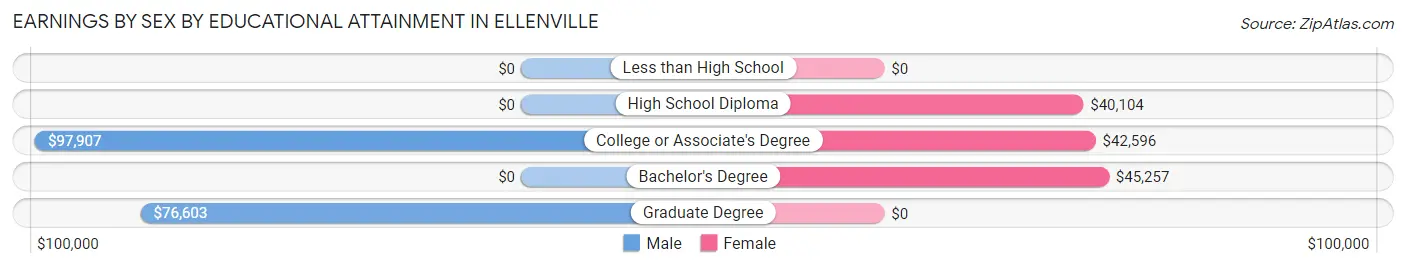
| Educational Attainment | Male Income | Female Income |
| Less than High School | - | - |
| High School Diploma | - | - |
| College or Associate's Degree | $97,907 | $42,596 |
| Bachelor's Degree | - | - |
| Graduate Degree | $76,603 | $0 |
| Total | $77,500 | $39,583 |
Family Income in Ellenville
Family Income Brackets in Ellenville
According to the Ellenville family income data, there are 397 families falling into the $100,000 to $149,999 income range, which is the most common income bracket and makes up 42.6% of all families. Conversely, the $25,000 to $34,999 income bracket is the least frequent group with only 11 families (1.2%) belonging to this category.
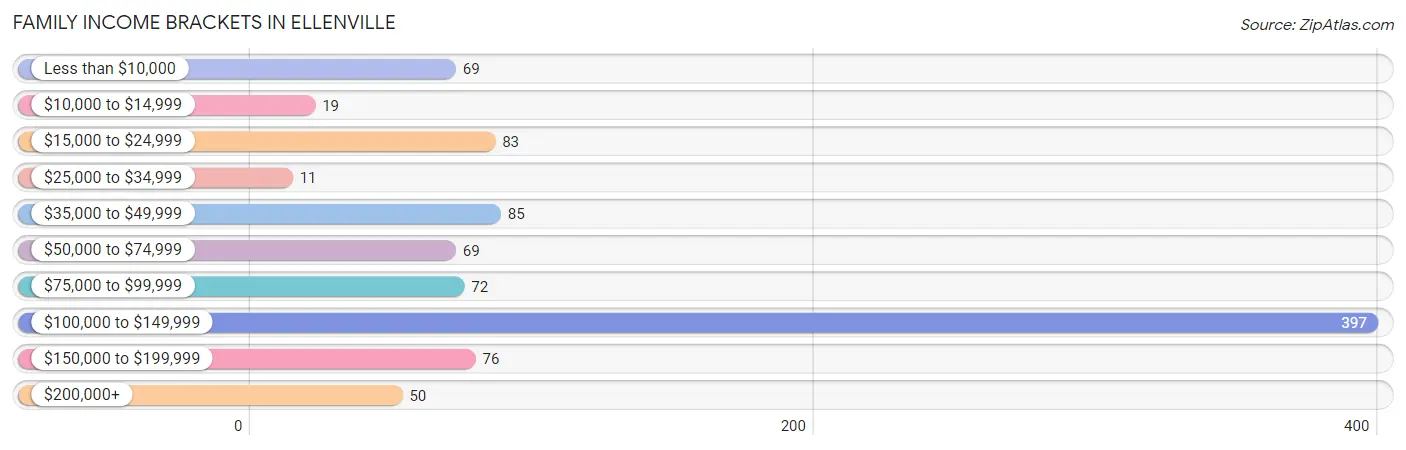
| Income Bracket | # Families | % Families |
| Less than $10,000 | 69 | 7.4% |
| $10,000 to $14,999 | 19 | 2.0% |
| $15,000 to $24,999 | 83 | 8.9% |
| $25,000 to $34,999 | 11 | 1.2% |
| $35,000 to $49,999 | 85 | 9.1% |
| $50,000 to $74,999 | 69 | 7.4% |
| $75,000 to $99,999 | 72 | 7.7% |
| $100,000 to $149,999 | 397 | 42.6% |
| $150,000 to $199,999 | 76 | 8.2% |
| $200,000+ | 50 | 5.4% |
Family Income by Famaliy Size in Ellenville
3-person families (280 | 30.1%) account for the highest median family income in Ellenville with $115,714 per family, while 2-person families (457 | 49.1%) have the highest median income of $50,054 per family member.
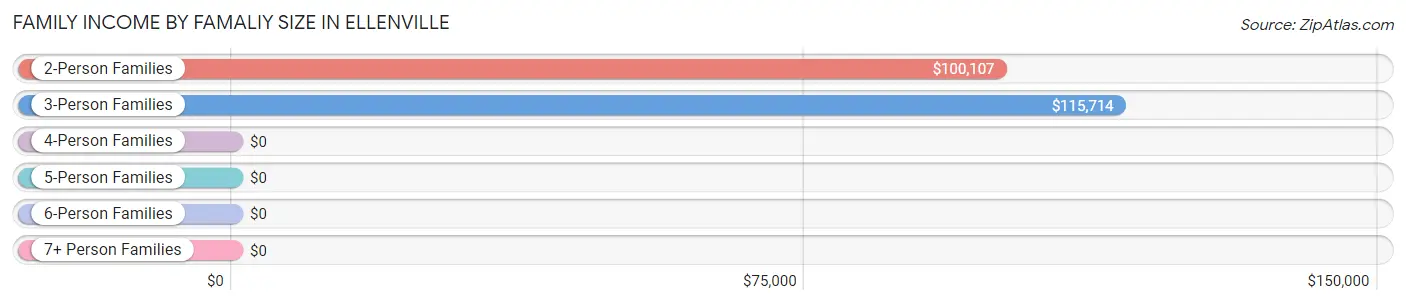
| Income Bracket | # Families | Median Income |
| 2-Person Families | 457 (49.1%) | $100,107 |
| 3-Person Families | 280 (30.1%) | $115,714 |
| 4-Person Families | 75 (8.1%) | $0 |
| 5-Person Families | 61 (6.6%) | $0 |
| 6-Person Families | 0 (0.0%) | $0 |
| 7+ Person Families | 58 (6.2%) | $0 |
| Total | 931 (100.0%) | $105,065 |
Family Income by Number of Earners in Ellenville
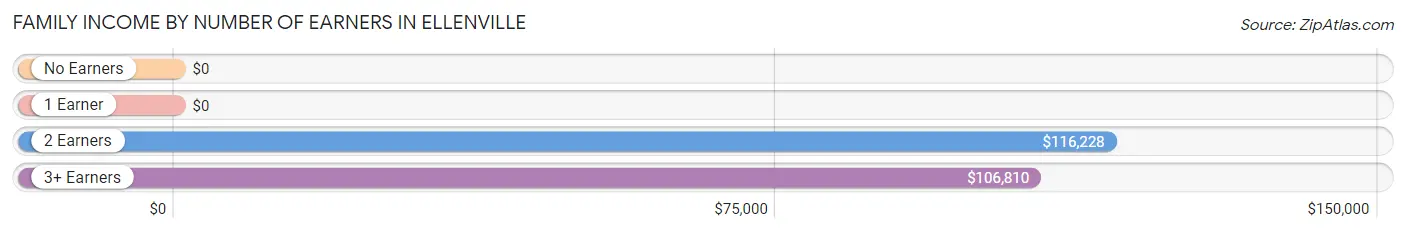
| Number of Earners | # Families | Median Income |
| No Earners | 237 (25.5%) | $0 |
| 1 Earner | 153 (16.4%) | $0 |
| 2 Earners | 457 (49.1%) | $116,228 |
| 3+ Earners | 84 (9.0%) | $106,810 |
| Total | 931 (100.0%) | $105,065 |
Household Income in Ellenville
Household Income Brackets in Ellenville
With 545 households falling in the category, the $100,000 to $149,999 income range is the most frequent in Ellenville, accounting for 32.6% of all households. In contrast, only 12 households (0.7%) fall into the $25,000 to $34,999 income bracket, making it the least populous group.
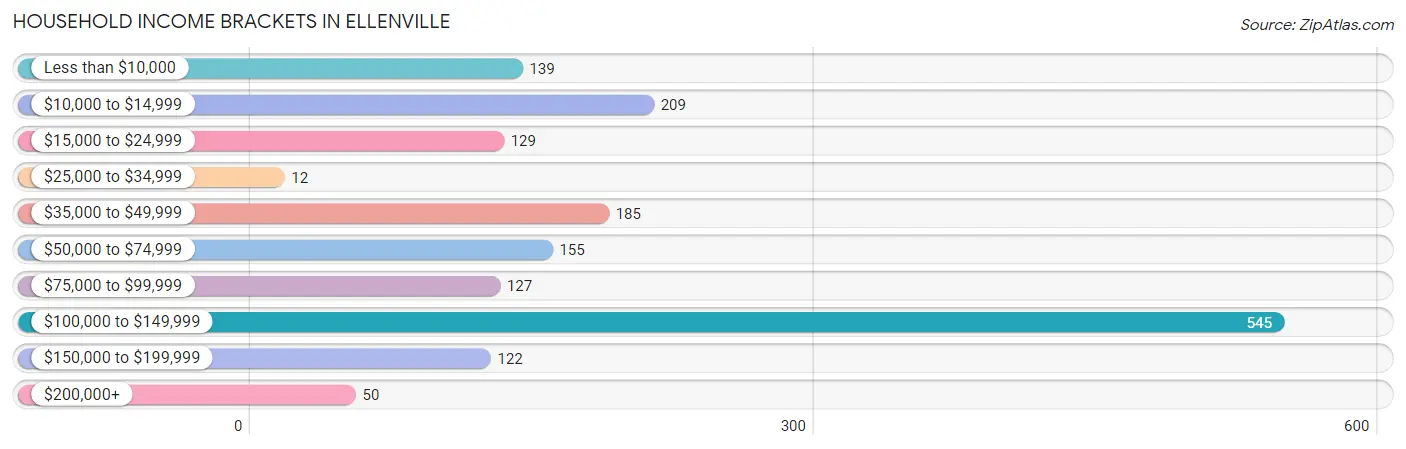
| Income Bracket | # Households | % Households |
| Less than $10,000 | 139 | 8.3% |
| $10,000 to $14,999 | 209 | 12.5% |
| $15,000 to $24,999 | 129 | 7.7% |
| $25,000 to $34,999 | 12 | 0.7% |
| $35,000 to $49,999 | 185 | 11.1% |
| $50,000 to $74,999 | 155 | 9.3% |
| $75,000 to $99,999 | 127 | 7.6% |
| $100,000 to $149,999 | 545 | 32.6% |
| $150,000 to $199,999 | 122 | 7.3% |
| $200,000+ | 50 | 3.0% |
Household Income by Householder Age in Ellenville
The median household income in Ellenville is $77,125, with the highest median household income of $87,444 found in the 65+ years age bracket for the primary householder. A total of 468 households (28.0%) fall into this category.
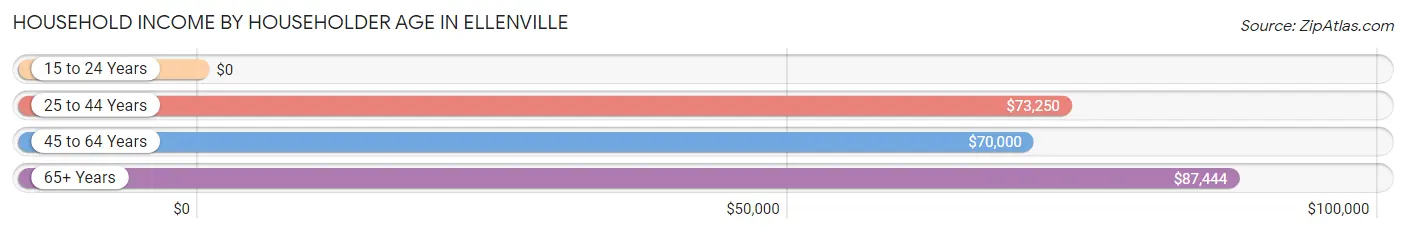
| Income Bracket | # Households | Median Income |
| 15 to 24 Years | 0 (0.0%) | $0 |
| 25 to 44 Years | 535 (32.0%) | $73,250 |
| 45 to 64 Years | 668 (40.0%) | $70,000 |
| 65+ Years | 468 (28.0%) | $87,444 |
| Total | 1,671 (100.0%) | $77,125 |
Poverty in Ellenville
Income Below Poverty by Sex and Age in Ellenville
With 29.1% poverty level for males and 19.1% for females among the residents of Ellenville, 18 to 24 year old males and 12 to 14 year old females are the most vulnerable to poverty, with 302 males (66.5%) and 71 females (76.3%) in their respective age groups living below the poverty level.
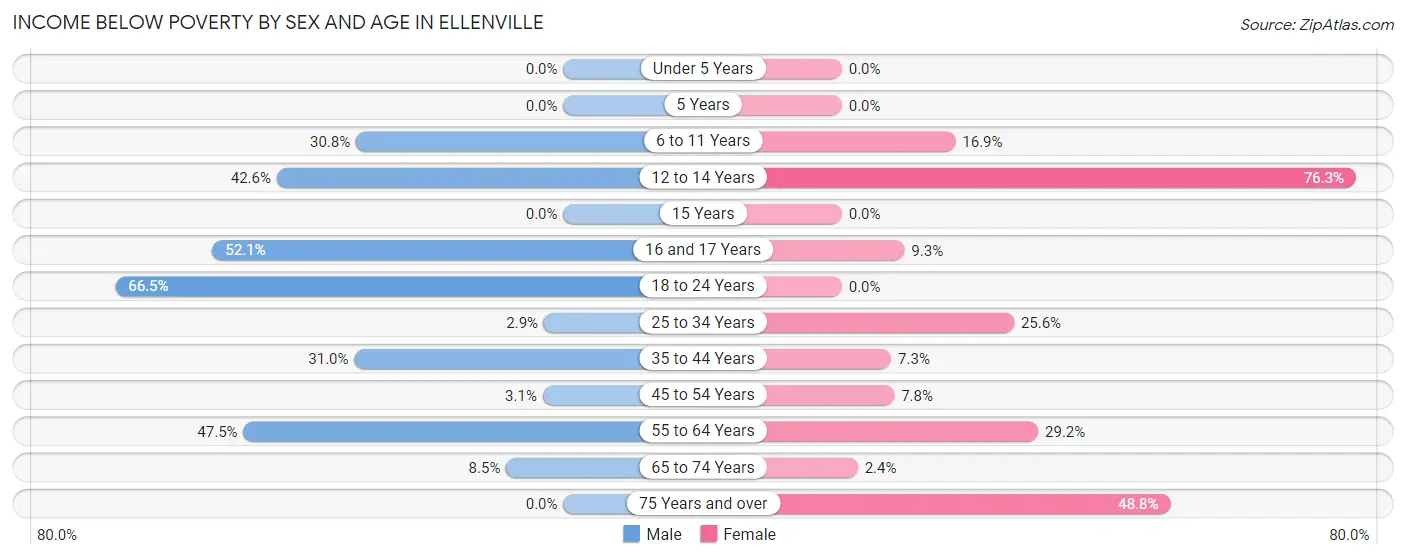
| Age Bracket | Male | Female |
| Under 5 Years | 0 (0.0%) | 0 (0.0%) |
| 5 Years | 0 (0.0%) | 0 (0.0%) |
| 6 to 11 Years | 100 (30.8%) | 29 (16.9%) |
| 12 to 14 Years | 40 (42.5%) | 71 (76.3%) |
| 15 Years | 0 (0.0%) | 0 (0.0%) |
| 16 and 17 Years | 37 (52.1%) | 8 (9.3%) |
| 18 to 24 Years | 302 (66.5%) | 0 (0.0%) |
| 25 to 34 Years | 4 (2.9%) | 57 (25.6%) |
| 35 to 44 Years | 81 (31.0%) | 11 (7.3%) |
| 45 to 54 Years | 10 (3.1%) | 20 (7.8%) |
| 55 to 64 Years | 86 (47.5%) | 116 (29.1%) |
| 65 to 74 Years | 19 (8.5%) | 7 (2.4%) |
| 75 Years and over | 0 (0.0%) | 40 (48.8%) |
| Total | 679 (29.1%) | 359 (19.1%) |
Income Above Poverty by Sex and Age in Ellenville
According to the poverty statistics in Ellenville, males aged under 5 years and females aged under 5 years are the age groups that are most secure financially, with 100.0% of males and 100.0% of females in these age groups living above the poverty line.
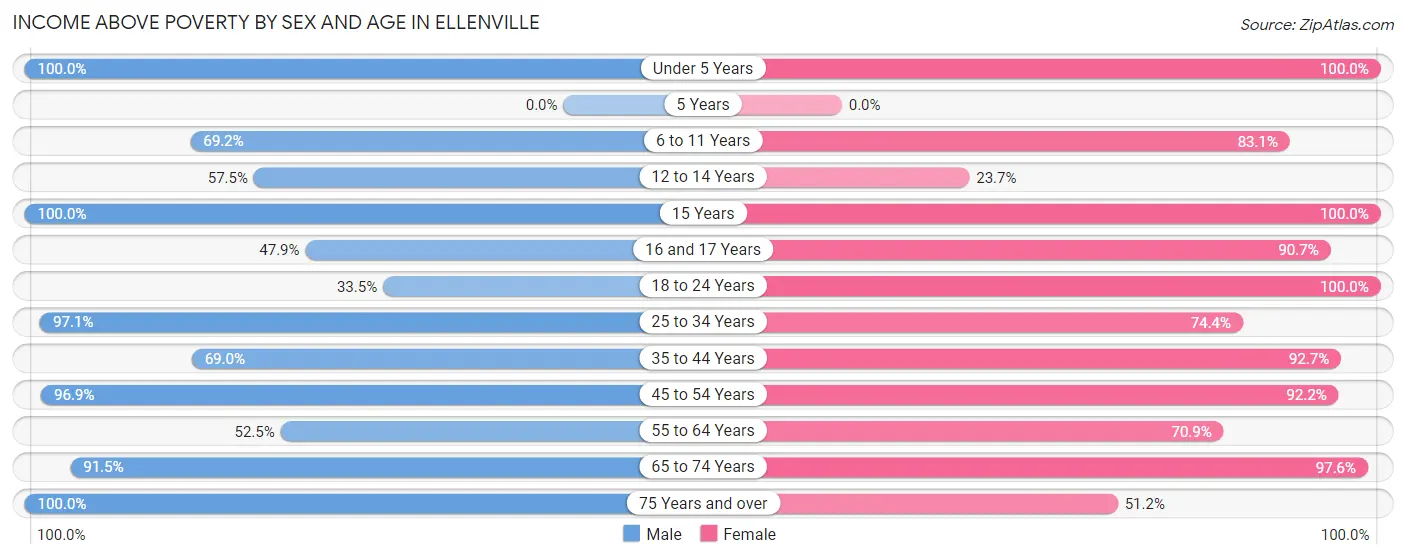
| Age Bracket | Male | Female |
| Under 5 Years | 83 (100.0%) | 23 (100.0%) |
| 5 Years | 0 (0.0%) | 0 (0.0%) |
| 6 to 11 Years | 225 (69.2%) | 143 (83.1%) |
| 12 to 14 Years | 54 (57.5%) | 22 (23.7%) |
| 15 Years | 44 (100.0%) | 32 (100.0%) |
| 16 and 17 Years | 34 (47.9%) | 78 (90.7%) |
| 18 to 24 Years | 152 (33.5%) | 65 (100.0%) |
| 25 to 34 Years | 135 (97.1%) | 166 (74.4%) |
| 35 to 44 Years | 180 (69.0%) | 139 (92.7%) |
| 45 to 54 Years | 317 (96.9%) | 237 (92.2%) |
| 55 to 64 Years | 95 (52.5%) | 282 (70.9%) |
| 65 to 74 Years | 205 (91.5%) | 289 (97.6%) |
| 75 Years and over | 126 (100.0%) | 42 (51.2%) |
| Total | 1,650 (70.9%) | 1,518 (80.9%) |
Income Below Poverty Among Married-Couple Families in Ellenville
The poverty statistics for married-couple families in Ellenville show that 1.6% or 11 of the total 675 families live below the poverty line. Families with 1 or 2 children have the highest poverty rate of 4.2%, comprising of 11 families. On the other hand, families with no children have the lowest poverty rate of 0.0%, which includes 0 families.
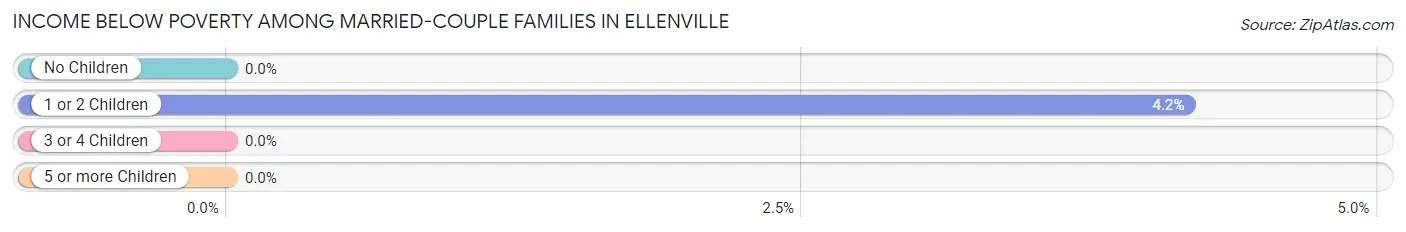
| Children | Above Poverty | Below Poverty |
| No Children | 353 (100.0%) | 0 (0.0%) |
| 1 or 2 Children | 253 (95.8%) | 11 (4.2%) |
| 3 or 4 Children | 0 (0.0%) | 0 (0.0%) |
| 5 or more Children | 58 (100.0%) | 0 (0.0%) |
| Total | 664 (98.4%) | 11 (1.6%) |
Income Below Poverty Among Single-Parent Households in Ellenville
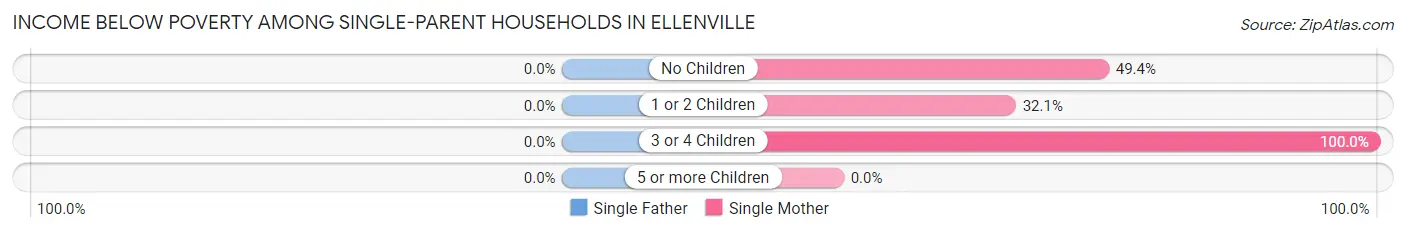
| Children | Single Father | Single Mother |
| No Children | 0 (0.0%) | 40 (49.4%) |
| 1 or 2 Children | 0 (0.0%) | 50 (32.1%) |
| 3 or 4 Children | 0 (0.0%) | 19 (100.0%) |
| 5 or more Children | 0 (0.0%) | 0 (0.0%) |
| Total | 0 (0.0%) | 109 (42.6%) |
Income Below Poverty Among Married-Couple vs Single-Parent Households in Ellenville
The poverty data for Ellenville shows that 11 of the married-couple family households (1.6%) and 109 of the single-parent households (42.6%) are living below the poverty level. Within the married-couple family households, those with 1 or 2 children have the highest poverty rate, with 11 households (4.2%) falling below the poverty line. Among the single-parent households, those with 3 or 4 children have the highest poverty rate, with 19 household (100.0%) living below poverty.
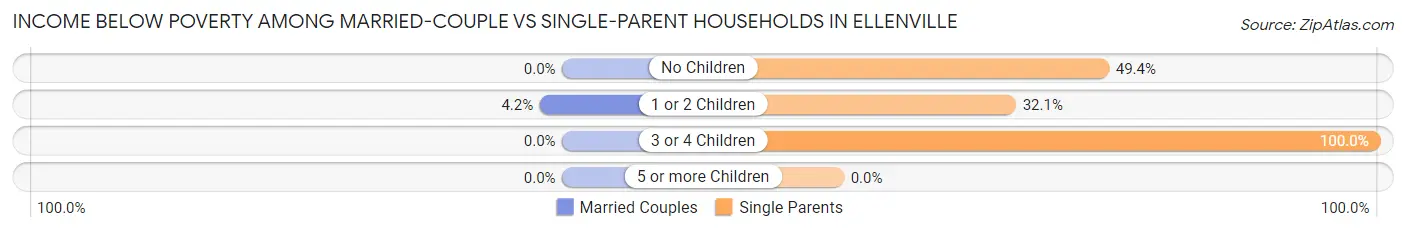
| Children | Married-Couple Families | Single-Parent Households |
| No Children | 0 (0.0%) | 40 (49.4%) |
| 1 or 2 Children | 11 (4.2%) | 50 (32.1%) |
| 3 or 4 Children | 0 (0.0%) | 19 (100.0%) |
| 5 or more Children | 0 (0.0%) | 0 (0.0%) |
| Total | 11 (1.6%) | 109 (42.6%) |
Race in Ellenville
The most populous races in Ellenville are White / Caucasian (2,687 | 63.8%), Hispanic or Latino (1,637 | 38.9%), and Two or more Races (723 | 17.2%).
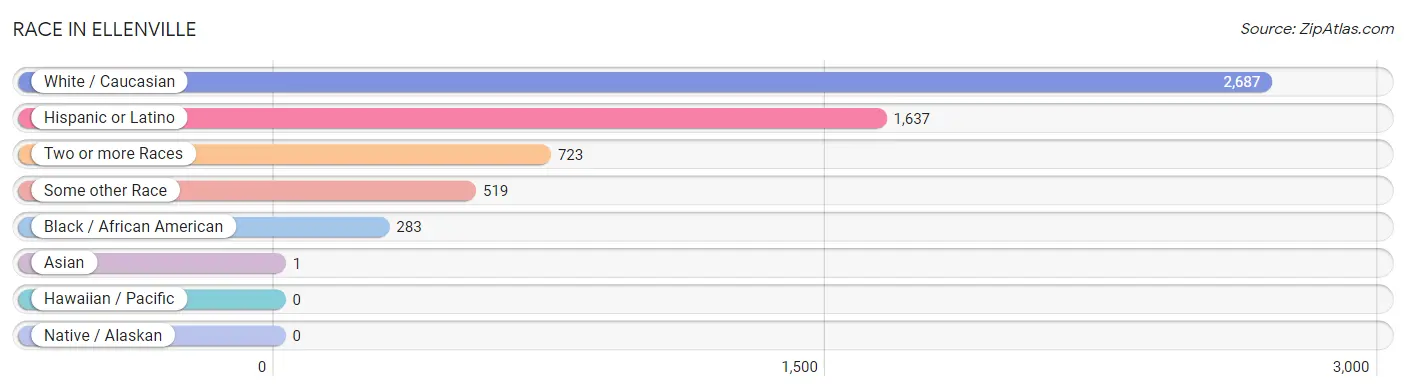
| Race | # Population | % Population |
| Asian | 1 | 0.0% |
| Black / African American | 283 | 6.7% |
| Hawaiian / Pacific | 0 | 0.0% |
| Hispanic or Latino | 1,637 | 38.9% |
| Native / Alaskan | 0 | 0.0% |
| White / Caucasian | 2,687 | 63.8% |
| Two or more Races | 723 | 17.2% |
| Some other Race | 519 | 12.3% |
| Total | 4,213 | 100.0% |
Ancestry in Ellenville
The most populous ancestries reported in Ellenville are Puerto Rican (980 | 23.3%), Irish (893 | 21.2%), Polish (633 | 15.0%), American (448 | 10.6%), and Italian (364 | 8.6%), together accounting for 78.8% of all Ellenville residents.
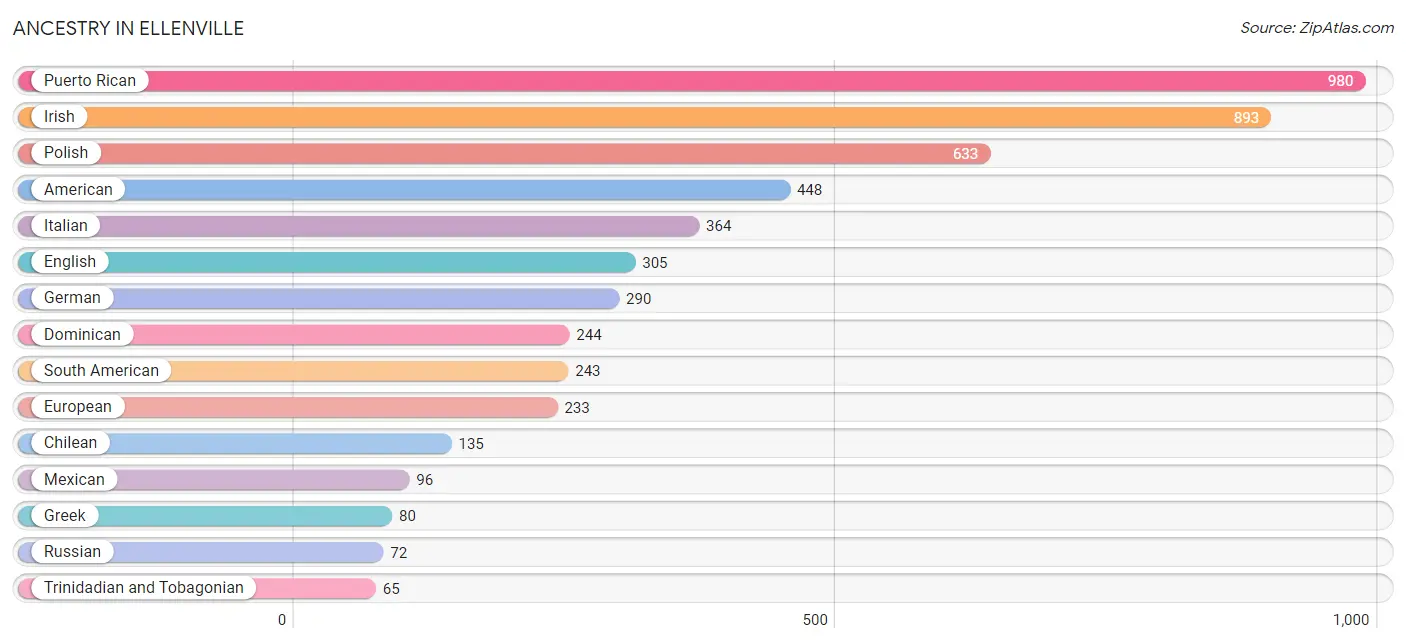
| Ancestry | # Population | % Population |
| American | 448 | 10.6% |
| Brazilian | 39 | 0.9% |
| Canadian | 19 | 0.4% |
| Chilean | 135 | 3.2% |
| Colombian | 54 | 1.3% |
| Cuban | 52 | 1.2% |
| Czech | 21 | 0.5% |
| Delaware | 52 | 1.2% |
| Dominican | 244 | 5.8% |
| Dutch | 63 | 1.5% |
| Eastern European | 6 | 0.1% |
| Ecuadorian | 5 | 0.1% |
| English | 305 | 7.2% |
| European | 233 | 5.5% |
| French Canadian | 17 | 0.4% |
| German | 290 | 6.9% |
| Greek | 80 | 1.9% |
| Hungarian | 49 | 1.2% |
| Indian (Asian) | 1 | 0.0% |
| Irish | 893 | 21.2% |
| Italian | 364 | 8.6% |
| Jamaican | 51 | 1.2% |
| Mexican | 96 | 2.3% |
| Peruvian | 17 | 0.4% |
| Polish | 633 | 15.0% |
| Puerto Rican | 980 | 23.3% |
| Russian | 72 | 1.7% |
| Scottish | 44 | 1.0% |
| Slovak | 19 | 0.4% |
| South American | 243 | 5.8% |
| Trinidadian and Tobagonian | 65 | 1.5% |
| Ukrainian | 63 | 1.5% |
| Venezuelan | 32 | 0.8% | View All 33 Rows |
Immigrants in Ellenville
The most numerous immigrant groups reported in Ellenville came from Latin America (344 | 8.2%), South America (201 | 4.8%), Chile (107 | 2.5%), Caribbean (91 | 2.2%), and Colombia (54 | 1.3%), together accounting for 18.9% of all Ellenville residents.
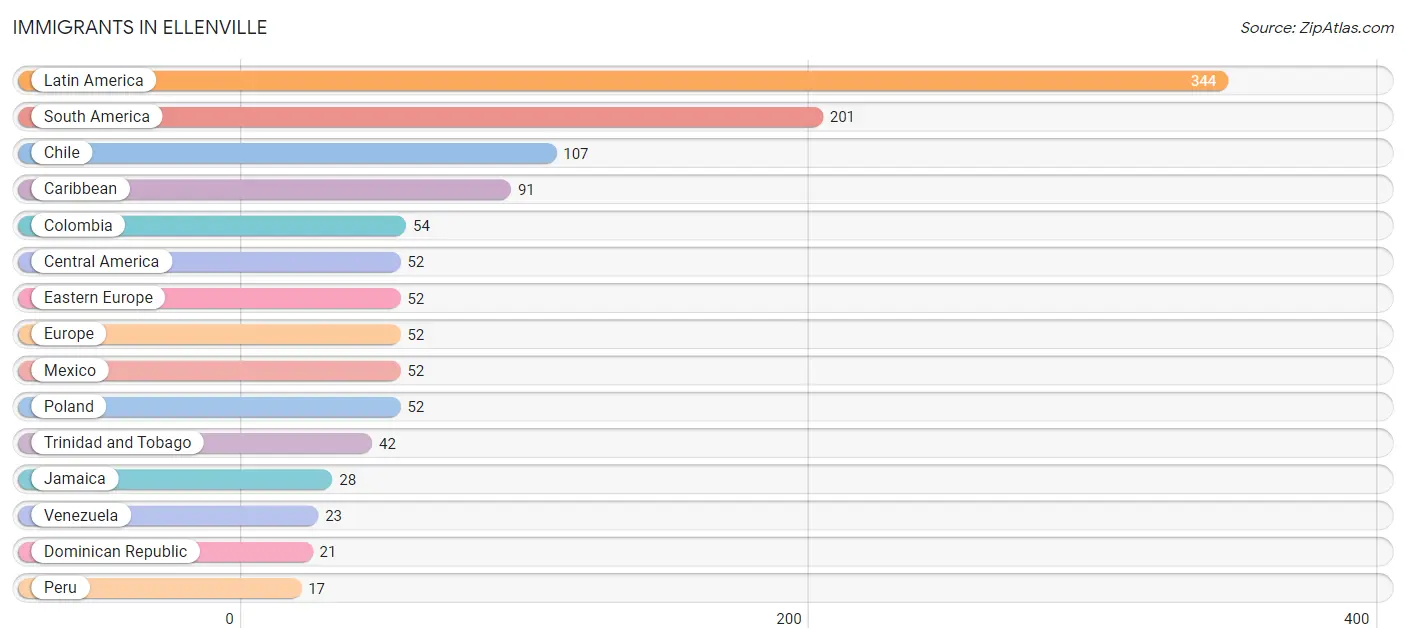
| Immigration Origin | # Population | % Population |
| Caribbean | 91 | 2.2% |
| Central America | 52 | 1.2% |
| Chile | 107 | 2.5% |
| Colombia | 54 | 1.3% |
| Dominican Republic | 21 | 0.5% |
| Eastern Europe | 52 | 1.2% |
| Europe | 52 | 1.2% |
| Jamaica | 28 | 0.7% |
| Latin America | 344 | 8.2% |
| Mexico | 52 | 1.2% |
| Peru | 17 | 0.4% |
| Poland | 52 | 1.2% |
| South America | 201 | 4.8% |
| Trinidad and Tobago | 42 | 1.0% |
| Venezuela | 23 | 0.5% | View All 15 Rows |
Sex and Age in Ellenville
Sex and Age in Ellenville
The most populous age groups in Ellenville are 20 to 24 Years (420 | 18.0%) for men and 60 to 64 Years (372 | 19.8%) for women.
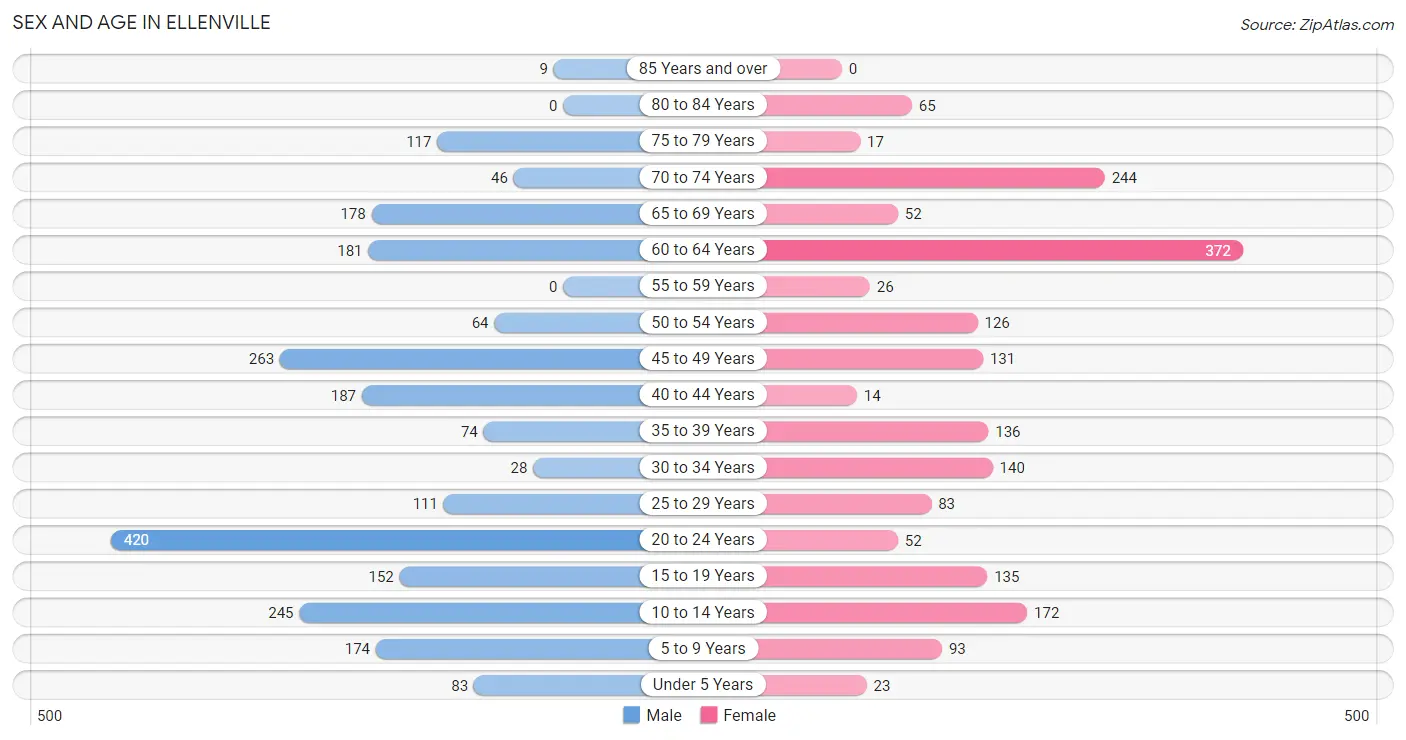
| Age Bracket | Male | Female |
| Under 5 Years | 83 (3.6%) | 23 (1.2%) |
| 5 to 9 Years | 174 (7.5%) | 93 (4.9%) |
| 10 to 14 Years | 245 (10.5%) | 172 (9.1%) |
| 15 to 19 Years | 152 (6.5%) | 135 (7.2%) |
| 20 to 24 Years | 420 (18.0%) | 52 (2.8%) |
| 25 to 29 Years | 111 (4.8%) | 83 (4.4%) |
| 30 to 34 Years | 28 (1.2%) | 140 (7.4%) |
| 35 to 39 Years | 74 (3.2%) | 136 (7.2%) |
| 40 to 44 Years | 187 (8.0%) | 14 (0.7%) |
| 45 to 49 Years | 263 (11.3%) | 131 (7.0%) |
| 50 to 54 Years | 64 (2.7%) | 126 (6.7%) |
| 55 to 59 Years | 0 (0.0%) | 26 (1.4%) |
| 60 to 64 Years | 181 (7.8%) | 372 (19.8%) |
| 65 to 69 Years | 178 (7.6%) | 52 (2.8%) |
| 70 to 74 Years | 46 (2.0%) | 244 (13.0%) |
| 75 to 79 Years | 117 (5.0%) | 17 (0.9%) |
| 80 to 84 Years | 0 (0.0%) | 65 (3.5%) |
| 85 Years and over | 9 (0.4%) | 0 (0.0%) |
| Total | 2,332 (100.0%) | 1,881 (100.0%) |
Families and Households in Ellenville
Median Family Size in Ellenville
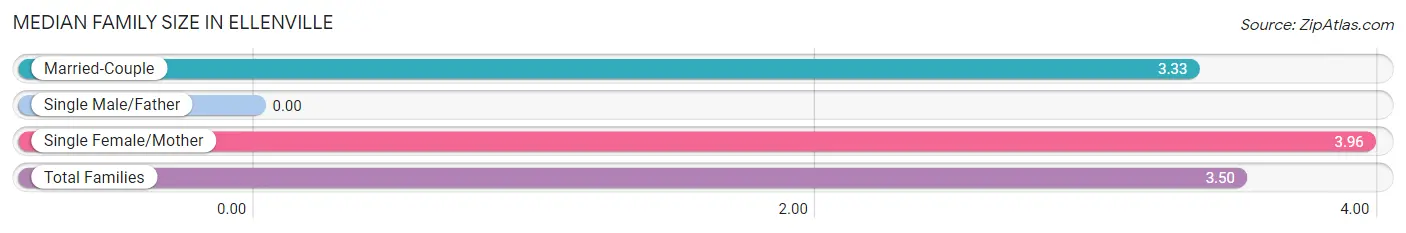
| Family Type | # Families | Family Size |
| Married-Couple | 675 (72.5%) | 3.33 |
| Single Male/Father | 0 (0.0%) | - |
| Single Female/Mother | 256 (27.5%) | 3.96 |
| Total Families | 931 (100.0%) | 3.50 |
Median Household Size in Ellenville
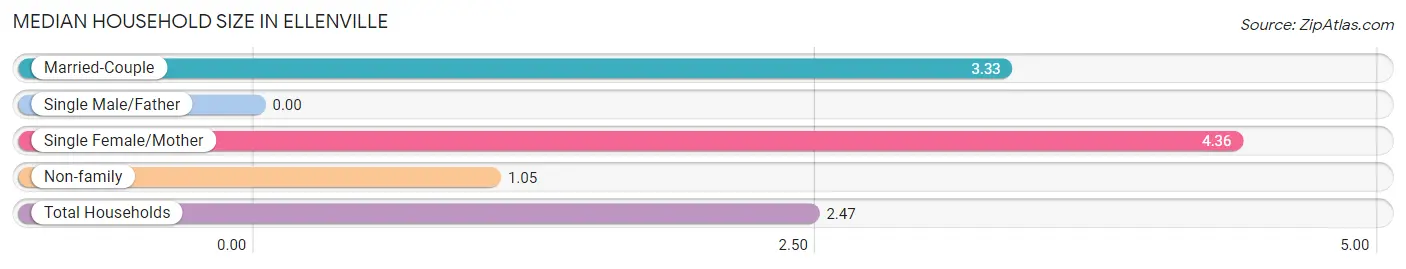
| Household Type | # Households | Household Size |
| Married-Couple | 675 (40.4%) | 3.33 |
| Single Male/Father | 0 (0.0%) | - |
| Single Female/Mother | 256 (15.3%) | 4.36 |
| Non-family | 740 (44.3%) | 1.05 |
| Total Households | 1,671 (100.0%) | 2.47 |
Household Size by Marriage Status in Ellenville
Out of a total of 1,671 households in Ellenville, 931 (55.7%) are family households, while 740 (44.3%) are nonfamily households. The most numerous type of family households are 2-person households, comprising 426, and the most common type of nonfamily households are 1-person households, comprising 712.
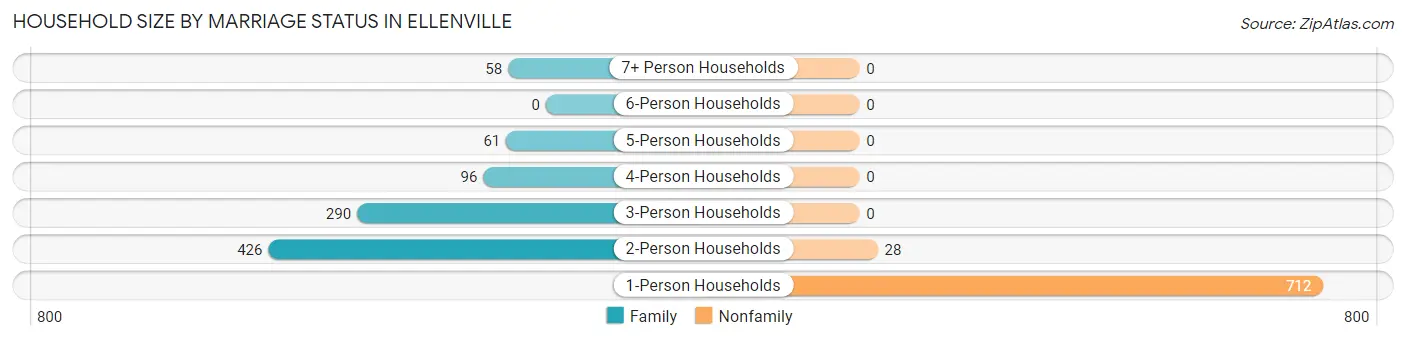
| Household Size | Family Households | Nonfamily Households |
| 1-Person Households | - | 712 (42.6%) |
| 2-Person Households | 426 (25.5%) | 28 (1.7%) |
| 3-Person Households | 290 (17.3%) | 0 (0.0%) |
| 4-Person Households | 96 (5.8%) | 0 (0.0%) |
| 5-Person Households | 61 (3.6%) | 0 (0.0%) |
| 6-Person Households | 0 (0.0%) | 0 (0.0%) |
| 7+ Person Households | 58 (3.5%) | 0 (0.0%) |
| Total | 931 (55.7%) | 740 (44.3%) |
Female Fertility in Ellenville
Fertility by Age in Ellenville
Average fertility rate in Ellenville is 148.0 births per 1,000 women. Women in the age bracket of 35 to 50 years have the highest fertility rate with 193.0 births per 1,000 women. Women in the age bracket of 35 to 50 years acount for 55.2% of all women with births.
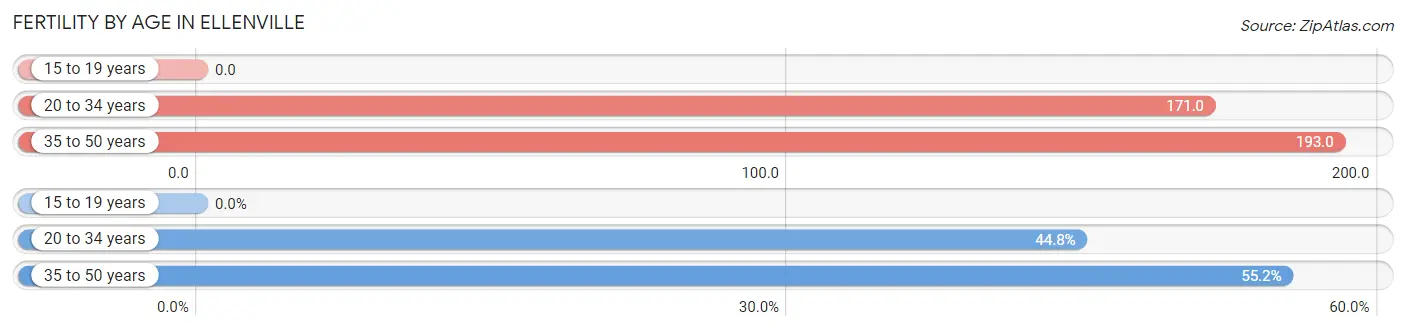
| Age Bracket | Women with Births | Births / 1,000 Women |
| 15 to 19 years | 0 (0.0%) | 0.0 |
| 20 to 34 years | 47 (44.8%) | 171.0 |
| 35 to 50 years | 58 (55.2%) | 193.0 |
| Total | 105 (100.0%) | 148.0 |
Fertility by Age by Marriage Status in Ellenville
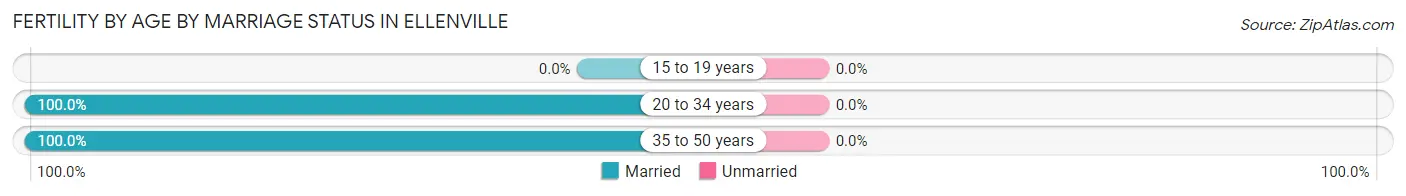
| Age Bracket | Married | Unmarried |
| 15 to 19 years | 0 (0.0%) | 0 (0.0%) |
| 20 to 34 years | 47 (100.0%) | 0 (0.0%) |
| 35 to 50 years | 58 (100.0%) | 0 (0.0%) |
| Total | 105 (100.0%) | 0 (0.0%) |
Fertility by Education in Ellenville
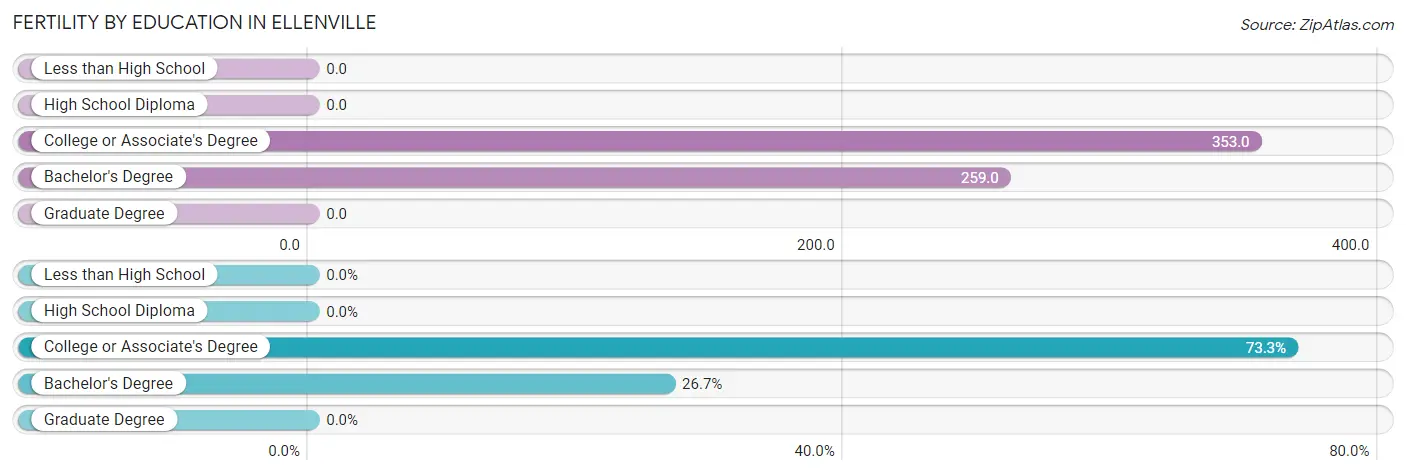
| Educational Attainment | Women with Births | Births / 1,000 Women |
| Less than High School | 0 (0.0%) | 0.0 |
| High School Diploma | 0 (0.0%) | 0.0 |
| College or Associate's Degree | 77 (73.3%) | 353.0 |
| Bachelor's Degree | 28 (26.7%) | 259.0 |
| Graduate Degree | 0 (0.0%) | 0.0 |
| Total | 105 (100.0%) | 148.0 |
Fertility by Education by Marriage Status in Ellenville
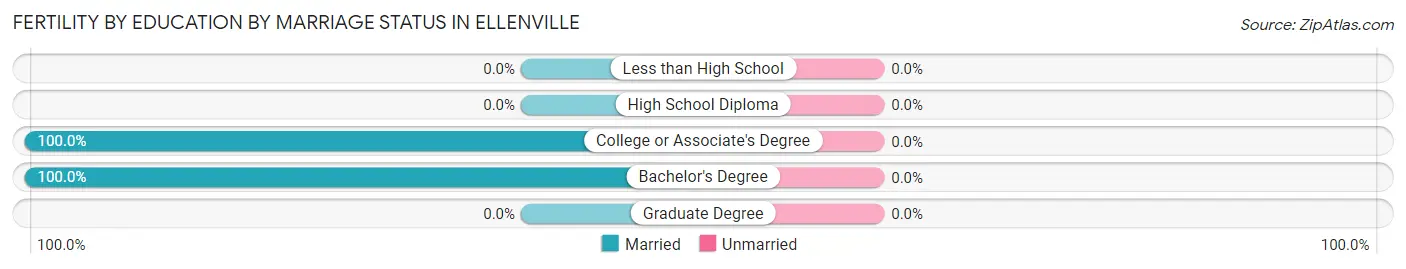
| Educational Attainment | Married | Unmarried |
| Less than High School | 0 (0.0%) | 0 (0.0%) |
| High School Diploma | 0 (0.0%) | 0 (0.0%) |
| College or Associate's Degree | 77 (100.0%) | 0 (0.0%) |
| Bachelor's Degree | 28 (100.0%) | 0 (0.0%) |
| Graduate Degree | 0 (0.0%) | 0 (0.0%) |
| Total | 105 (100.0%) | 0 (0.0%) |
Employment Characteristics in Ellenville
Employment by Class of Employer in Ellenville
Among the 1,669 employed individuals in Ellenville, private company employees (826 | 49.5%), state government employees (302 | 18.1%), and not-for-profit organizations (187 | 11.2%) make up the most common classes of employment.
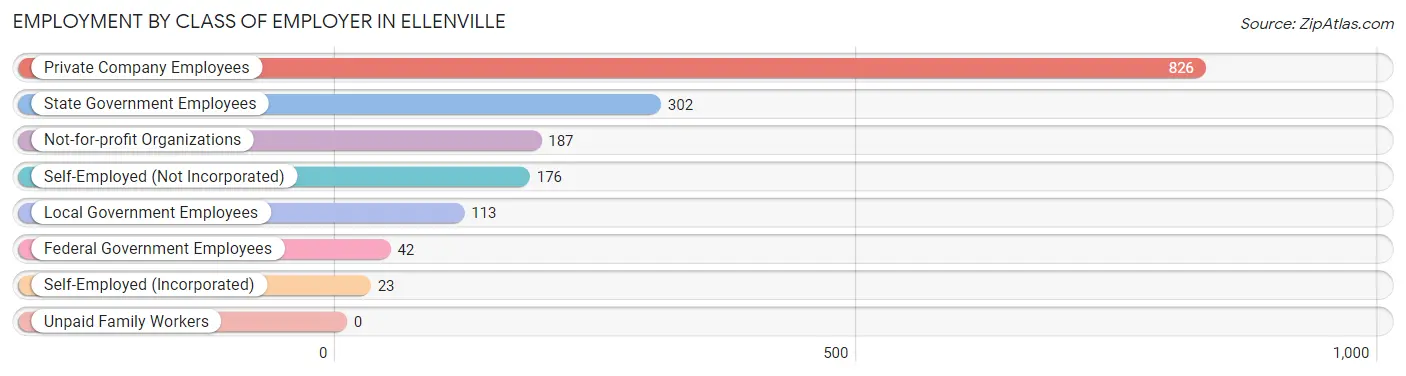
| Employer Class | # Employees | % Employees |
| Private Company Employees | 826 | 49.5% |
| Self-Employed (Incorporated) | 23 | 1.4% |
| Self-Employed (Not Incorporated) | 176 | 10.5% |
| Not-for-profit Organizations | 187 | 11.2% |
| Local Government Employees | 113 | 6.8% |
| State Government Employees | 302 | 18.1% |
| Federal Government Employees | 42 | 2.5% |
| Unpaid Family Workers | 0 | 0.0% |
| Total | 1,669 | 100.0% |
Employment Status by Age in Ellenville
According to the labor force statistics for Ellenville, out of the total population over 16 years of age (3,347), 50.7% or 1,697 individuals are in the labor force, with 0.6% or 10 of them unemployed. The age group with the highest labor force participation rate is 35 to 44 years, with 97.3% or 400 individuals in the labor force. Within the labor force, the 20 to 24 years age range has the highest percentage of unemployed individuals, with 13.3% or 11 of them being unemployed.
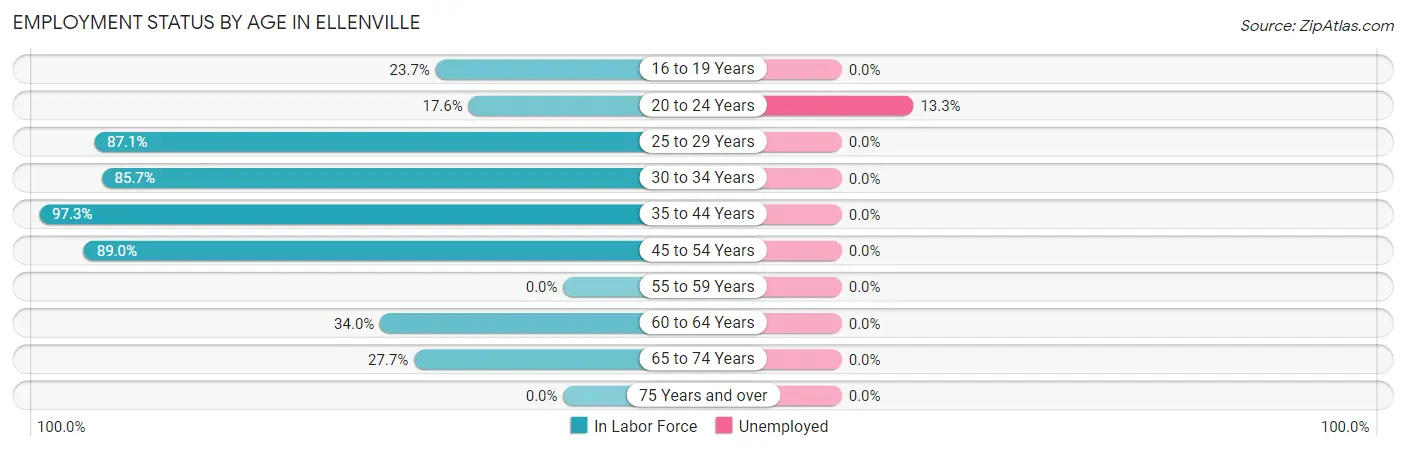
| Age Bracket | In Labor Force | Unemployed |
| 16 to 19 Years | 50 (23.7%) | 0 (0.0%) |
| 20 to 24 Years | 83 (17.6%) | 11 (13.3%) |
| 25 to 29 Years | 169 (87.1%) | 0 (0.0%) |
| 30 to 34 Years | 144 (85.7%) | 0 (0.0%) |
| 35 to 44 Years | 400 (97.3%) | 0 (0.0%) |
| 45 to 54 Years | 520 (89.0%) | 0 (0.0%) |
| 55 to 59 Years | 0 (0.0%) | 0 (0.0%) |
| 60 to 64 Years | 188 (34.0%) | 0 (0.0%) |
| 65 to 74 Years | 144 (27.7%) | 0 (0.0%) |
| 75 Years and over | 0 (0.0%) | 0 (0.0%) |
| Total | 1,697 (50.7%) | 10 (0.6%) |
Employment Status by Educational Attainment in Ellenville
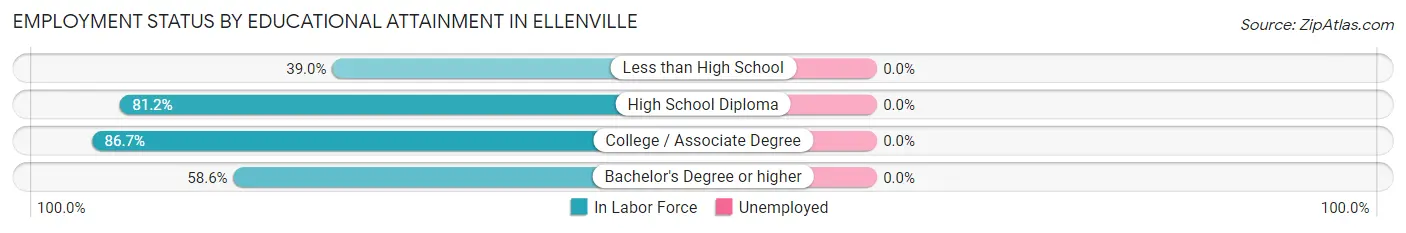
| Educational Attainment | In Labor Force | Unemployed |
| Less than High School | 71 (39.0%) | 0 (0.0%) |
| High School Diploma | 459 (81.2%) | 0 (0.0%) |
| College / Associate Degree | 599 (86.7%) | 0 (0.0%) |
| Bachelor's Degree or higher | 292 (58.6%) | 0 (0.0%) |
| Total | 1,421 (73.4%) | 0 (0.0%) |
Employment Occupations by Sex in Ellenville
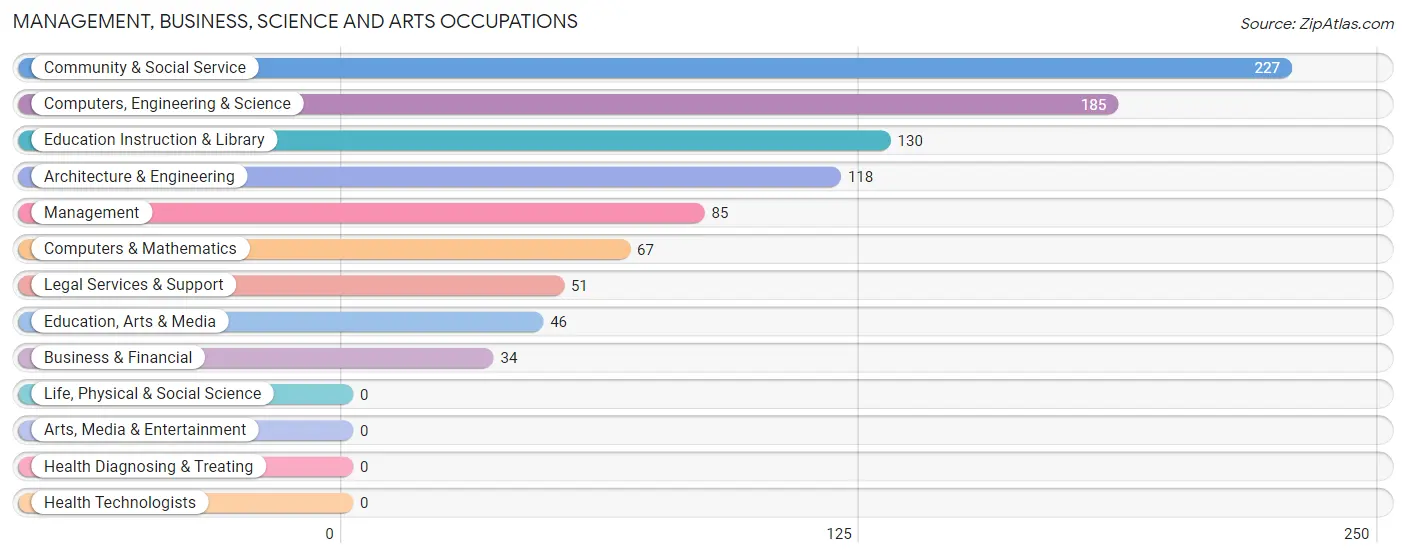
Management, Business, Science and Arts Occupations
The most common Management, Business, Science and Arts occupations in Ellenville are Community & Social Service (227 | 13.5%), Computers, Engineering & Science (185 | 11.0%), Education Instruction & Library (130 | 7.7%), Architecture & Engineering (118 | 7.0%), and Management (85 | 5.0%).
Management, Business, Science and Arts Occupations by Sex
Within the Management, Business, Science and Arts occupations in Ellenville, the most male-oriented occupations are Computers, Engineering & Science (100.0%), Computers & Mathematics (100.0%), and Architecture & Engineering (100.0%), while the most female-oriented occupations are Business & Financial (100.0%), Education Instruction & Library (96.2%), and Community & Social Service (69.6%).
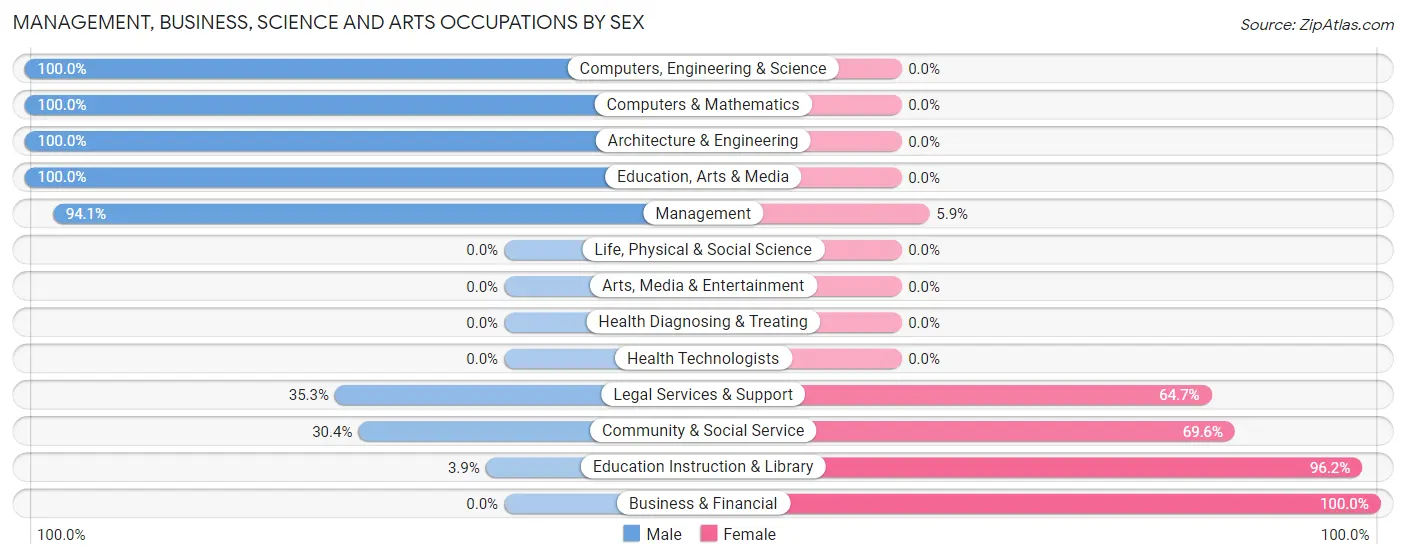
| Occupation | Male | Female |
| Management | 80 (94.1%) | 5 (5.9%) |
| Business & Financial | 0 (0.0%) | 34 (100.0%) |
| Computers, Engineering & Science | 185 (100.0%) | 0 (0.0%) |
| Computers & Mathematics | 67 (100.0%) | 0 (0.0%) |
| Architecture & Engineering | 118 (100.0%) | 0 (0.0%) |
| Life, Physical & Social Science | 0 (0.0%) | 0 (0.0%) |
| Community & Social Service | 69 (30.4%) | 158 (69.6%) |
| Education, Arts & Media | 46 (100.0%) | 0 (0.0%) |
| Legal Services & Support | 18 (35.3%) | 33 (64.7%) |
| Education Instruction & Library | 5 (3.8%) | 125 (96.2%) |
| Arts, Media & Entertainment | 0 (0.0%) | 0 (0.0%) |
| Health Diagnosing & Treating | 0 (0.0%) | 0 (0.0%) |
| Health Technologists | 0 (0.0%) | 0 (0.0%) |
| Total (Category) | 334 (62.9%) | 197 (37.1%) |
| Total (Overall) | 924 (54.8%) | 763 (45.2%) |
Services Occupations
The most common Services occupations in Ellenville are Security & Protection (202 | 12.0%), Law Enforcement (173 | 10.2%), Healthcare Support (166 | 9.8%), Food Preparation & Serving (79 | 4.7%), and Personal Care & Service (56 | 3.3%).
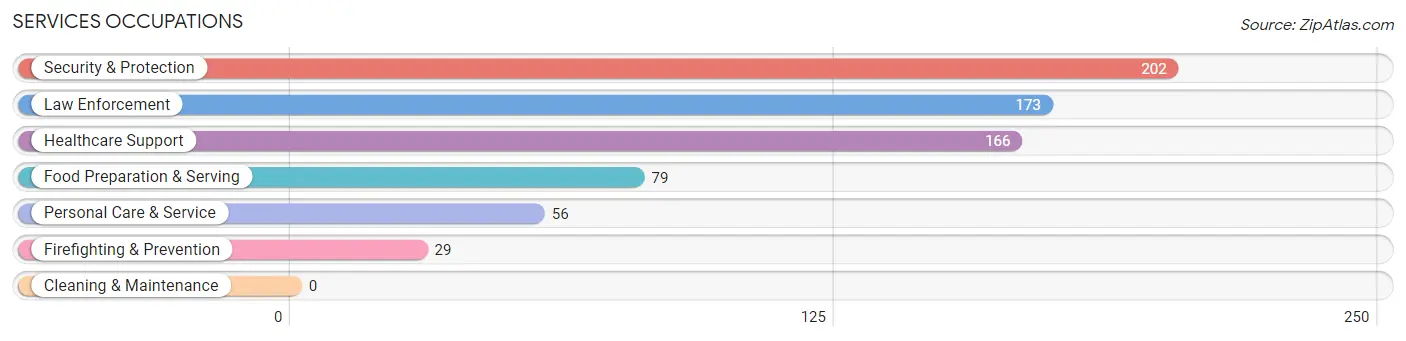
Services Occupations by Sex
Within the Services occupations in Ellenville, the most male-oriented occupations are Law Enforcement (100.0%), Security & Protection (90.6%), and Firefighting & Prevention (34.5%), while the most female-oriented occupations are Food Preparation & Serving (100.0%), Personal Care & Service (100.0%), and Healthcare Support (84.3%).
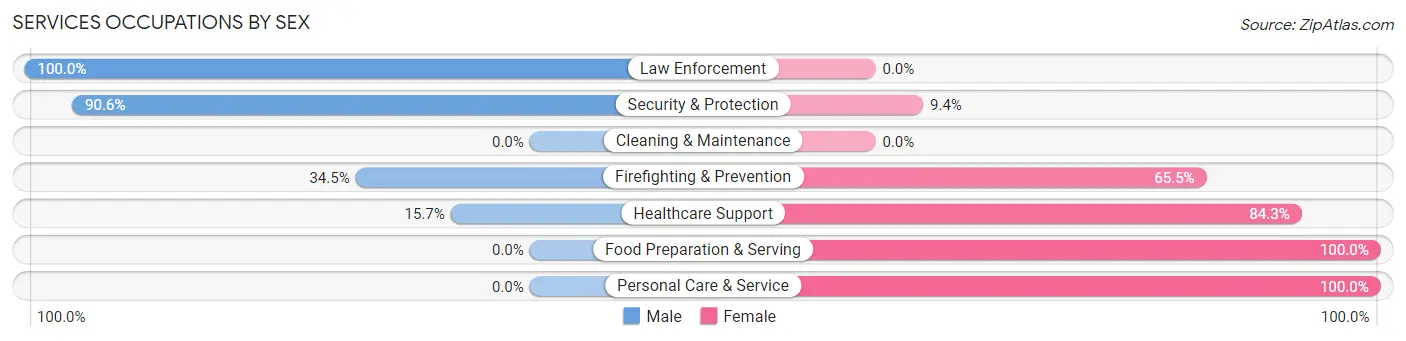
| Occupation | Male | Female |
| Healthcare Support | 26 (15.7%) | 140 (84.3%) |
| Security & Protection | 183 (90.6%) | 19 (9.4%) |
| Firefighting & Prevention | 10 (34.5%) | 19 (65.5%) |
| Law Enforcement | 173 (100.0%) | 0 (0.0%) |
| Food Preparation & Serving | 0 (0.0%) | 79 (100.0%) |
| Cleaning & Maintenance | 0 (0.0%) | 0 (0.0%) |
| Personal Care & Service | 0 (0.0%) | 56 (100.0%) |
| Total (Category) | 209 (41.5%) | 294 (58.5%) |
| Total (Overall) | 924 (54.8%) | 763 (45.2%) |
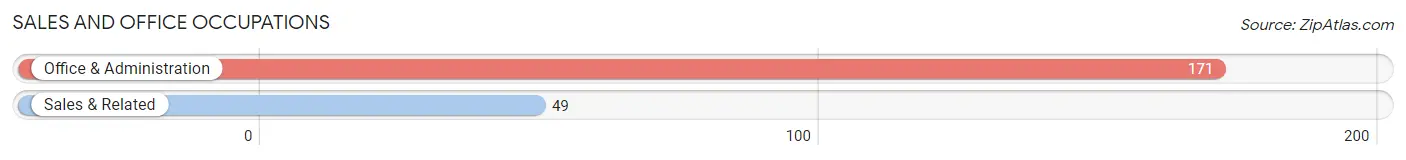
Sales and Office Occupations
The most common Sales and Office occupations in Ellenville are Office & Administration (171 | 10.1%), and Sales & Related (49 | 2.9%).
Sales and Office Occupations by Sex
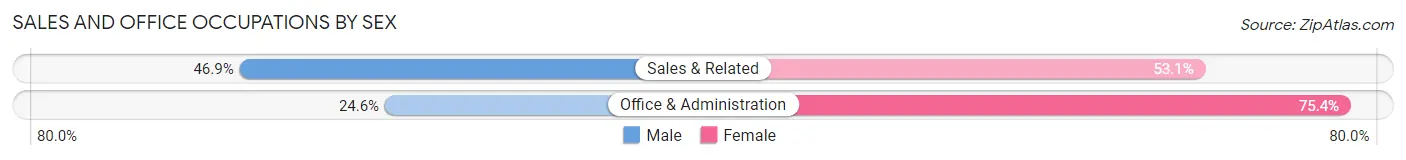
| Occupation | Male | Female |
| Sales & Related | 23 (46.9%) | 26 (53.1%) |
| Office & Administration | 42 (24.6%) | 129 (75.4%) |
| Total (Category) | 65 (29.5%) | 155 (70.5%) |
| Total (Overall) | 924 (54.8%) | 763 (45.2%) |
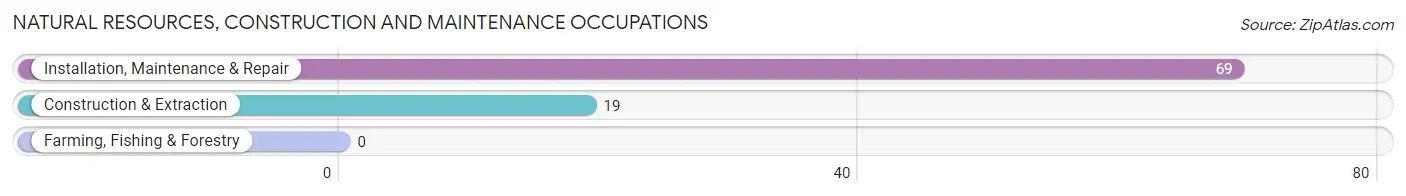
Natural Resources, Construction and Maintenance Occupations
The most common Natural Resources, Construction and Maintenance occupations in Ellenville are Installation, Maintenance & Repair (69 | 4.1%), and Construction & Extraction (19 | 1.1%).
Natural Resources, Construction and Maintenance Occupations by Sex
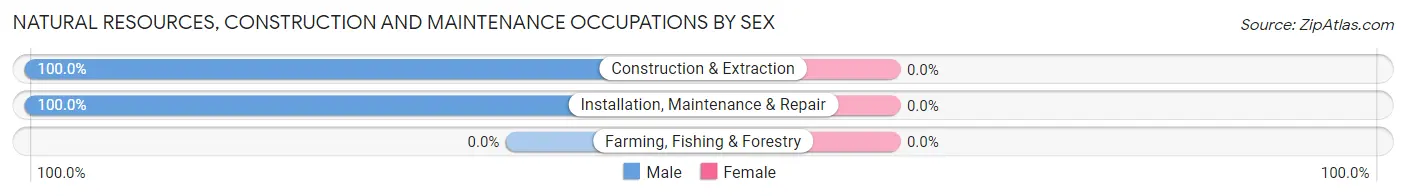
| Occupation | Male | Female |
| Farming, Fishing & Forestry | 0 (0.0%) | 0 (0.0%) |
| Construction & Extraction | 19 (100.0%) | 0 (0.0%) |
| Installation, Maintenance & Repair | 69 (100.0%) | 0 (0.0%) |
| Total (Category) | 88 (100.0%) | 0 (0.0%) |
| Total (Overall) | 924 (54.8%) | 763 (45.2%) |
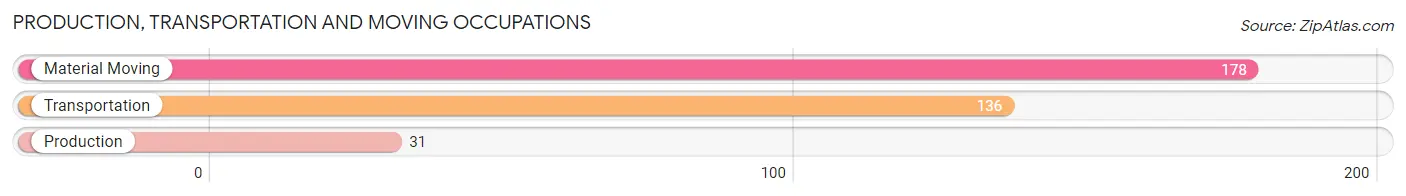
Production, Transportation and Moving Occupations
The most common Production, Transportation and Moving occupations in Ellenville are Material Moving (178 | 10.5%), Transportation (136 | 8.1%), and Production (31 | 1.8%).
Production, Transportation and Moving Occupations by Sex
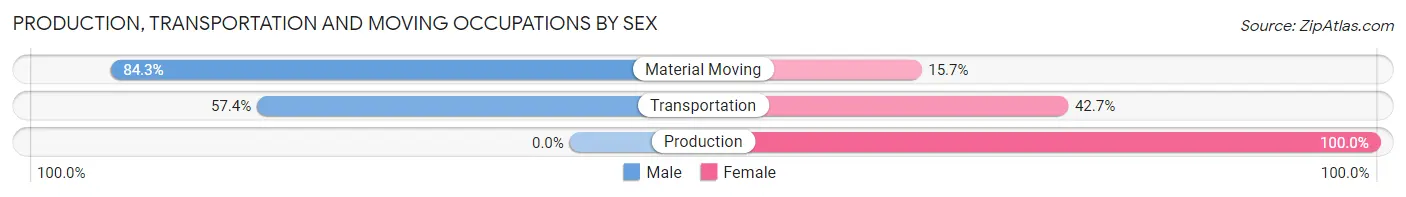
| Occupation | Male | Female |
| Production | 0 (0.0%) | 31 (100.0%) |
| Transportation | 78 (57.4%) | 58 (42.6%) |
| Material Moving | 150 (84.3%) | 28 (15.7%) |
| Total (Category) | 228 (66.1%) | 117 (33.9%) |
| Total (Overall) | 924 (54.8%) | 763 (45.2%) |
Employment Industries by Sex in Ellenville
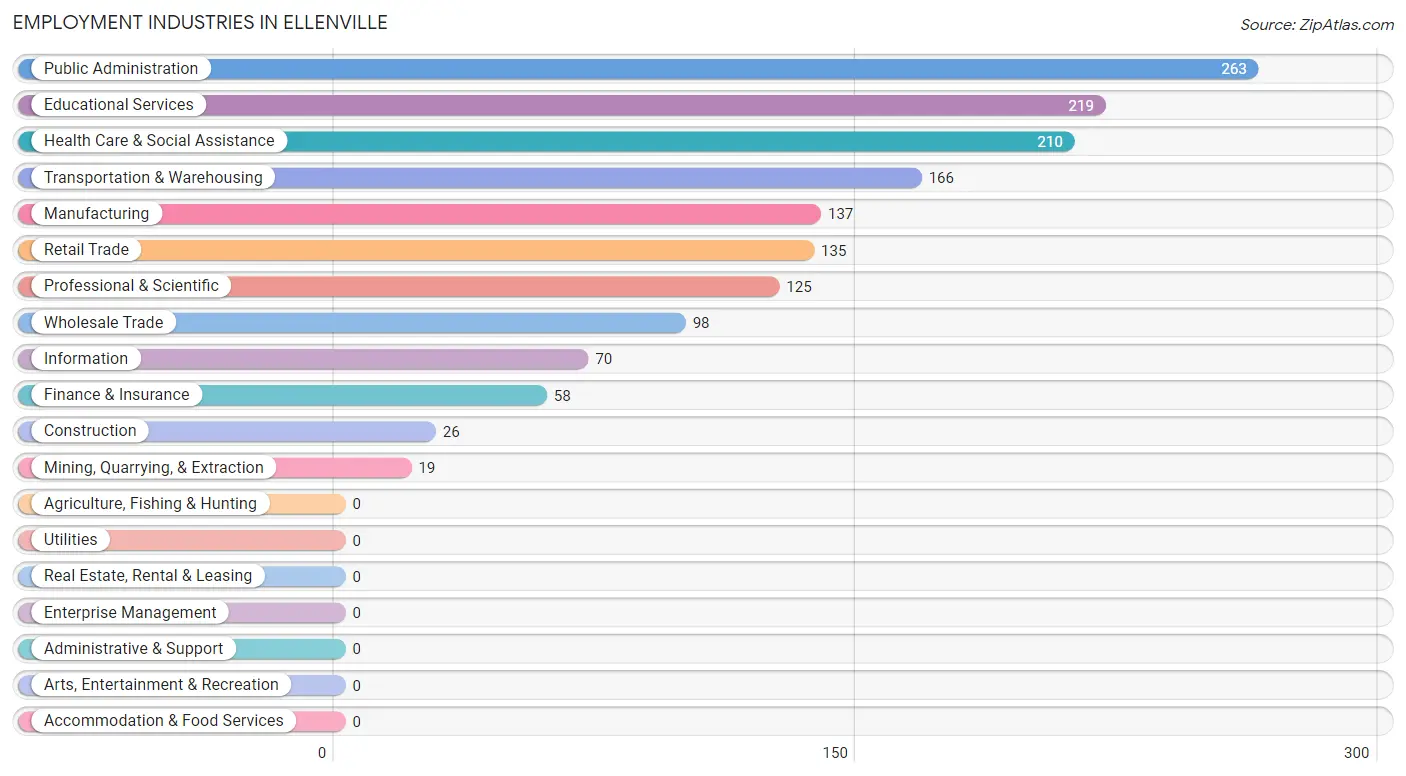
Employment Industries in Ellenville
The major employment industries in Ellenville include Public Administration (263 | 15.6%), Educational Services (219 | 13.0%), Health Care & Social Assistance (210 | 12.4%), Transportation & Warehousing (166 | 9.8%), and Manufacturing (137 | 8.1%).
Employment Industries by Sex in Ellenville
The Ellenville industries that see more men than women are Mining, Quarrying, & Extraction (100.0%), Construction (100.0%), and Wholesale Trade (100.0%), whereas the industries that tend to have a higher number of women are Educational Services (93.1%), Information (71.4%), and Retail Trade (67.4%).
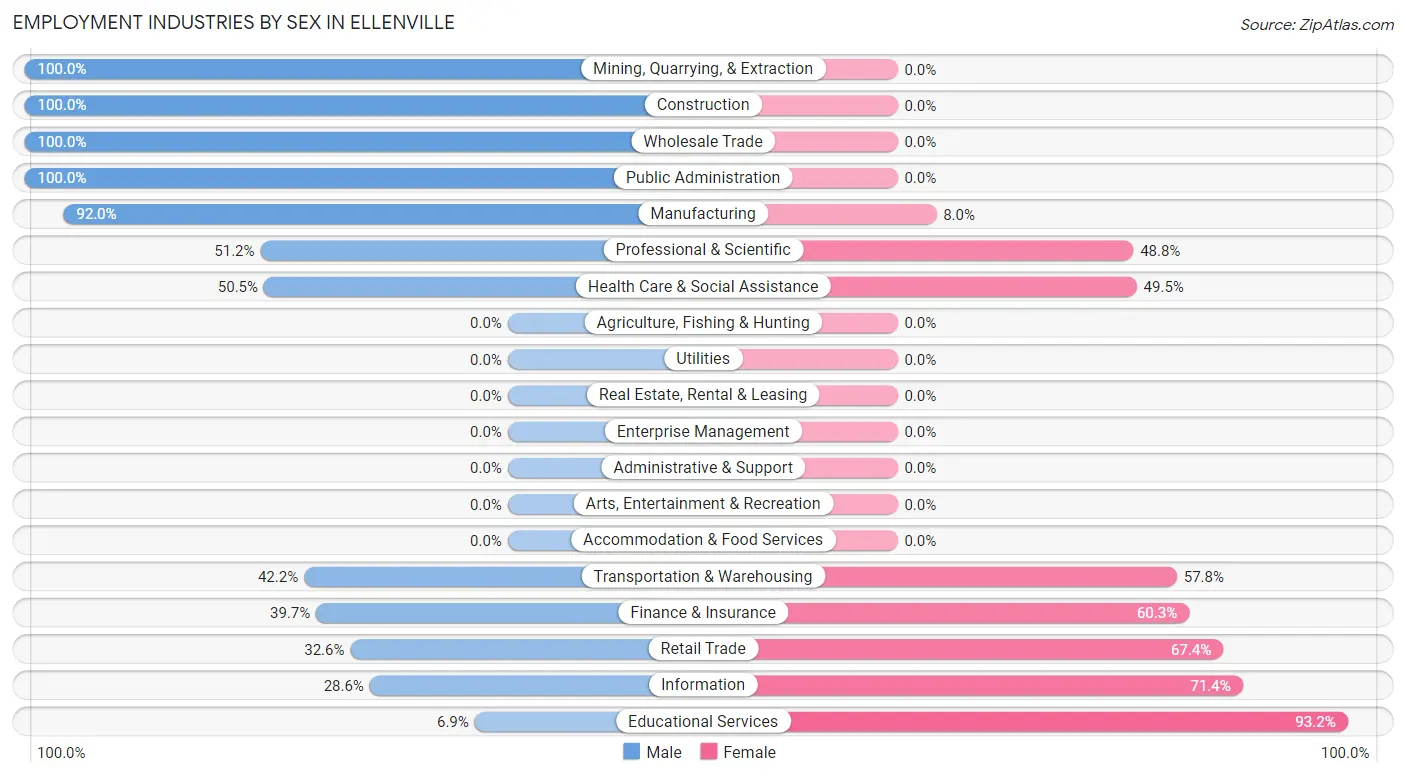
| Industry | Male | Female |
| Agriculture, Fishing & Hunting | 0 (0.0%) | 0 (0.0%) |
| Mining, Quarrying, & Extraction | 19 (100.0%) | 0 (0.0%) |
| Construction | 26 (100.0%) | 0 (0.0%) |
| Manufacturing | 126 (92.0%) | 11 (8.0%) |
| Wholesale Trade | 98 (100.0%) | 0 (0.0%) |
| Retail Trade | 44 (32.6%) | 91 (67.4%) |
| Transportation & Warehousing | 70 (42.2%) | 96 (57.8%) |
| Utilities | 0 (0.0%) | 0 (0.0%) |
| Information | 20 (28.6%) | 50 (71.4%) |
| Finance & Insurance | 23 (39.7%) | 35 (60.3%) |
| Real Estate, Rental & Leasing | 0 (0.0%) | 0 (0.0%) |
| Professional & Scientific | 64 (51.2%) | 61 (48.8%) |
| Enterprise Management | 0 (0.0%) | 0 (0.0%) |
| Administrative & Support | 0 (0.0%) | 0 (0.0%) |
| Educational Services | 15 (6.9%) | 204 (93.1%) |
| Health Care & Social Assistance | 106 (50.5%) | 104 (49.5%) |
| Arts, Entertainment & Recreation | 0 (0.0%) | 0 (0.0%) |
| Accommodation & Food Services | 0 (0.0%) | 0 (0.0%) |
| Public Administration | 263 (100.0%) | 0 (0.0%) |
| Total | 924 (54.8%) | 763 (45.2%) |
Education in Ellenville
School Enrollment in Ellenville
The most common levels of schooling among the 1,450 students in Ellenville are college / undergraduate (372 | 25.7%), high school (360 | 24.8%), and elementary school (321 | 22.1%).
| School Level | # Students | % Students |
| Nursery / Preschool | 0 | 0.0% |
| Kindergarten | 0 | 0.0% |
| Elementary School | 321 | 22.1% |
| Middle School | 321 | 22.1% |
| High School | 360 | 24.8% |
| College / Undergraduate | 372 | 25.7% |
| Graduate / Professional | 76 | 5.2% |
| Total | 1,450 | 100.0% |
School Enrollment by Age by Funding Source in Ellenville
Out of a total of 1,450 students who are enrolled in schools in Ellenville, 1 (0.1%) attend a private institution, while the remaining 1,449 (99.9%) are enrolled in public schools. The age group of 18 to 19 year olds has the highest likelihood of being enrolled in private schools, with 1 (2.6% in the age bracket) enrolled. Conversely, the age group of 5 to 9 year old has the lowest likelihood of being enrolled in a private school, with 267 (100.0% in the age bracket) attending a public institution.
| Age Bracket | Public School | Private School |
| 3 to 4 Year Olds | 0 (0.0%) | 0 (0.0%) |
| 5 to 9 Year Old | 267 (100.0%) | 0 (0.0%) |
| 10 to 14 Year Olds | 417 (100.0%) | 0 (0.0%) |
| 15 to 17 Year Olds | 233 (99.6%) | 1 (0.4%) |
| 18 to 19 Year Olds | 38 (97.4%) | 1 (2.6%) |
| 20 to 24 Year Olds | 396 (100.0%) | 0 (0.0%) |
| 25 to 34 Year Olds | 83 (100.0%) | 0 (0.0%) |
| 35 Years and over | 14 (100.0%) | 0 (0.0%) |
| Total | 1,449 (99.9%) | 1 (0.1%) |
Educational Attainment by Field of Study in Ellenville
Business (262 | 25.8%), education (170 | 16.8%), communications (143 | 14.1%), psychology (108 | 10.6%), and social sciences (98 | 9.7%) are the most common fields of study among 1,014 individuals in Ellenville who have obtained a bachelor's degree or higher.
| Field of Study | # Graduates | % Graduates |
| Computers & Mathematics | 26 | 2.6% |
| Bio, Nature & Agricultural | 0 | 0.0% |
| Physical & Health Sciences | 0 | 0.0% |
| Psychology | 108 | 10.6% |
| Social Sciences | 98 | 9.7% |
| Engineering | 58 | 5.7% |
| Multidisciplinary Studies | 33 | 3.3% |
| Science & Technology | 0 | 0.0% |
| Business | 262 | 25.8% |
| Education | 170 | 16.8% |
| Literature & Languages | 41 | 4.0% |
| Liberal Arts & History | 33 | 3.3% |
| Visual & Performing Arts | 0 | 0.0% |
| Communications | 143 | 14.1% |
| Arts & Humanities | 42 | 4.1% |
| Total | 1,014 | 100.0% |
Transportation & Commute in Ellenville
Vehicle Availability by Sex in Ellenville
The most prevalent vehicle ownership categories in Ellenville are males with 2 vehicles (341, accounting for 37.6%) and females with 2 vehicles (350, making up 44.7%).
| Vehicles Available | Male | Female |
| No Vehicle | 81 (8.9%) | 57 (7.5%) |
| 1 Vehicle | 293 (32.3%) | 205 (26.9%) |
| 2 Vehicles | 341 (37.6%) | 350 (45.9%) |
| 3 Vehicles | 73 (8.1%) | 43 (5.6%) |
| 4 Vehicles | 118 (13.0%) | 108 (14.1%) |
| 5 or more Vehicles | 0 (0.0%) | 0 (0.0%) |
| Total | 906 (100.0%) | 763 (100.0%) |
Commute Time in Ellenville
The most frequently occuring commute durations in Ellenville are 5 to 9 minutes (412 commuters, 26.3%), 15 to 19 minutes (233 commuters, 14.8%), and 45 to 59 minutes (193 commuters, 12.3%).
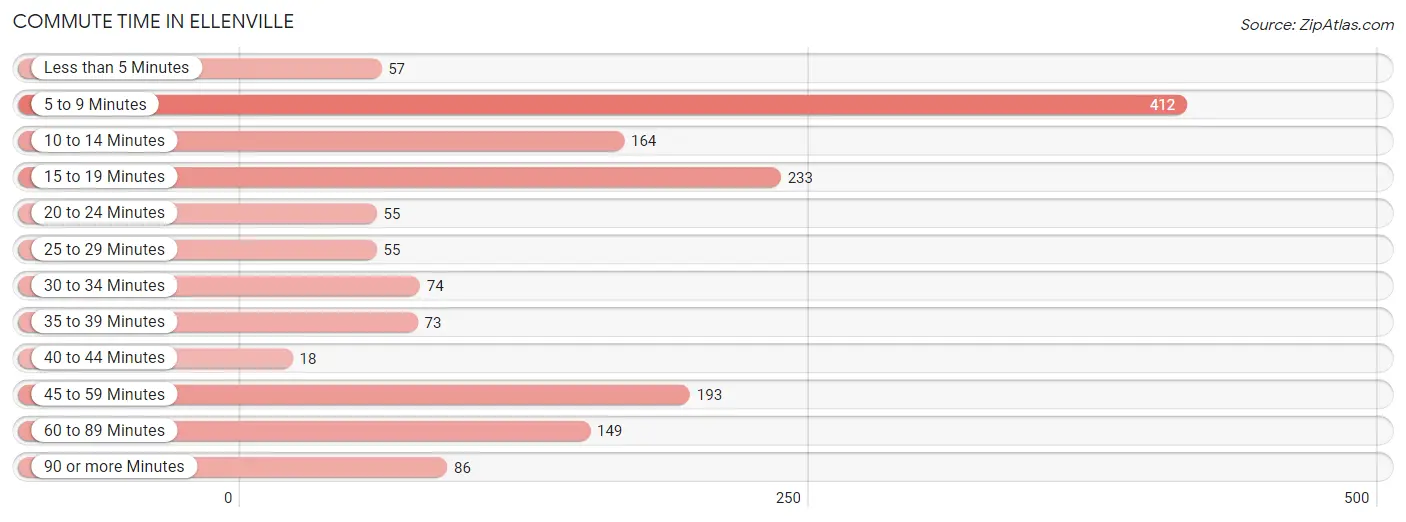
| Commute Time | # Commuters | % Commuters |
| Less than 5 Minutes | 57 | 3.6% |
| 5 to 9 Minutes | 412 | 26.3% |
| 10 to 14 Minutes | 164 | 10.4% |
| 15 to 19 Minutes | 233 | 14.8% |
| 20 to 24 Minutes | 55 | 3.5% |
| 25 to 29 Minutes | 55 | 3.5% |
| 30 to 34 Minutes | 74 | 4.7% |
| 35 to 39 Minutes | 73 | 4.6% |
| 40 to 44 Minutes | 18 | 1.1% |
| 45 to 59 Minutes | 193 | 12.3% |
| 60 to 89 Minutes | 149 | 9.5% |
| 90 or more Minutes | 86 | 5.5% |
Commute Time by Sex in Ellenville
The most common commute times in Ellenville are 45 to 59 minutes (165 commuters, 19.7%) for males and 5 to 9 minutes (268 commuters, 36.7%) for females.
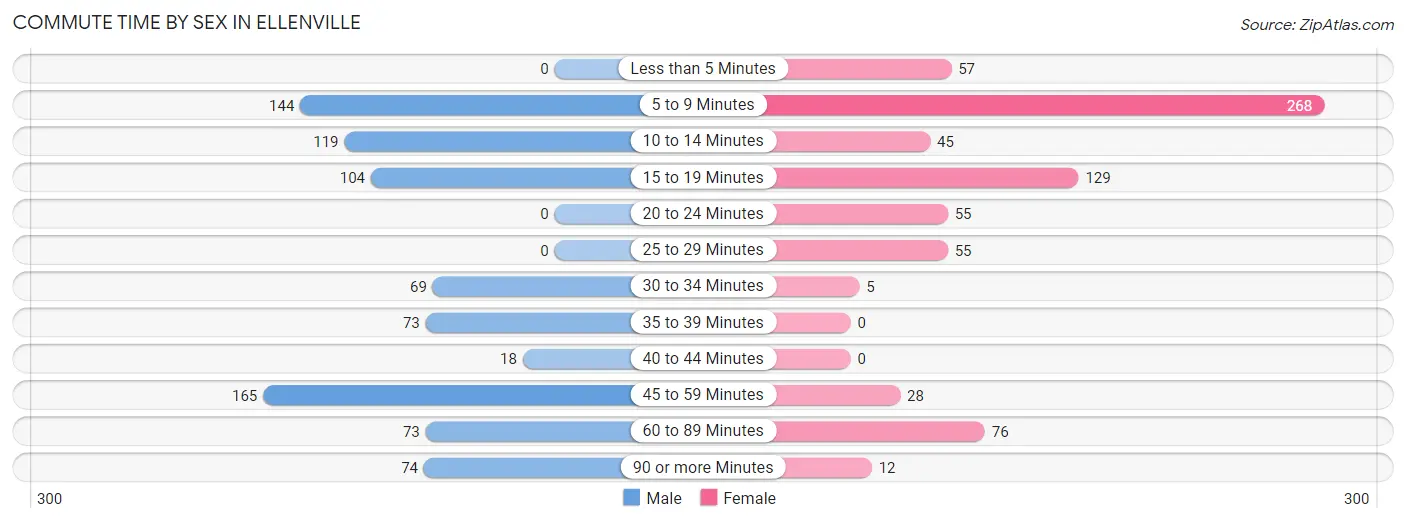
| Commute Time | Male | Female |
| Less than 5 Minutes | 0 (0.0%) | 57 (7.8%) |
| 5 to 9 Minutes | 144 (17.2%) | 268 (36.7%) |
| 10 to 14 Minutes | 119 (14.2%) | 45 (6.2%) |
| 15 to 19 Minutes | 104 (12.4%) | 129 (17.7%) |
| 20 to 24 Minutes | 0 (0.0%) | 55 (7.5%) |
| 25 to 29 Minutes | 0 (0.0%) | 55 (7.5%) |
| 30 to 34 Minutes | 69 (8.2%) | 5 (0.7%) |
| 35 to 39 Minutes | 73 (8.7%) | 0 (0.0%) |
| 40 to 44 Minutes | 18 (2.1%) | 0 (0.0%) |
| 45 to 59 Minutes | 165 (19.7%) | 28 (3.8%) |
| 60 to 89 Minutes | 73 (8.7%) | 76 (10.4%) |
| 90 or more Minutes | 74 (8.8%) | 12 (1.6%) |
Time of Departure to Work by Sex in Ellenville
The most frequent times of departure to work in Ellenville are 5:30 AM to 5:59 AM (151, 18.0%) for males and 6:30 AM to 6:59 AM (146, 20.0%) for females.
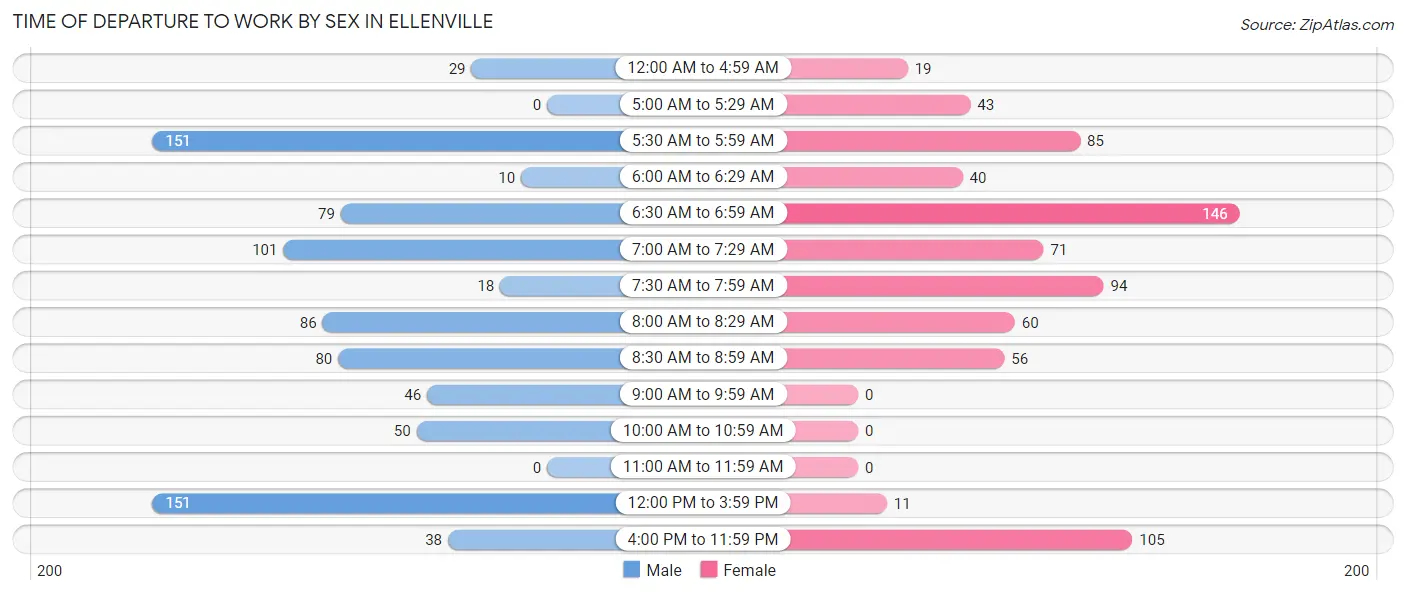
| Time of Departure | Male | Female |
| 12:00 AM to 4:59 AM | 29 (3.5%) | 19 (2.6%) |
| 5:00 AM to 5:29 AM | 0 (0.0%) | 43 (5.9%) |
| 5:30 AM to 5:59 AM | 151 (18.0%) | 85 (11.6%) |
| 6:00 AM to 6:29 AM | 10 (1.2%) | 40 (5.5%) |
| 6:30 AM to 6:59 AM | 79 (9.4%) | 146 (20.0%) |
| 7:00 AM to 7:29 AM | 101 (12.0%) | 71 (9.7%) |
| 7:30 AM to 7:59 AM | 18 (2.1%) | 94 (12.9%) |
| 8:00 AM to 8:29 AM | 86 (10.2%) | 60 (8.2%) |
| 8:30 AM to 8:59 AM | 80 (9.5%) | 56 (7.7%) |
| 9:00 AM to 9:59 AM | 46 (5.5%) | 0 (0.0%) |
| 10:00 AM to 10:59 AM | 50 (6.0%) | 0 (0.0%) |
| 11:00 AM to 11:59 AM | 0 (0.0%) | 0 (0.0%) |
| 12:00 PM to 3:59 PM | 151 (18.0%) | 11 (1.5%) |
| 4:00 PM to 11:59 PM | 38 (4.5%) | 105 (14.4%) |
| Total | 839 (100.0%) | 730 (100.0%) |
Housing Occupancy in Ellenville
Occupancy by Ownership in Ellenville
Of the total 1,671 dwellings in Ellenville, owner-occupied units account for 941 (56.3%), while renter-occupied units make up 730 (43.7%).
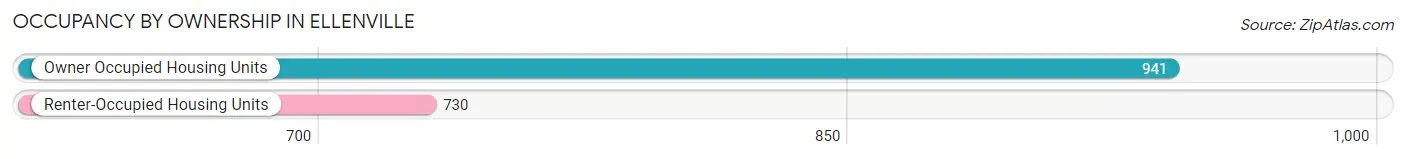
| Occupancy | # Housing Units | % Housing Units |
| Owner Occupied Housing Units | 941 | 56.3% |
| Renter-Occupied Housing Units | 730 | 43.7% |
| Total Occupied Housing Units | 1,671 | 100.0% |
Occupancy by Household Size in Ellenville
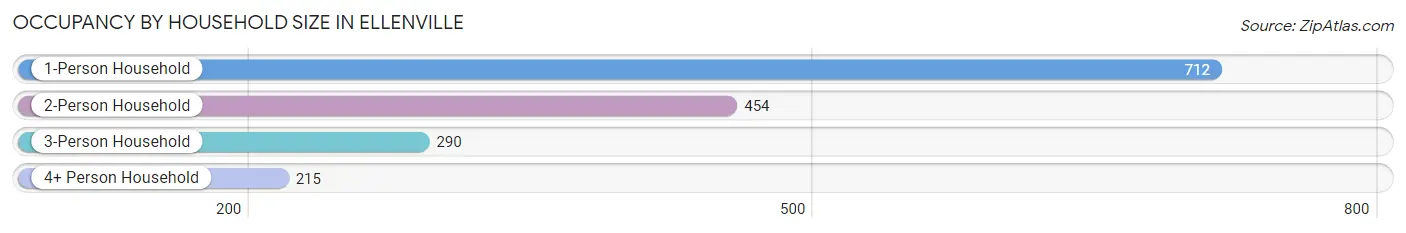
| Household Size | # Housing Units | % Housing Units |
| 1-Person Household | 712 | 42.6% |
| 2-Person Household | 454 | 27.2% |
| 3-Person Household | 290 | 17.3% |
| 4+ Person Household | 215 | 12.9% |
| Total Housing Units | 1,671 | 100.0% |
Occupancy by Ownership by Household Size in Ellenville
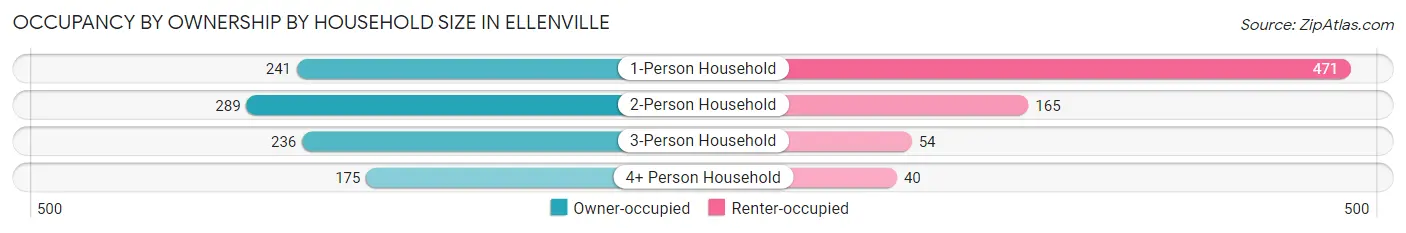
| Household Size | Owner-occupied | Renter-occupied |
| 1-Person Household | 241 (33.9%) | 471 (66.1%) |
| 2-Person Household | 289 (63.7%) | 165 (36.3%) |
| 3-Person Household | 236 (81.4%) | 54 (18.6%) |
| 4+ Person Household | 175 (81.4%) | 40 (18.6%) |
| Total Housing Units | 941 (56.3%) | 730 (43.7%) |
Occupancy by Educational Attainment in Ellenville
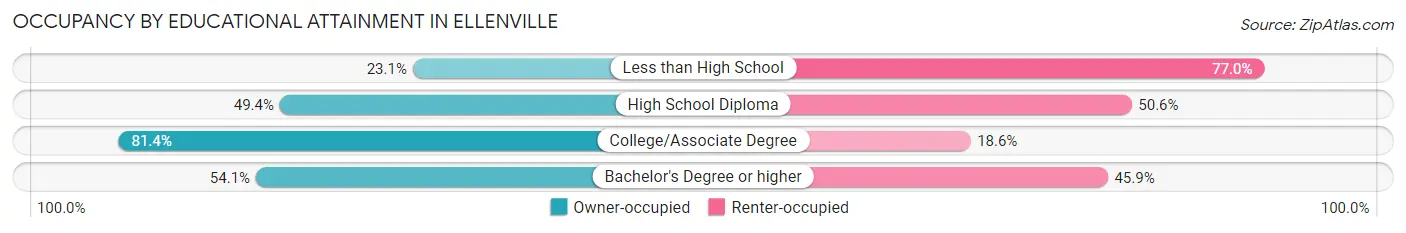
| Household Size | Owner-occupied | Renter-occupied |
| Less than High School | 62 (23.1%) | 207 (76.9%) |
| High School Diploma | 166 (49.4%) | 170 (50.6%) |
| College/Associate Degree | 406 (81.4%) | 93 (18.6%) |
| Bachelor's Degree or higher | 307 (54.1%) | 260 (45.9%) |
Occupancy by Age of Householder in Ellenville
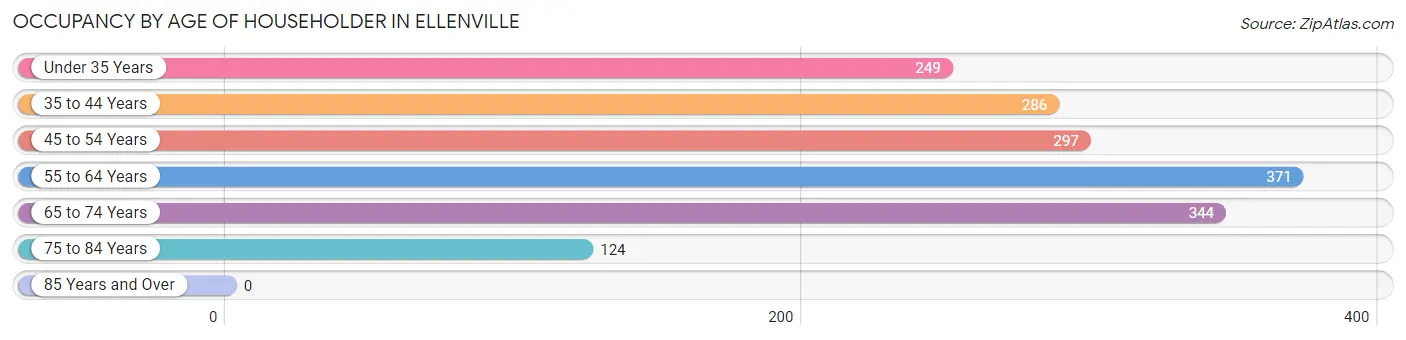
| Age Bracket | # Households | % Households |
| Under 35 Years | 249 | 14.9% |
| 35 to 44 Years | 286 | 17.1% |
| 45 to 54 Years | 297 | 17.8% |
| 55 to 64 Years | 371 | 22.2% |
| 65 to 74 Years | 344 | 20.6% |
| 75 to 84 Years | 124 | 7.4% |
| 85 Years and Over | 0 | 0.0% |
| Total | 1,671 | 100.0% |
Housing Finances in Ellenville
Median Income by Occupancy in Ellenville
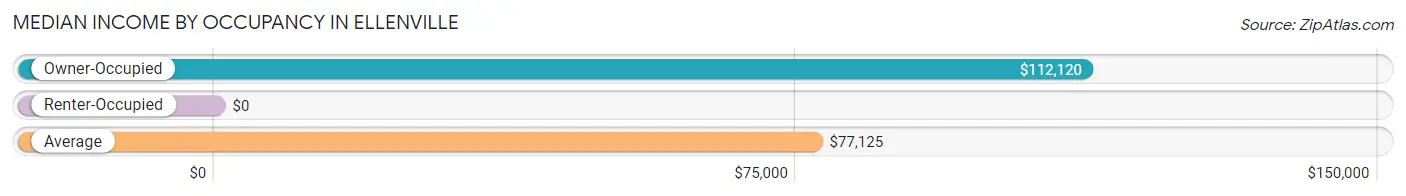
| Occupancy Type | # Households | Median Income |
| Owner-Occupied | 941 (56.3%) | $112,120 |
| Renter-Occupied | 730 (43.7%) | $0 |
| Average | 1,671 (100.0%) | $77,125 |
Occupancy by Householder Income Bracket in Ellenville
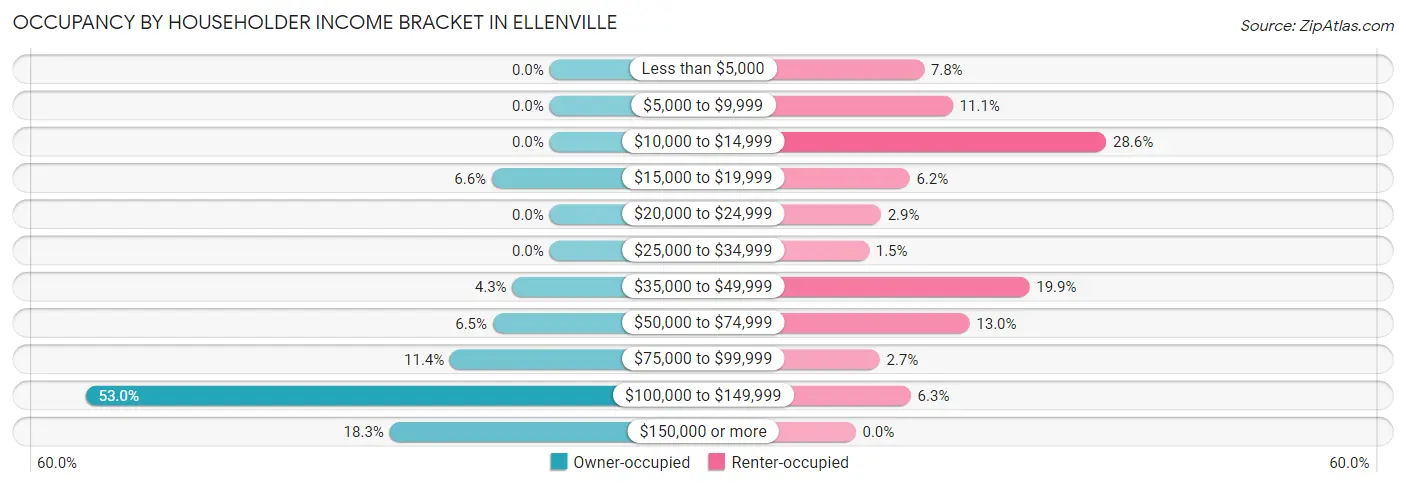
| Income Bracket | Owner-occupied | Renter-occupied |
| Less than $5,000 | 0 (0.0%) | 57 (7.8%) |
| $5,000 to $9,999 | 0 (0.0%) | 81 (11.1%) |
| $10,000 to $14,999 | 0 (0.0%) | 209 (28.6%) |
| $15,000 to $19,999 | 62 (6.6%) | 45 (6.2%) |
| $20,000 to $24,999 | 0 (0.0%) | 21 (2.9%) |
| $25,000 to $34,999 | 0 (0.0%) | 11 (1.5%) |
| $35,000 to $49,999 | 40 (4.3%) | 145 (19.9%) |
| $50,000 to $74,999 | 61 (6.5%) | 95 (13.0%) |
| $75,000 to $99,999 | 107 (11.4%) | 20 (2.7%) |
| $100,000 to $149,999 | 499 (53.0%) | 46 (6.3%) |
| $150,000 or more | 172 (18.3%) | 0 (0.0%) |
| Total | 941 (100.0%) | 730 (100.0%) |
Monthly Housing Cost Tiers in Ellenville
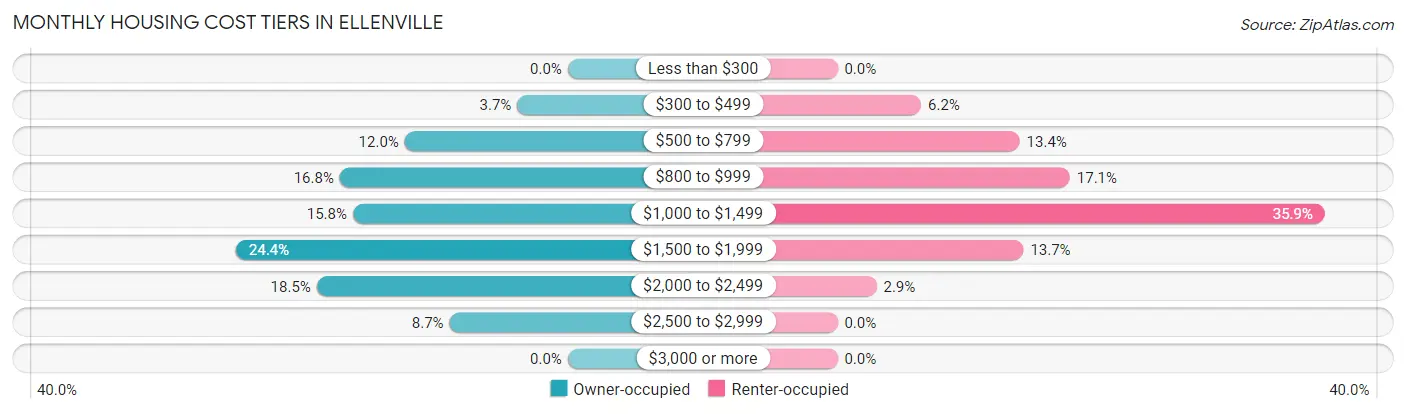
| Monthly Cost | Owner-occupied | Renter-occupied |
| Less than $300 | 0 (0.0%) | 0 (0.0%) |
| $300 to $499 | 35 (3.7%) | 45 (6.2%) |
| $500 to $799 | 113 (12.0%) | 98 (13.4%) |
| $800 to $999 | 158 (16.8%) | 125 (17.1%) |
| $1,000 to $1,499 | 149 (15.8%) | 262 (35.9%) |
| $1,500 to $1,999 | 230 (24.4%) | 100 (13.7%) |
| $2,000 to $2,499 | 174 (18.5%) | 21 (2.9%) |
| $2,500 to $2,999 | 82 (8.7%) | 0 (0.0%) |
| $3,000 or more | 0 (0.0%) | 0 (0.0%) |
| Total | 941 (100.0%) | 730 (100.0%) |
Physical Housing Characteristics in Ellenville
Housing Structures in Ellenville
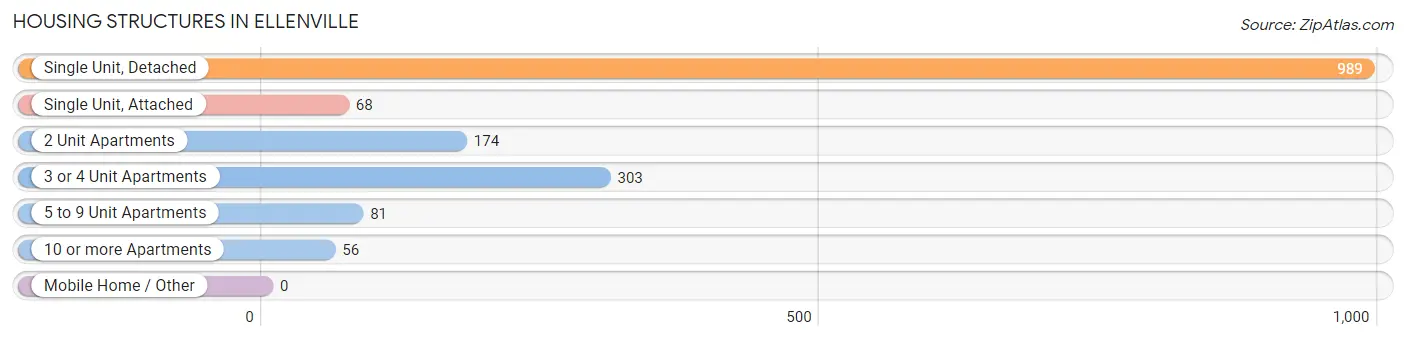
| Structure Type | # Housing Units | % Housing Units |
| Single Unit, Detached | 989 | 59.2% |
| Single Unit, Attached | 68 | 4.1% |
| 2 Unit Apartments | 174 | 10.4% |
| 3 or 4 Unit Apartments | 303 | 18.1% |
| 5 to 9 Unit Apartments | 81 | 4.9% |
| 10 or more Apartments | 56 | 3.4% |
| Mobile Home / Other | 0 | 0.0% |
| Total | 1,671 | 100.0% |
Housing Structures by Occupancy in Ellenville
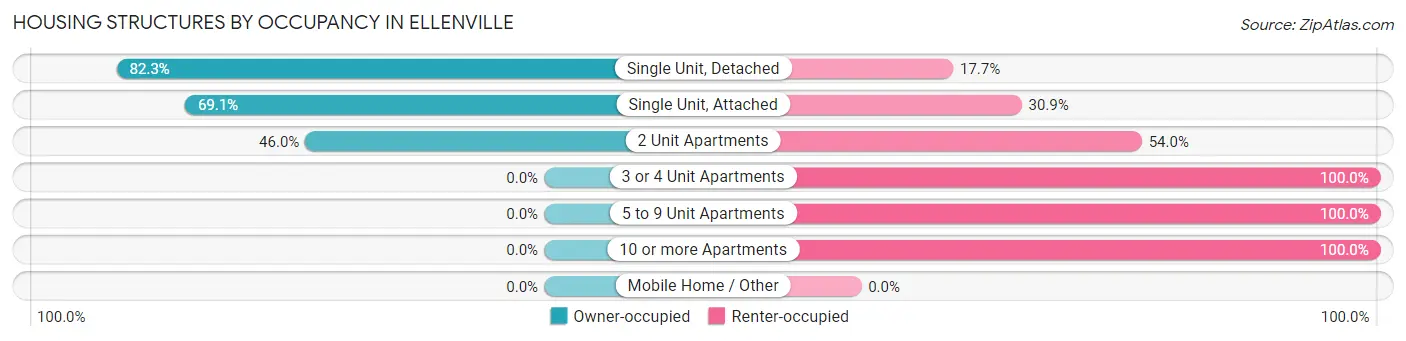
| Structure Type | Owner-occupied | Renter-occupied |
| Single Unit, Detached | 814 (82.3%) | 175 (17.7%) |
| Single Unit, Attached | 47 (69.1%) | 21 (30.9%) |
| 2 Unit Apartments | 80 (46.0%) | 94 (54.0%) |
| 3 or 4 Unit Apartments | 0 (0.0%) | 303 (100.0%) |
| 5 to 9 Unit Apartments | 0 (0.0%) | 81 (100.0%) |
| 10 or more Apartments | 0 (0.0%) | 56 (100.0%) |
| Mobile Home / Other | 0 (0.0%) | 0 (0.0%) |
| Total | 941 (56.3%) | 730 (43.7%) |
Housing Structures by Number of Rooms in Ellenville
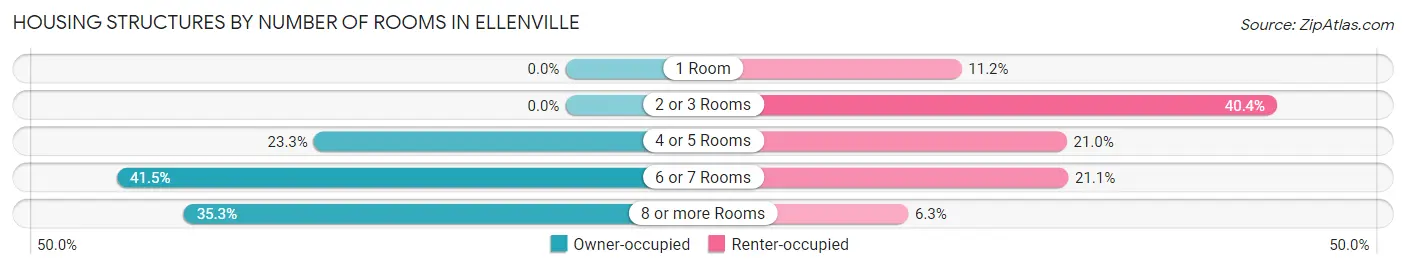
| Number of Rooms | Owner-occupied | Renter-occupied |
| 1 Room | 0 (0.0%) | 82 (11.2%) |
| 2 or 3 Rooms | 0 (0.0%) | 295 (40.4%) |
| 4 or 5 Rooms | 219 (23.3%) | 153 (21.0%) |
| 6 or 7 Rooms | 390 (41.4%) | 154 (21.1%) |
| 8 or more Rooms | 332 (35.3%) | 46 (6.3%) |
| Total | 941 (100.0%) | 730 (100.0%) |
Housing Structure by Heating Type in Ellenville
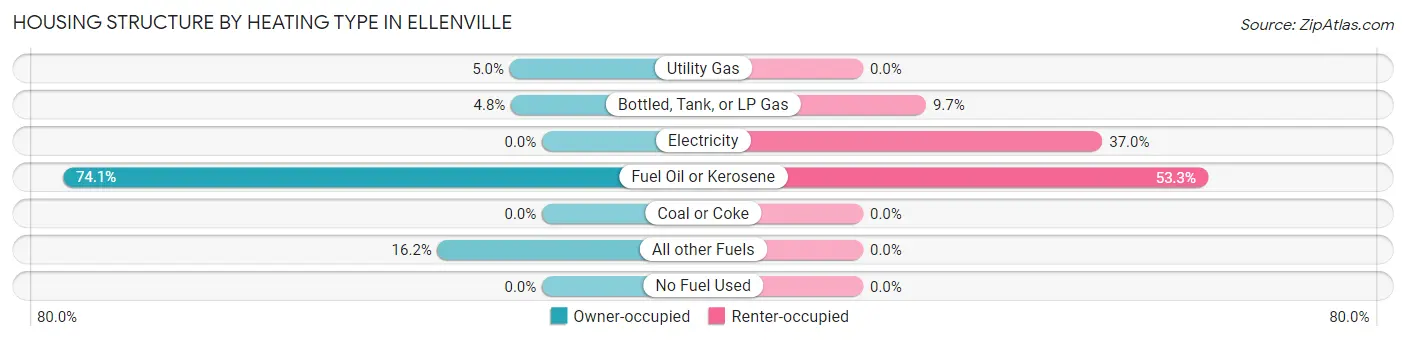
| Heating Type | Owner-occupied | Renter-occupied |
| Utility Gas | 47 (5.0%) | 0 (0.0%) |
| Bottled, Tank, or LP Gas | 45 (4.8%) | 71 (9.7%) |
| Electricity | 0 (0.0%) | 270 (37.0%) |
| Fuel Oil or Kerosene | 697 (74.1%) | 389 (53.3%) |
| Coal or Coke | 0 (0.0%) | 0 (0.0%) |
| All other Fuels | 152 (16.2%) | 0 (0.0%) |
| No Fuel Used | 0 (0.0%) | 0 (0.0%) |
| Total | 941 (100.0%) | 730 (100.0%) |
Household Vehicle Usage in Ellenville
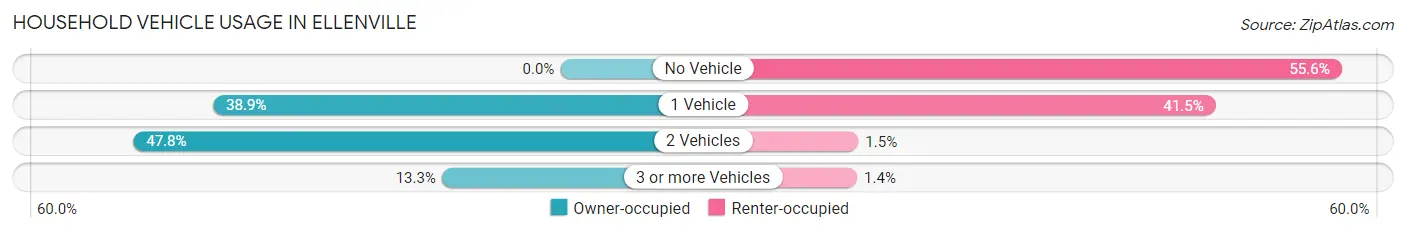
| Vehicles per Household | Owner-occupied | Renter-occupied |
| No Vehicle | 0 (0.0%) | 406 (55.6%) |
| 1 Vehicle | 366 (38.9%) | 303 (41.5%) |
| 2 Vehicles | 450 (47.8%) | 11 (1.5%) |
| 3 or more Vehicles | 125 (13.3%) | 10 (1.4%) |
| Total | 941 (100.0%) | 730 (100.0%) |
Real Estate & Mortgages in Ellenville
Real Estate and Mortgage Overview in Ellenville
| Characteristic | Without Mortgage | With Mortgage |
| Housing Units | 308 | 633 |
| Median Property Value | $163,100 | $177,700 |
| Median Household Income | $120,529 | $115 |
| Monthly Housing Costs | $823 | $0 |
| Real Estate Taxes | $4,419 | $0 |
Property Value by Mortgage Status in Ellenville
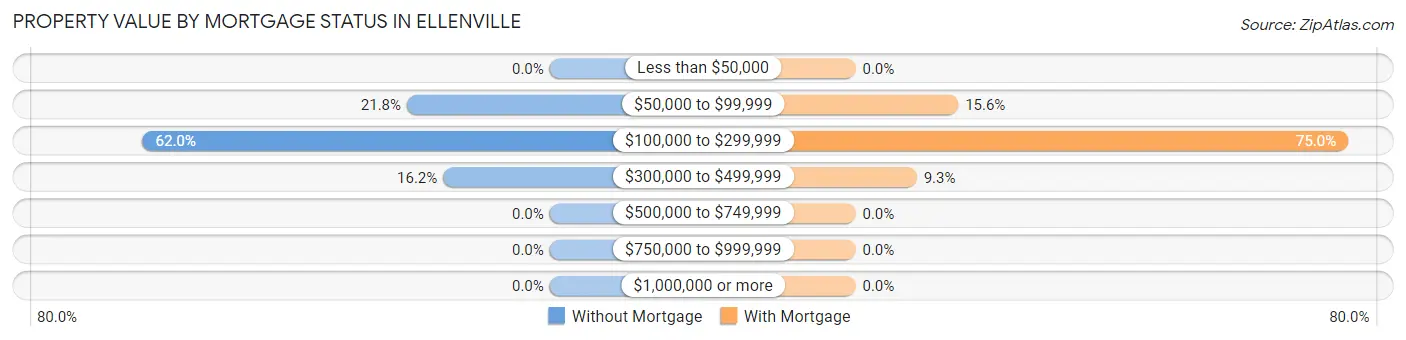
| Property Value | Without Mortgage | With Mortgage |
| Less than $50,000 | 0 (0.0%) | 0 (0.0%) |
| $50,000 to $99,999 | 67 (21.7%) | 99 (15.6%) |
| $100,000 to $299,999 | 191 (62.0%) | 475 (75.0%) |
| $300,000 to $499,999 | 50 (16.2%) | 59 (9.3%) |
| $500,000 to $749,999 | 0 (0.0%) | 0 (0.0%) |
| $750,000 to $999,999 | 0 (0.0%) | 0 (0.0%) |
| $1,000,000 or more | 0 (0.0%) | 0 (0.0%) |
| Total | 308 (100.0%) | 633 (100.0%) |
Household Income by Mortgage Status in Ellenville
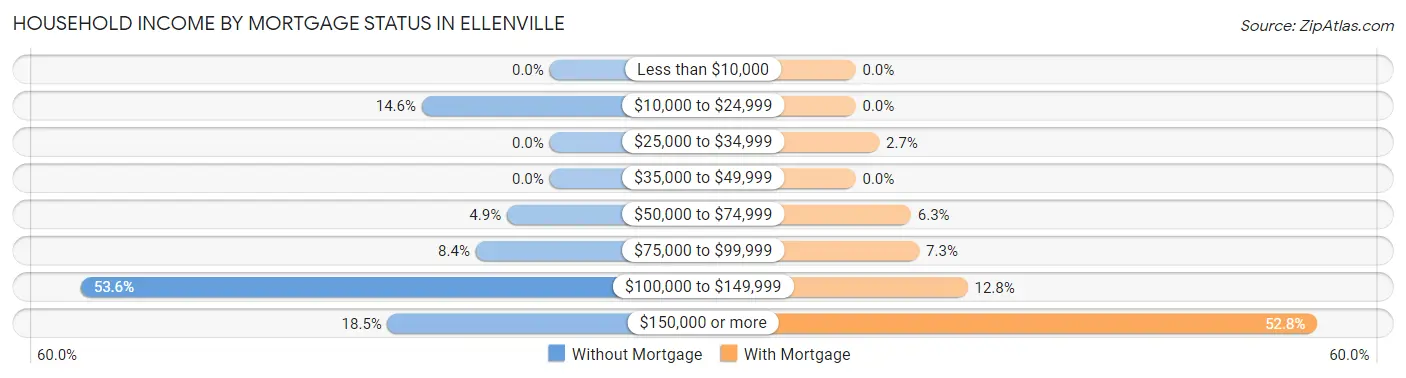
| Household Income | Without Mortgage | With Mortgage |
| Less than $10,000 | 0 (0.0%) | 0 (0.0%) |
| $10,000 to $24,999 | 45 (14.6%) | 0 (0.0%) |
| $25,000 to $34,999 | 0 (0.0%) | 17 (2.7%) |
| $35,000 to $49,999 | 0 (0.0%) | 0 (0.0%) |
| $50,000 to $74,999 | 15 (4.9%) | 40 (6.3%) |
| $75,000 to $99,999 | 26 (8.4%) | 46 (7.3%) |
| $100,000 to $149,999 | 165 (53.6%) | 81 (12.8%) |
| $150,000 or more | 57 (18.5%) | 334 (52.8%) |
| Total | 308 (100.0%) | 633 (100.0%) |
Property Value to Household Income Ratio in Ellenville
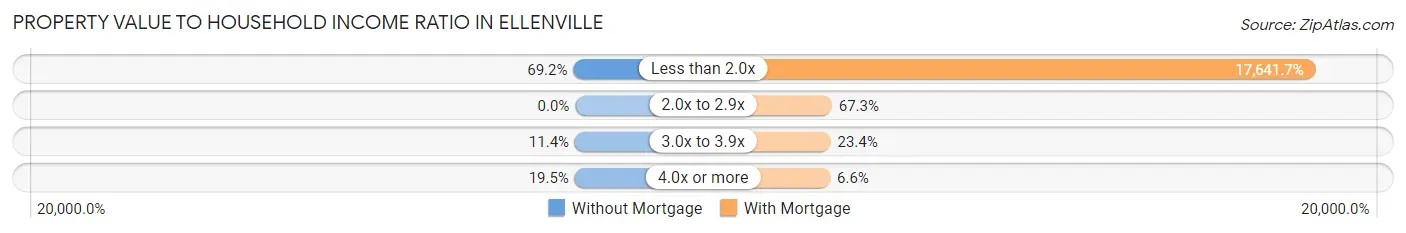
| Value-to-Income Ratio | Without Mortgage | With Mortgage |
| Less than 2.0x | 213 (69.2%) | 111,672 (17,641.7%) |
| 2.0x to 2.9x | 0 (0.0%) | 426 (67.3%) |
| 3.0x to 3.9x | 35 (11.4%) | 148 (23.4%) |
| 4.0x or more | 60 (19.5%) | 42 (6.6%) |
| Total | 308 (100.0%) | 633 (100.0%) |
Real Estate Taxes by Mortgage Status in Ellenville
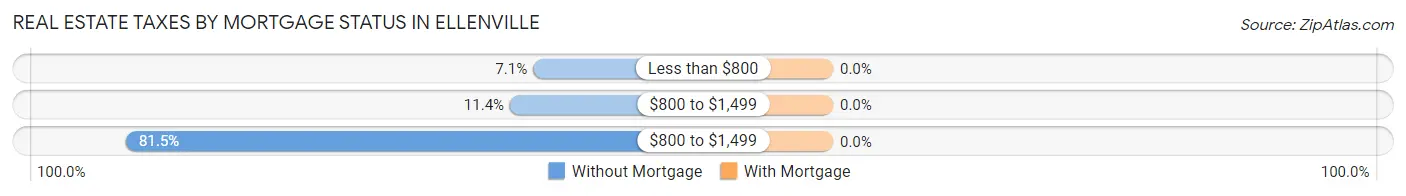
| Property Taxes | Without Mortgage | With Mortgage |
| Less than $800 | 22 (7.1%) | 0 (0.0%) |
| $800 to $1,499 | 35 (11.4%) | 0 (0.0%) |
| $800 to $1,499 | 251 (81.5%) | 0 (0.0%) |
| Total | 308 (100.0%) | 633 (100.0%) |
Health & Disability in Ellenville
Health Insurance Coverage by Age in Ellenville
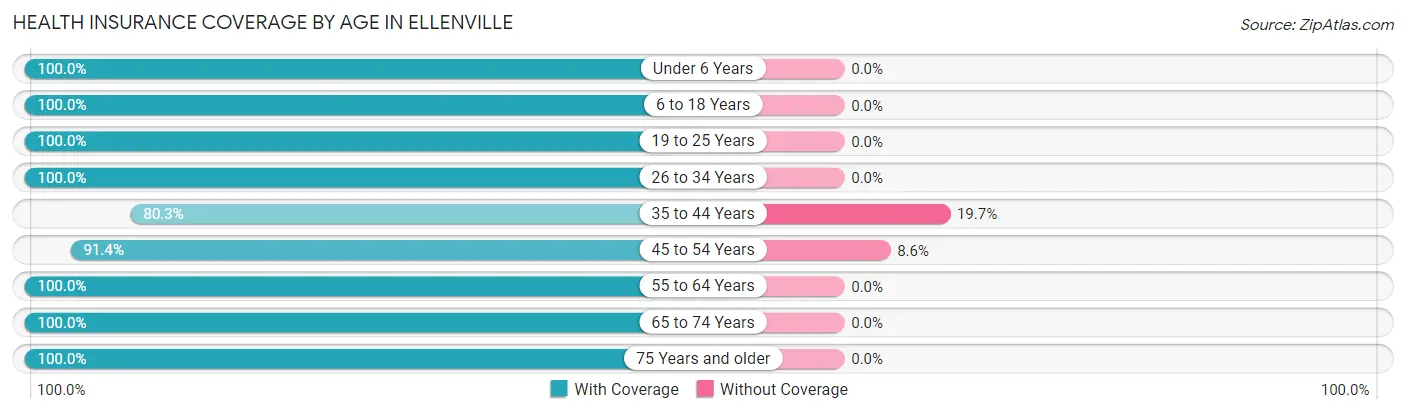
| Age Bracket | With Coverage | Without Coverage |
| Under 6 Years | 106 (100.0%) | 0 (0.0%) |
| 6 to 18 Years | 952 (100.0%) | 0 (0.0%) |
| 19 to 25 Years | 518 (100.0%) | 0 (0.0%) |
| 26 to 34 Years | 328 (100.0%) | 0 (0.0%) |
| 35 to 44 Years | 330 (80.3%) | 81 (19.7%) |
| 45 to 54 Years | 534 (91.4%) | 50 (8.6%) |
| 55 to 64 Years | 579 (100.0%) | 0 (0.0%) |
| 65 to 74 Years | 520 (100.0%) | 0 (0.0%) |
| 75 Years and older | 208 (100.0%) | 0 (0.0%) |
| Total | 4,075 (96.9%) | 131 (3.1%) |
Health Insurance Coverage by Citizenship Status in Ellenville

| Citizenship Status | With Coverage | Without Coverage |
| Native Born | 106 (100.0%) | 0 (0.0%) |
| Foreign Born, Citizen | 952 (100.0%) | 0 (0.0%) |
| Foreign Born, not a Citizen | 518 (100.0%) | 0 (0.0%) |
Health Insurance Coverage by Household Income in Ellenville
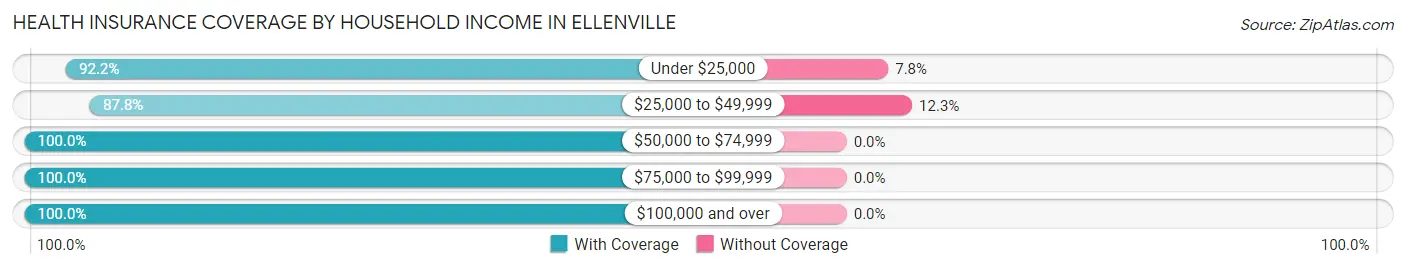
| Household Income | With Coverage | Without Coverage |
| Under $25,000 | 962 (92.2%) | 81 (7.8%) |
| $25,000 to $49,999 | 358 (87.7%) | 50 (12.2%) |
| $50,000 to $74,999 | 253 (100.0%) | 0 (0.0%) |
| $75,000 to $99,999 | 242 (100.0%) | 0 (0.0%) |
| $100,000 and over | 2,189 (100.0%) | 0 (0.0%) |
Public vs Private Health Insurance Coverage by Age in Ellenville
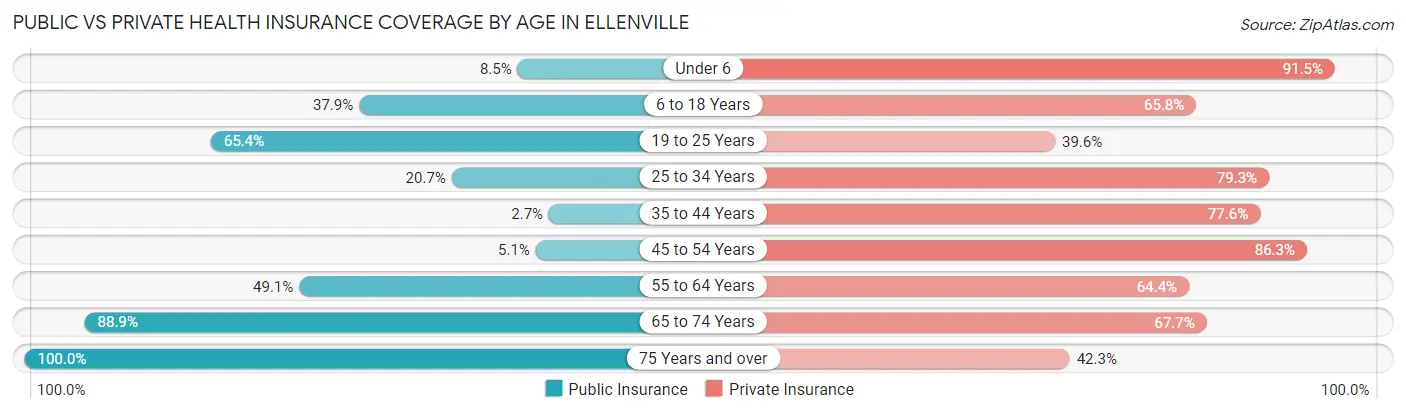
| Age Bracket | Public Insurance | Private Insurance |
| Under 6 | 9 (8.5%) | 97 (91.5%) |
| 6 to 18 Years | 361 (37.9%) | 626 (65.8%) |
| 19 to 25 Years | 339 (65.4%) | 205 (39.6%) |
| 25 to 34 Years | 68 (20.7%) | 260 (79.3%) |
| 35 to 44 Years | 11 (2.7%) | 319 (77.6%) |
| 45 to 54 Years | 30 (5.1%) | 504 (86.3%) |
| 55 to 64 Years | 284 (49.0%) | 373 (64.4%) |
| 65 to 74 Years | 462 (88.8%) | 352 (67.7%) |
| 75 Years and over | 208 (100.0%) | 88 (42.3%) |
| Total | 1,772 (42.1%) | 2,824 (67.1%) |
Disability Status by Sex by Age in Ellenville
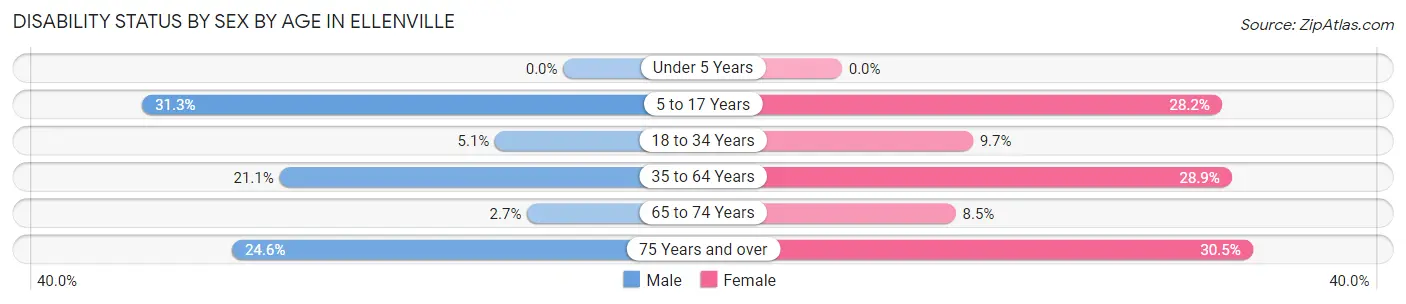
| Age Bracket | Male | Female |
| Under 5 Years | 0 (0.0%) | 0 (0.0%) |
| 5 to 17 Years | 167 (31.3%) | 108 (28.2%) |
| 18 to 34 Years | 30 (5.1%) | 28 (9.7%) |
| 35 to 64 Years | 162 (21.1%) | 233 (28.9%) |
| 65 to 74 Years | 6 (2.7%) | 25 (8.5%) |
| 75 Years and over | 31 (24.6%) | 25 (30.5%) |
Disability Class by Sex by Age in Ellenville
Disability Class: Hearing Difficulty
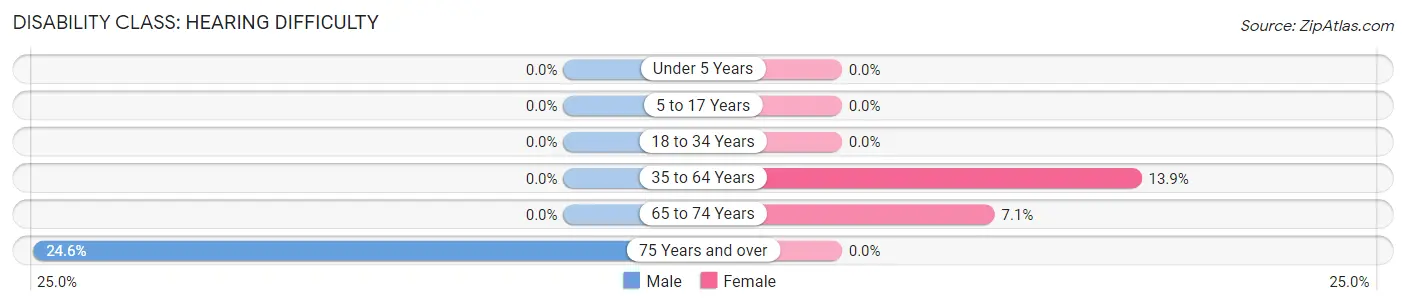
| Age Bracket | Male | Female |
| Under 5 Years | 0 (0.0%) | 0 (0.0%) |
| 5 to 17 Years | 0 (0.0%) | 0 (0.0%) |
| 18 to 34 Years | 0 (0.0%) | 0 (0.0%) |
| 35 to 64 Years | 0 (0.0%) | 112 (13.9%) |
| 65 to 74 Years | 0 (0.0%) | 21 (7.1%) |
| 75 Years and over | 31 (24.6%) | 0 (0.0%) |
Disability Class: Vision Difficulty
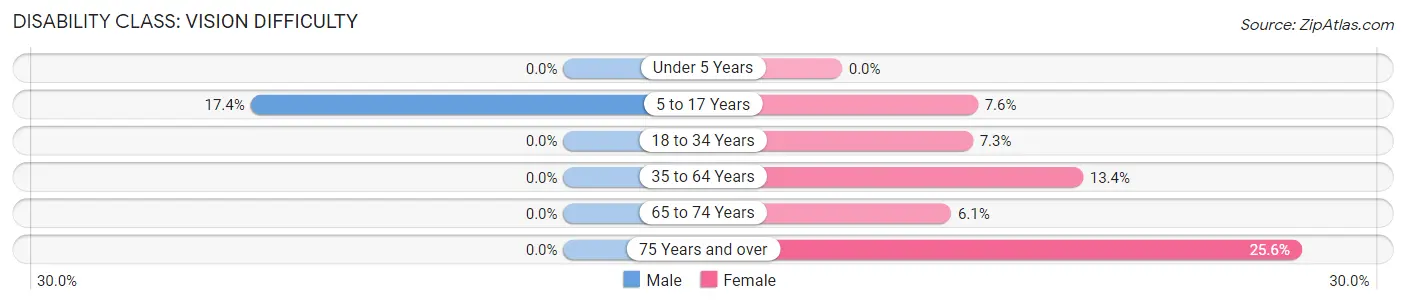
| Age Bracket | Male | Female |
| Under 5 Years | 0 (0.0%) | 0 (0.0%) |
| 5 to 17 Years | 93 (17.4%) | 29 (7.6%) |
| 18 to 34 Years | 0 (0.0%) | 21 (7.3%) |
| 35 to 64 Years | 0 (0.0%) | 108 (13.4%) |
| 65 to 74 Years | 0 (0.0%) | 18 (6.1%) |
| 75 Years and over | 0 (0.0%) | 21 (25.6%) |
Disability Class: Cognitive Difficulty
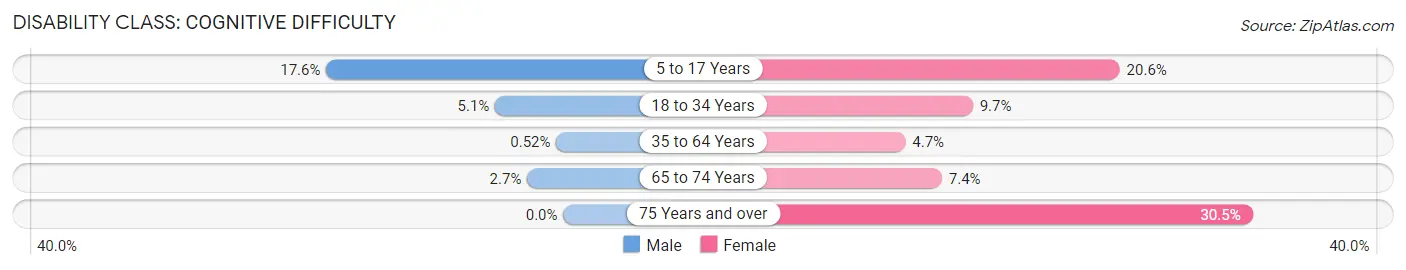
| Age Bracket | Male | Female |
| 5 to 17 Years | 94 (17.6%) | 79 (20.6%) |
| 18 to 34 Years | 30 (5.1%) | 28 (9.7%) |
| 35 to 64 Years | 4 (0.5%) | 38 (4.7%) |
| 65 to 74 Years | 6 (2.7%) | 22 (7.4%) |
| 75 Years and over | 0 (0.0%) | 25 (30.5%) |
Disability Class: Ambulatory Difficulty
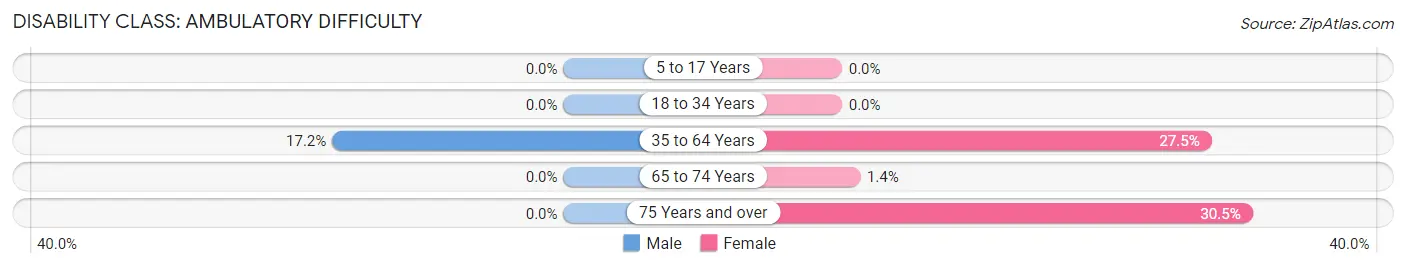
| Age Bracket | Male | Female |
| 5 to 17 Years | 0 (0.0%) | 0 (0.0%) |
| 18 to 34 Years | 0 (0.0%) | 0 (0.0%) |
| 35 to 64 Years | 132 (17.2%) | 221 (27.5%) |
| 65 to 74 Years | 0 (0.0%) | 4 (1.3%) |
| 75 Years and over | 0 (0.0%) | 25 (30.5%) |
Disability Class: Self-Care Difficulty
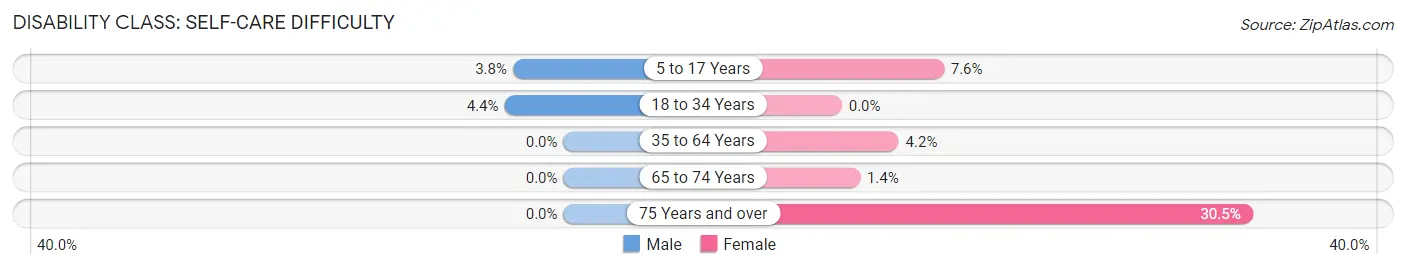
| Age Bracket | Male | Female |
| 5 to 17 Years | 20 (3.7%) | 29 (7.6%) |
| 18 to 34 Years | 26 (4.4%) | 0 (0.0%) |
| 35 to 64 Years | 0 (0.0%) | 34 (4.2%) |
| 65 to 74 Years | 0 (0.0%) | 4 (1.3%) |
| 75 Years and over | 0 (0.0%) | 25 (30.5%) |
Technology Access in Ellenville
Computing Device Access in Ellenville
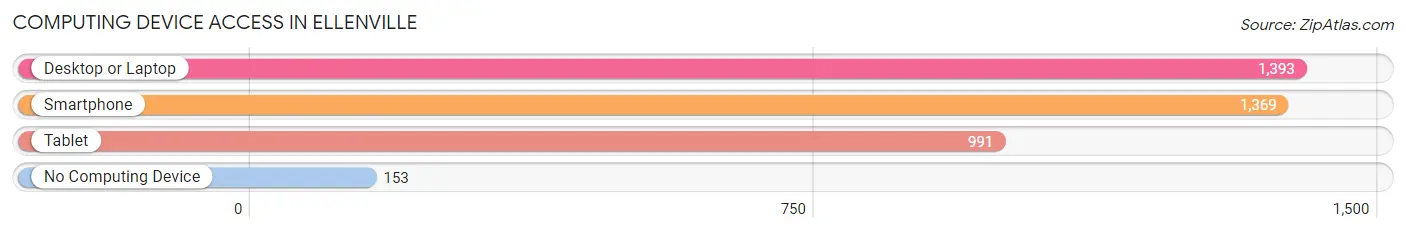
| Device Type | # Households | % Households |
| Desktop or Laptop | 1,393 | 83.4% |
| Smartphone | 1,369 | 81.9% |
| Tablet | 991 | 59.3% |
| No Computing Device | 153 | 9.2% |
| Total | 1,671 | 100.0% |
Internet Access in Ellenville
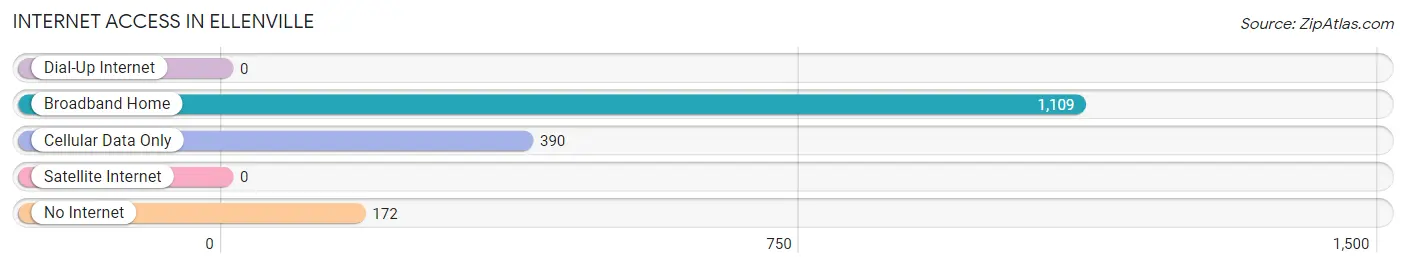
| Internet Type | # Households | % Households |
| Dial-Up Internet | 0 | 0.0% |
| Broadband Home | 1,109 | 66.4% |
| Cellular Data Only | 390 | 23.3% |
| Satellite Internet | 0 | 0.0% |
| No Internet | 172 | 10.3% |
| Total | 1,671 | 100.0% |
Ellenville Summary
Ellenville is a village located in Ulster County, New York, United States. It is situated in the foothills of the Shawangunk Mountains, about 70 miles north of New York City. The village is part of the Town of Wawarsing and is the largest village in the town. As of the 2010 census, the village had a population of 4,135.
History
The area that is now Ellenville was originally inhabited by the Lenape Native Americans. The first European settlers arrived in the area in the late 17th century. The village was first known as "Mountainville" and was later renamed "Ellenville" in honor of the wife of the first postmaster, Ellen Hasbrouck.
The village was officially incorporated in 1858. During the 19th century, Ellenville was a popular resort destination for wealthy New Yorkers. The village was home to several grand hotels, including the Ellenville House, the Grand Union Hotel, and the Ellenville Hotel.
In the early 20th century, Ellenville was a major center for the production of hats. The village was home to several hat factories, including the Ellenville Hat Company, the Ellenville Felt Hat Company, and the Ellenville Hat Works. The hat industry declined in the mid-20th century, and the last hat factory closed in the 1970s.
Geography
Ellenville is located at 41°45'N 74°25'W (41.75, -74.42). The village is situated in the foothills of the Shawangunk Mountains, about 70 miles north of New York City. The village is part of the Town of Wawarsing and is the largest village in the town.
According to the United States Census Bureau, the village has a total area of 2.2 square miles, all of it land. Ellenville is located near the junction of the Rondout Creek and the Wallkill River.
Economy
Ellenville's economy is largely based on tourism and manufacturing. The village is home to several tourist attractions, including the Shadowland Stages theater, the Ellenville Public Library and Museum, and the Ellenville Regional Hospital.
The village is also home to several manufacturing companies, including the Ellenville Manufacturing Company, the Ellenville Plastics Corporation, and the Ellenville Textile Company.
Demographics
As of the 2010 census, there were 4,135 people, 1,717 households, and 1,039 families residing in the village. The population density was 1,876.2 people per square mile. There were 1,902 housing units at an average density of 860.9 per square mile. The racial makeup of the village was 79.2% White, 11.2% African American, 0.3% Native American, 0.7% Asian, 0.1% Pacific Islander, 5.7% from other races, and 2.8% from two or more races. Hispanic or Latino of any race were 16.2% of the population.
There were 1,717 households, out of which 28.2% had children under the age of 18 living with them, 38.2% were married couples living together, 17.2% had a female householder with no husband present, and 37.2% were non-families. 30.7% of all households were made up of individuals, and 13.2% had someone living alone who was 65 years of age or older. The average household size was 2.40 and the average family size was 2.97.
In the village, the population was spread out, with 24.2% under the age of 18, 8.2% from 18 to 24, 28.2% from 25 to 44, 22.7% from 45 to 64, and 16.7% who were 65 years of age or older. The median age was 38 years. For every 100 females, there were 91.2 males. For every 100 females age 18 and over, there were 87.2 males.
The median income for a household in the village was $31,964, and the median income for a family was $37,917. Males had a median income of $30,938 versus $25,000 for females. The per capita income for the village was $17,845. About 14.2% of families and 17.2% of the population were below the poverty line, including 24.2% of those under age 18 and 11.2% of those age 65 or over.
Common Questions
What is Per Capita Income in Ellenville?
Per Capita income in Ellenville is $33,275.
What is the Median Family Income in Ellenville?
Median Family Income in Ellenville is $105,065.
What is the Median Household income in Ellenville?
Median Household Income in Ellenville is $77,125.
What is Income or Wage Gap in Ellenville?
Income or Wage Gap in Ellenville is 49.7%.
Women in Ellenville earn 50.3 cents for every dollar earned by a man.
What is Inequality or Gini Index in Ellenville?
Inequality or Gini Index in Ellenville is 0.42.
What is the Total Population of Ellenville?
Total Population of Ellenville is 4,213.
What is the Total Male Population of Ellenville?
Total Male Population of Ellenville is 2,332.
What is the Total Female Population of Ellenville?
Total Female Population of Ellenville is 1,881.
What is the Ratio of Males per 100 Females in Ellenville?
There are 123.98 Males per 100 Females in Ellenville.
What is the Ratio of Females per 100 Males in Ellenville?
There are 80.66 Females per 100 Males in Ellenville.
What is the Median Population Age in Ellenville?
Median Population Age in Ellenville is 38.9 Years.
What is the Average Family Size in Ellenville
Average Family Size in Ellenville is 3.5 People.
What is the Average Household Size in Ellenville
Average Household Size in Ellenville is 2.5 People.
How Large is the Labor Force in Ellenville?
There are 1,697 People in the Labor Forcein in Ellenville.
What is the Percentage of People in the Labor Force in Ellenville?
50.7% of People are in the Labor Force in Ellenville.
What is the Unemployment Rate in Ellenville?
Unemployment Rate in Ellenville is 0.6%.