Ulster County, NY Map & Demographics
Ulster County Map
Ulster County Overview
$43,168
PER CAPITA INCOME
$104,189
AVG FAMILY INCOME
$77,197
AVG HOUSEHOLD INCOME
27.4%
WAGE / INCOME GAP [ % ]
72.6¢/ $1
WAGE / INCOME GAP [ $ ]
$12,347
FAMILY INCOME DEFICIT
0.48
INEQUALITY / GINI INDEX
182,153
TOTAL POPULATION
90,973
MALE POPULATION
91,180
FEMALE POPULATION
99.77
MALES / 100 FEMALES
100.23
FEMALES / 100 MALES
44.2
MEDIAN AGE
3.0
AVG FAMILY SIZE
2.3
AVG HOUSEHOLD SIZE
91,120
LABOR FORCE [ PEOPLE ]
58.9%
PERCENT IN LABOR FORCE
5.1%
UNEMPLOYMENT RATE
Income in Ulster County
Income Overview in Ulster County
Per Capita Income in Ulster County is $43,168, while median incomes of families and households are $104,189 and $77,197 respectively.
| Characteristic | Number | Measure |
| Per Capita Income | 182,153 | $43,168 |
| Median Family Income | 42,609 | $104,189 |
| Mean Family Income | 42,609 | $131,125 |
| Median Household Income | 72,265 | $77,197 |
| Mean Household Income | 72,265 | $106,932 |
| Income Deficit | 42,609 | $12,347 |
| Wage / Income Gap (%) | 182,153 | 27.37% |
| Wage / Income Gap ($) | 182,153 | 72.63¢ per $1 |
| Gini / Inequality Index | 182,153 | 0.48 |
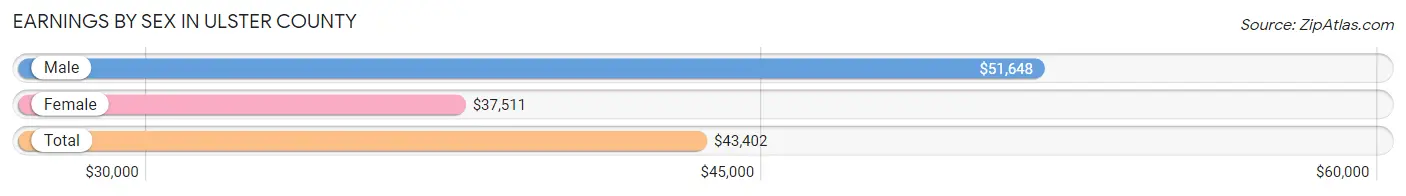
Earnings by Sex in Ulster County
Average Earnings in Ulster County are $43,402, $51,648 for men and $37,511 for women, a difference of 27.4%.
| Sex | Number | Average Earnings |
| Male | 48,926 (50.4%) | $51,648 |
| Female | 48,053 (49.5%) | $37,511 |
| Total | 96,979 (100.0%) | $43,402 |
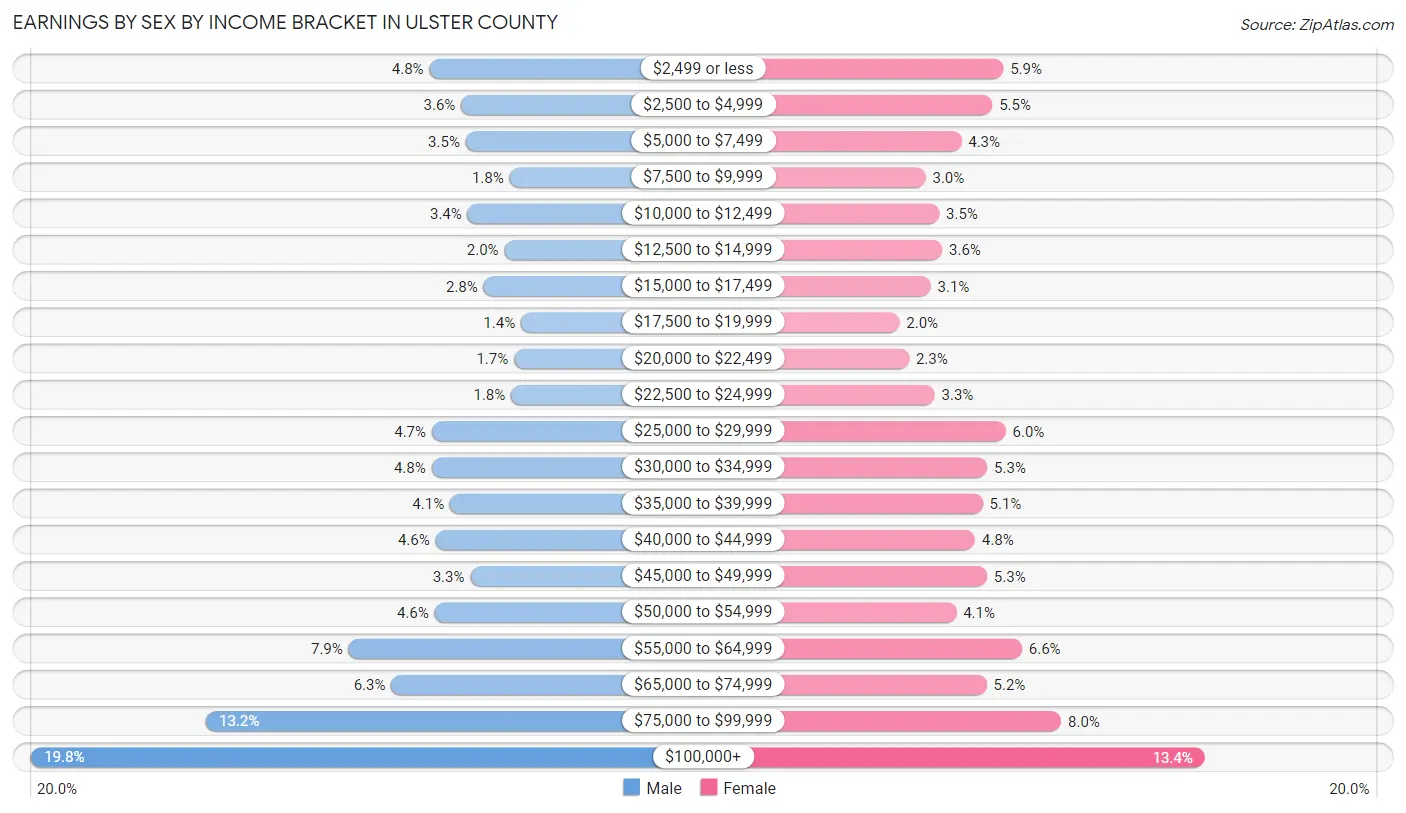
Earnings by Sex by Income Bracket in Ulster County
The most common earnings brackets in Ulster County are $100,000+ for men (9,665 | 19.8%) and $100,000+ for women (6,443 | 13.4%).
| Income | Male | Female |
| $2,499 or less | 2,361 (4.8%) | 2,815 (5.9%) |
| $2,500 to $4,999 | 1,783 (3.6%) | 2,617 (5.4%) |
| $5,000 to $7,499 | 1,697 (3.5%) | 2,061 (4.3%) |
| $7,500 to $9,999 | 897 (1.8%) | 1,419 (2.9%) |
| $10,000 to $12,499 | 1,665 (3.4%) | 1,663 (3.5%) |
| $12,500 to $14,999 | 988 (2.0%) | 1,715 (3.6%) |
| $15,000 to $17,499 | 1,371 (2.8%) | 1,511 (3.1%) |
| $17,500 to $19,999 | 687 (1.4%) | 949 (2.0%) |
| $20,000 to $22,499 | 812 (1.7%) | 1,119 (2.3%) |
| $22,500 to $24,999 | 867 (1.8%) | 1,582 (3.3%) |
| $25,000 to $29,999 | 2,321 (4.7%) | 2,858 (5.9%) |
| $30,000 to $34,999 | 2,322 (4.8%) | 2,529 (5.3%) |
| $35,000 to $39,999 | 1,984 (4.1%) | 2,445 (5.1%) |
| $40,000 to $44,999 | 2,249 (4.6%) | 2,305 (4.8%) |
| $45,000 to $49,999 | 1,617 (3.3%) | 2,524 (5.2%) |
| $50,000 to $54,999 | 2,269 (4.6%) | 1,969 (4.1%) |
| $55,000 to $64,999 | 3,848 (7.9%) | 3,151 (6.6%) |
| $65,000 to $74,999 | 3,064 (6.3%) | 2,518 (5.2%) |
| $75,000 to $99,999 | 6,459 (13.2%) | 3,860 (8.0%) |
| $100,000+ | 9,665 (19.8%) | 6,443 (13.4%) |
| Total | 48,926 (100.0%) | 48,053 (100.0%) |
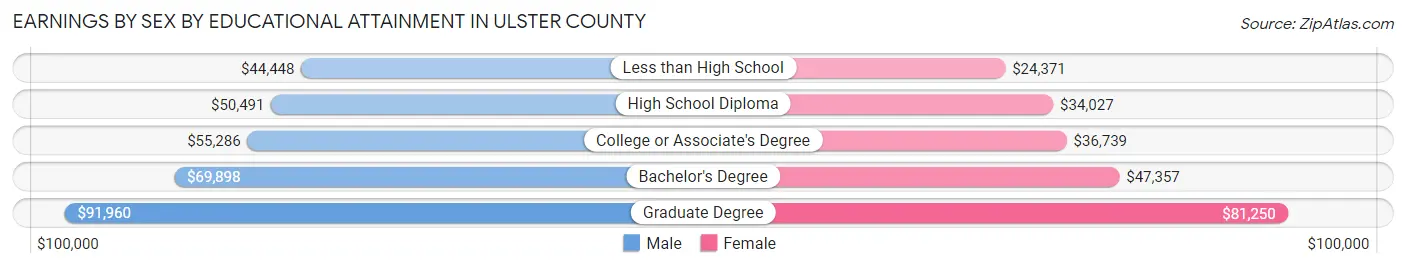
Earnings by Sex by Educational Attainment in Ulster County
Average earnings in Ulster County are $58,090 for men and $44,221 for women, a difference of 23.9%. Men with an educational attainment of graduate degree enjoy the highest average annual earnings of $91,960, while those with less than high school education earn the least with $44,448. Women with an educational attainment of graduate degree earn the most with the average annual earnings of $81,250, while those with less than high school education have the smallest earnings of $24,371.
| Educational Attainment | Male Income | Female Income |
| Less than High School | $44,448 | $24,371 |
| High School Diploma | $50,491 | $34,027 |
| College or Associate's Degree | $55,286 | $36,739 |
| Bachelor's Degree | $69,898 | $47,357 |
| Graduate Degree | $91,960 | $81,250 |
| Total | $58,090 | $44,221 |
Family Income in Ulster County
Family Income Brackets in Ulster County
According to the Ulster County family income data, there are 9,672 families falling into the $100,000 to $149,999 income range, which is the most common income bracket and makes up 22.7% of all families. Conversely, the $10,000 to $14,999 income bracket is the least frequent group with only 639 families (1.5%) belonging to this category.
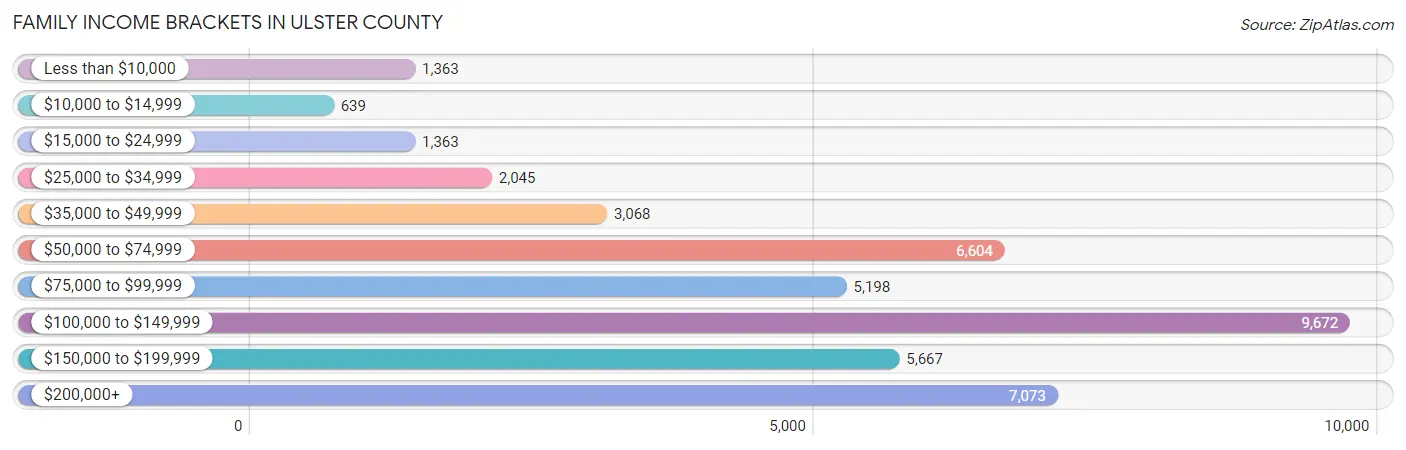
| Income Bracket | # Families | % Families |
| Less than $10,000 | 1,363 | 3.2% |
| $10,000 to $14,999 | 639 | 1.5% |
| $15,000 to $24,999 | 1,363 | 3.2% |
| $25,000 to $34,999 | 2,045 | 4.8% |
| $35,000 to $49,999 | 3,068 | 7.2% |
| $50,000 to $74,999 | 6,604 | 15.5% |
| $75,000 to $99,999 | 5,198 | 12.2% |
| $100,000 to $149,999 | 9,672 | 22.7% |
| $150,000 to $199,999 | 5,667 | 13.3% |
| $200,000+ | 7,073 | 16.6% |
Family Income by Famaliy Size in Ulster County
7+ person families (471 | 1.1%) account for the highest median family income in Ulster County with $190,133 per family, while 2-person families (21,807 | 51.2%) have the highest median income of $45,570 per family member.
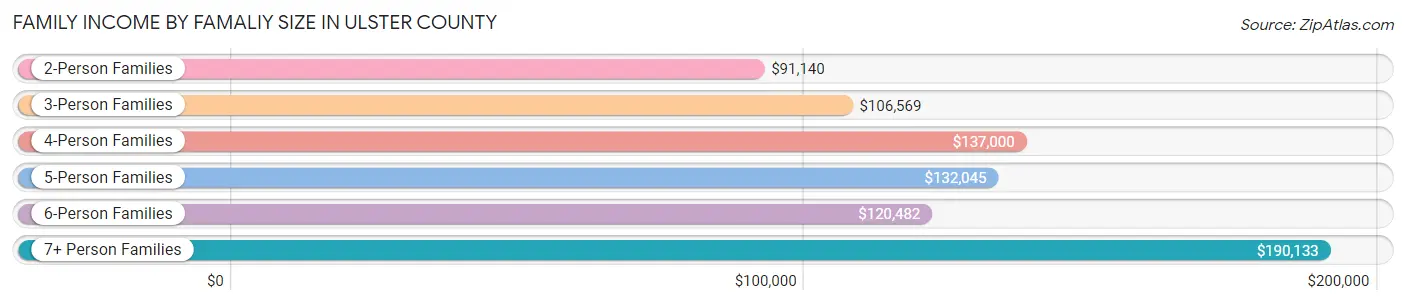
| Income Bracket | # Families | Median Income |
| 2-Person Families | 21,807 (51.2%) | $91,140 |
| 3-Person Families | 10,651 (25.0%) | $106,569 |
| 4-Person Families | 6,468 (15.2%) | $137,000 |
| 5-Person Families | 2,456 (5.8%) | $132,045 |
| 6-Person Families | 756 (1.8%) | $120,482 |
| 7+ Person Families | 471 (1.1%) | $190,133 |
| Total | 42,609 (100.0%) | $104,189 |
Family Income by Number of Earners in Ulster County
The median family income in Ulster County is $104,189, with families comprising 3+ earners (5,014) having the highest median family income of $155,460, while families with no earners (6,486) have the lowest median family income of $50,152, accounting for 11.8% and 15.2% of families, respectively.
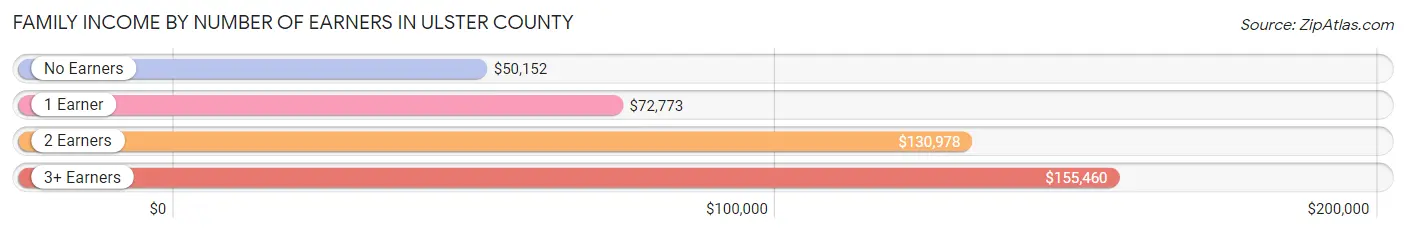
| Number of Earners | # Families | Median Income |
| No Earners | 6,486 (15.2%) | $50,152 |
| 1 Earner | 12,946 (30.4%) | $72,773 |
| 2 Earners | 18,163 (42.6%) | $130,978 |
| 3+ Earners | 5,014 (11.8%) | $155,460 |
| Total | 42,609 (100.0%) | $104,189 |
Household Income in Ulster County
Household Income Brackets in Ulster County
With 13,080 households falling in the category, the $100,000 to $149,999 income range is the most frequent in Ulster County, accounting for 18.1% of all households. In contrast, only 2,963 households (4.1%) fall into the $10,000 to $14,999 income bracket, making it the least populous group.
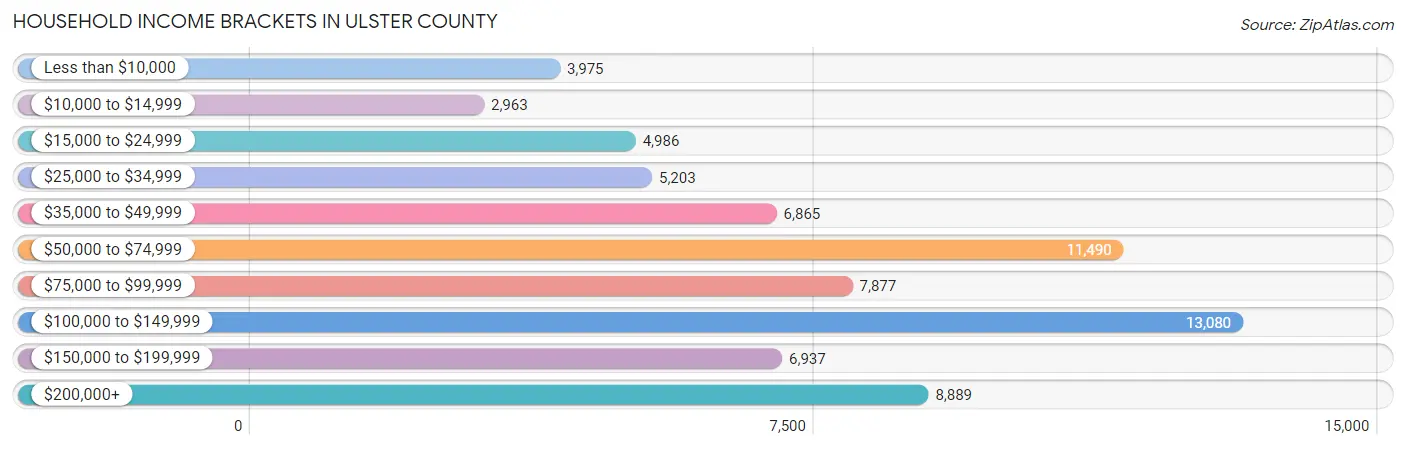
| Income Bracket | # Households | % Households |
| Less than $10,000 | 3,975 | 5.5% |
| $10,000 to $14,999 | 2,963 | 4.1% |
| $15,000 to $24,999 | 4,986 | 6.9% |
| $25,000 to $34,999 | 5,203 | 7.2% |
| $35,000 to $49,999 | 6,865 | 9.5% |
| $50,000 to $74,999 | 11,490 | 15.9% |
| $75,000 to $99,999 | 7,877 | 10.9% |
| $100,000 to $149,999 | 13,080 | 18.1% |
| $150,000 to $199,999 | 6,937 | 9.6% |
| $200,000+ | 8,889 | 12.3% |
Household Income by Householder Age in Ulster County
The median household income in Ulster County is $77,197, with the highest median household income of $98,466 found in the 25 to 44 years age bracket for the primary householder. A total of 18,032 households (24.9%) fall into this category. Meanwhile, the 15 to 24 years age bracket for the primary householder has the lowest median household income of $31,899, with 2,027 households (2.8%) in this group.
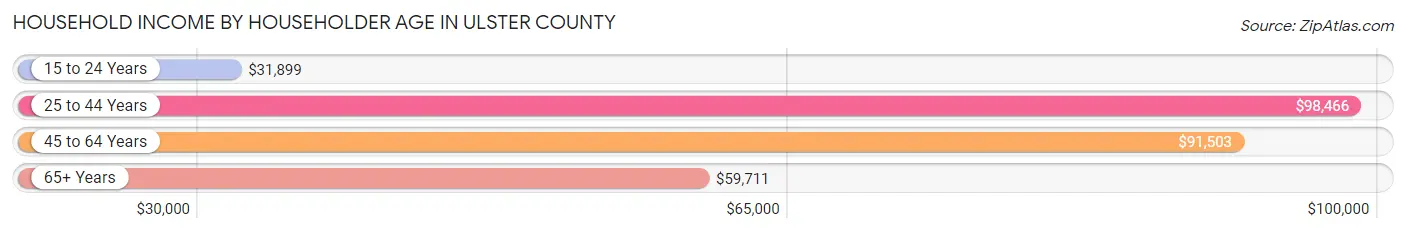
| Income Bracket | # Households | Median Income |
| 15 to 24 Years | 2,027 (2.8%) | $31,899 |
| 25 to 44 Years | 18,032 (24.9%) | $98,466 |
| 45 to 64 Years | 28,970 (40.1%) | $91,503 |
| 65+ Years | 23,236 (32.2%) | $59,711 |
| Total | 72,265 (100.0%) | $77,197 |
Poverty in Ulster County
Income Below Poverty by Sex and Age in Ulster County
With 14.3% poverty level for males and 15.1% for females among the residents of Ulster County, 5 year old males and 18 to 24 year old females are the most vulnerable to poverty, with 189 males (27.1%) and 2,037 females (30.9%) in their respective age groups living below the poverty level.
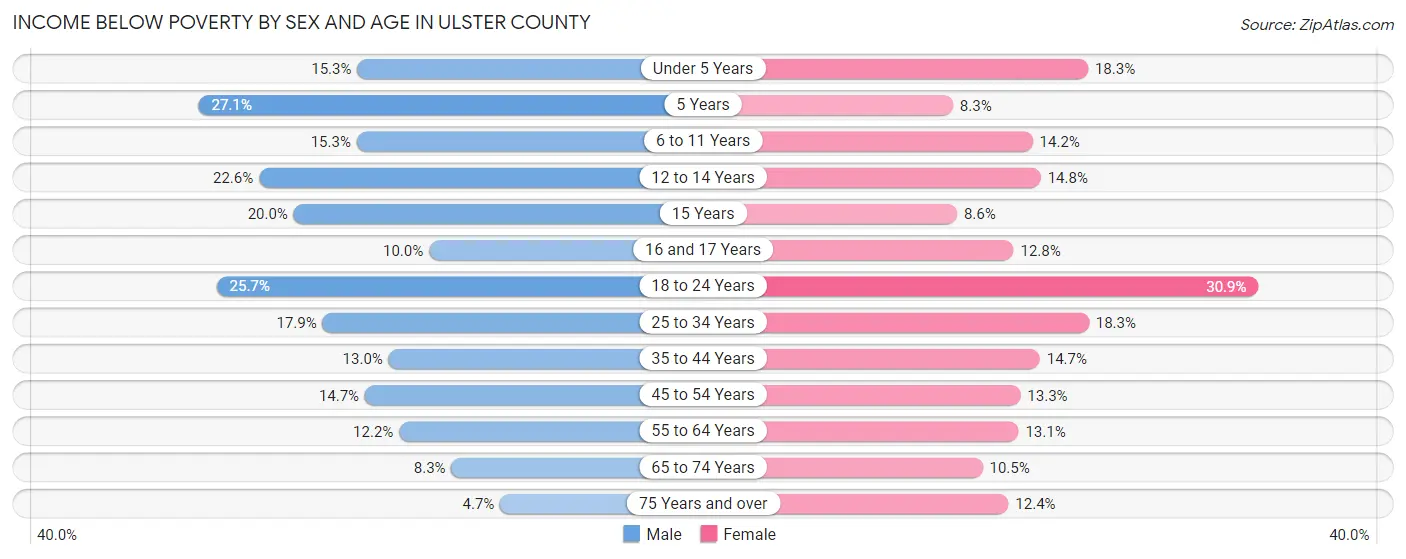
| Age Bracket | Male | Female |
| Under 5 Years | 603 (15.3%) | 651 (18.3%) |
| 5 Years | 189 (27.1%) | 96 (8.3%) |
| 6 to 11 Years | 806 (15.3%) | 683 (14.2%) |
| 12 to 14 Years | 636 (22.6%) | 356 (14.8%) |
| 15 Years | 218 (20.0%) | 65 (8.6%) |
| 16 and 17 Years | 184 (10.0%) | 276 (12.8%) |
| 18 to 24 Years | 1,845 (25.7%) | 2,037 (30.9%) |
| 25 to 34 Years | 2,034 (17.9%) | 1,986 (18.3%) |
| 35 to 44 Years | 1,346 (13.0%) | 1,536 (14.7%) |
| 45 to 54 Years | 1,759 (14.7%) | 1,540 (13.3%) |
| 55 to 64 Years | 1,672 (12.2%) | 1,844 (13.1%) |
| 65 to 74 Years | 861 (8.3%) | 1,189 (10.4%) |
| 75 Years and over | 292 (4.7%) | 1,036 (12.4%) |
| Total | 12,445 (14.3%) | 13,295 (15.1%) |
Income Above Poverty by Sex and Age in Ulster County
According to the poverty statistics in Ulster County, males aged 75 years and over and females aged 5 years are the age groups that are most secure financially, with 95.3% of males and 91.7% of females in these age groups living above the poverty line.
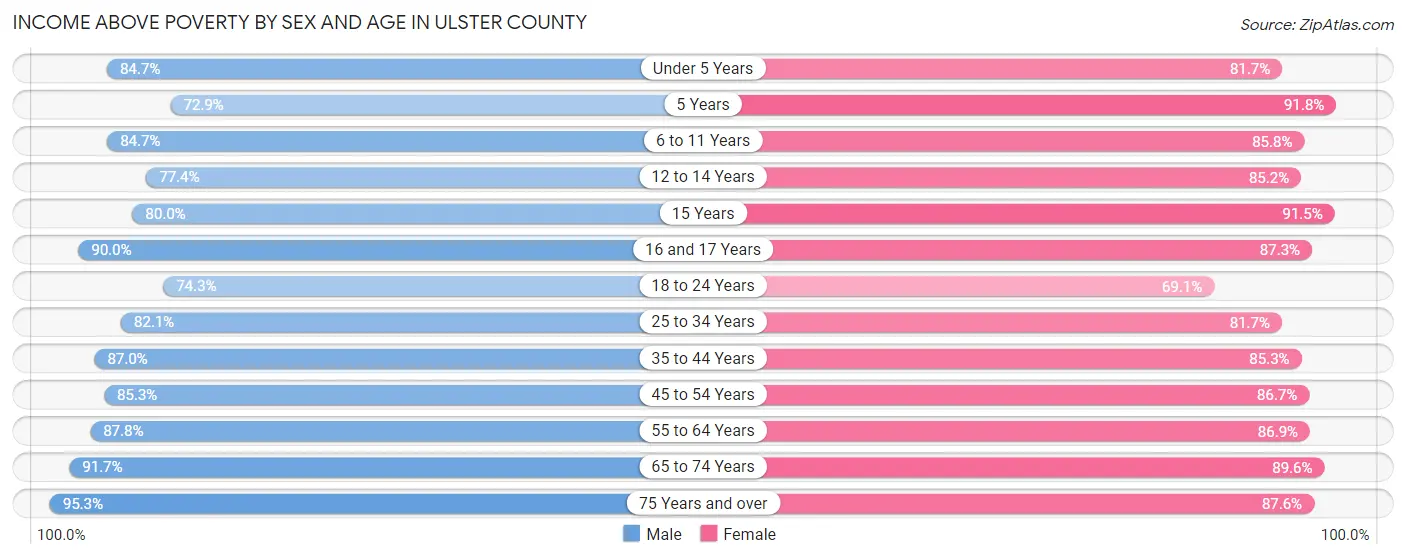
| Age Bracket | Male | Female |
| Under 5 Years | 3,338 (84.7%) | 2,911 (81.7%) |
| 5 Years | 509 (72.9%) | 1,067 (91.7%) |
| 6 to 11 Years | 4,449 (84.7%) | 4,136 (85.8%) |
| 12 to 14 Years | 2,180 (77.4%) | 2,055 (85.2%) |
| 15 Years | 871 (80.0%) | 695 (91.4%) |
| 16 and 17 Years | 1,662 (90.0%) | 1,889 (87.3%) |
| 18 to 24 Years | 5,322 (74.3%) | 4,550 (69.1%) |
| 25 to 34 Years | 9,340 (82.1%) | 8,843 (81.7%) |
| 35 to 44 Years | 9,031 (87.0%) | 8,910 (85.3%) |
| 45 to 54 Years | 10,185 (85.3%) | 10,077 (86.7%) |
| 55 to 64 Years | 12,048 (87.8%) | 12,209 (86.9%) |
| 65 to 74 Years | 9,499 (91.7%) | 10,188 (89.5%) |
| 75 Years and over | 5,931 (95.3%) | 7,342 (87.6%) |
| Total | 74,365 (85.7%) | 74,872 (84.9%) |
Income Below Poverty Among Married-Couple Families in Ulster County
The poverty statistics for married-couple families in Ulster County show that 3.9% or 1,216 of the total 31,483 families live below the poverty line. Families with 3 or 4 children have the highest poverty rate of 15.7%, comprising of 236 families. On the other hand, families with no children have the lowest poverty rate of 2.5%, which includes 537 families.
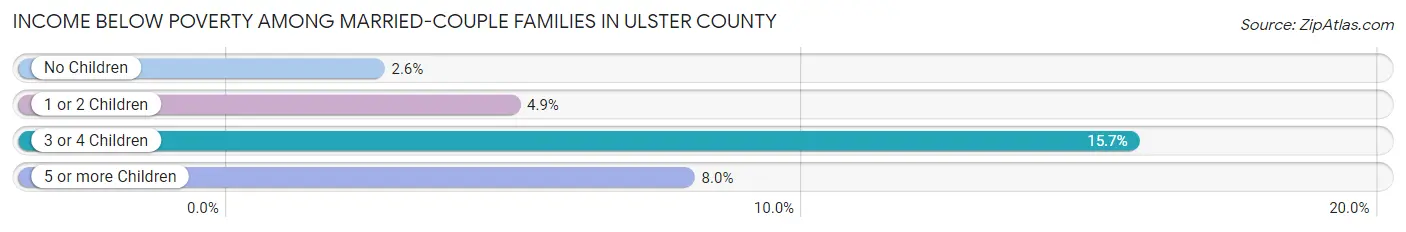
| Children | Above Poverty | Below Poverty |
| No Children | 20,516 (97.5%) | 537 (2.5%) |
| 1 or 2 Children | 8,344 (95.1%) | 431 (4.9%) |
| 3 or 4 Children | 1,268 (84.3%) | 236 (15.7%) |
| 5 or more Children | 139 (92.0%) | 12 (8.0%) |
| Total | 30,267 (96.1%) | 1,216 (3.9%) |
Income Below Poverty Among Single-Parent Households in Ulster County
According to the poverty data in Ulster County, 5.0% or 183 single-father households and 21.7% or 1,620 single-mother households are living below the poverty line. Among single-father households, those with 3 or 4 children have the highest poverty rate, with 39 households (54.2%) experiencing poverty. Likewise, among single-mother households, those with 5 or more children have the highest poverty rate, with 38 households (100.0%) falling below the poverty line.
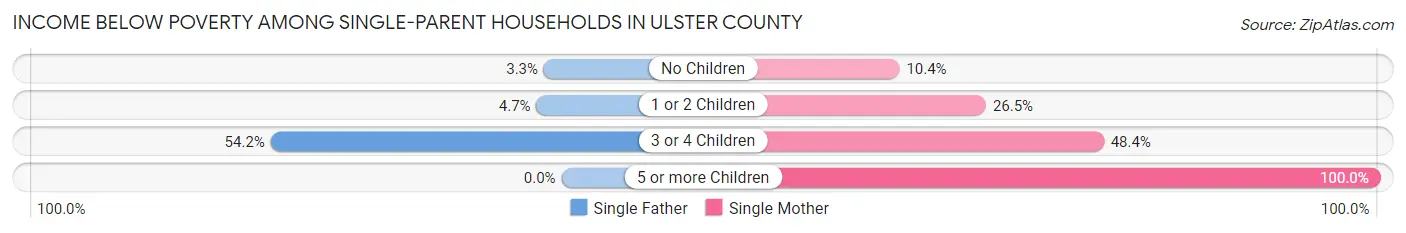
| Children | Single Father | Single Mother |
| No Children | 55 (3.3%) | 332 (10.4%) |
| 1 or 2 Children | 89 (4.7%) | 972 (26.5%) |
| 3 or 4 Children | 39 (54.2%) | 278 (48.4%) |
| 5 or more Children | 0 (0.0%) | 38 (100.0%) |
| Total | 183 (5.0%) | 1,620 (21.7%) |
Income Below Poverty Among Married-Couple vs Single-Parent Households in Ulster County
The poverty data for Ulster County shows that 1,216 of the married-couple family households (3.9%) and 1,803 of the single-parent households (16.2%) are living below the poverty level. Within the married-couple family households, those with 3 or 4 children have the highest poverty rate, with 236 households (15.7%) falling below the poverty line. Among the single-parent households, those with 5 or more children have the highest poverty rate, with 38 household (100.0%) living below poverty.
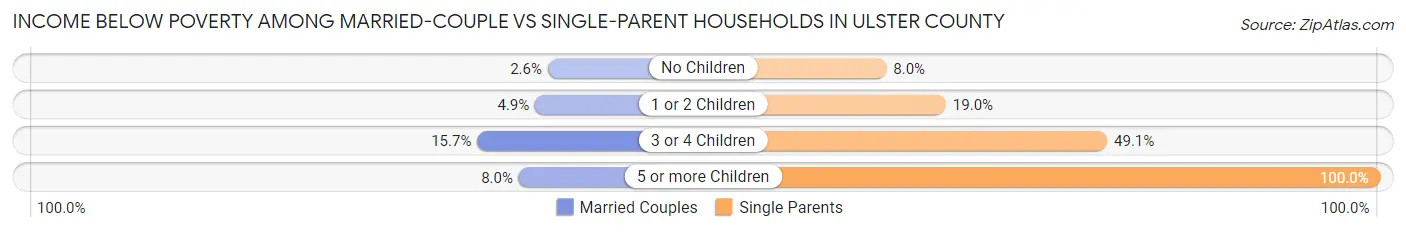
| Children | Married-Couple Families | Single-Parent Households |
| No Children | 537 (2.5%) | 387 (8.0%) |
| 1 or 2 Children | 431 (4.9%) | 1,061 (19.0%) |
| 3 or 4 Children | 236 (15.7%) | 317 (49.1%) |
| 5 or more Children | 12 (8.0%) | 38 (100.0%) |
| Total | 1,216 (3.9%) | 1,803 (16.2%) |
Race in Ulster County
The most populous races in Ulster County are White / Caucasian (142,478 | 78.2%), Hispanic or Latino (20,154 | 11.1%), and Two or more Races (17,654 | 9.7%).
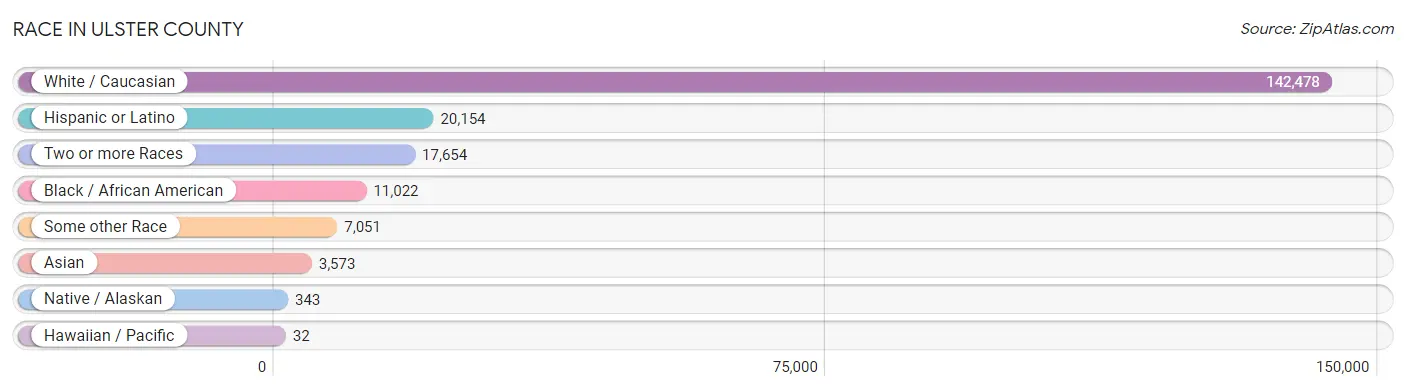
| Race | # Population | % Population |
| Asian | 3,573 | 2.0% |
| Black / African American | 11,022 | 6.0% |
| Hawaiian / Pacific | 32 | 0.0% |
| Hispanic or Latino | 20,154 | 11.1% |
| Native / Alaskan | 343 | 0.2% |
| White / Caucasian | 142,478 | 78.2% |
| Two or more Races | 17,654 | 9.7% |
| Some other Race | 7,051 | 3.9% |
| Total | 182,153 | 100.0% |
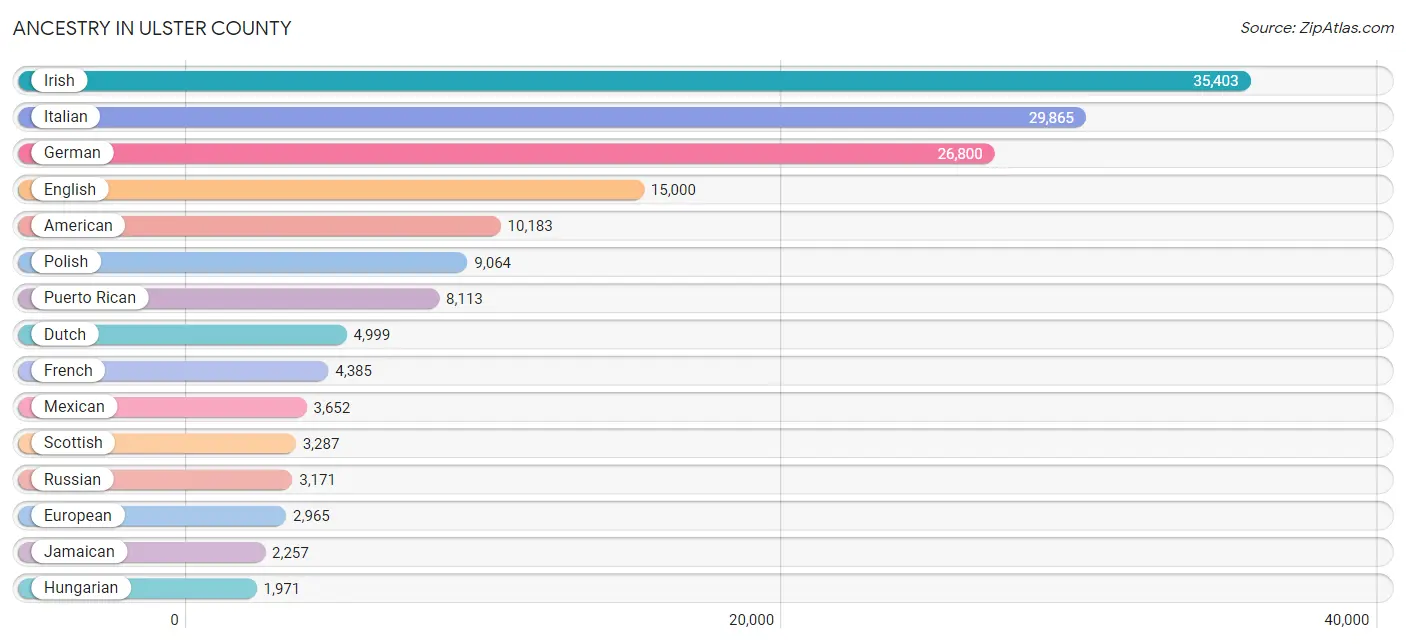
Ancestry in Ulster County
The most populous ancestries reported in Ulster County are Irish (35,403 | 19.4%), Italian (29,865 | 16.4%), German (26,800 | 14.7%), English (15,000 | 8.2%), and American (10,183 | 5.6%), together accounting for 64.4% of all Ulster County residents.
| Ancestry | # Population | % Population |
| African | 401 | 0.2% |
| Albanian | 129 | 0.1% |
| Alsatian | 9 | 0.0% |
| American | 10,183 | 5.6% |
| Apache | 38 | 0.0% |
| Arab | 798 | 0.4% |
| Argentinean | 101 | 0.1% |
| Armenian | 430 | 0.2% |
| Australian | 144 | 0.1% |
| Austrian | 814 | 0.4% |
| Bahamian | 10 | 0.0% |
| Barbadian | 16 | 0.0% |
| Basque | 10 | 0.0% |
| Belgian | 305 | 0.2% |
| Bhutanese | 298 | 0.2% |
| Blackfeet | 96 | 0.1% |
| Bolivian | 44 | 0.0% |
| Brazilian | 234 | 0.1% |
| British | 945 | 0.5% |
| British West Indian | 115 | 0.1% |
| Burmese | 478 | 0.3% |
| Cajun | 136 | 0.1% |
| Cambodian | 21 | 0.0% |
| Canadian | 385 | 0.2% |
| Carpatho Rusyn | 22 | 0.0% |
| Celtic | 22 | 0.0% |
| Central American | 1,957 | 1.1% |
| Central American Indian | 551 | 0.3% |
| Cherokee | 186 | 0.1% |
| Chilean | 179 | 0.1% |
| Choctaw | 21 | 0.0% |
| Colombian | 702 | 0.4% |
| Costa Rican | 40 | 0.0% |
| Croatian | 340 | 0.2% |
| Cuban | 1,394 | 0.8% |
| Cypriot | 72 | 0.0% |
| Czech | 734 | 0.4% |
| Czechoslovakian | 154 | 0.1% |
| Danish | 556 | 0.3% |
| Delaware | 66 | 0.0% |
| Dominican | 1,529 | 0.8% |
| Dutch | 4,999 | 2.7% |
| Eastern European | 1,521 | 0.8% |
| Ecuadorian | 345 | 0.2% |
| Egyptian | 78 | 0.0% |
| English | 15,000 | 8.2% |
| Estonian | 57 | 0.0% |
| Ethiopian | 11 | 0.0% |
| European | 2,965 | 1.6% |
| Filipino | 41 | 0.0% |
| Finnish | 359 | 0.2% |
| French | 4,385 | 2.4% |
| French American Indian | 29 | 0.0% |
| French Canadian | 913 | 0.5% |
| German | 26,800 | 14.7% |
| Ghanaian | 18 | 0.0% |
| Greek | 1,559 | 0.9% |
| Guatemalan | 348 | 0.2% |
| Guyanese | 177 | 0.1% |
| Haitian | 370 | 0.2% |
| Honduran | 136 | 0.1% |
| Hungarian | 1,971 | 1.1% |
| Icelander | 51 | 0.0% |
| Indian (Asian) | 1,322 | 0.7% |
| Inupiat | 5 | 0.0% |
| Iranian | 161 | 0.1% |
| Iraqi | 24 | 0.0% |
| Irish | 35,403 | 19.4% |
| Iroquois | 323 | 0.2% |
| Israeli | 53 | 0.0% |
| Italian | 29,865 | 16.4% |
| Jamaican | 2,257 | 1.2% |
| Japanese | 37 | 0.0% |
| Jordanian | 107 | 0.1% |
| Kenyan | 27 | 0.0% |
| Korean | 662 | 0.4% |
| Latvian | 60 | 0.0% |
| Lebanese | 225 | 0.1% |
| Lithuanian | 382 | 0.2% |
| Macedonian | 33 | 0.0% |
| Malaysian | 6 | 0.0% |
| Maltese | 35 | 0.0% |
| Mexican | 3,652 | 2.0% |
| Mexican American Indian | 113 | 0.1% |
| Moroccan | 10 | 0.0% |
| Native Hawaiian | 42 | 0.0% |
| New Zealander | 14 | 0.0% |
| Nicaraguan | 17 | 0.0% |
| Nigerian | 73 | 0.0% |
| Northern European | 487 | 0.3% |
| Norwegian | 1,419 | 0.8% |
| Okinawan | 22 | 0.0% |
| Osage | 36 | 0.0% |
| Pakistani | 75 | 0.0% |
| Palestinian | 115 | 0.1% |
| Panamanian | 60 | 0.0% |
| Pennsylvania German | 21 | 0.0% |
| Peruvian | 290 | 0.2% |
| Polish | 9,064 | 5.0% |
| Portuguese | 605 | 0.3% |
| Puerto Rican | 8,113 | 4.4% |
| Romanian | 574 | 0.3% |
| Russian | 3,171 | 1.7% |
| Salvadoran | 1,356 | 0.7% |
| Samoan | 29 | 0.0% |
| Scandinavian | 436 | 0.2% |
| Scotch-Irish | 1,071 | 0.6% |
| Scottish | 3,287 | 1.8% |
| Serbian | 83 | 0.1% |
| Sioux | 7 | 0.0% |
| Slavic | 142 | 0.1% |
| Slovak | 485 | 0.3% |
| South African | 51 | 0.0% |
| South American | 1,855 | 1.0% |
| South American Indian | 70 | 0.0% |
| Spaniard | 516 | 0.3% |
| Spanish | 396 | 0.2% |
| Sri Lankan | 796 | 0.4% |
| Subsaharan African | 594 | 0.3% |
| Swedish | 1,507 | 0.8% |
| Swiss | 225 | 0.1% |
| Syrian | 106 | 0.1% |
| Thai | 653 | 0.4% |
| Tohono O'Odham | 2 | 0.0% |
| Trinidadian and Tobagonian | 258 | 0.1% |
| Turkish | 344 | 0.2% |
| Ukrainian | 1,745 | 1.0% |
| Uruguayan | 70 | 0.0% |
| Venezuelan | 124 | 0.1% |
| Vietnamese | 195 | 0.1% |
| Welsh | 1,210 | 0.7% |
| West Indian | 689 | 0.4% |
| Yugoslavian | 276 | 0.2% | View All 133 Rows |
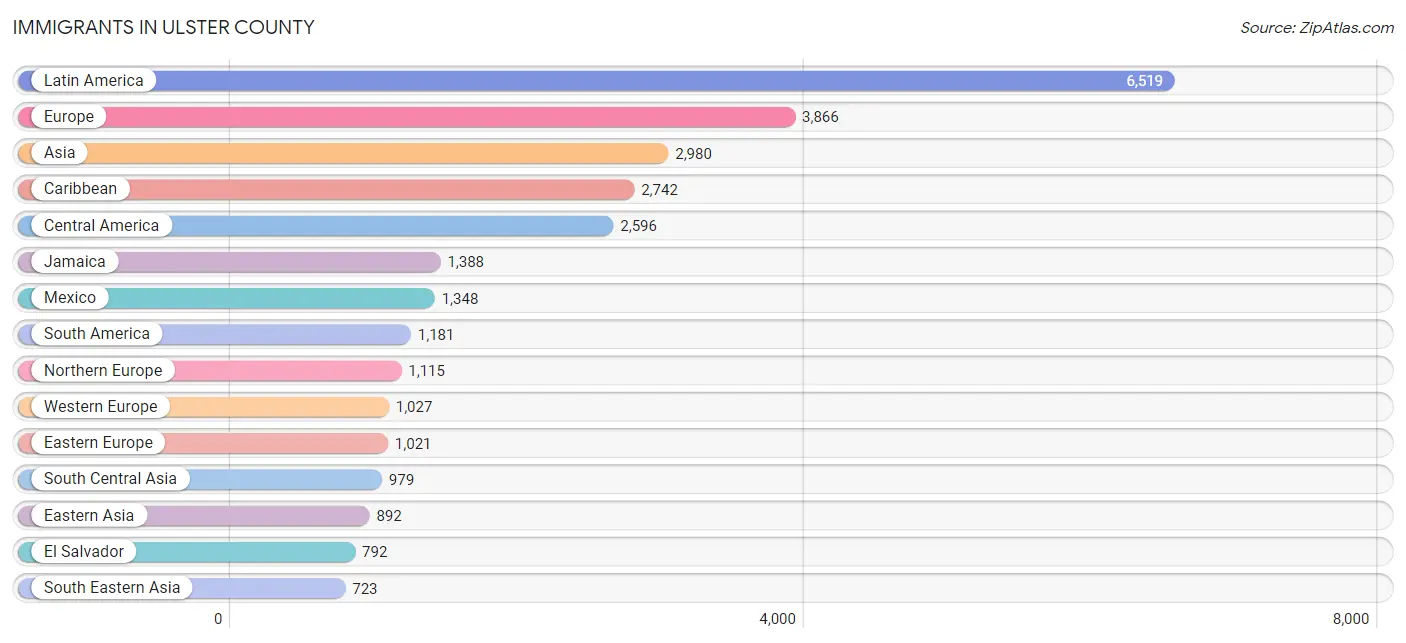
Immigrants in Ulster County
The most numerous immigrant groups reported in Ulster County came from Latin America (6,519 | 3.6%), Europe (3,866 | 2.1%), Asia (2,980 | 1.6%), Caribbean (2,742 | 1.5%), and Central America (2,596 | 1.4%), together accounting for 10.3% of all Ulster County residents.
| Immigration Origin | # Population | % Population |
| Africa | 281 | 0.2% |
| Albania | 21 | 0.0% |
| Argentina | 84 | 0.1% |
| Asia | 2,980 | 1.6% |
| Australia | 105 | 0.1% |
| Austria | 48 | 0.0% |
| Bahamas | 10 | 0.0% |
| Bangladesh | 122 | 0.1% |
| Barbados | 49 | 0.0% |
| Belarus | 36 | 0.0% |
| Belgium | 153 | 0.1% |
| Bolivia | 72 | 0.0% |
| Bosnia and Herzegovina | 7 | 0.0% |
| Brazil | 198 | 0.1% |
| Canada | 368 | 0.2% |
| Caribbean | 2,742 | 1.5% |
| Central America | 2,596 | 1.4% |
| Chile | 142 | 0.1% |
| China | 667 | 0.4% |
| Colombia | 304 | 0.2% |
| Costa Rica | 14 | 0.0% |
| Croatia | 22 | 0.0% |
| Cuba | 192 | 0.1% |
| Czechoslovakia | 41 | 0.0% |
| Dominican Republic | 323 | 0.2% |
| Eastern Africa | 36 | 0.0% |
| Eastern Asia | 892 | 0.5% |
| Eastern Europe | 1,021 | 0.6% |
| Ecuador | 79 | 0.0% |
| Egypt | 39 | 0.0% |
| El Salvador | 792 | 0.4% |
| England | 430 | 0.2% |
| Eritrea | 9 | 0.0% |
| Ethiopia | 11 | 0.0% |
| Europe | 3,866 | 2.1% |
| France | 136 | 0.1% |
| Germany | 517 | 0.3% |
| Ghana | 29 | 0.0% |
| Greece | 74 | 0.0% |
| Guatemala | 294 | 0.2% |
| Guyana | 93 | 0.1% |
| Haiti | 177 | 0.1% |
| Honduras | 138 | 0.1% |
| Hong Kong | 38 | 0.0% |
| Hungary | 41 | 0.0% |
| India | 265 | 0.2% |
| Indonesia | 29 | 0.0% |
| Iran | 122 | 0.1% |
| Iraq | 32 | 0.0% |
| Ireland | 239 | 0.1% |
| Israel | 24 | 0.0% |
| Italy | 440 | 0.2% |
| Jamaica | 1,388 | 0.8% |
| Japan | 115 | 0.1% |
| Jordan | 41 | 0.0% |
| Kenya | 16 | 0.0% |
| Korea | 110 | 0.1% |
| Kuwait | 28 | 0.0% |
| Laos | 9 | 0.0% |
| Latin America | 6,519 | 3.6% |
| Lithuania | 19 | 0.0% |
| Mexico | 1,348 | 0.7% |
| Nepal | 58 | 0.0% |
| Netherlands | 129 | 0.1% |
| Nigeria | 40 | 0.0% |
| North Macedonia | 8 | 0.0% |
| Northern Africa | 39 | 0.0% |
| Northern Europe | 1,115 | 0.6% |
| Oceania | 129 | 0.1% |
| Pakistan | 381 | 0.2% |
| Panama | 10 | 0.0% |
| Peru | 91 | 0.1% |
| Philippines | 164 | 0.1% |
| Poland | 264 | 0.1% |
| Portugal | 71 | 0.0% |
| Romania | 44 | 0.0% |
| Russia | 113 | 0.1% |
| Scotland | 51 | 0.0% |
| Serbia | 7 | 0.0% |
| Singapore | 22 | 0.0% |
| South Africa | 58 | 0.0% |
| South America | 1,181 | 0.6% |
| South Central Asia | 979 | 0.5% |
| South Eastern Asia | 723 | 0.4% |
| Southern Europe | 669 | 0.4% |
| Spain | 77 | 0.0% |
| Sri Lanka | 11 | 0.0% |
| Sweden | 36 | 0.0% |
| Switzerland | 44 | 0.0% |
| Taiwan | 42 | 0.0% |
| Thailand | 21 | 0.0% |
| Trinidad and Tobago | 102 | 0.1% |
| Turkey | 170 | 0.1% |
| Ukraine | 240 | 0.1% |
| Uruguay | 7 | 0.0% |
| Uzbekistan | 20 | 0.0% |
| Venezuela | 97 | 0.1% |
| Vietnam | 460 | 0.3% |
| West Indies | 441 | 0.2% |
| Western Africa | 148 | 0.1% |
| Western Asia | 375 | 0.2% |
| Western Europe | 1,027 | 0.6% | View All 102 Rows |
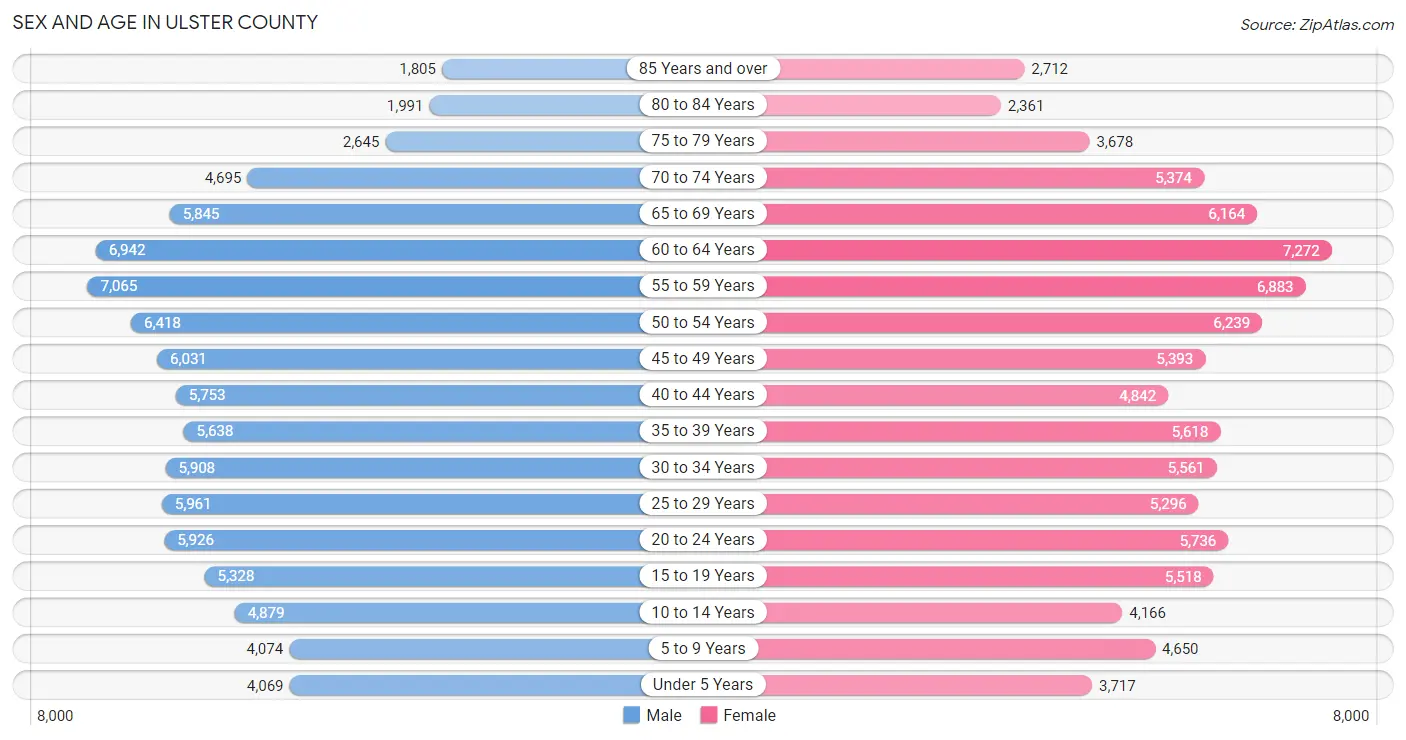
Sex and Age in Ulster County
Sex and Age in Ulster County
The most populous age groups in Ulster County are 55 to 59 Years (7,065 | 7.8%) for men and 60 to 64 Years (7,272 | 8.0%) for women.
| Age Bracket | Male | Female |
| Under 5 Years | 4,069 (4.5%) | 3,717 (4.1%) |
| 5 to 9 Years | 4,074 (4.5%) | 4,650 (5.1%) |
| 10 to 14 Years | 4,879 (5.4%) | 4,166 (4.6%) |
| 15 to 19 Years | 5,328 (5.9%) | 5,518 (6.0%) |
| 20 to 24 Years | 5,926 (6.5%) | 5,736 (6.3%) |
| 25 to 29 Years | 5,961 (6.6%) | 5,296 (5.8%) |
| 30 to 34 Years | 5,908 (6.5%) | 5,561 (6.1%) |
| 35 to 39 Years | 5,638 (6.2%) | 5,618 (6.2%) |
| 40 to 44 Years | 5,753 (6.3%) | 4,842 (5.3%) |
| 45 to 49 Years | 6,031 (6.6%) | 5,393 (5.9%) |
| 50 to 54 Years | 6,418 (7.0%) | 6,239 (6.8%) |
| 55 to 59 Years | 7,065 (7.8%) | 6,883 (7.5%) |
| 60 to 64 Years | 6,942 (7.6%) | 7,272 (8.0%) |
| 65 to 69 Years | 5,845 (6.4%) | 6,164 (6.8%) |
| 70 to 74 Years | 4,695 (5.2%) | 5,374 (5.9%) |
| 75 to 79 Years | 2,645 (2.9%) | 3,678 (4.0%) |
| 80 to 84 Years | 1,991 (2.2%) | 2,361 (2.6%) |
| 85 Years and over | 1,805 (2.0%) | 2,712 (3.0%) |
| Total | 90,973 (100.0%) | 91,180 (100.0%) |
Families and Households in Ulster County
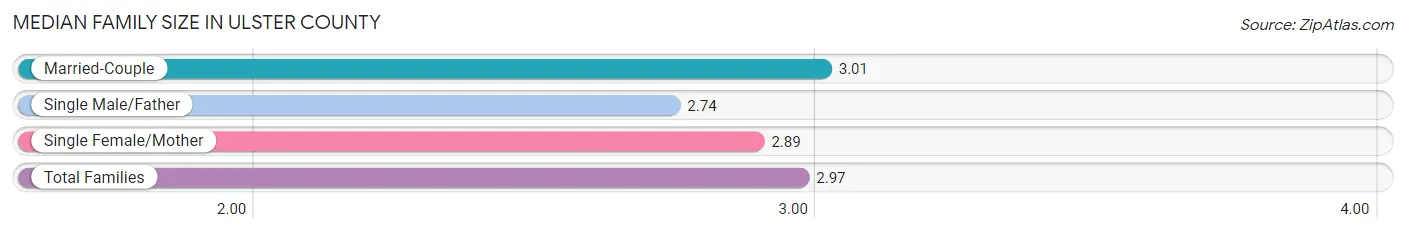
Median Family Size in Ulster County
The median family size in Ulster County is 2.97 persons per family, with married-couple families (31,483 | 73.9%) accounting for the largest median family size of 3.01 persons per family. On the other hand, single male/father families (3,652 | 8.6%) represent the smallest median family size with 2.74 persons per family.
| Family Type | # Families | Family Size |
| Married-Couple | 31,483 (73.9%) | 3.01 |
| Single Male/Father | 3,652 (8.6%) | 2.74 |
| Single Female/Mother | 7,474 (17.5%) | 2.89 |
| Total Families | 42,609 (100.0%) | 2.97 |
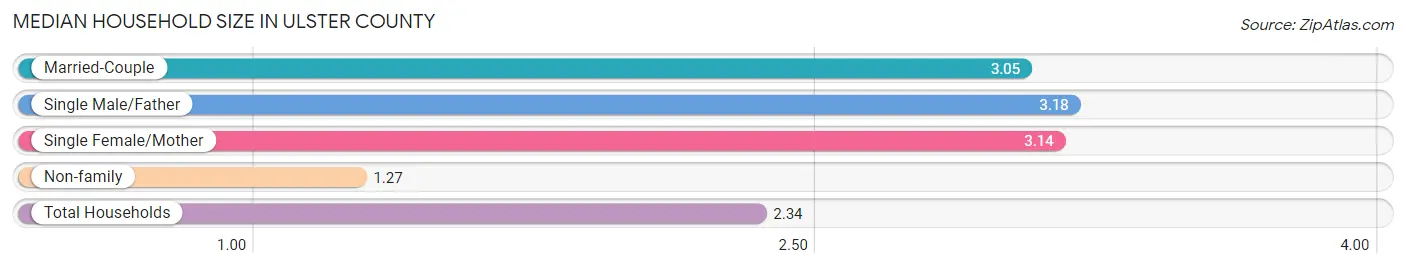
Median Household Size in Ulster County
The median household size in Ulster County is 2.34 persons per household, with single male/father households (3,652 | 5.1%) accounting for the largest median household size of 3.18 persons per household. non-family households (29,656 | 41.0%) represent the smallest median household size with 1.27 persons per household.
| Household Type | # Households | Household Size |
| Married-Couple | 31,483 (43.6%) | 3.05 |
| Single Male/Father | 3,652 (5.1%) | 3.18 |
| Single Female/Mother | 7,474 (10.3%) | 3.14 |
| Non-family | 29,656 (41.0%) | 1.27 |
| Total Households | 72,265 (100.0%) | 2.34 |
Household Size by Marriage Status in Ulster County
Out of a total of 72,265 households in Ulster County, 42,609 (59.0%) are family households, while 29,656 (41.0%) are nonfamily households. The most numerous type of family households are 2-person households, comprising 20,196, and the most common type of nonfamily households are 1-person households, comprising 23,917.
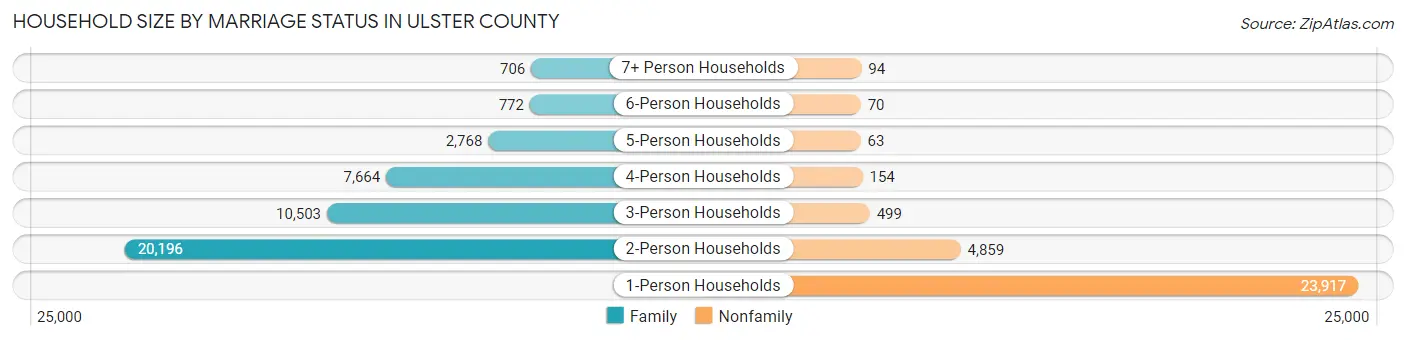
| Household Size | Family Households | Nonfamily Households |
| 1-Person Households | - | 23,917 (33.1%) |
| 2-Person Households | 20,196 (28.0%) | 4,859 (6.7%) |
| 3-Person Households | 10,503 (14.5%) | 499 (0.7%) |
| 4-Person Households | 7,664 (10.6%) | 154 (0.2%) |
| 5-Person Households | 2,768 (3.8%) | 63 (0.1%) |
| 6-Person Households | 772 (1.1%) | 70 (0.1%) |
| 7+ Person Households | 706 (1.0%) | 94 (0.1%) |
| Total | 42,609 (59.0%) | 29,656 (41.0%) |
Female Fertility in Ulster County
Fertility by Age in Ulster County
Average fertility rate in Ulster County is 42.0 births per 1,000 women. Women in the age bracket of 20 to 34 years have the highest fertility rate with 61.0 births per 1,000 women. Women in the age bracket of 20 to 34 years acount for 61.9% of all women with births.
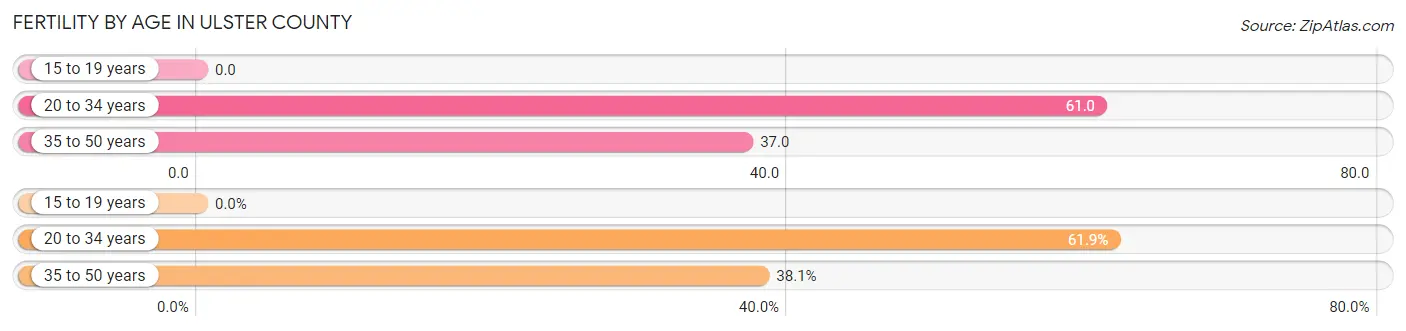
| Age Bracket | Women with Births | Births / 1,000 Women |
| 15 to 19 years | 0 (0.0%) | 0.0 |
| 20 to 34 years | 1,009 (61.9%) | 61.0 |
| 35 to 50 years | 621 (38.1%) | 37.0 |
| Total | 1,630 (100.0%) | 42.0 |
Fertility by Age by Marriage Status in Ulster County
74.8% of women with births (1,630) in Ulster County are married. The highest percentage of unmarried women with births falls into 20 to 34 years age bracket with 32.4% of them unmarried at the time of birth, while the lowest percentage of unmarried women with births belong to 35 to 50 years age bracket with 13.5% of them unmarried.
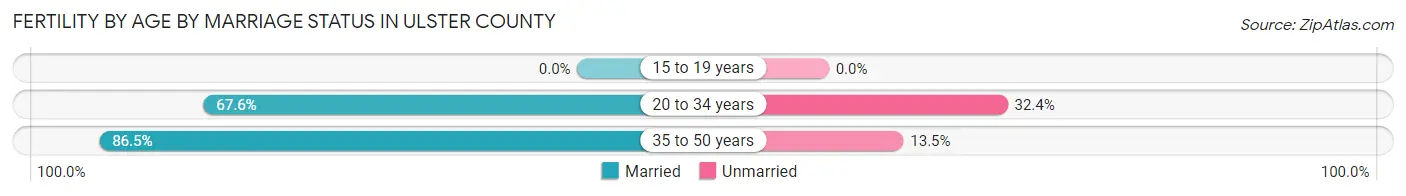
| Age Bracket | Married | Unmarried |
| 15 to 19 years | 0 (0.0%) | 0 (0.0%) |
| 20 to 34 years | 682 (67.6%) | 327 (32.4%) |
| 35 to 50 years | 537 (86.5%) | 84 (13.5%) |
| Total | 1,219 (74.8%) | 411 (25.2%) |
Fertility by Education in Ulster County
Average fertility rate in Ulster County is 42.0 births per 1,000 women. Women with the education attainment of bachelor's degree have the highest fertility rate of 63.0 births per 1,000 women, while women with the education attainment of less than high school have the lowest fertility at 20.0 births per 1,000 women. Women with the education attainment of college or associate's degree represent 33.5% of all women with births.
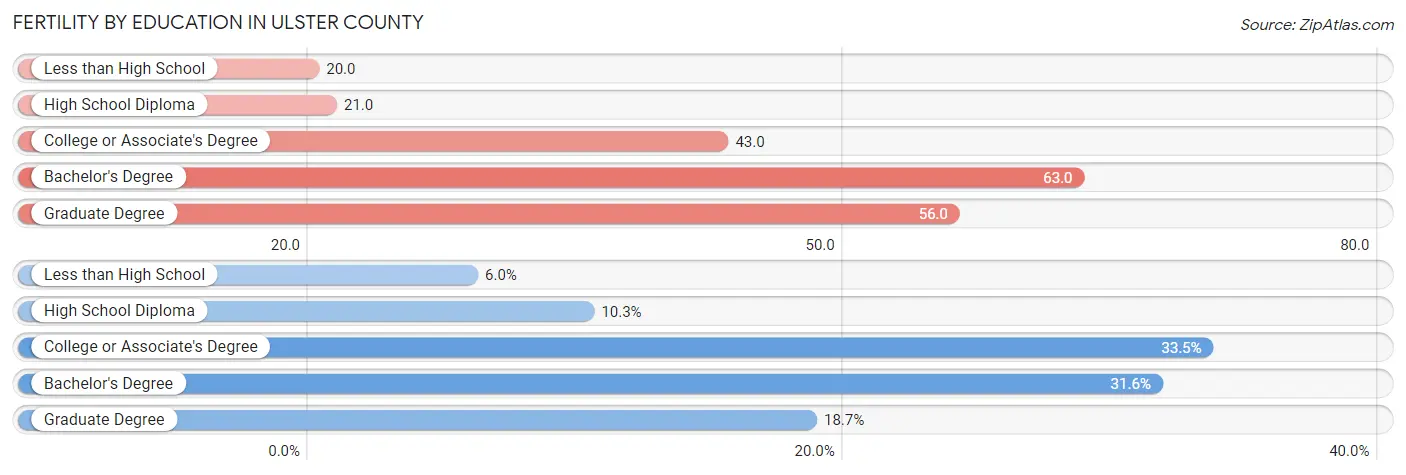
| Educational Attainment | Women with Births | Births / 1,000 Women |
| Less than High School | 97 (5.9%) | 20.0 |
| High School Diploma | 168 (10.3%) | 21.0 |
| College or Associate's Degree | 546 (33.5%) | 43.0 |
| Bachelor's Degree | 515 (31.6%) | 63.0 |
| Graduate Degree | 304 (18.6%) | 56.0 |
| Total | 1,630 (100.0%) | 42.0 |
Fertility by Education by Marriage Status in Ulster County
25.2% of women with births in Ulster County are unmarried. Women with the educational attainment of graduate degree are most likely to be married with 95.1% of them married at childbirth, while women with the educational attainment of college or associate's degree are least likely to be married with 36.8% of them unmarried at childbirth.
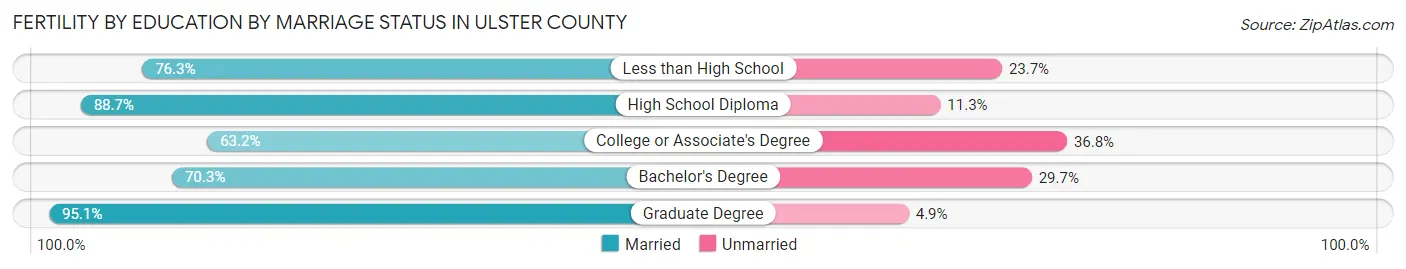
| Educational Attainment | Married | Unmarried |
| Less than High School | 74 (76.3%) | 23 (23.7%) |
| High School Diploma | 149 (88.7%) | 19 (11.3%) |
| College or Associate's Degree | 345 (63.2%) | 201 (36.8%) |
| Bachelor's Degree | 362 (70.3%) | 153 (29.7%) |
| Graduate Degree | 289 (95.1%) | 15 (4.9%) |
| Total | 1,219 (74.8%) | 411 (25.2%) |
Employment Characteristics in Ulster County
Employment by Class of Employer in Ulster County
Among the 83,839 employed individuals in Ulster County, private company employees (47,521 | 56.7%), not-for-profit organizations (9,563 | 11.4%), and local government employees (8,482 | 10.1%) make up the most common classes of employment.
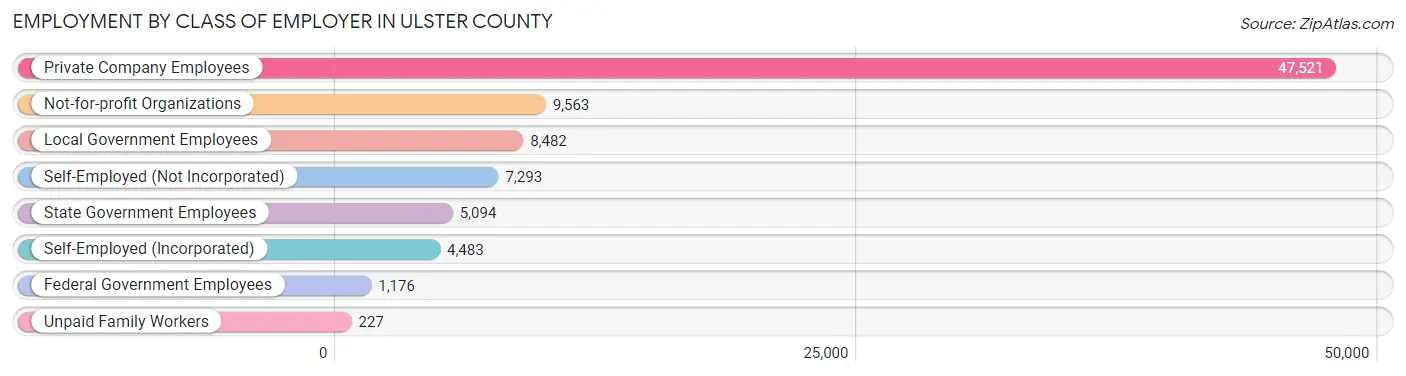
| Employer Class | # Employees | % Employees |
| Private Company Employees | 47,521 | 56.7% |
| Self-Employed (Incorporated) | 4,483 | 5.3% |
| Self-Employed (Not Incorporated) | 7,293 | 8.7% |
| Not-for-profit Organizations | 9,563 | 11.4% |
| Local Government Employees | 8,482 | 10.1% |
| State Government Employees | 5,094 | 6.1% |
| Federal Government Employees | 1,176 | 1.4% |
| Unpaid Family Workers | 227 | 0.3% |
| Total | 83,839 | 100.0% |
Employment Status by Age in Ulster County
According to the labor force statistics for Ulster County, out of the total population over 16 years of age (154,703), 58.9% or 91,120 individuals are in the labor force, with 5.1% or 4,647 of them unemployed. The age group with the highest labor force participation rate is 25 to 29 years, with 81.6% or 9,186 individuals in the labor force. Within the labor force, the 16 to 19 years age range has the highest percentage of unemployed individuals, with 15.0% or 504 of them being unemployed.
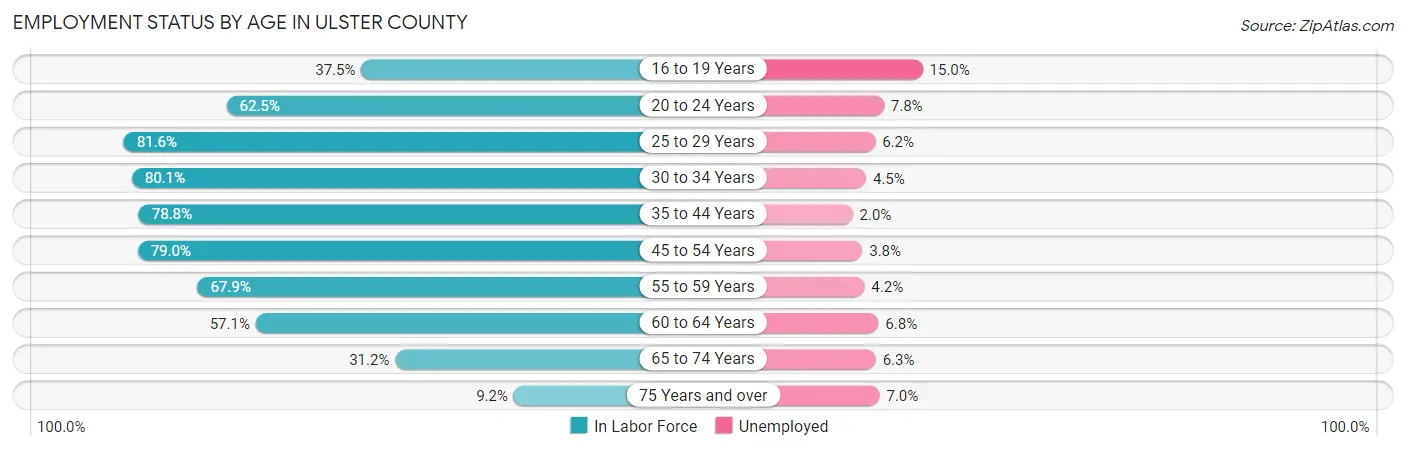
| Age Bracket | In Labor Force | Unemployed |
| 16 to 19 Years | 3,357 (37.5%) | 504 (15.0%) |
| 20 to 24 Years | 7,289 (62.5%) | 569 (7.8%) |
| 25 to 29 Years | 9,186 (81.6%) | 570 (6.2%) |
| 30 to 34 Years | 9,187 (80.1%) | 413 (4.5%) |
| 35 to 44 Years | 17,219 (78.8%) | 344 (2.0%) |
| 45 to 54 Years | 19,024 (79.0%) | 723 (3.8%) |
| 55 to 59 Years | 9,471 (67.9%) | 398 (4.2%) |
| 60 to 64 Years | 8,116 (57.1%) | 552 (6.8%) |
| 65 to 74 Years | 6,888 (31.2%) | 434 (6.3%) |
| 75 Years and over | 1,398 (9.2%) | 98 (7.0%) |
| Total | 91,120 (58.9%) | 4,647 (5.1%) |
Employment Status by Educational Attainment in Ulster County
According to labor force statistics for Ulster County, 74.6% of individuals (72,228) out of the total population between 25 and 64 years of age (96,820) are in the labor force, with 4.2% or 3,034 of them being unemployed. The group with the highest labor force participation rate are those with the educational attainment of bachelor's degree or higher, with 85.4% or 29,114 individuals in the labor force. Within the labor force, individuals with high school diploma education have the highest percentage of unemployment, with 6.0% or 1,067 of them being unemployed.
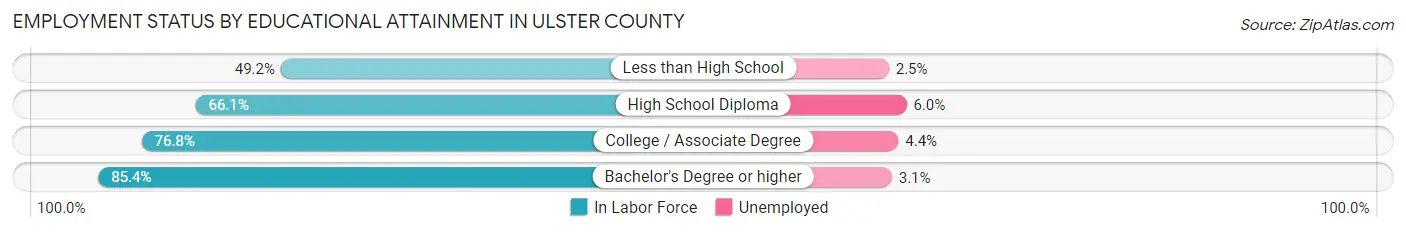
| Educational Attainment | In Labor Force | Unemployed |
| Less than High School | 3,936 (49.2%) | 200 (2.5%) |
| High School Diploma | 17,782 (66.1%) | 1,614 (6.0%) |
| College / Associate Degree | 21,373 (76.8%) | 1,224 (4.4%) |
| Bachelor's Degree or higher | 29,114 (85.4%) | 1,057 (3.1%) |
| Total | 72,228 (74.6%) | 4,066 (4.2%) |
Employment Occupations by Sex in Ulster County
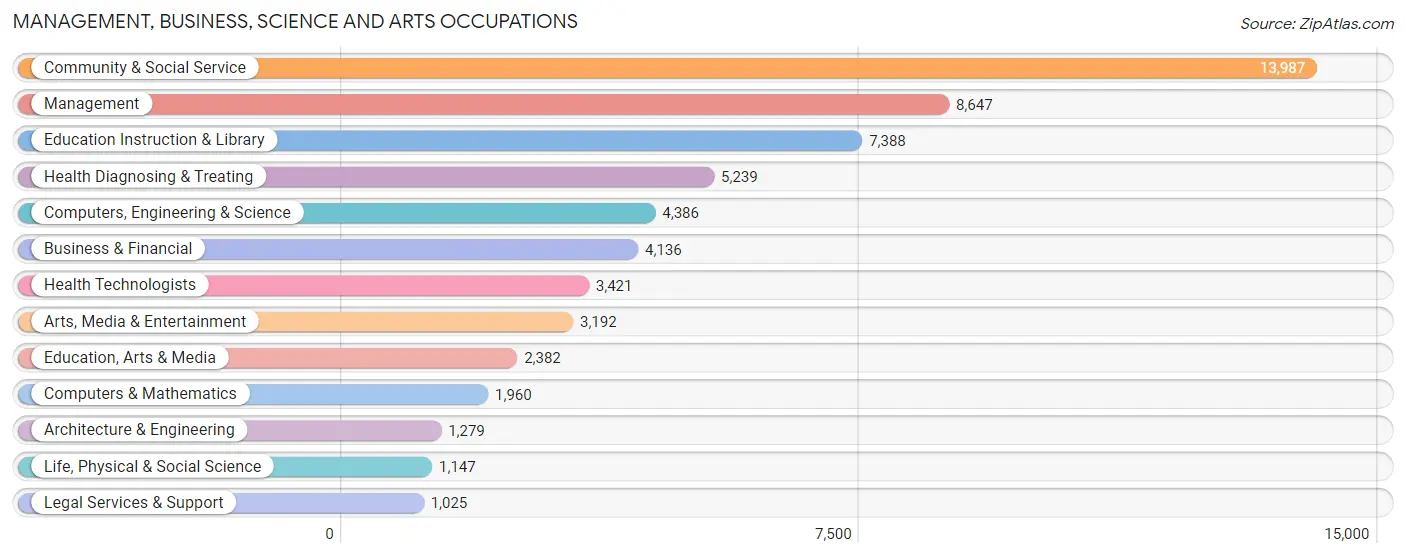
Management, Business, Science and Arts Occupations
The most common Management, Business, Science and Arts occupations in Ulster County are Community & Social Service (13,987 | 16.2%), Management (8,647 | 10.0%), Education Instruction & Library (7,388 | 8.5%), Health Diagnosing & Treating (5,239 | 6.1%), and Computers, Engineering & Science (4,386 | 5.1%).
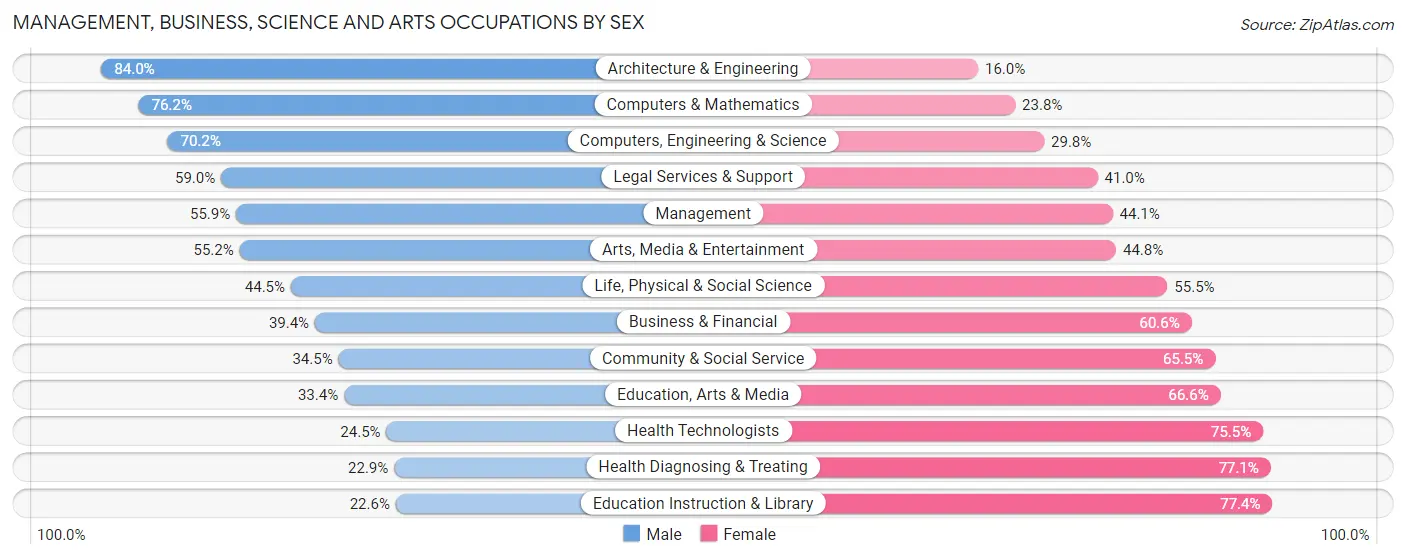
Management, Business, Science and Arts Occupations by Sex
Within the Management, Business, Science and Arts occupations in Ulster County, the most male-oriented occupations are Architecture & Engineering (84.0%), Computers & Mathematics (76.2%), and Computers, Engineering & Science (70.2%), while the most female-oriented occupations are Education Instruction & Library (77.4%), Health Diagnosing & Treating (77.1%), and Health Technologists (75.5%).
| Occupation | Male | Female |
| Management | 4,833 (55.9%) | 3,814 (44.1%) |
| Business & Financial | 1,631 (39.4%) | 2,505 (60.6%) |
| Computers, Engineering & Science | 3,078 (70.2%) | 1,308 (29.8%) |
| Computers & Mathematics | 1,494 (76.2%) | 466 (23.8%) |
| Architecture & Engineering | 1,074 (84.0%) | 205 (16.0%) |
| Life, Physical & Social Science | 510 (44.5%) | 637 (55.5%) |
| Community & Social Service | 4,829 (34.5%) | 9,158 (65.5%) |
| Education, Arts & Media | 795 (33.4%) | 1,587 (66.6%) |
| Legal Services & Support | 605 (59.0%) | 420 (41.0%) |
| Education Instruction & Library | 1,668 (22.6%) | 5,720 (77.4%) |
| Arts, Media & Entertainment | 1,761 (55.2%) | 1,431 (44.8%) |
| Health Diagnosing & Treating | 1,201 (22.9%) | 4,038 (77.1%) |
| Health Technologists | 839 (24.5%) | 2,582 (75.5%) |
| Total (Category) | 15,572 (42.8%) | 20,823 (57.2%) |
| Total (Overall) | 43,842 (50.7%) | 42,651 (49.3%) |
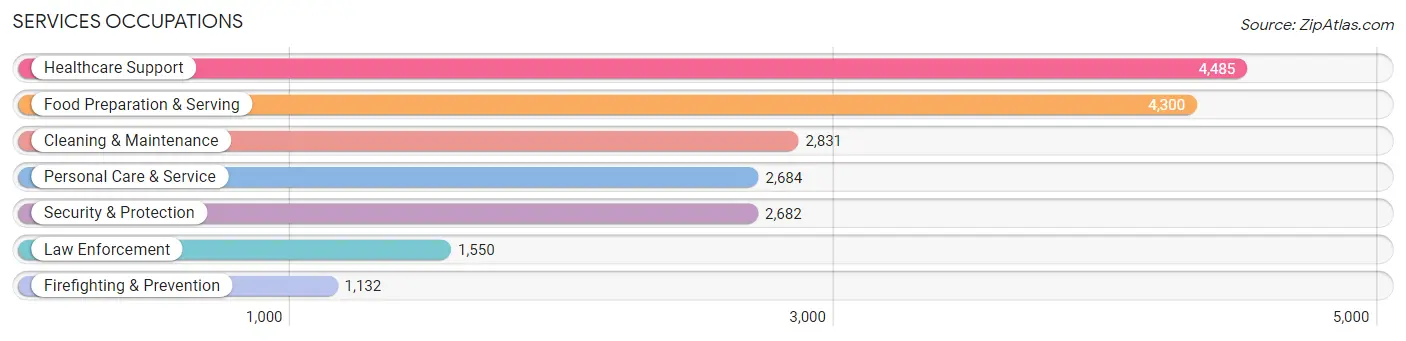
Services Occupations
The most common Services occupations in Ulster County are Healthcare Support (4,485 | 5.2%), Food Preparation & Serving (4,300 | 5.0%), Cleaning & Maintenance (2,831 | 3.3%), Personal Care & Service (2,684 | 3.1%), and Security & Protection (2,682 | 3.1%).
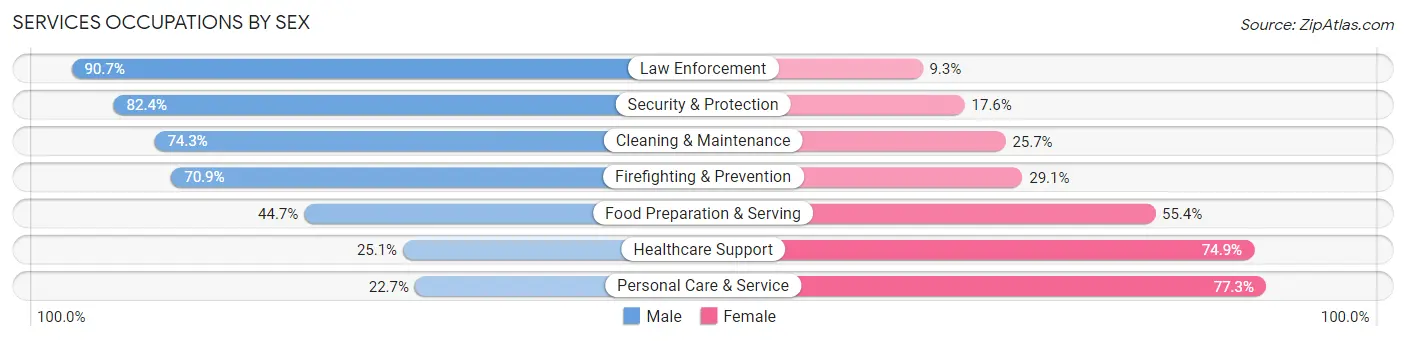
Services Occupations by Sex
Within the Services occupations in Ulster County, the most male-oriented occupations are Law Enforcement (90.7%), Security & Protection (82.4%), and Cleaning & Maintenance (74.3%), while the most female-oriented occupations are Personal Care & Service (77.3%), Healthcare Support (74.9%), and Food Preparation & Serving (55.3%).
| Occupation | Male | Female |
| Healthcare Support | 1,125 (25.1%) | 3,360 (74.9%) |
| Security & Protection | 2,209 (82.4%) | 473 (17.6%) |
| Firefighting & Prevention | 803 (70.9%) | 329 (29.1%) |
| Law Enforcement | 1,406 (90.7%) | 144 (9.3%) |
| Food Preparation & Serving | 1,920 (44.7%) | 2,380 (55.3%) |
| Cleaning & Maintenance | 2,103 (74.3%) | 728 (25.7%) |
| Personal Care & Service | 610 (22.7%) | 2,074 (77.3%) |
| Total (Category) | 7,967 (46.9%) | 9,015 (53.1%) |
| Total (Overall) | 43,842 (50.7%) | 42,651 (49.3%) |
Sales and Office Occupations
The most common Sales and Office occupations in Ulster County are Office & Administration (8,179 | 9.5%), and Sales & Related (7,937 | 9.2%).

Sales and Office Occupations by Sex

| Occupation | Male | Female |
| Sales & Related | 3,868 (48.7%) | 4,069 (51.3%) |
| Office & Administration | 1,666 (20.4%) | 6,513 (79.6%) |
| Total (Category) | 5,534 (34.3%) | 10,582 (65.7%) |
| Total (Overall) | 43,842 (50.7%) | 42,651 (49.3%) |
Natural Resources, Construction and Maintenance Occupations
The most common Natural Resources, Construction and Maintenance occupations in Ulster County are Construction & Extraction (5,161 | 6.0%), Installation, Maintenance & Repair (2,937 | 3.4%), and Farming, Fishing & Forestry (327 | 0.4%).
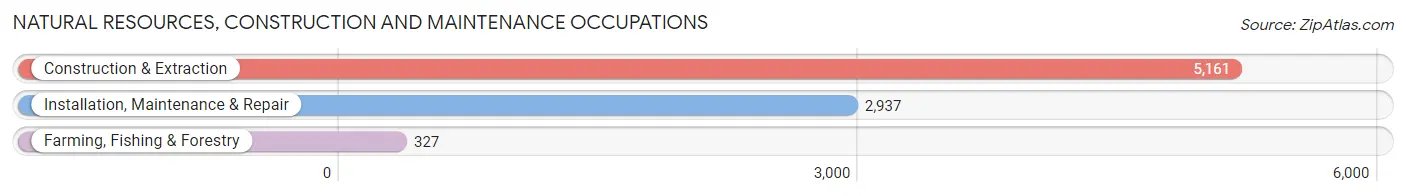
Natural Resources, Construction and Maintenance Occupations by Sex

| Occupation | Male | Female |
| Farming, Fishing & Forestry | 157 (48.0%) | 170 (52.0%) |
| Construction & Extraction | 4,950 (95.9%) | 211 (4.1%) |
| Installation, Maintenance & Repair | 2,895 (98.6%) | 42 (1.4%) |
| Total (Category) | 8,002 (95.0%) | 423 (5.0%) |
| Total (Overall) | 43,842 (50.7%) | 42,651 (49.3%) |
Production, Transportation and Moving Occupations
The most common Production, Transportation and Moving occupations in Ulster County are Production (3,477 | 4.0%), Transportation (2,835 | 3.3%), and Material Moving (2,263 | 2.6%).
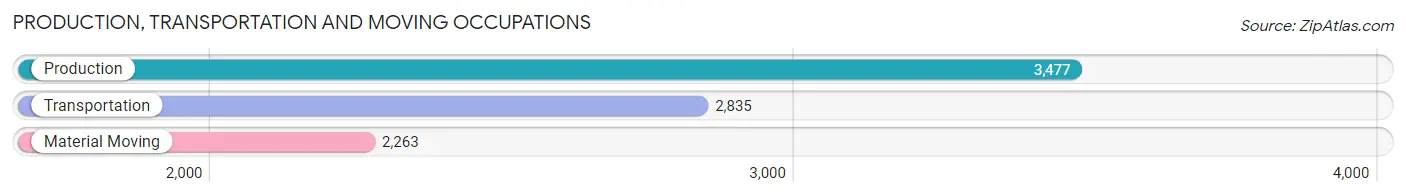
Production, Transportation and Moving Occupations by Sex
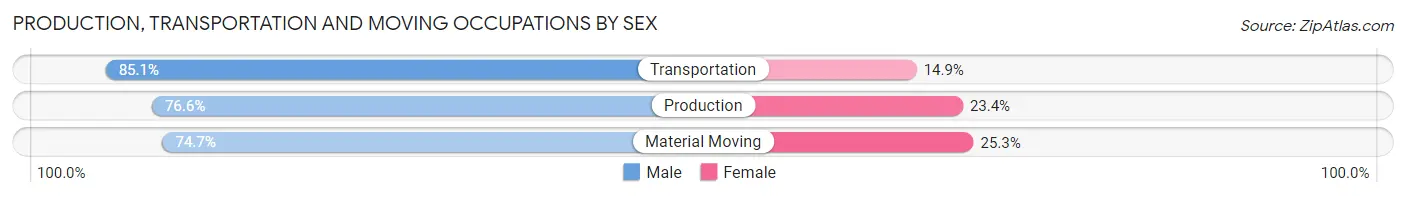
| Occupation | Male | Female |
| Production | 2,664 (76.6%) | 813 (23.4%) |
| Transportation | 2,413 (85.1%) | 422 (14.9%) |
| Material Moving | 1,690 (74.7%) | 573 (25.3%) |
| Total (Category) | 6,767 (78.9%) | 1,808 (21.1%) |
| Total (Overall) | 43,842 (50.7%) | 42,651 (49.3%) |
Employment Industries by Sex in Ulster County
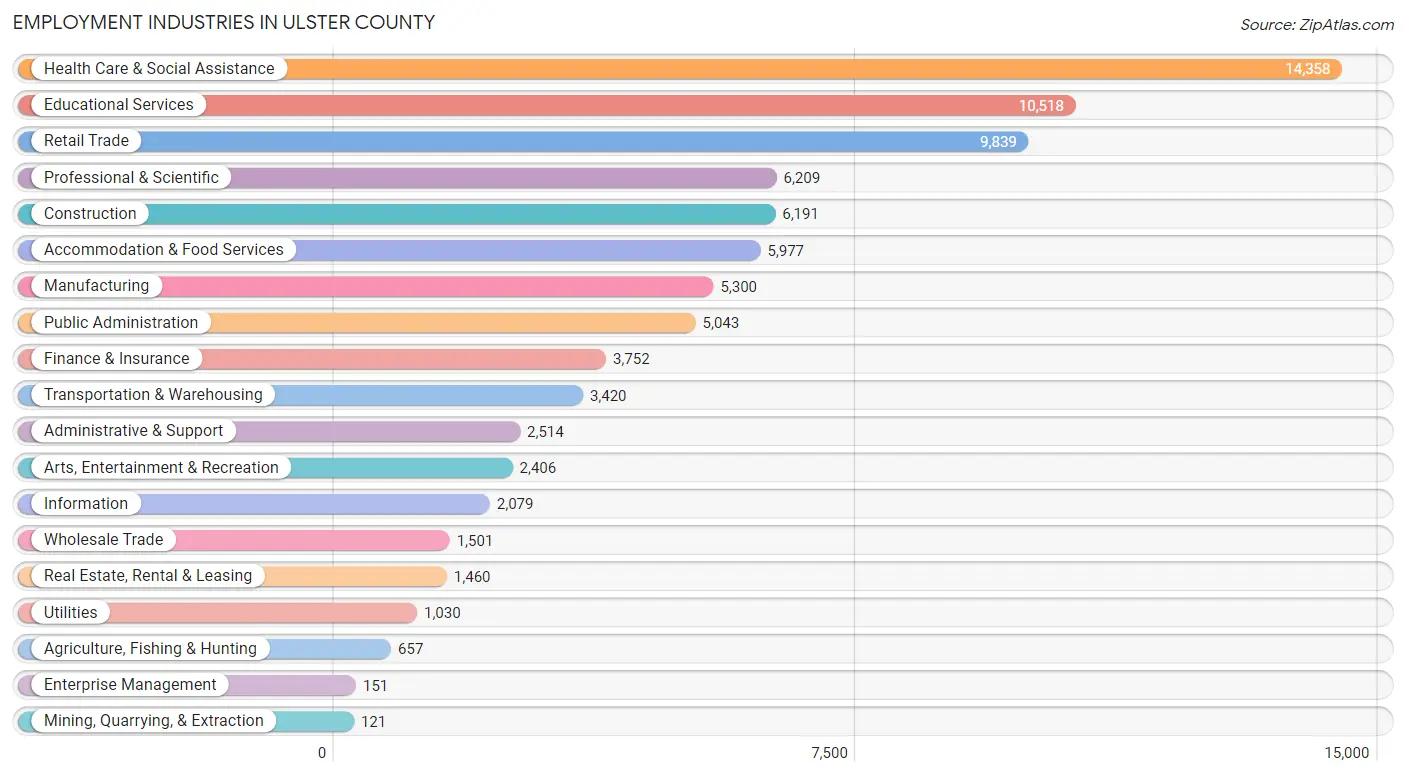
Employment Industries in Ulster County
The major employment industries in Ulster County include Health Care & Social Assistance (14,358 | 16.6%), Educational Services (10,518 | 12.2%), Retail Trade (9,839 | 11.4%), Professional & Scientific (6,209 | 7.2%), and Construction (6,191 | 7.2%).
Employment Industries by Sex in Ulster County
The Ulster County industries that see more men than women are Mining, Quarrying, & Extraction (100.0%), Construction (88.8%), and Utilities (86.9%), whereas the industries that tend to have a higher number of women are Health Care & Social Assistance (75.5%), Educational Services (68.6%), and Finance & Insurance (67.0%).
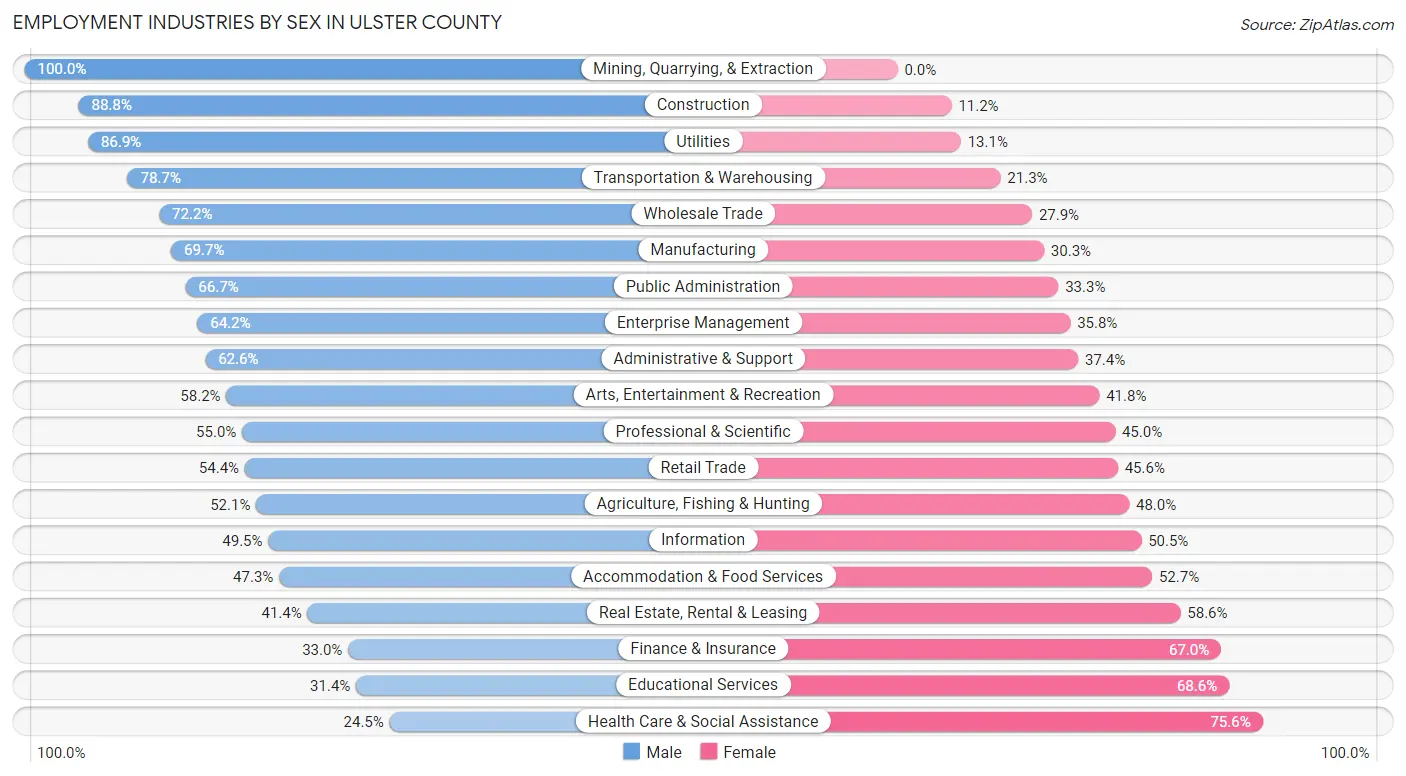
| Industry | Male | Female |
| Agriculture, Fishing & Hunting | 342 (52.0%) | 315 (47.9%) |
| Mining, Quarrying, & Extraction | 121 (100.0%) | 0 (0.0%) |
| Construction | 5,499 (88.8%) | 692 (11.2%) |
| Manufacturing | 3,693 (69.7%) | 1,607 (30.3%) |
| Wholesale Trade | 1,083 (72.2%) | 418 (27.9%) |
| Retail Trade | 5,352 (54.4%) | 4,487 (45.6%) |
| Transportation & Warehousing | 2,691 (78.7%) | 729 (21.3%) |
| Utilities | 895 (86.9%) | 135 (13.1%) |
| Information | 1,030 (49.5%) | 1,049 (50.5%) |
| Finance & Insurance | 1,239 (33.0%) | 2,513 (67.0%) |
| Real Estate, Rental & Leasing | 605 (41.4%) | 855 (58.6%) |
| Professional & Scientific | 3,413 (55.0%) | 2,796 (45.0%) |
| Enterprise Management | 97 (64.2%) | 54 (35.8%) |
| Administrative & Support | 1,574 (62.6%) | 940 (37.4%) |
| Educational Services | 3,299 (31.4%) | 7,219 (68.6%) |
| Health Care & Social Assistance | 3,511 (24.4%) | 10,847 (75.5%) |
| Arts, Entertainment & Recreation | 1,401 (58.2%) | 1,005 (41.8%) |
| Accommodation & Food Services | 2,828 (47.3%) | 3,149 (52.7%) |
| Public Administration | 3,364 (66.7%) | 1,679 (33.3%) |
| Total | 43,842 (50.7%) | 42,651 (49.3%) |
Education in Ulster County
School Enrollment in Ulster County
The most common levels of schooling among the 37,583 students in Ulster County are college / undergraduate (10,212 | 27.2%), high school (7,845 | 20.9%), and middle school (7,328 | 19.5%).
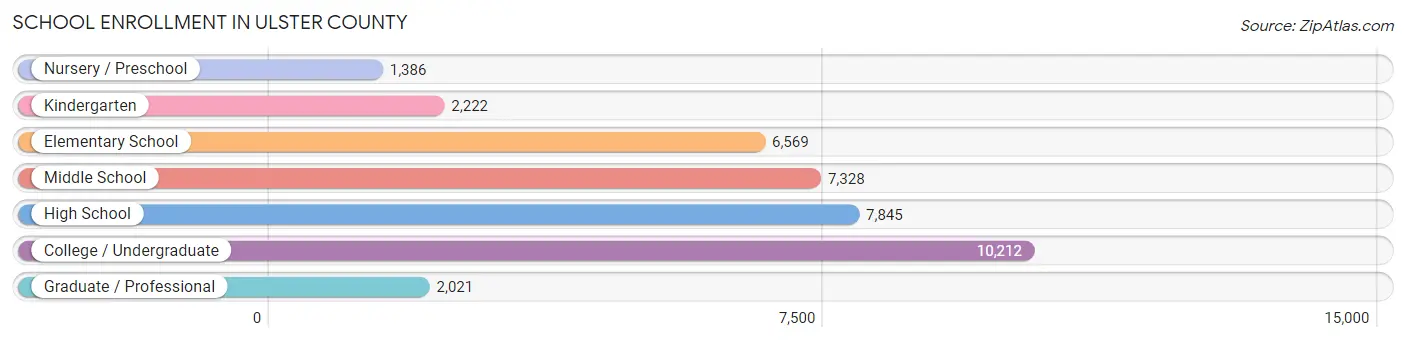
| School Level | # Students | % Students |
| Nursery / Preschool | 1,386 | 3.7% |
| Kindergarten | 2,222 | 5.9% |
| Elementary School | 6,569 | 17.5% |
| Middle School | 7,328 | 19.5% |
| High School | 7,845 | 20.9% |
| College / Undergraduate | 10,212 | 27.2% |
| Graduate / Professional | 2,021 | 5.4% |
| Total | 37,583 | 100.0% |
School Enrollment by Age by Funding Source in Ulster County
Out of a total of 37,583 students who are enrolled in schools in Ulster County, 5,487 (14.6%) attend a private institution, while the remaining 32,096 (85.4%) are enrolled in public schools. The age group of 35 years and over has the highest likelihood of being enrolled in private schools, with 573 (40.8% in the age bracket) enrolled. Conversely, the age group of 5 to 9 year old has the lowest likelihood of being enrolled in a private school, with 7,446 (90.2% in the age bracket) attending a public institution.
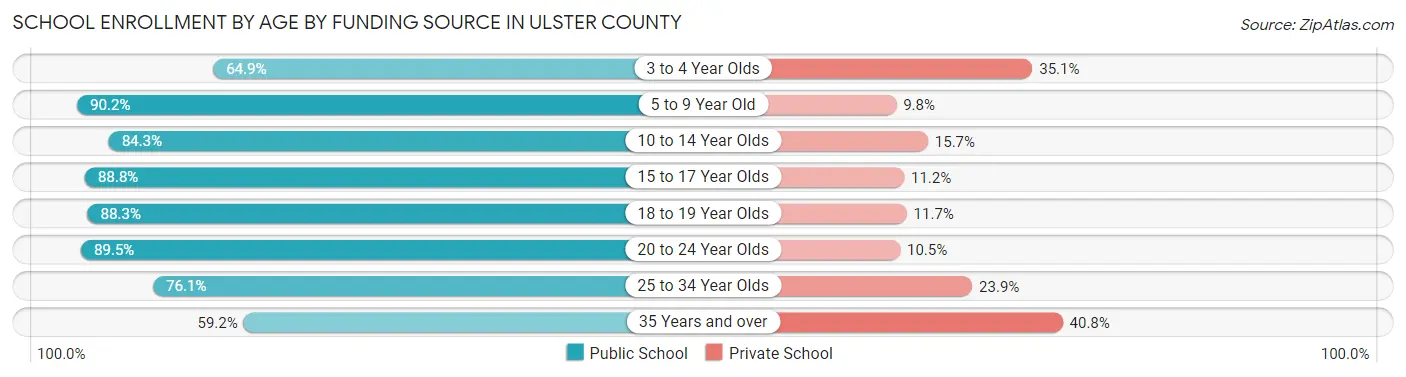
| Age Bracket | Public School | Private School |
| 3 to 4 Year Olds | 888 (64.9%) | 481 (35.1%) |
| 5 to 9 Year Old | 7,446 (90.2%) | 807 (9.8%) |
| 10 to 14 Year Olds | 7,532 (84.3%) | 1,401 (15.7%) |
| 15 to 17 Year Olds | 5,079 (88.8%) | 643 (11.2%) |
| 18 to 19 Year Olds | 3,265 (88.3%) | 434 (11.7%) |
| 20 to 24 Year Olds | 5,336 (89.5%) | 626 (10.5%) |
| 25 to 34 Year Olds | 1,704 (76.1%) | 536 (23.9%) |
| 35 Years and over | 832 (59.2%) | 573 (40.8%) |
| Total | 32,096 (85.4%) | 5,487 (14.6%) |
Educational Attainment by Field of Study in Ulster County
Education (7,801 | 14.9%), business (6,421 | 12.3%), visual & performing arts (5,490 | 10.5%), social sciences (5,093 | 9.8%), and literature & languages (4,179 | 8.0%) are the most common fields of study among 52,217 individuals in Ulster County who have obtained a bachelor's degree or higher.
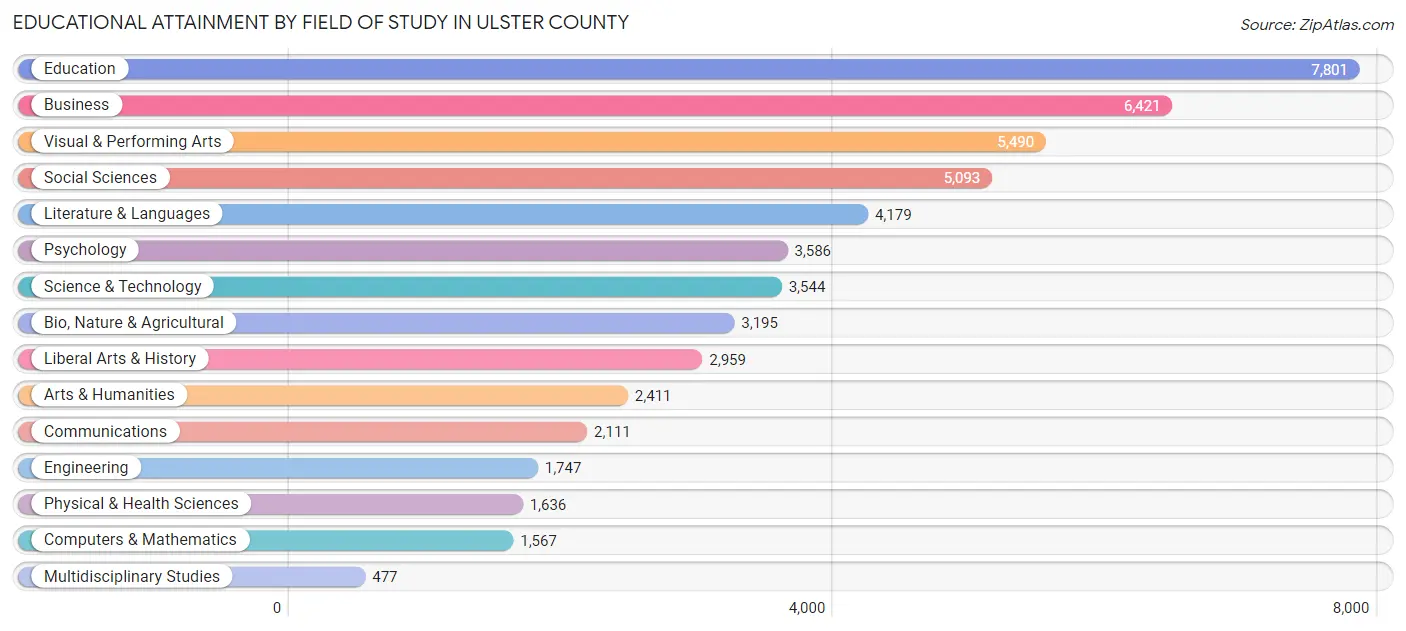
| Field of Study | # Graduates | % Graduates |
| Computers & Mathematics | 1,567 | 3.0% |
| Bio, Nature & Agricultural | 3,195 | 6.1% |
| Physical & Health Sciences | 1,636 | 3.1% |
| Psychology | 3,586 | 6.9% |
| Social Sciences | 5,093 | 9.8% |
| Engineering | 1,747 | 3.4% |
| Multidisciplinary Studies | 477 | 0.9% |
| Science & Technology | 3,544 | 6.8% |
| Business | 6,421 | 12.3% |
| Education | 7,801 | 14.9% |
| Literature & Languages | 4,179 | 8.0% |
| Liberal Arts & History | 2,959 | 5.7% |
| Visual & Performing Arts | 5,490 | 10.5% |
| Communications | 2,111 | 4.0% |
| Arts & Humanities | 2,411 | 4.6% |
| Total | 52,217 | 100.0% |
Transportation & Commute in Ulster County
Vehicle Availability by Sex in Ulster County
The most prevalent vehicle ownership categories in Ulster County are males with 2 vehicles (17,357, accounting for 40.9%) and females with 2 vehicles (15,960, making up 43.2%).
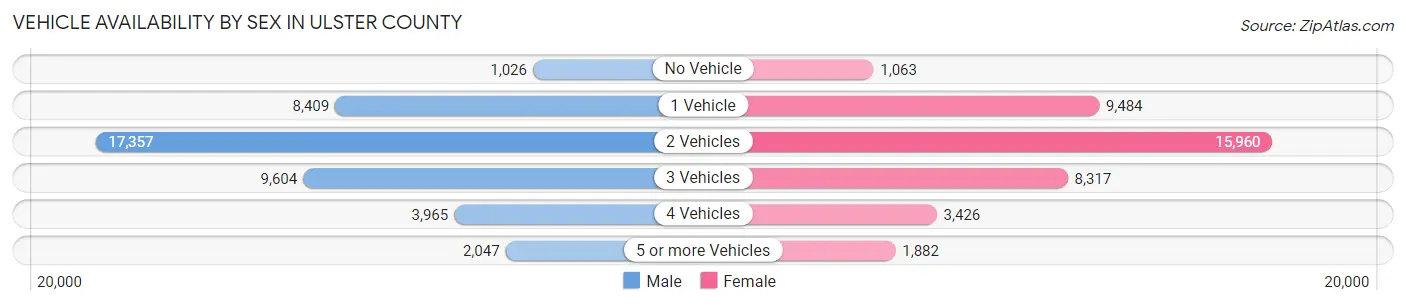
| Vehicles Available | Male | Female |
| No Vehicle | 1,026 (2.4%) | 1,063 (2.6%) |
| 1 Vehicle | 8,409 (19.8%) | 9,484 (23.6%) |
| 2 Vehicles | 17,357 (40.9%) | 15,960 (39.8%) |
| 3 Vehicles | 9,604 (22.7%) | 8,317 (20.7%) |
| 4 Vehicles | 3,965 (9.3%) | 3,426 (8.5%) |
| 5 or more Vehicles | 2,047 (4.8%) | 1,882 (4.7%) |
| Total | 42,408 (100.0%) | 40,132 (100.0%) |
Commute Time in Ulster County
The most frequently occuring commute durations in Ulster County are 10 to 14 minutes (10,959 commuters, 15.2%), 15 to 19 minutes (10,561 commuters, 14.7%), and 20 to 24 minutes (8,937 commuters, 12.4%).
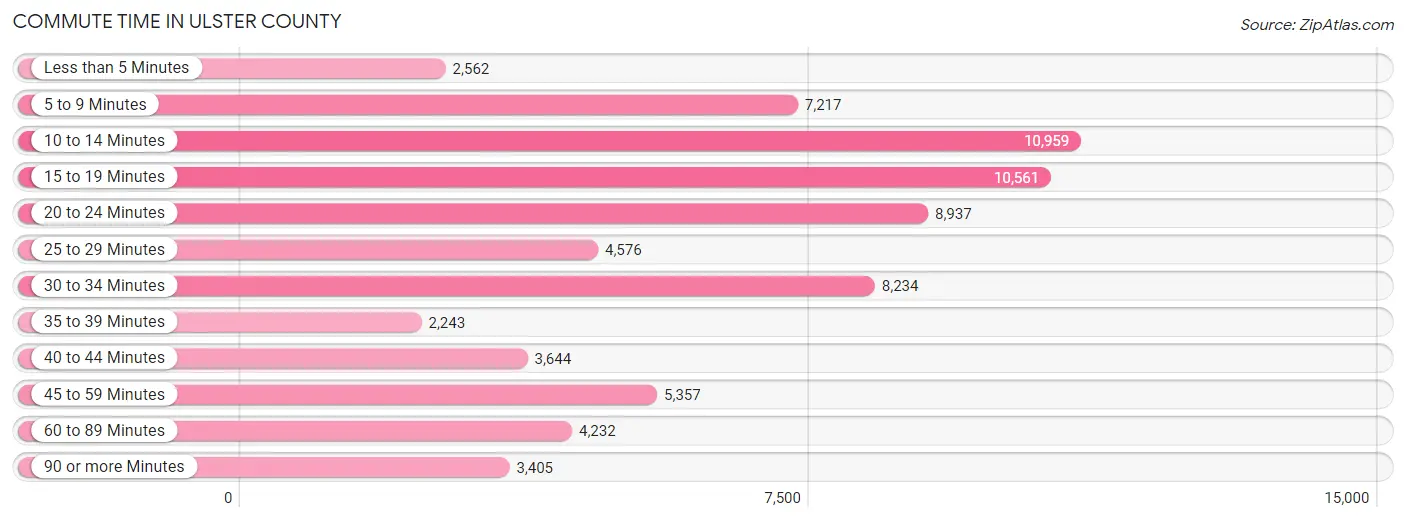
| Commute Time | # Commuters | % Commuters |
| Less than 5 Minutes | 2,562 | 3.6% |
| 5 to 9 Minutes | 7,217 | 10.0% |
| 10 to 14 Minutes | 10,959 | 15.2% |
| 15 to 19 Minutes | 10,561 | 14.7% |
| 20 to 24 Minutes | 8,937 | 12.4% |
| 25 to 29 Minutes | 4,576 | 6.4% |
| 30 to 34 Minutes | 8,234 | 11.5% |
| 35 to 39 Minutes | 2,243 | 3.1% |
| 40 to 44 Minutes | 3,644 | 5.1% |
| 45 to 59 Minutes | 5,357 | 7.4% |
| 60 to 89 Minutes | 4,232 | 5.9% |
| 90 or more Minutes | 3,405 | 4.7% |
Commute Time by Sex in Ulster County
The most common commute times in Ulster County are 10 to 14 minutes (5,341 commuters, 14.4%) for males and 10 to 14 minutes (5,618 commuters, 16.2%) for females.
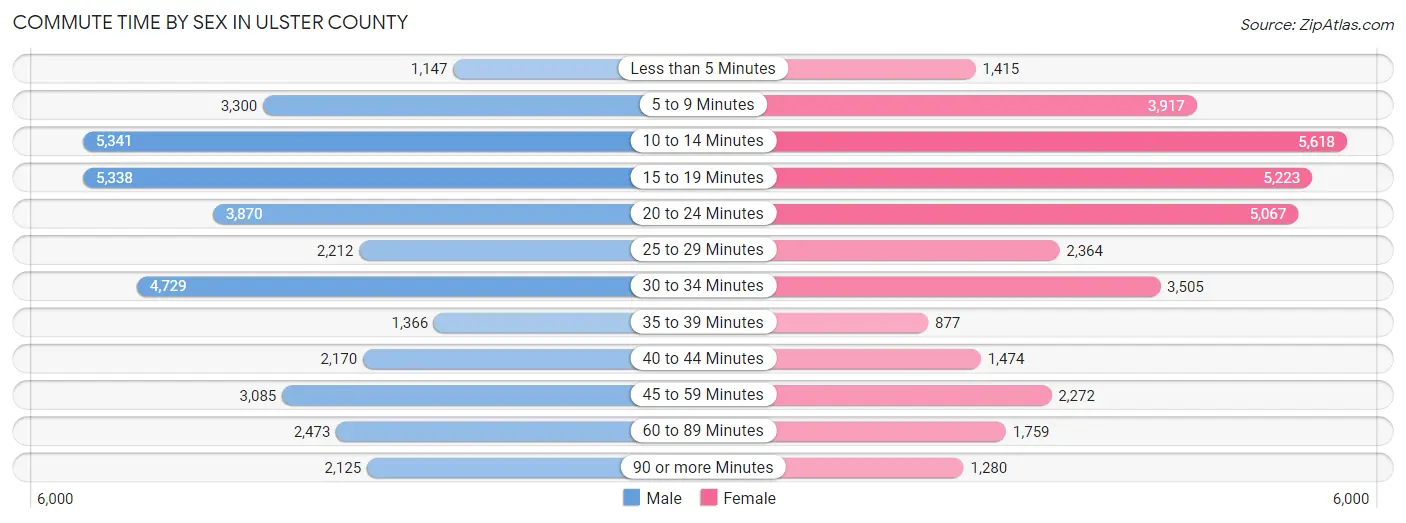
| Commute Time | Male | Female |
| Less than 5 Minutes | 1,147 (3.1%) | 1,415 (4.1%) |
| 5 to 9 Minutes | 3,300 (8.9%) | 3,917 (11.3%) |
| 10 to 14 Minutes | 5,341 (14.4%) | 5,618 (16.2%) |
| 15 to 19 Minutes | 5,338 (14.4%) | 5,223 (15.0%) |
| 20 to 24 Minutes | 3,870 (10.4%) | 5,067 (14.6%) |
| 25 to 29 Minutes | 2,212 (5.9%) | 2,364 (6.8%) |
| 30 to 34 Minutes | 4,729 (12.7%) | 3,505 (10.1%) |
| 35 to 39 Minutes | 1,366 (3.7%) | 877 (2.5%) |
| 40 to 44 Minutes | 2,170 (5.8%) | 1,474 (4.2%) |
| 45 to 59 Minutes | 3,085 (8.3%) | 2,272 (6.5%) |
| 60 to 89 Minutes | 2,473 (6.7%) | 1,759 (5.1%) |
| 90 or more Minutes | 2,125 (5.7%) | 1,280 (3.7%) |
Time of Departure to Work by Sex in Ulster County
The most frequent times of departure to work in Ulster County are 7:00 AM to 7:29 AM (4,798, 12.9%) for males and 7:30 AM to 7:59 AM (5,358, 15.4%) for females.
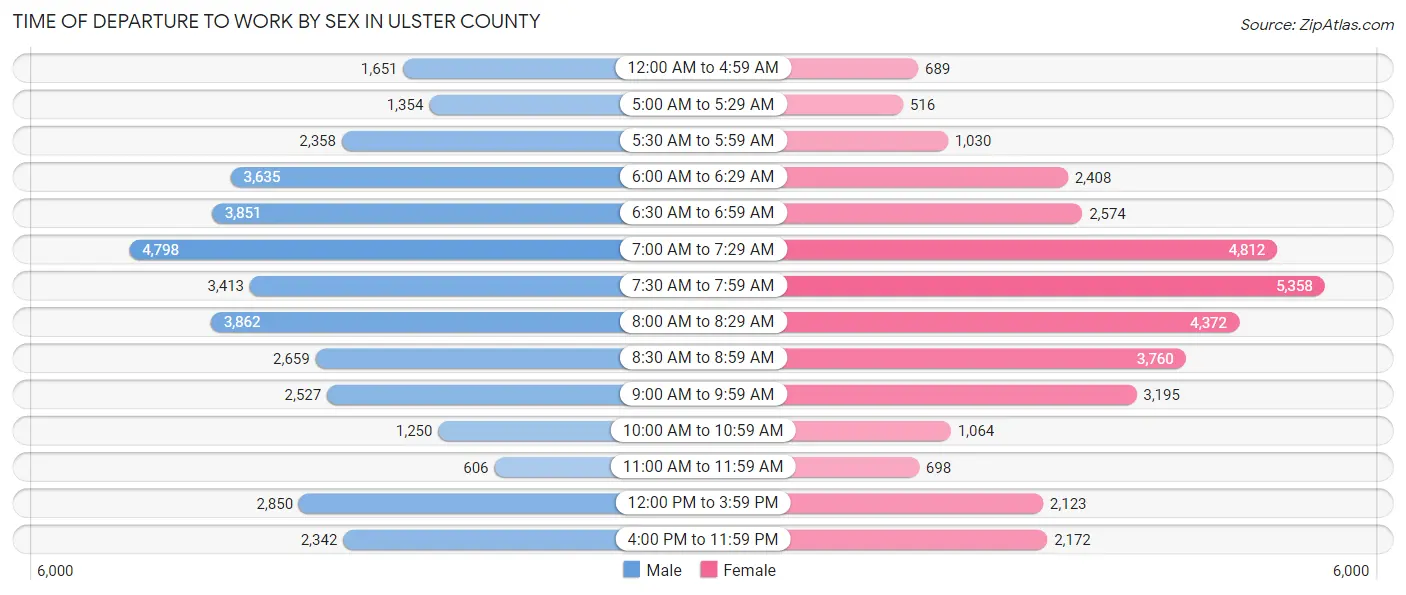
| Time of Departure | Male | Female |
| 12:00 AM to 4:59 AM | 1,651 (4.4%) | 689 (2.0%) |
| 5:00 AM to 5:29 AM | 1,354 (3.6%) | 516 (1.5%) |
| 5:30 AM to 5:59 AM | 2,358 (6.4%) | 1,030 (3.0%) |
| 6:00 AM to 6:29 AM | 3,635 (9.8%) | 2,408 (6.9%) |
| 6:30 AM to 6:59 AM | 3,851 (10.4%) | 2,574 (7.4%) |
| 7:00 AM to 7:29 AM | 4,798 (12.9%) | 4,812 (13.8%) |
| 7:30 AM to 7:59 AM | 3,413 (9.2%) | 5,358 (15.4%) |
| 8:00 AM to 8:29 AM | 3,862 (10.4%) | 4,372 (12.6%) |
| 8:30 AM to 8:59 AM | 2,659 (7.2%) | 3,760 (10.8%) |
| 9:00 AM to 9:59 AM | 2,527 (6.8%) | 3,195 (9.2%) |
| 10:00 AM to 10:59 AM | 1,250 (3.4%) | 1,064 (3.1%) |
| 11:00 AM to 11:59 AM | 606 (1.6%) | 698 (2.0%) |
| 12:00 PM to 3:59 PM | 2,850 (7.7%) | 2,123 (6.1%) |
| 4:00 PM to 11:59 PM | 2,342 (6.3%) | 2,172 (6.2%) |
| Total | 37,156 (100.0%) | 34,771 (100.0%) |
Housing Occupancy in Ulster County
Occupancy by Ownership in Ulster County
Of the total 72,265 dwellings in Ulster County, owner-occupied units account for 49,975 (69.2%), while renter-occupied units make up 22,290 (30.8%).
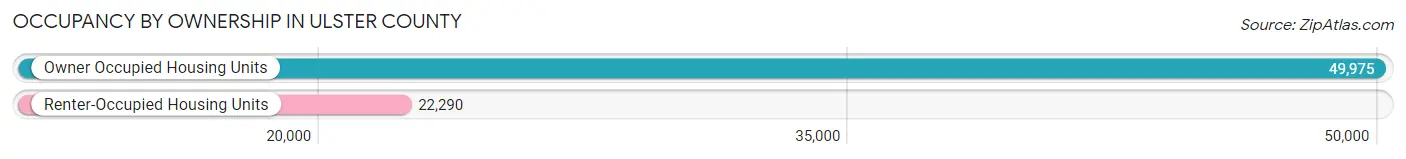
| Occupancy | # Housing Units | % Housing Units |
| Owner Occupied Housing Units | 49,975 | 69.2% |
| Renter-Occupied Housing Units | 22,290 | 30.8% |
| Total Occupied Housing Units | 72,265 | 100.0% |
Occupancy by Household Size in Ulster County
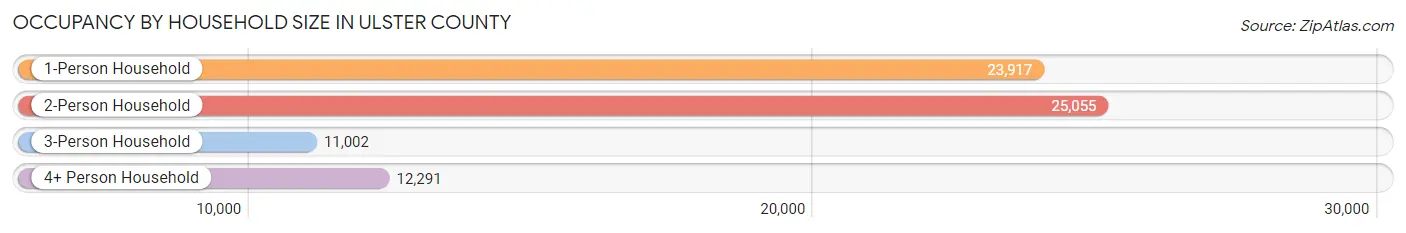
| Household Size | # Housing Units | % Housing Units |
| 1-Person Household | 23,917 | 33.1% |
| 2-Person Household | 25,055 | 34.7% |
| 3-Person Household | 11,002 | 15.2% |
| 4+ Person Household | 12,291 | 17.0% |
| Total Housing Units | 72,265 | 100.0% |
Occupancy by Ownership by Household Size in Ulster County
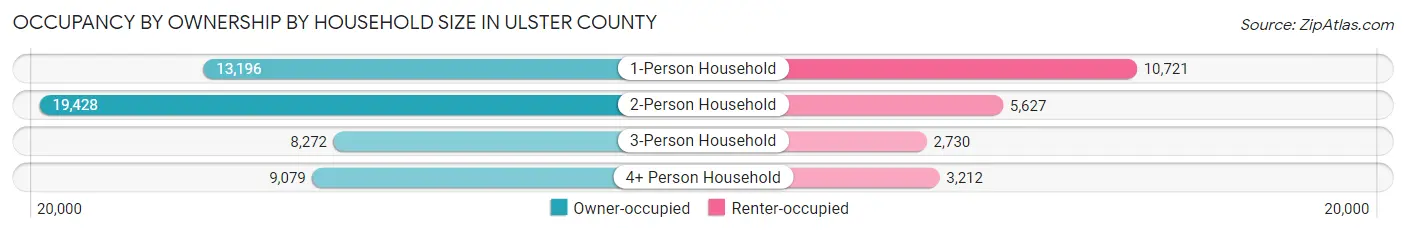
| Household Size | Owner-occupied | Renter-occupied |
| 1-Person Household | 13,196 (55.2%) | 10,721 (44.8%) |
| 2-Person Household | 19,428 (77.5%) | 5,627 (22.5%) |
| 3-Person Household | 8,272 (75.2%) | 2,730 (24.8%) |
| 4+ Person Household | 9,079 (73.9%) | 3,212 (26.1%) |
| Total Housing Units | 49,975 (69.2%) | 22,290 (30.8%) |
Occupancy by Educational Attainment in Ulster County
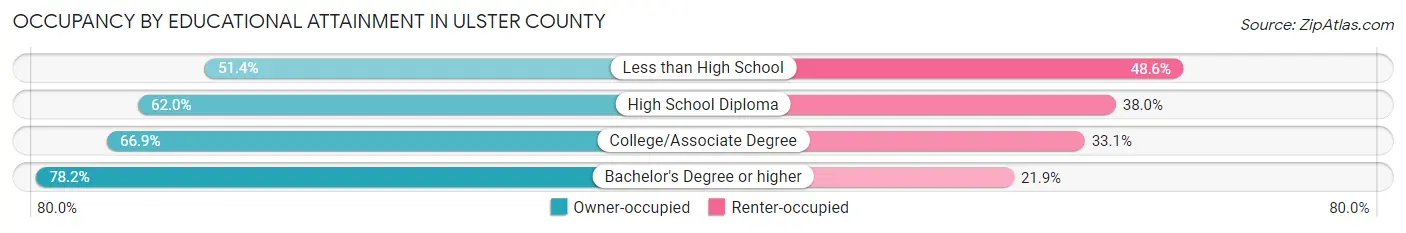
| Household Size | Owner-occupied | Renter-occupied |
| Less than High School | 2,494 (51.4%) | 2,362 (48.6%) |
| High School Diploma | 10,707 (62.0%) | 6,566 (38.0%) |
| College/Associate Degree | 14,347 (66.9%) | 7,091 (33.1%) |
| Bachelor's Degree or higher | 22,427 (78.1%) | 6,271 (21.8%) |
Occupancy by Age of Householder in Ulster County
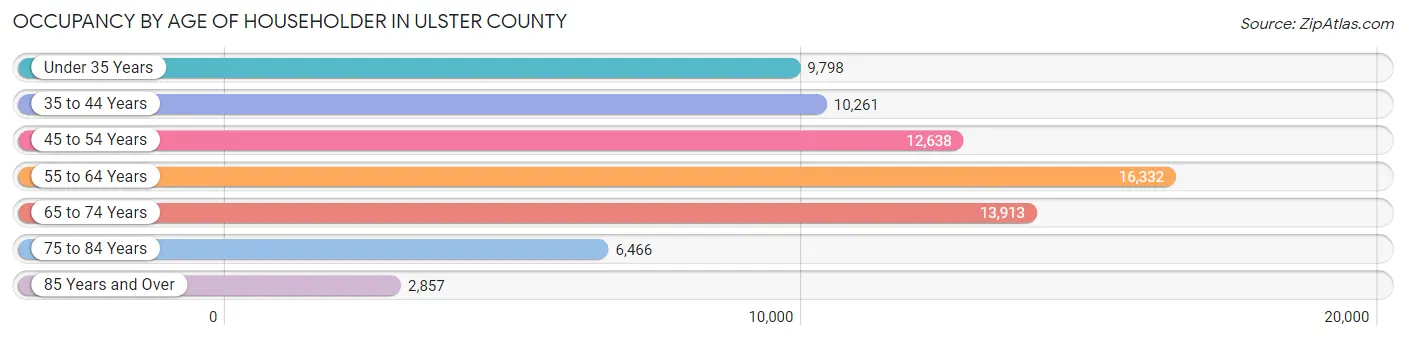
| Age Bracket | # Households | % Households |
| Under 35 Years | 9,798 | 13.6% |
| 35 to 44 Years | 10,261 | 14.2% |
| 45 to 54 Years | 12,638 | 17.5% |
| 55 to 64 Years | 16,332 | 22.6% |
| 65 to 74 Years | 13,913 | 19.3% |
| 75 to 84 Years | 6,466 | 8.9% |
| 85 Years and Over | 2,857 | 4.0% |
| Total | 72,265 | 100.0% |
Housing Finances in Ulster County
Median Income by Occupancy in Ulster County
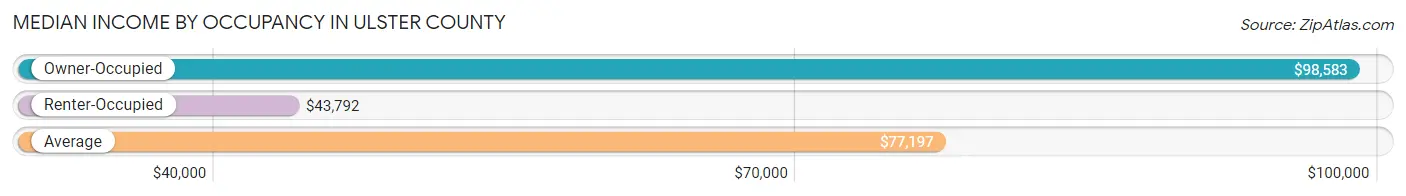
| Occupancy Type | # Households | Median Income |
| Owner-Occupied | 49,975 (69.2%) | $98,583 |
| Renter-Occupied | 22,290 (30.8%) | $43,792 |
| Average | 72,265 (100.0%) | $77,197 |
Occupancy by Householder Income Bracket in Ulster County
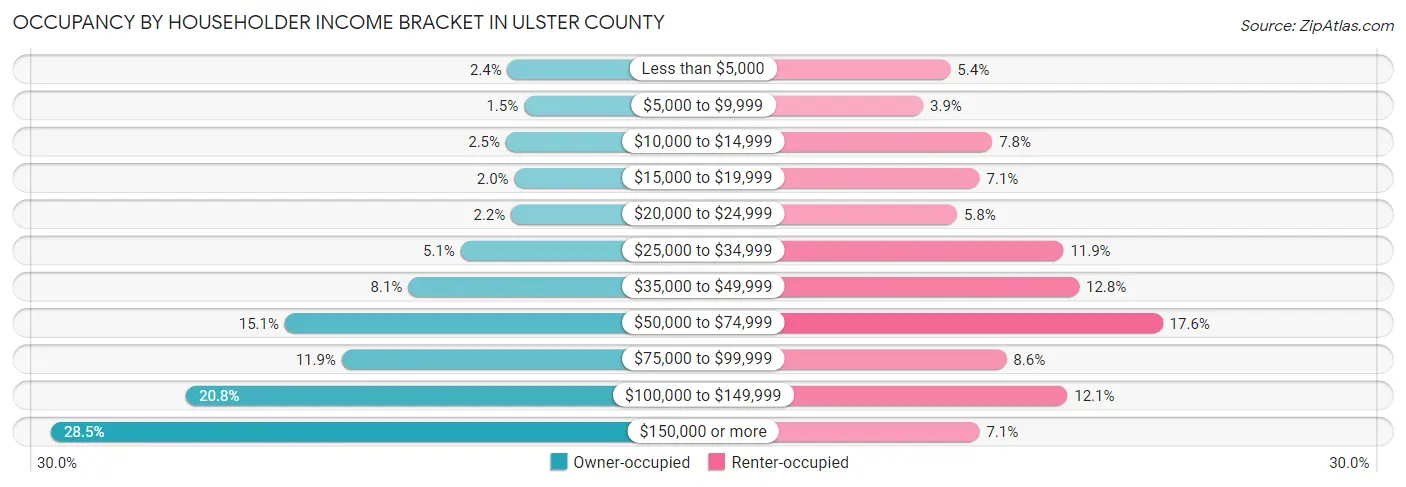
| Income Bracket | Owner-occupied | Renter-occupied |
| Less than $5,000 | 1,197 (2.4%) | 1,209 (5.4%) |
| $5,000 to $9,999 | 731 (1.5%) | 861 (3.9%) |
| $10,000 to $14,999 | 1,249 (2.5%) | 1,740 (7.8%) |
| $15,000 to $19,999 | 1,005 (2.0%) | 1,581 (7.1%) |
| $20,000 to $24,999 | 1,101 (2.2%) | 1,293 (5.8%) |
| $25,000 to $34,999 | 2,538 (5.1%) | 2,649 (11.9%) |
| $35,000 to $49,999 | 4,037 (8.1%) | 2,847 (12.8%) |
| $50,000 to $74,999 | 7,562 (15.1%) | 3,913 (17.5%) |
| $75,000 to $99,999 | 5,936 (11.9%) | 1,922 (8.6%) |
| $100,000 to $149,999 | 10,380 (20.8%) | 2,696 (12.1%) |
| $150,000 or more | 14,239 (28.5%) | 1,579 (7.1%) |
| Total | 49,975 (100.0%) | 22,290 (100.0%) |
Monthly Housing Cost Tiers in Ulster County
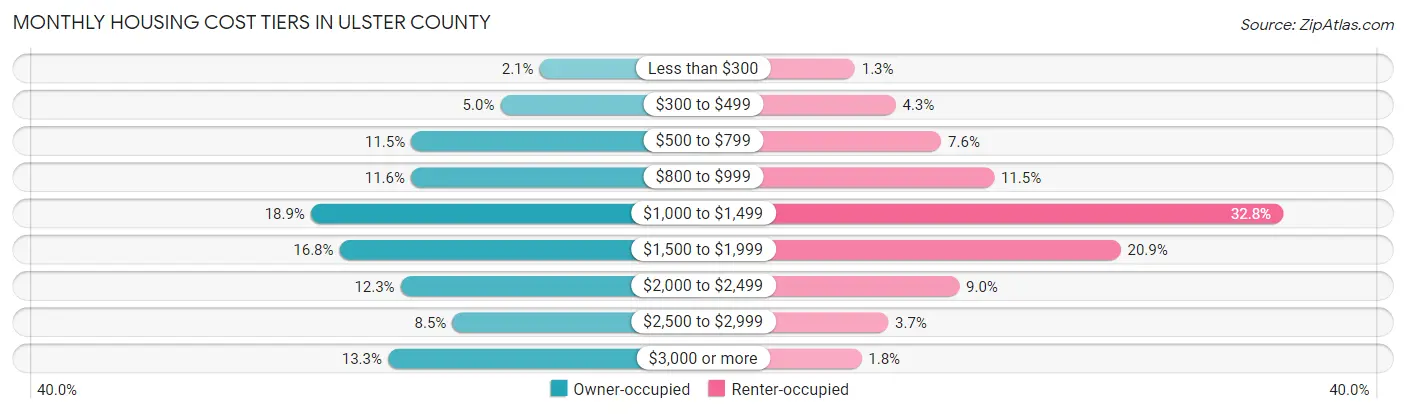
| Monthly Cost | Owner-occupied | Renter-occupied |
| Less than $300 | 1,045 (2.1%) | 286 (1.3%) |
| $300 to $499 | 2,484 (5.0%) | 954 (4.3%) |
| $500 to $799 | 5,768 (11.5%) | 1,704 (7.6%) |
| $800 to $999 | 5,778 (11.6%) | 2,570 (11.5%) |
| $1,000 to $1,499 | 9,462 (18.9%) | 7,313 (32.8%) |
| $1,500 to $1,999 | 8,404 (16.8%) | 4,647 (20.8%) |
| $2,000 to $2,499 | 6,157 (12.3%) | 1,997 (9.0%) |
| $2,500 to $2,999 | 4,255 (8.5%) | 832 (3.7%) |
| $3,000 or more | 6,622 (13.3%) | 393 (1.8%) |
| Total | 49,975 (100.0%) | 22,290 (100.0%) |
Physical Housing Characteristics in Ulster County
Housing Structures in Ulster County
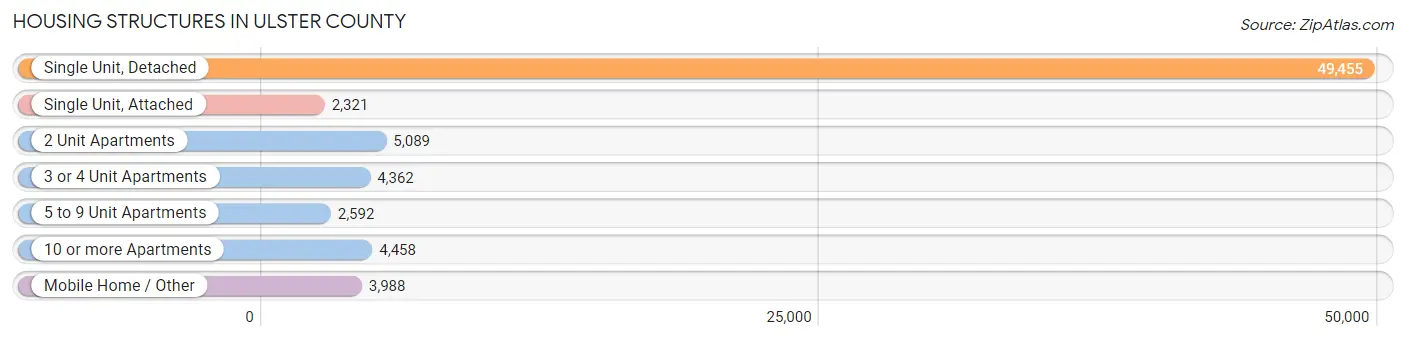
| Structure Type | # Housing Units | % Housing Units |
| Single Unit, Detached | 49,455 | 68.4% |
| Single Unit, Attached | 2,321 | 3.2% |
| 2 Unit Apartments | 5,089 | 7.0% |
| 3 or 4 Unit Apartments | 4,362 | 6.0% |
| 5 to 9 Unit Apartments | 2,592 | 3.6% |
| 10 or more Apartments | 4,458 | 6.2% |
| Mobile Home / Other | 3,988 | 5.5% |
| Total | 72,265 | 100.0% |
Housing Structures by Occupancy in Ulster County
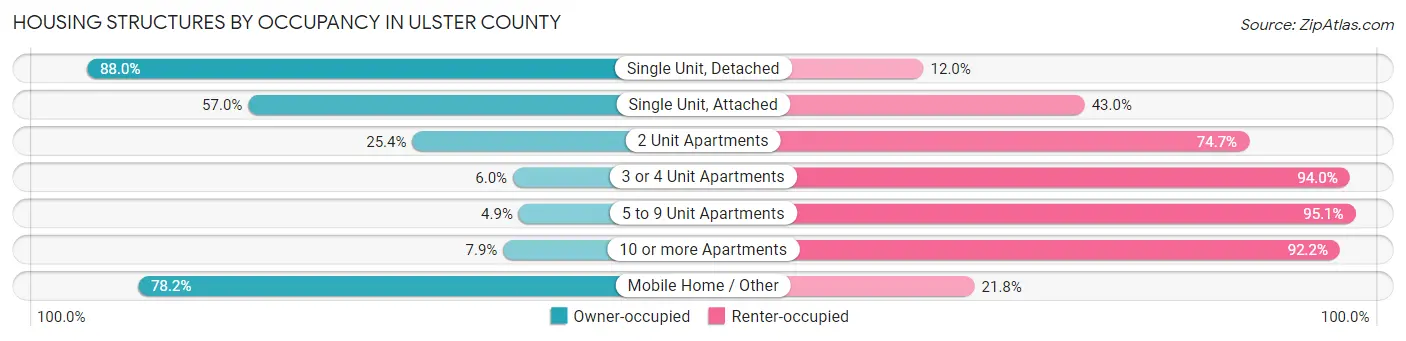
| Structure Type | Owner-occupied | Renter-occupied |
| Single Unit, Detached | 43,509 (88.0%) | 5,946 (12.0%) |
| Single Unit, Attached | 1,322 (57.0%) | 999 (43.0%) |
| 2 Unit Apartments | 1,290 (25.4%) | 3,799 (74.7%) |
| 3 or 4 Unit Apartments | 261 (6.0%) | 4,101 (94.0%) |
| 5 to 9 Unit Apartments | 126 (4.9%) | 2,466 (95.1%) |
| 10 or more Apartments | 350 (7.9%) | 4,108 (92.1%) |
| Mobile Home / Other | 3,117 (78.2%) | 871 (21.8%) |
| Total | 49,975 (69.2%) | 22,290 (30.8%) |
Housing Structures by Number of Rooms in Ulster County
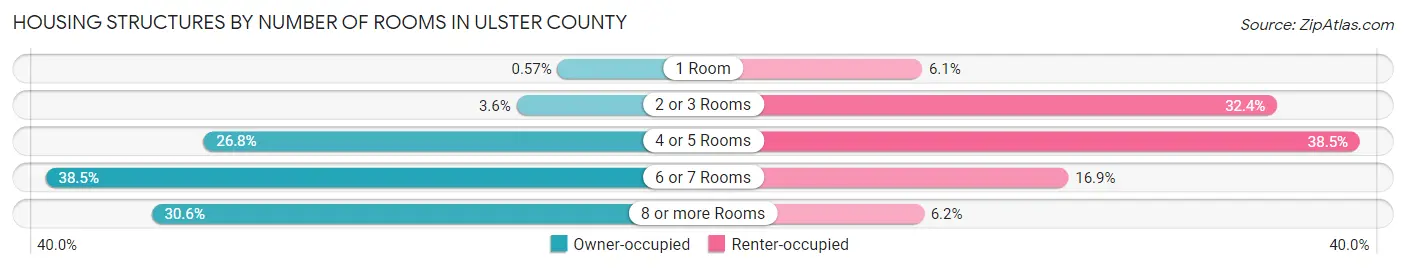
| Number of Rooms | Owner-occupied | Renter-occupied |
| 1 Room | 284 (0.6%) | 1,354 (6.1%) |
| 2 or 3 Rooms | 1,800 (3.6%) | 7,210 (32.4%) |
| 4 or 5 Rooms | 13,379 (26.8%) | 8,576 (38.5%) |
| 6 or 7 Rooms | 19,214 (38.5%) | 3,768 (16.9%) |
| 8 or more Rooms | 15,298 (30.6%) | 1,382 (6.2%) |
| Total | 49,975 (100.0%) | 22,290 (100.0%) |
Housing Structure by Heating Type in Ulster County
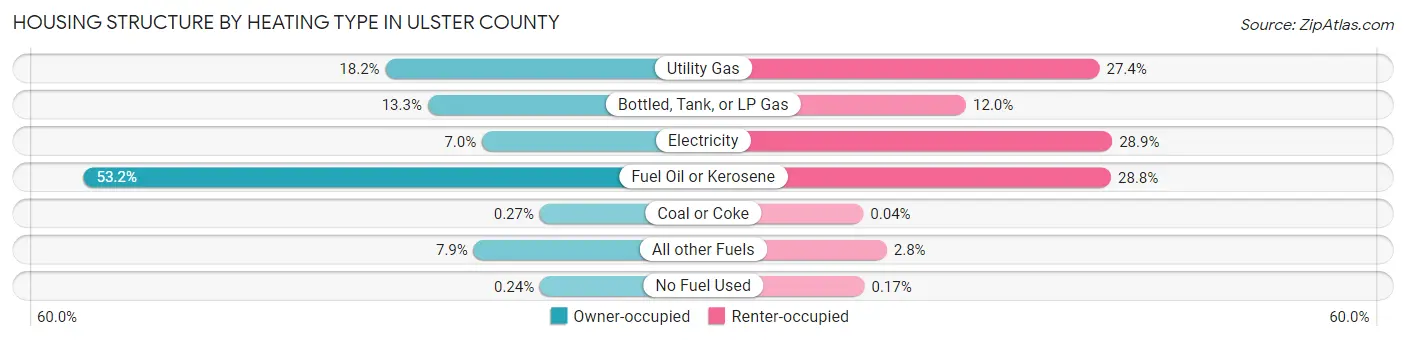
| Heating Type | Owner-occupied | Renter-occupied |
| Utility Gas | 9,078 (18.2%) | 6,112 (27.4%) |
| Bottled, Tank, or LP Gas | 6,625 (13.3%) | 2,664 (11.9%) |
| Electricity | 3,480 (7.0%) | 6,440 (28.9%) |
| Fuel Oil or Kerosene | 26,569 (53.2%) | 6,411 (28.8%) |
| Coal or Coke | 136 (0.3%) | 9 (0.0%) |
| All other Fuels | 3,968 (7.9%) | 616 (2.8%) |
| No Fuel Used | 119 (0.2%) | 38 (0.2%) |
| Total | 49,975 (100.0%) | 22,290 (100.0%) |
Household Vehicle Usage in Ulster County
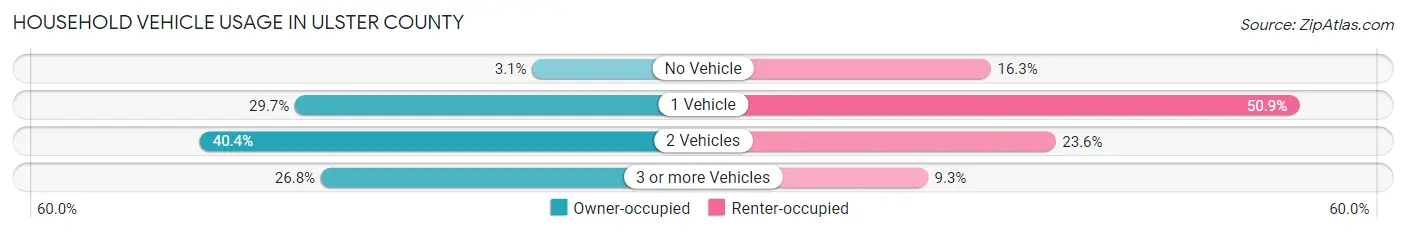
| Vehicles per Household | Owner-occupied | Renter-occupied |
| No Vehicle | 1,559 (3.1%) | 3,636 (16.3%) |
| 1 Vehicle | 14,845 (29.7%) | 11,338 (50.9%) |
| 2 Vehicles | 20,173 (40.4%) | 5,253 (23.6%) |
| 3 or more Vehicles | 13,398 (26.8%) | 2,063 (9.3%) |
| Total | 49,975 (100.0%) | 22,290 (100.0%) |
Real Estate & Mortgages in Ulster County
Real Estate and Mortgage Overview in Ulster County
| Characteristic | Without Mortgage | With Mortgage |
| Housing Units | 21,649 | 28,326 |
| Median Property Value | $264,100 | $309,800 |
| Median Household Income | $72,223 | $9,702 |
| Monthly Housing Costs | $899 | $6,403 |
| Real Estate Taxes | $5,434 | $446 |
Property Value by Mortgage Status in Ulster County
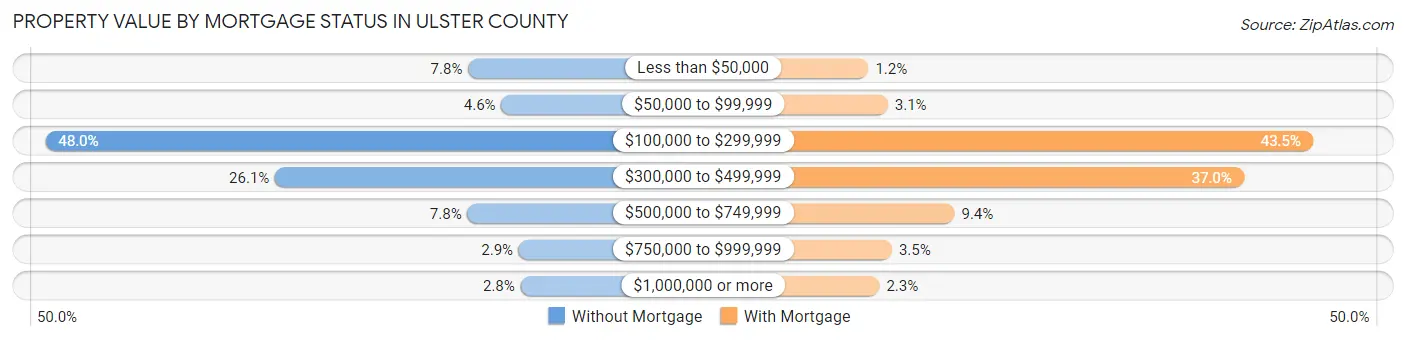
| Property Value | Without Mortgage | With Mortgage |
| Less than $50,000 | 1,677 (7.7%) | 349 (1.2%) |
| $50,000 to $99,999 | 994 (4.6%) | 872 (3.1%) |
| $100,000 to $299,999 | 10,396 (48.0%) | 12,333 (43.5%) |
| $300,000 to $499,999 | 5,659 (26.1%) | 10,472 (37.0%) |
| $500,000 to $749,999 | 1,692 (7.8%) | 2,670 (9.4%) |
| $750,000 to $999,999 | 633 (2.9%) | 984 (3.5%) |
| $1,000,000 or more | 598 (2.8%) | 646 (2.3%) |
| Total | 21,649 (100.0%) | 28,326 (100.0%) |
Household Income by Mortgage Status in Ulster County
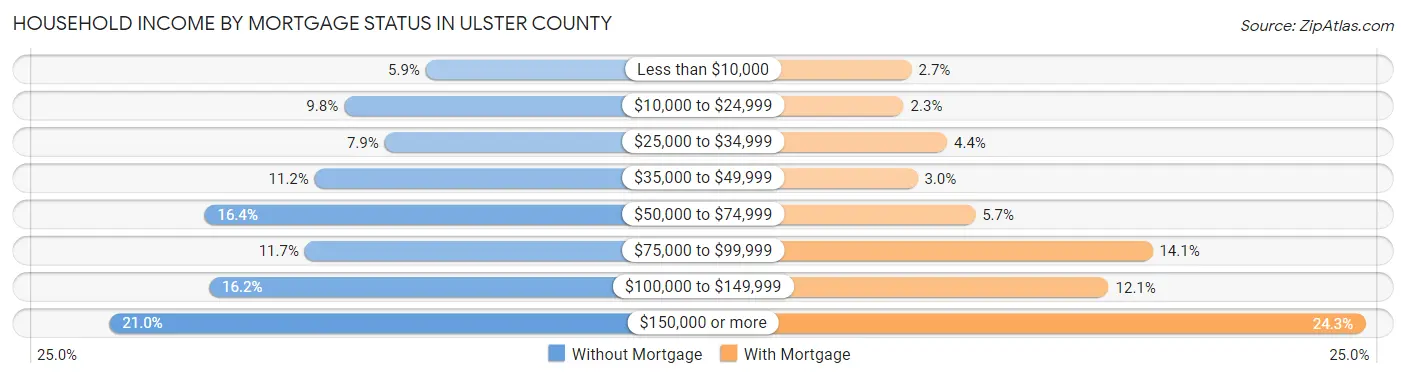
| Household Income | Without Mortgage | With Mortgage |
| Less than $10,000 | 1,278 (5.9%) | 757 (2.7%) |
| $10,000 to $24,999 | 2,119 (9.8%) | 650 (2.3%) |
| $25,000 to $34,999 | 1,702 (7.9%) | 1,236 (4.4%) |
| $35,000 to $49,999 | 2,423 (11.2%) | 836 (2.9%) |
| $50,000 to $74,999 | 3,557 (16.4%) | 1,614 (5.7%) |
| $75,000 to $99,999 | 2,524 (11.7%) | 4,005 (14.1%) |
| $100,000 to $149,999 | 3,509 (16.2%) | 3,412 (12.0%) |
| $150,000 or more | 4,537 (21.0%) | 6,871 (24.3%) |
| Total | 21,649 (100.0%) | 28,326 (100.0%) |
Property Value to Household Income Ratio in Ulster County
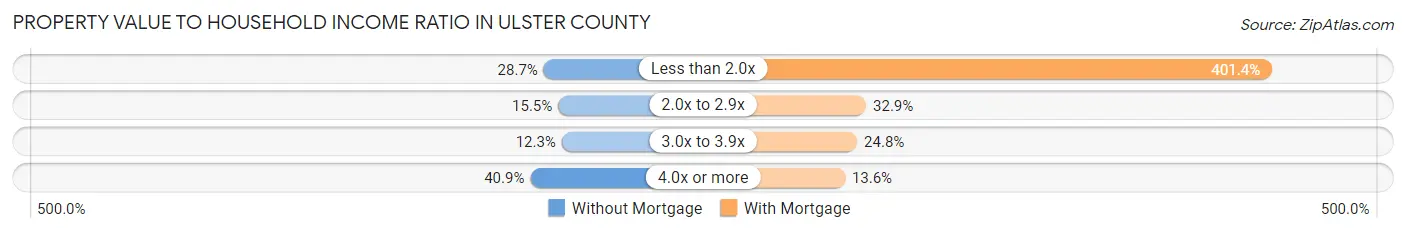
| Value-to-Income Ratio | Without Mortgage | With Mortgage |
| Less than 2.0x | 6,205 (28.7%) | 113,709 (401.4%) |
| 2.0x to 2.9x | 3,359 (15.5%) | 9,313 (32.9%) |
| 3.0x to 3.9x | 2,663 (12.3%) | 7,012 (24.7%) |
| 4.0x or more | 8,843 (40.8%) | 3,865 (13.6%) |
| Total | 21,649 (100.0%) | 28,326 (100.0%) |
Real Estate Taxes by Mortgage Status in Ulster County

| Property Taxes | Without Mortgage | With Mortgage |
| Less than $800 | 682 (3.2%) | 81 (0.3%) |
| $800 to $1,499 | 1,207 (5.6%) | 344 (1.2%) |
| $800 to $1,499 | 17,793 (82.2%) | 796 (2.8%) |
| Total | 21,649 (100.0%) | 28,326 (100.0%) |
Health & Disability in Ulster County
Health Insurance Coverage by Age in Ulster County
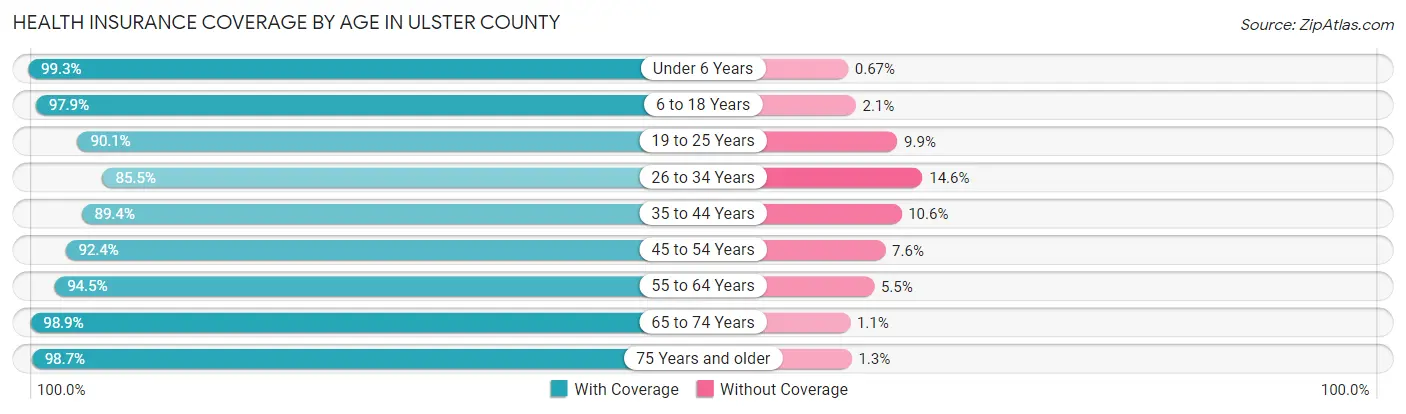
| Age Bracket | With Coverage | Without Coverage |
| Under 6 Years | 9,623 (99.3%) | 65 (0.7%) |
| 6 to 18 Years | 23,653 (97.9%) | 507 (2.1%) |
| 19 to 25 Years | 14,488 (90.1%) | 1,584 (9.9%) |
| 26 to 34 Years | 17,207 (85.5%) | 2,930 (14.5%) |
| 35 to 44 Years | 18,589 (89.4%) | 2,209 (10.6%) |
| 45 to 54 Years | 21,765 (92.4%) | 1,796 (7.6%) |
| 55 to 64 Years | 26,238 (94.5%) | 1,535 (5.5%) |
| 65 to 74 Years | 21,506 (98.9%) | 231 (1.1%) |
| 75 Years and older | 14,407 (98.7%) | 194 (1.3%) |
| Total | 167,476 (93.8%) | 11,051 (6.2%) |
Health Insurance Coverage by Citizenship Status in Ulster County

| Citizenship Status | With Coverage | Without Coverage |
| Native Born | 9,623 (99.3%) | 65 (0.7%) |
| Foreign Born, Citizen | 23,653 (97.9%) | 507 (2.1%) |
| Foreign Born, not a Citizen | 14,488 (90.1%) | 1,584 (9.9%) |
Health Insurance Coverage by Household Income in Ulster County
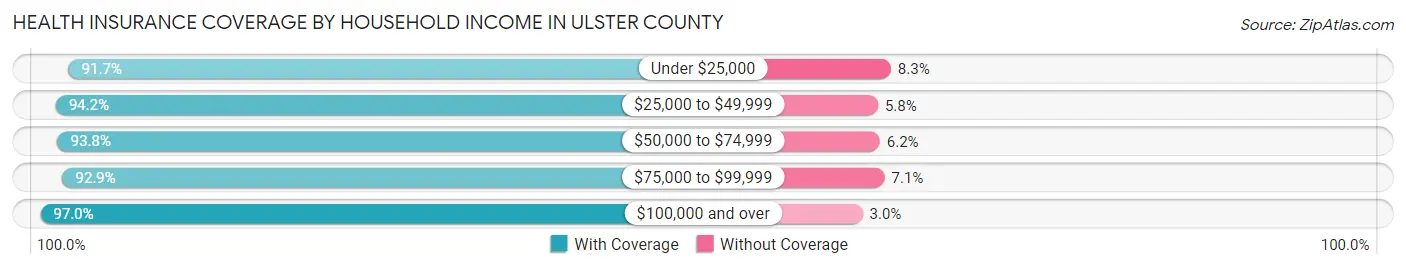
| Household Income | With Coverage | Without Coverage |
| Under $25,000 | 16,858 (91.7%) | 1,518 (8.3%) |
| $25,000 to $49,999 | 20,738 (94.2%) | 1,286 (5.8%) |
| $50,000 to $74,999 | 22,398 (93.8%) | 1,478 (6.2%) |
| $75,000 to $99,999 | 17,078 (92.9%) | 1,302 (7.1%) |
| $100,000 and over | 83,646 (97.0%) | 2,549 (3.0%) |
Public vs Private Health Insurance Coverage by Age in Ulster County
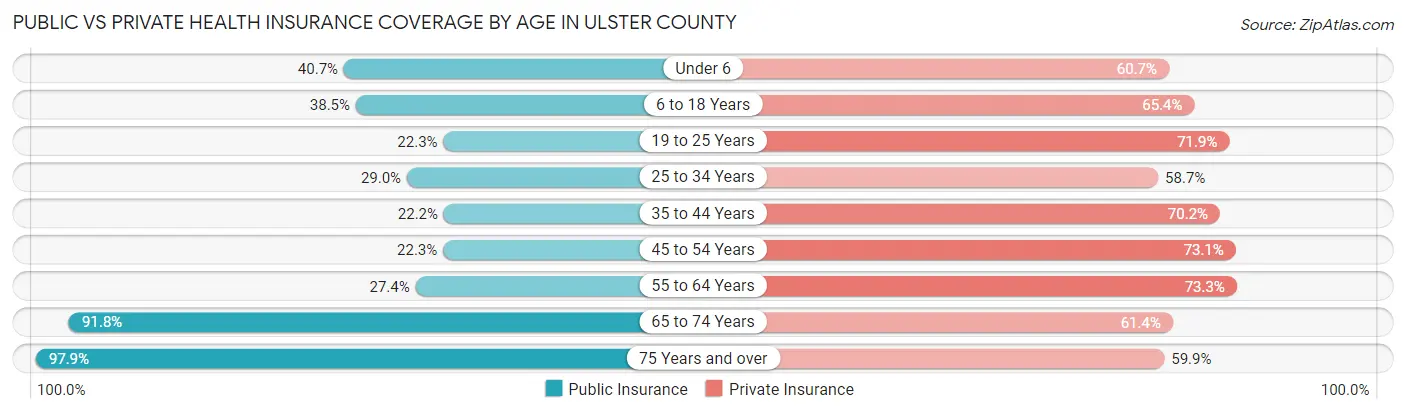
| Age Bracket | Public Insurance | Private Insurance |
| Under 6 | 3,946 (40.7%) | 5,881 (60.7%) |
| 6 to 18 Years | 9,304 (38.5%) | 15,808 (65.4%) |
| 19 to 25 Years | 3,578 (22.3%) | 11,557 (71.9%) |
| 25 to 34 Years | 5,845 (29.0%) | 11,824 (58.7%) |
| 35 to 44 Years | 4,613 (22.2%) | 14,595 (70.2%) |
| 45 to 54 Years | 5,259 (22.3%) | 17,225 (73.1%) |
| 55 to 64 Years | 7,620 (27.4%) | 20,355 (73.3%) |
| 65 to 74 Years | 19,948 (91.8%) | 13,350 (61.4%) |
| 75 Years and over | 14,298 (97.9%) | 8,740 (59.9%) |
| Total | 74,411 (41.7%) | 119,335 (66.8%) |
Disability Status by Sex by Age in Ulster County
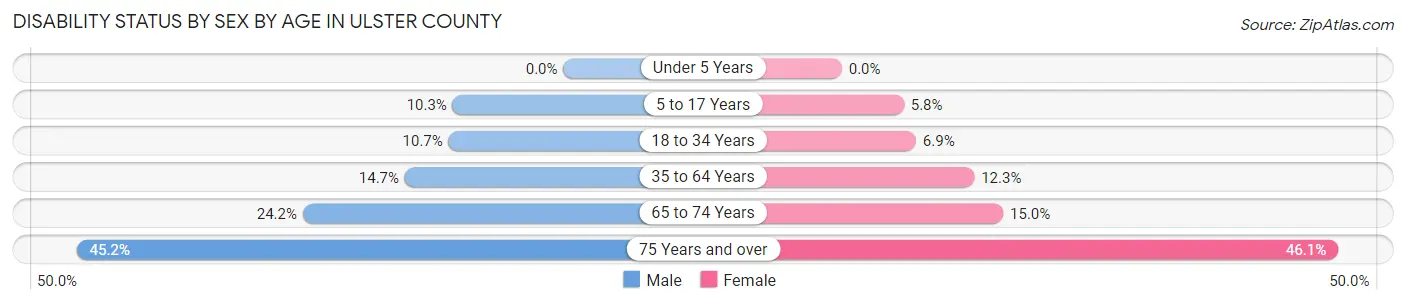
| Age Bracket | Male | Female |
| Under 5 Years | 0 (0.0%) | 0 (0.0%) |
| 5 to 17 Years | 1,220 (10.3%) | 675 (5.8%) |
| 18 to 34 Years | 2,081 (10.6%) | 1,314 (6.9%) |
| 35 to 64 Years | 5,298 (14.7%) | 4,438 (12.3%) |
| 65 to 74 Years | 2,505 (24.2%) | 1,703 (15.0%) |
| 75 Years and over | 2,811 (45.2%) | 3,858 (46.1%) |
Disability Class by Sex by Age in Ulster County
Disability Class: Hearing Difficulty
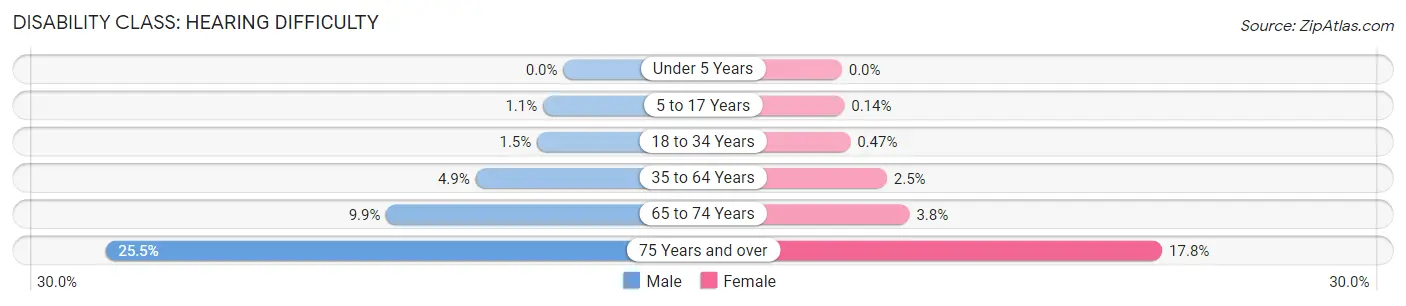
| Age Bracket | Male | Female |
| Under 5 Years | 0 (0.0%) | 0 (0.0%) |
| 5 to 17 Years | 134 (1.1%) | 16 (0.1%) |
| 18 to 34 Years | 285 (1.5%) | 90 (0.5%) |
| 35 to 64 Years | 1,762 (4.9%) | 908 (2.5%) |
| 65 to 74 Years | 1,022 (9.9%) | 429 (3.8%) |
| 75 Years and over | 1,587 (25.5%) | 1,495 (17.8%) |
Disability Class: Vision Difficulty
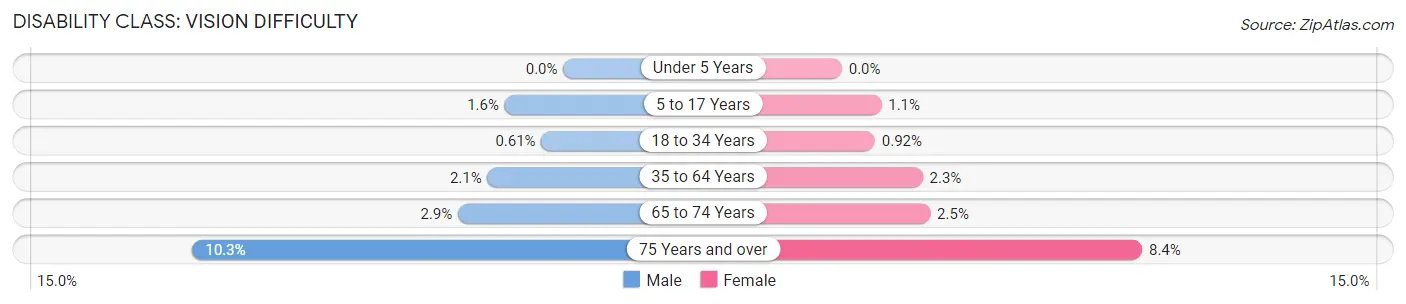
| Age Bracket | Male | Female |
| Under 5 Years | 0 (0.0%) | 0 (0.0%) |
| 5 to 17 Years | 194 (1.6%) | 129 (1.1%) |
| 18 to 34 Years | 120 (0.6%) | 175 (0.9%) |
| 35 to 64 Years | 761 (2.1%) | 811 (2.2%) |
| 65 to 74 Years | 304 (2.9%) | 280 (2.5%) |
| 75 Years and over | 643 (10.3%) | 700 (8.4%) |
Disability Class: Cognitive Difficulty
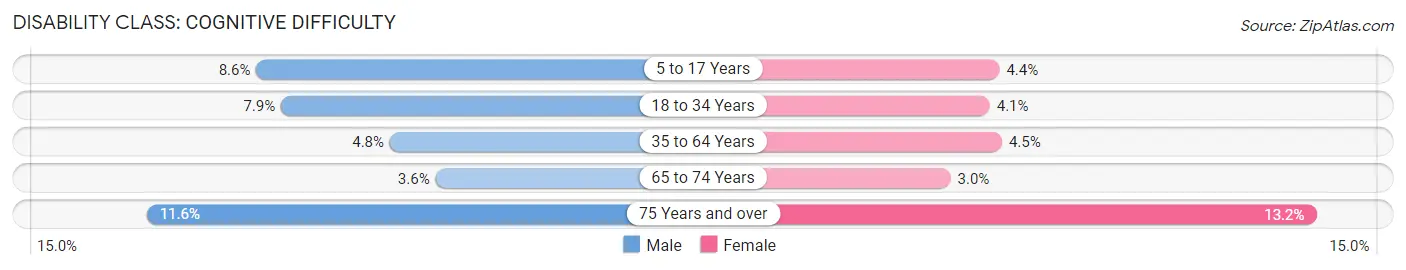
| Age Bracket | Male | Female |
| 5 to 17 Years | 1,015 (8.6%) | 516 (4.4%) |
| 18 to 34 Years | 1,535 (7.9%) | 787 (4.1%) |
| 35 to 64 Years | 1,741 (4.8%) | 1,610 (4.5%) |
| 65 to 74 Years | 369 (3.6%) | 345 (3.0%) |
| 75 Years and over | 722 (11.6%) | 1,107 (13.2%) |
Disability Class: Ambulatory Difficulty
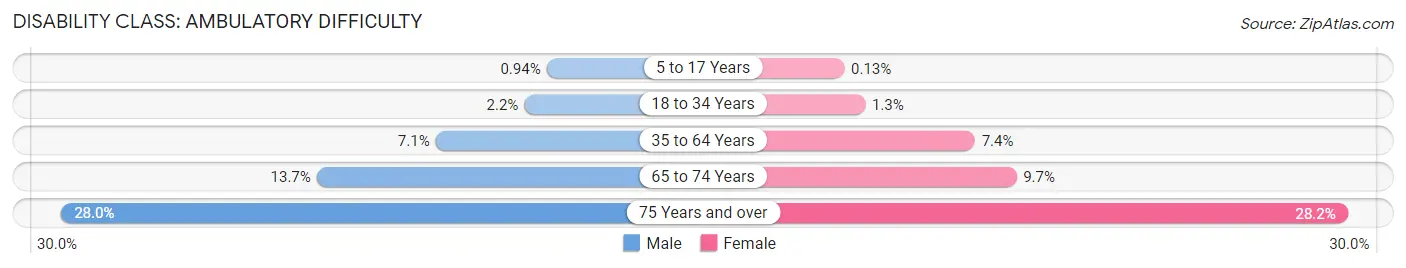
| Age Bracket | Male | Female |
| 5 to 17 Years | 112 (0.9%) | 15 (0.1%) |
| 18 to 34 Years | 425 (2.2%) | 246 (1.3%) |
| 35 to 64 Years | 2,564 (7.1%) | 2,674 (7.4%) |
| 65 to 74 Years | 1,423 (13.7%) | 1,105 (9.7%) |
| 75 Years and over | 1,740 (28.0%) | 2,359 (28.2%) |
Disability Class: Self-Care Difficulty
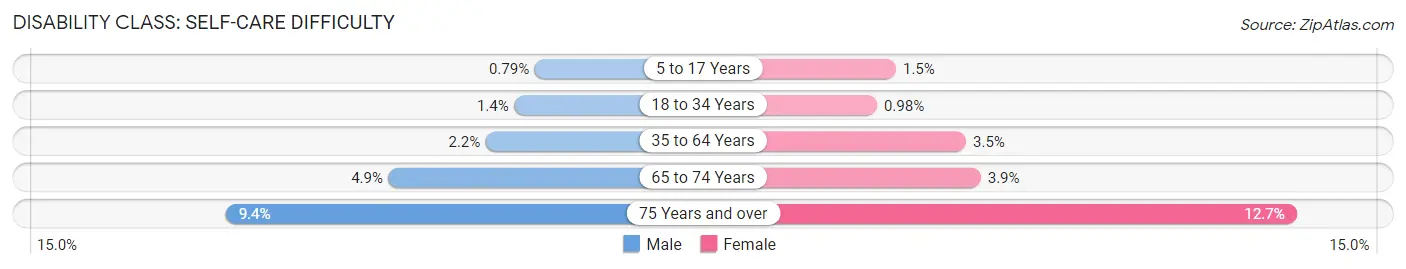
| Age Bracket | Male | Female |
| 5 to 17 Years | 94 (0.8%) | 177 (1.5%) |
| 18 to 34 Years | 266 (1.4%) | 187 (1.0%) |
| 35 to 64 Years | 776 (2.1%) | 1,248 (3.5%) |
| 65 to 74 Years | 504 (4.9%) | 440 (3.9%) |
| 75 Years and over | 585 (9.4%) | 1,061 (12.7%) |
Technology Access in Ulster County
Computing Device Access in Ulster County
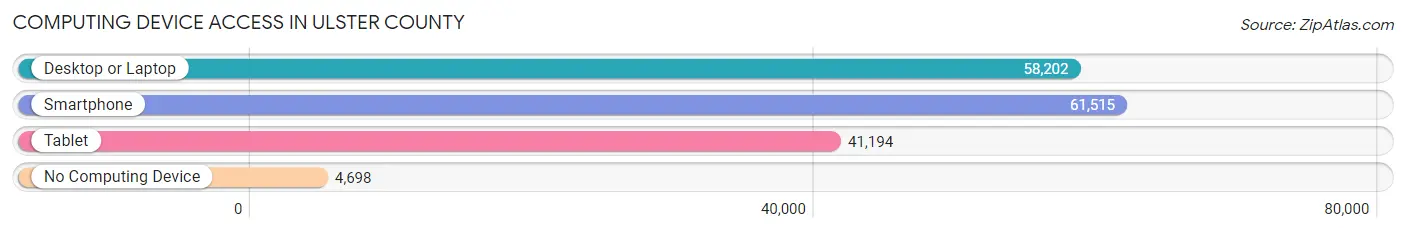
| Device Type | # Households | % Households |
| Desktop or Laptop | 58,202 | 80.5% |
| Smartphone | 61,515 | 85.1% |
| Tablet | 41,194 | 57.0% |
| No Computing Device | 4,698 | 6.5% |
| Total | 72,265 | 100.0% |
Internet Access in Ulster County
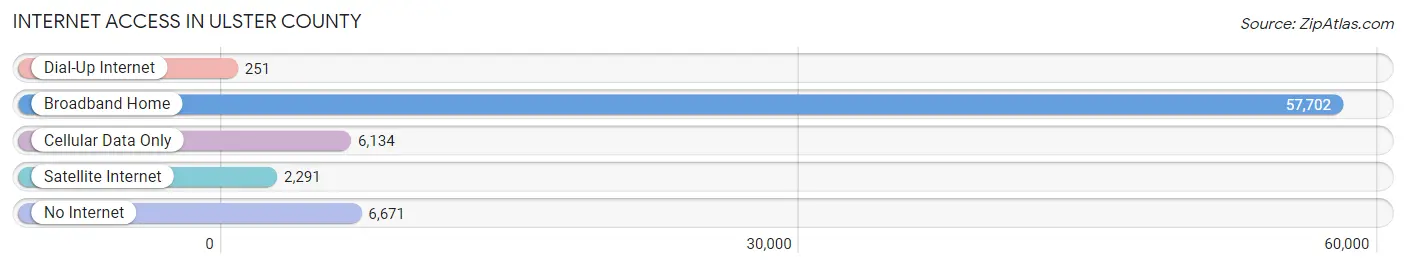
| Internet Type | # Households | % Households |
| Dial-Up Internet | 251 | 0.4% |
| Broadband Home | 57,702 | 79.8% |
| Cellular Data Only | 6,134 | 8.5% |
| Satellite Internet | 2,291 | 3.2% |
| No Internet | 6,671 | 9.2% |
| Total | 72,265 | 100.0% |
Ulster County Summary
Ulster County is located in the southeastern part of New York State, in the Hudson Valley region. It is bordered by Sullivan County to the west, Greene County to the south, Dutchess County to the east, and Orange County to the north. The county seat is the city of Kingston, which is also the county’s largest city. The county has a total area of 1,161 square miles, making it the fourth-largest county in New York State.
History
Ulster County was established in 1683, when it was separated from Albany County. It was named after the Irish province of Ulster, which was the homeland of many of the early settlers. The county was originally part of the New Netherland colony, and was later part of the Province of New York. During the American Revolution, the county was the site of several battles, including the Battle of Minisink and the Battle of Kingston.
In the 19th century, Ulster County was an important center of the Hudson River School of painting. The county was also home to several prominent writers, including Washington Irving and Herman Melville.
Geography
Ulster County is located in the southeastern part of New York State, in the Hudson Valley region. It is bordered by Sullivan County to the west, Greene County to the south, Dutchess County to the east, and Orange County to the north. The county has a total area of 1,161 square miles, making it the fourth-largest county in New York State.
The terrain of Ulster County is mostly hilly, with the Catskill Mountains to the west and the Shawangunk Ridge to the east. The highest point in the county is Slide Mountain, which has an elevation of 4,180 feet. The county is drained by the Rondout Creek and the Wallkill River.
Economy
The economy of Ulster County is largely based on tourism, agriculture, and manufacturing. The county is home to several popular tourist attractions, including the Catskill Mountains, the Shawangunk Ridge, and the Hudson River. Agriculture is also an important part of the economy, with dairy farming and apple orchards being the main crops.
Manufacturing is also an important part of the economy, with companies such as IBM, PepsiCo, and General Electric having operations in the county. The county is also home to several colleges and universities, including SUNY New Paltz and Marist College.
Demographics
As of the 2010 census, Ulster County had a population of 182,493. The racial makeup of the county was 87.3% White, 8.2% Black or African American, 0.4% Native American, 1.7% Asian, 0.1% Pacific Islander, and 1.3% from other races. Hispanic or Latino of any race were 6.7% of the population.
The median household income in the county was $54,818, and the median family income was $63,917. The per capita income was $27,837. About 10.2% of the population was below the poverty line.
The largest ancestry groups in Ulster County are Irish (25.2%), Italian (17.2%), German (14.2%), and English (13.2%). The county is also home to a large number of Dutch, Polish, and French Canadians. The county is served by several major highways, including Interstate 87, Interstate 84, and U.S. Route 9W.
Common Questions
What is Per Capita Income in Ulster County?
Per Capita income in Ulster County is $43,168.
What is the Median Family Income in Ulster County?
Median Family Income in Ulster County is $104,189.
What is the Median Household income in Ulster County?
Median Household Income in Ulster County is $77,197.
What is Income or Wage Gap in Ulster County?
Income or Wage Gap in Ulster County is 27.4%.
Women in Ulster County earn 72.6 cents for every dollar earned by a man.
What is Family Income Deficit in Ulster County?
Family Income Deficit in Ulster County is $12,347.
Families that are below poverty line in Ulster County earn $12,347 less on average than the poverty threshold level.
What is Inequality or Gini Index in Ulster County?
Inequality or Gini Index in Ulster County is 0.48.
What is the Total Population of Ulster County?
Total Population of Ulster County is 182,153.
What is the Total Male Population of Ulster County?
Total Male Population of Ulster County is 90,973.
What is the Total Female Population of Ulster County?
Total Female Population of Ulster County is 91,180.
What is the Ratio of Males per 100 Females in Ulster County?
There are 99.77 Males per 100 Females in Ulster County.
What is the Ratio of Females per 100 Males in Ulster County?
There are 100.23 Females per 100 Males in Ulster County.
What is the Median Population Age in Ulster County?
Median Population Age in Ulster County is 44.2 Years.
What is the Average Family Size in Ulster County
Average Family Size in Ulster County is 3.0 People.
What is the Average Household Size in Ulster County
Average Household Size in Ulster County is 2.3 People.
How Large is the Labor Force in Ulster County?
There are 91,120 People in the Labor Forcein in Ulster County.
What is the Percentage of People in the Labor Force in Ulster County?
58.9% of People are in the Labor Force in Ulster County.
What is the Unemployment Rate in Ulster County?
Unemployment Rate in Ulster County is 5.1%.