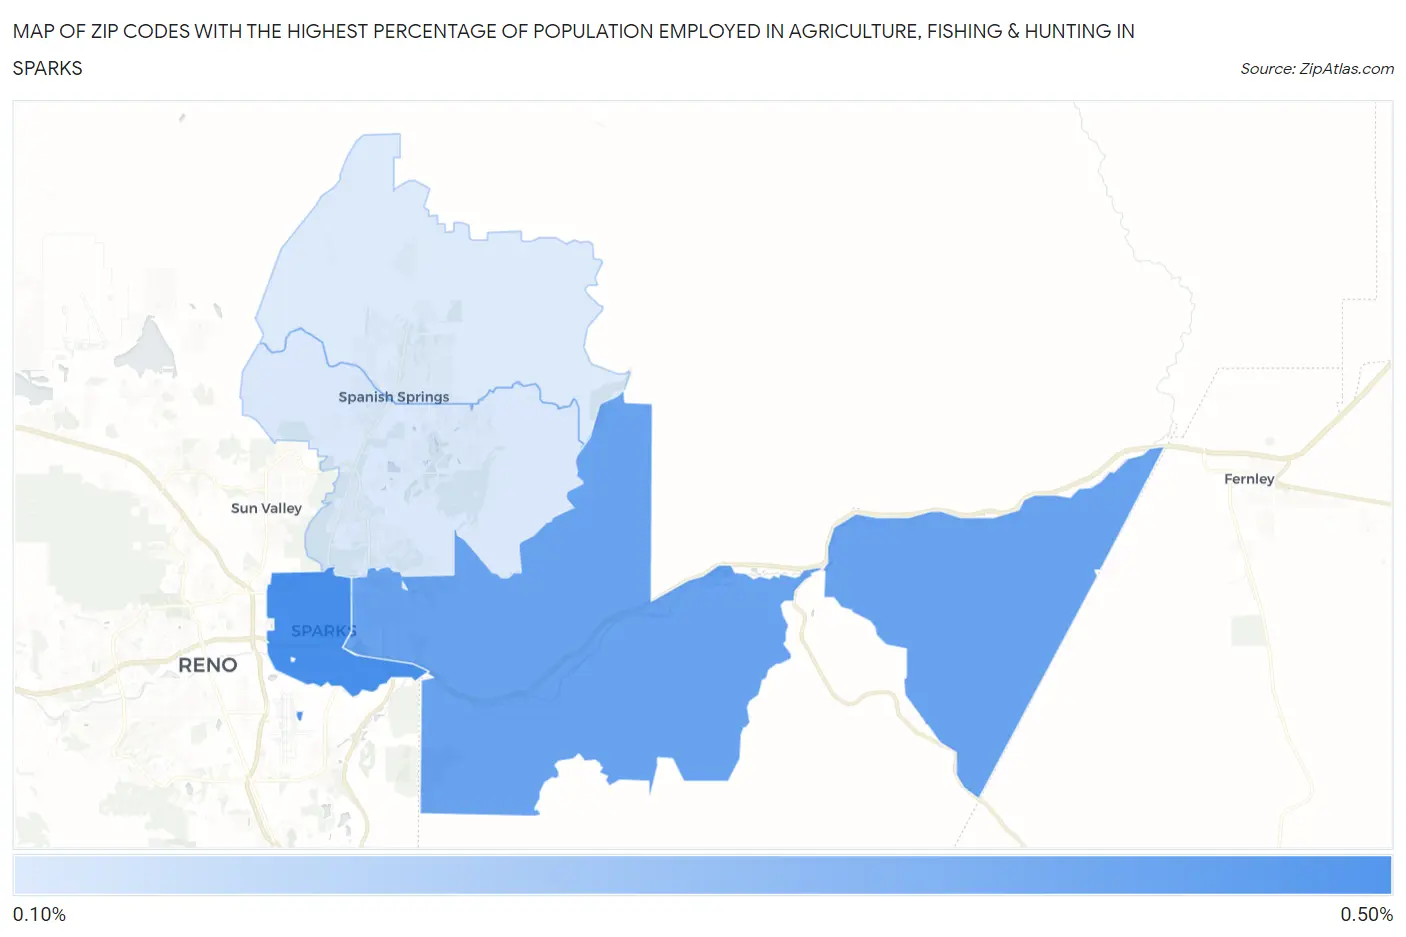
Zip Codes with the Highest Percentage of Population Employed in Agriculture, Fishing & Hunting in Sparks, NV
RELATED REPORTS & OPTIONS
Agriculture, Fishing & Hunting
Sparks
Compare Zip Codes
Map of Zip Codes with the Highest Percentage of Population Employed in Agriculture, Fishing & Hunting in Sparks
0.0%
0.50%
Zip Codes with the Highest Percentage of Population Employed in Agriculture, Fishing & Hunting in Sparks, NV
| Zip Code | % Employed | vs State | vs National | |
| 1. | 89431 | 0.44% | 0.40%(+0.044)#58 | 1.2%(-0.760)#19,797 |
| 2. | 89434 | 0.37% | 0.40%(-0.027)#66 | 1.2%(-0.831)#20,449 |
| 3. | 89436 | 0.12% | 0.40%(-0.276)#90 | 1.2%(-1.08)#23,407 |
| 4. | 89441 | 0.12% | 0.40%(-0.278)#91 | 1.2%(-1.08)#23,444 |
1
Common Questions
What are the Top 3 Zip Codes with the Highest Percentage of Population Employed in Agriculture, Fishing & Hunting in Sparks, NV?
Top 3 Zip Codes with the Highest Percentage of Population Employed in Agriculture, Fishing & Hunting in Sparks, NV are:
What zip code has the Highest Percentage of Population Employed in Agriculture, Fishing & Hunting in Sparks, NV?
89431 has the Highest Percentage of Population Employed in Agriculture, Fishing & Hunting in Sparks, NV with 0.44%.
What is the Percentage of Population Employed in Agriculture, Fishing & Hunting in Sparks, NV?
Percentage of Population Employed in Agriculture, Fishing & Hunting in Sparks is 0.28%.
What is the Percentage of Population Employed in Agriculture, Fishing & Hunting in Nevada?
Percentage of Population Employed in Agriculture, Fishing & Hunting in Nevada is 0.40%.
What is the Percentage of Population Employed in Agriculture, Fishing & Hunting in the United States?
Percentage of Population Employed in Agriculture, Fishing & Hunting in the United States is 1.2%.