Zip Codes with the Highest Percentage of Population with a Degree in Liberal Arts and History in Toms River, NJ
RELATED REPORTS & OPTIONS
Liberal Arts and History
Toms River
Compare Zip Codes
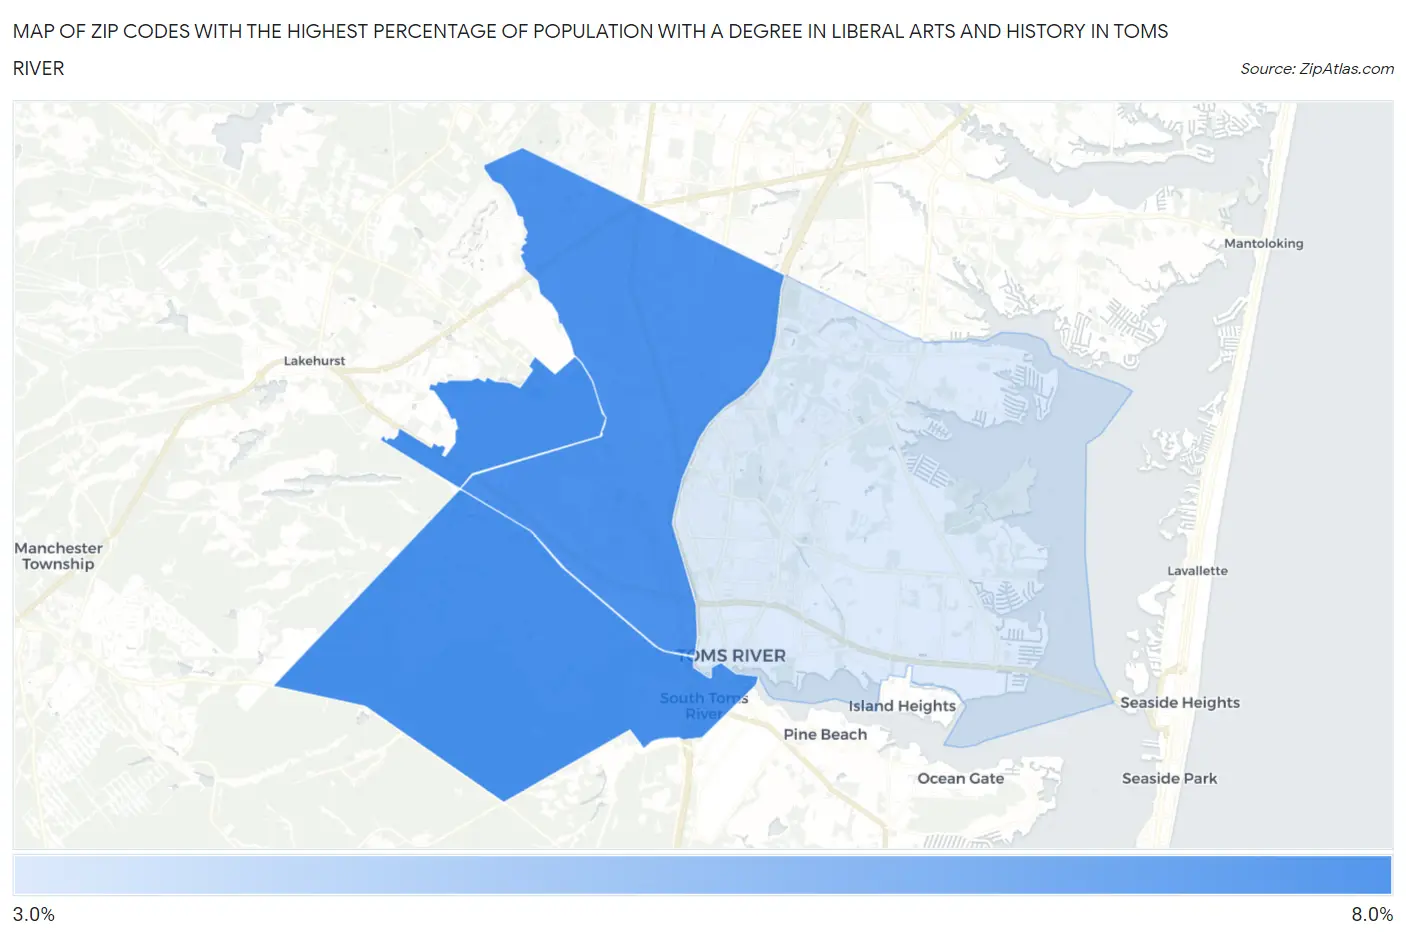
Map of Zip Codes with the Highest Percentage of Population with a Degree in Liberal Arts and History in Toms River
4.0%
7.8%
Zip Codes with the Highest Percentage of Population with a Degree in Liberal Arts and History in Toms River, NJ
| Zip Code | % Graduates | vs State | vs National | |
| 1. | 08757 | 7.8% | 4.6%(+3.27)#57 | 4.9%(+2.97)#5,109 |
| 2. | 08755 | 7.7% | 4.6%(+3.16)#62 | 4.9%(+2.86)#5,258 |
| 3. | 08753 | 4.0% | 4.6%(-0.610)#311 | 4.9%(-0.913)#14,946 |
1
Common Questions
What are the Top Zip Codes with the Highest Percentage of Population with a Degree in Liberal Arts and History in Toms River, NJ?
Top Zip Codes with the Highest Percentage of Population with a Degree in Liberal Arts and History in Toms River, NJ are:
What zip code has the Highest Percentage of Population with a Degree in Liberal Arts and History in Toms River, NJ?
08757 has the Highest Percentage of Population with a Degree in Liberal Arts and History in Toms River, NJ with 7.8%.
What is the Percentage of Population with a Degree in Liberal Arts and History in Toms River, NJ?
Percentage of Population with a Degree in Liberal Arts and History in Toms River is 4.9%.
What is the Percentage of Population with a Degree in Liberal Arts and History in New Jersey?
Percentage of Population with a Degree in Liberal Arts and History in New Jersey is 4.6%.
What is the Percentage of Population with a Degree in Liberal Arts and History in the United States?
Percentage of Population with a Degree in Liberal Arts and History in the United States is 4.9%.