Zip Codes with the Highest Percentage of Population with a Degree in Visual and Performing Arts in Toms River, NJ
RELATED REPORTS & OPTIONS
Visual and Performing Arts
Toms River
Compare Zip Codes
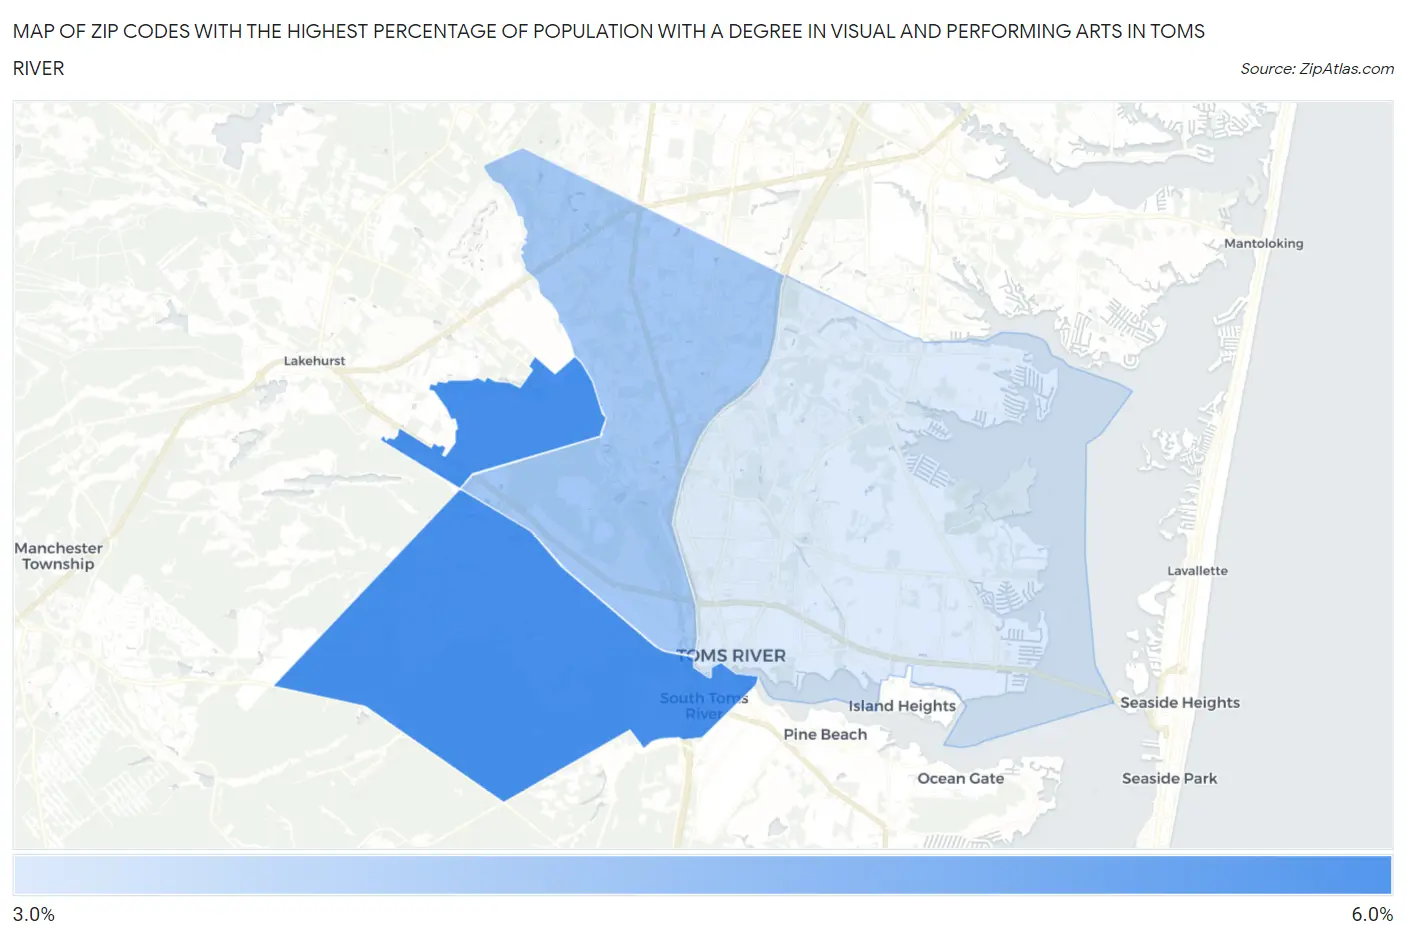
Map of Zip Codes with the Highest Percentage of Population with a Degree in Visual and Performing Arts in Toms River
3.2%
5.1%
Zip Codes with the Highest Percentage of Population with a Degree in Visual and Performing Arts in Toms River, NJ
| Zip Code | % Graduates | vs State | vs National | |
| 1. | 08757 | 5.1% | 4.0%(+1.04)#136 | 4.3%(+0.838)#6,435 |
| 2. | 08755 | 3.9% | 4.0%(-0.133)#225 | 4.3%(-0.337)#9,525 |
| 3. | 08753 | 3.2% | 4.0%(-0.860)#307 | 4.3%(-1.06)#12,035 |
1
Common Questions
What are the Top Zip Codes with the Highest Percentage of Population with a Degree in Visual and Performing Arts in Toms River, NJ?
Top Zip Codes with the Highest Percentage of Population with a Degree in Visual and Performing Arts in Toms River, NJ are:
What zip code has the Highest Percentage of Population with a Degree in Visual and Performing Arts in Toms River, NJ?
08757 has the Highest Percentage of Population with a Degree in Visual and Performing Arts in Toms River, NJ with 5.1%.
What is the Percentage of Population with a Degree in Visual and Performing Arts in Toms River, NJ?
Percentage of Population with a Degree in Visual and Performing Arts in Toms River is 3.4%.
What is the Percentage of Population with a Degree in Visual and Performing Arts in New Jersey?
Percentage of Population with a Degree in Visual and Performing Arts in New Jersey is 4.0%.
What is the Percentage of Population with a Degree in Visual and Performing Arts in the United States?
Percentage of Population with a Degree in Visual and Performing Arts in the United States is 4.3%.