Zip Codes with the Highest Percentage of Population Employed in Food Preparation & Serving in Jersey City, NJ
RELATED REPORTS & OPTIONS
Food Preparation & Serving
Jersey City
Compare Zip Codes
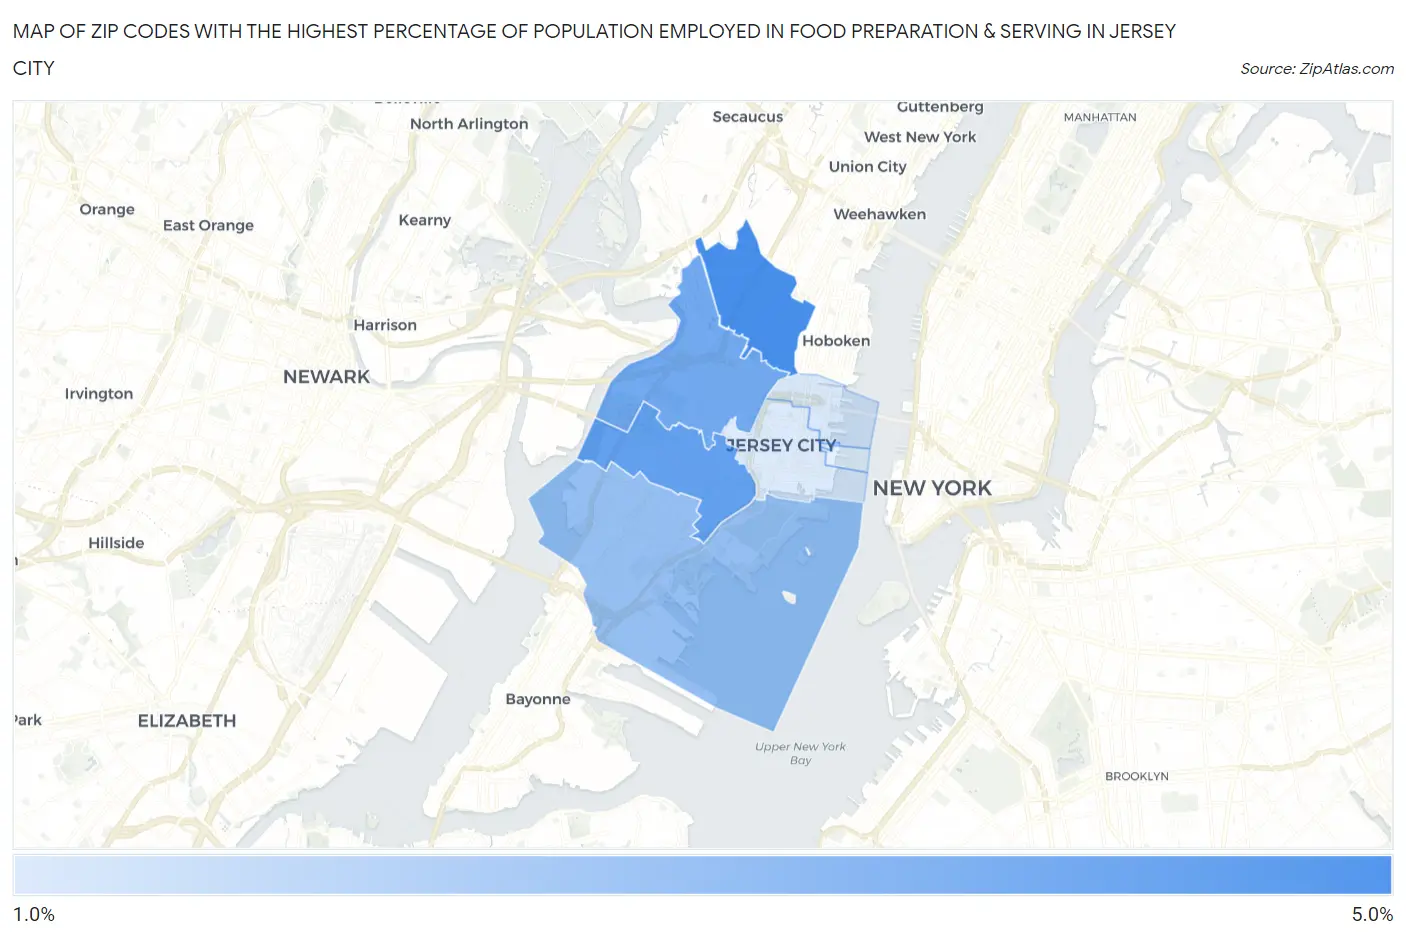
Map of Zip Codes with the Highest Percentage of Population Employed in Food Preparation & Serving in Jersey City
1.1%
4.5%
Zip Codes with the Highest Percentage of Population Employed in Food Preparation & Serving in Jersey City, NJ
| Zip Code | % Employed | vs State | vs National | |
| 1. | 07307 | 4.5% | 4.0%(+0.581)#171 | 5.3%(-0.742)#14,848 |
| 2. | 07304 | 3.9% | 4.0%(-0.073)#232 | 5.3%(-1.40)#17,584 |
| 3. | 07306 | 3.5% | 4.0%(-0.440)#262 | 5.3%(-1.76)#19,102 |
| 4. | 07305 | 2.8% | 4.0%(-1.21)#364 | 5.3%(-2.53)#22,227 |
| 5. | 07310 | 1.3% | 4.0%(-2.70)#498 | 5.3%(-4.03)#26,489 |
| 6. | 07302 | 1.1% | 4.0%(-2.82)#504 | 5.3%(-4.15)#26,723 |
1
Common Questions
What are the Top 5 Zip Codes with the Highest Percentage of Population Employed in Food Preparation & Serving in Jersey City, NJ?
Top 5 Zip Codes with the Highest Percentage of Population Employed in Food Preparation & Serving in Jersey City, NJ are:
What zip code has the Highest Percentage of Population Employed in Food Preparation & Serving in Jersey City, NJ?
07307 has the Highest Percentage of Population Employed in Food Preparation & Serving in Jersey City, NJ with 4.5%.
What is the Percentage of Population Employed in Food Preparation & Serving in Jersey City, NJ?
Percentage of Population Employed in Food Preparation & Serving in Jersey City is 2.8%.
What is the Percentage of Population Employed in Food Preparation & Serving in New Jersey?
Percentage of Population Employed in Food Preparation & Serving in New Jersey is 4.0%.
What is the Percentage of Population Employed in Food Preparation & Serving in the United States?
Percentage of Population Employed in Food Preparation & Serving in the United States is 5.3%.