Zip Codes with the Highest Percentage of Population Employed in Accommodation & Food Services in Absecon, NJ
RELATED REPORTS & OPTIONS
Accommodation & Food Services
Absecon
Compare Zip Codes
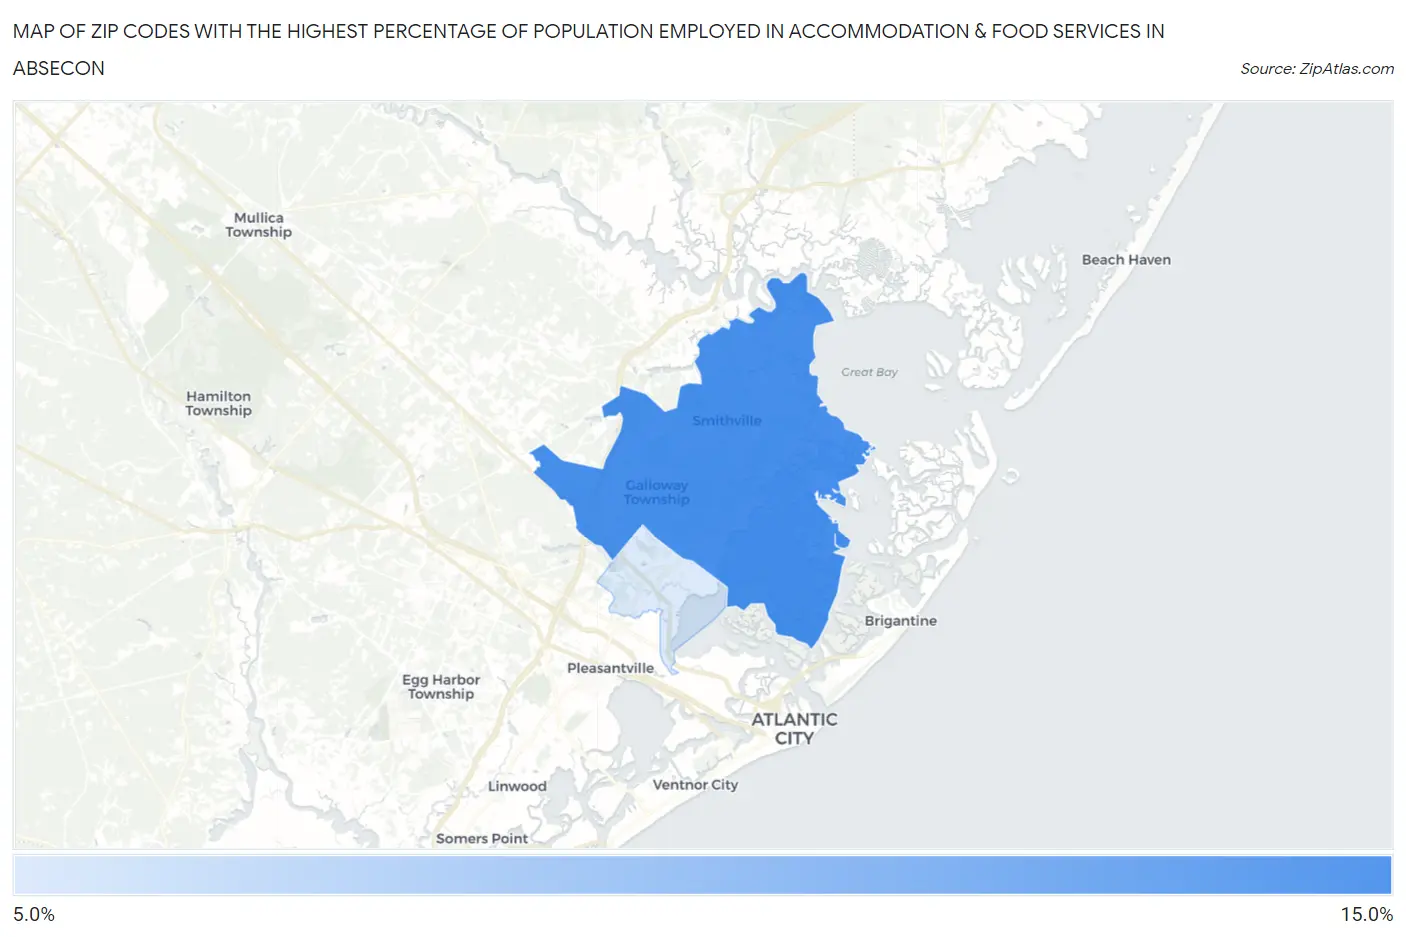
Map of Zip Codes with the Highest Percentage of Population Employed in Accommodation & Food Services in Absecon
7.5%
10.8%
Zip Codes with the Highest Percentage of Population Employed in Accommodation & Food Services in Absecon, NJ
| Zip Code | % Employed | vs State | vs National | |
| 1. | 08205 | 10.8% | 5.3%(+5.48)#28 | 6.9%(+3.88)#3,752 |
| 2. | 08201 | 7.5% | 5.3%(+2.23)#94 | 6.9%(+0.625)#8,981 |
1
Common Questions
What are the Top Zip Codes with the Highest Percentage of Population Employed in Accommodation & Food Services in Absecon, NJ?
Top Zip Codes with the Highest Percentage of Population Employed in Accommodation & Food Services in Absecon, NJ are:
What zip code has the Highest Percentage of Population Employed in Accommodation & Food Services in Absecon, NJ?
08205 has the Highest Percentage of Population Employed in Accommodation & Food Services in Absecon, NJ with 10.8%.
What is the Percentage of Population Employed in Accommodation & Food Services in Absecon, NJ?
Percentage of Population Employed in Accommodation & Food Services in Absecon is 5.9%.
What is the Percentage of Population Employed in Accommodation & Food Services in New Jersey?
Percentage of Population Employed in Accommodation & Food Services in New Jersey is 5.3%.
What is the Percentage of Population Employed in Accommodation & Food Services in the United States?
Percentage of Population Employed in Accommodation & Food Services in the United States is 6.9%.