Zip Codes with the Highest Percentage of Private Company Employees in Absecon, NJ
RELATED REPORTS & OPTIONS
Private Company Employees
Absecon
Compare Zip Codes
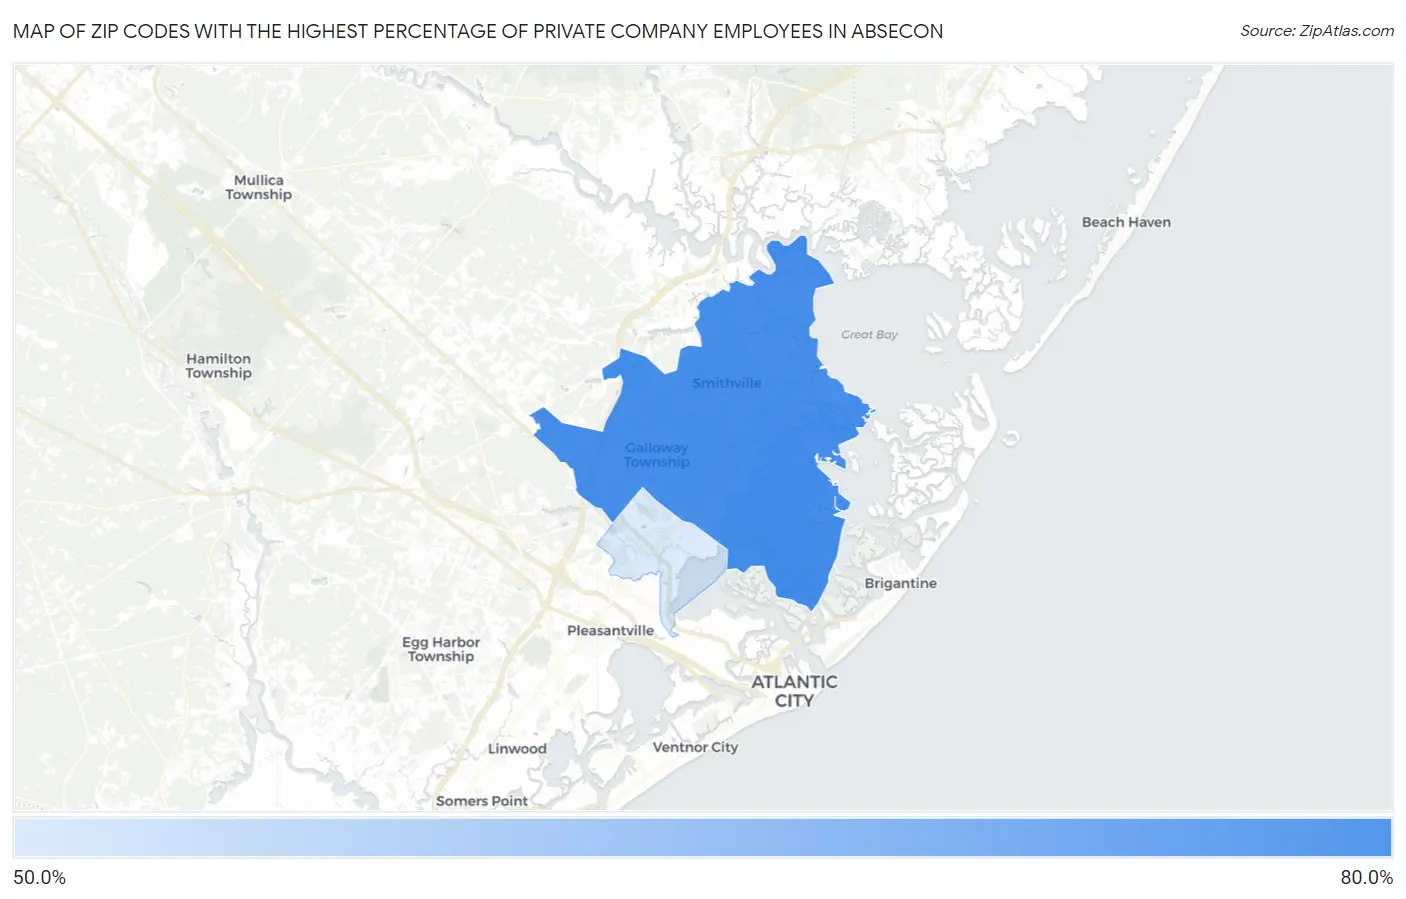
Map of Zip Codes with the Highest Percentage of Private Company Employees in Absecon
59.8%
65.2%
Zip Codes with the Highest Percentage of Private Company Employees in Absecon, NJ
| Zip Code | % Private Company Employees | vs State | vs National | |
| 1. | 08205 | 65.2% | 69.7%(-4.51)#404 | 66.9%(-1.67)#16,716 |
| 2. | 08201 | 59.8% | 69.7%(-9.96)#507 | 66.9%(-7.12)#22,628 |
1
Common Questions
What are the Top Zip Codes with the Highest Percentage of Private Company Employees in Absecon, NJ?
Top Zip Codes with the Highest Percentage of Private Company Employees in Absecon, NJ are:
What zip code has the Highest Percentage of Private Company Employees in Absecon, NJ?
08205 has the Highest Percentage of Private Company Employees in Absecon, NJ with 65.2%.
What is the Percentage of Private Company Employees in Absecon, NJ?
Percentage of Private Company Employees in Absecon is 55.3%.
What is the Percentage of Private Company Employees in New Jersey?
Percentage of Private Company Employees in New Jersey is 69.7%.
What is the Percentage of Private Company Employees in the United States?
Percentage of Private Company Employees in the United States is 66.9%.