Zip Codes with the Highest Percentage of Population Employed in Accommodation & Food Services in Brick, NJ
RELATED REPORTS & OPTIONS
Accommodation & Food Services
Brick
Compare Zip Codes
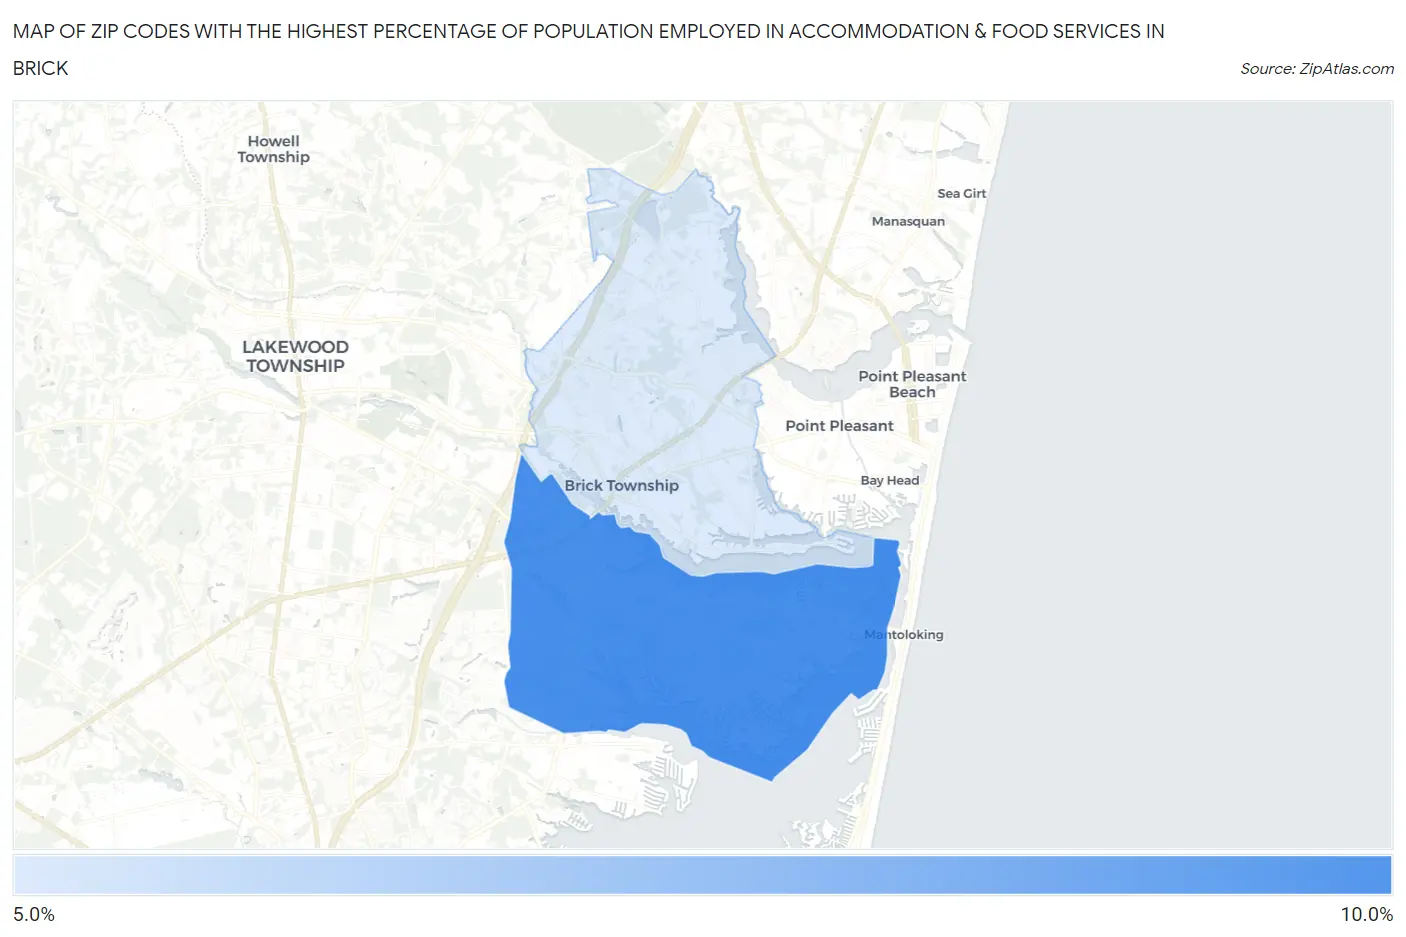
Map of Zip Codes with the Highest Percentage of Population Employed in Accommodation & Food Services in Brick
5.2%
8.3%
Zip Codes with the Highest Percentage of Population Employed in Accommodation & Food Services in Brick, NJ
| Zip Code | % Employed | vs State | vs National | |
| 1. | 08723 | 8.3% | 5.3%(+3.04)#65 | 6.9%(+1.43)#7,181 |
| 2. | 08724 | 5.2% | 5.3%(-0.091)#226 | 6.9%(-1.69)#16,158 |
1
Common Questions
What are the Top Zip Codes with the Highest Percentage of Population Employed in Accommodation & Food Services in Brick, NJ?
Top Zip Codes with the Highest Percentage of Population Employed in Accommodation & Food Services in Brick, NJ are:
What zip code has the Highest Percentage of Population Employed in Accommodation & Food Services in Brick, NJ?
08723 has the Highest Percentage of Population Employed in Accommodation & Food Services in Brick, NJ with 8.3%.
What is the Percentage of Population Employed in Accommodation & Food Services in New Jersey?
Percentage of Population Employed in Accommodation & Food Services in New Jersey is 5.3%.
What is the Percentage of Population Employed in Accommodation & Food Services in the United States?
Percentage of Population Employed in Accommodation & Food Services in the United States is 6.9%.