Zip Codes with the Highest Percentage of Population Employed in Accommodation & Food Services in Millstone Township, NJ
RELATED REPORTS & OPTIONS
Accommodation & Food Services
Millstone Township
Compare Zip Codes
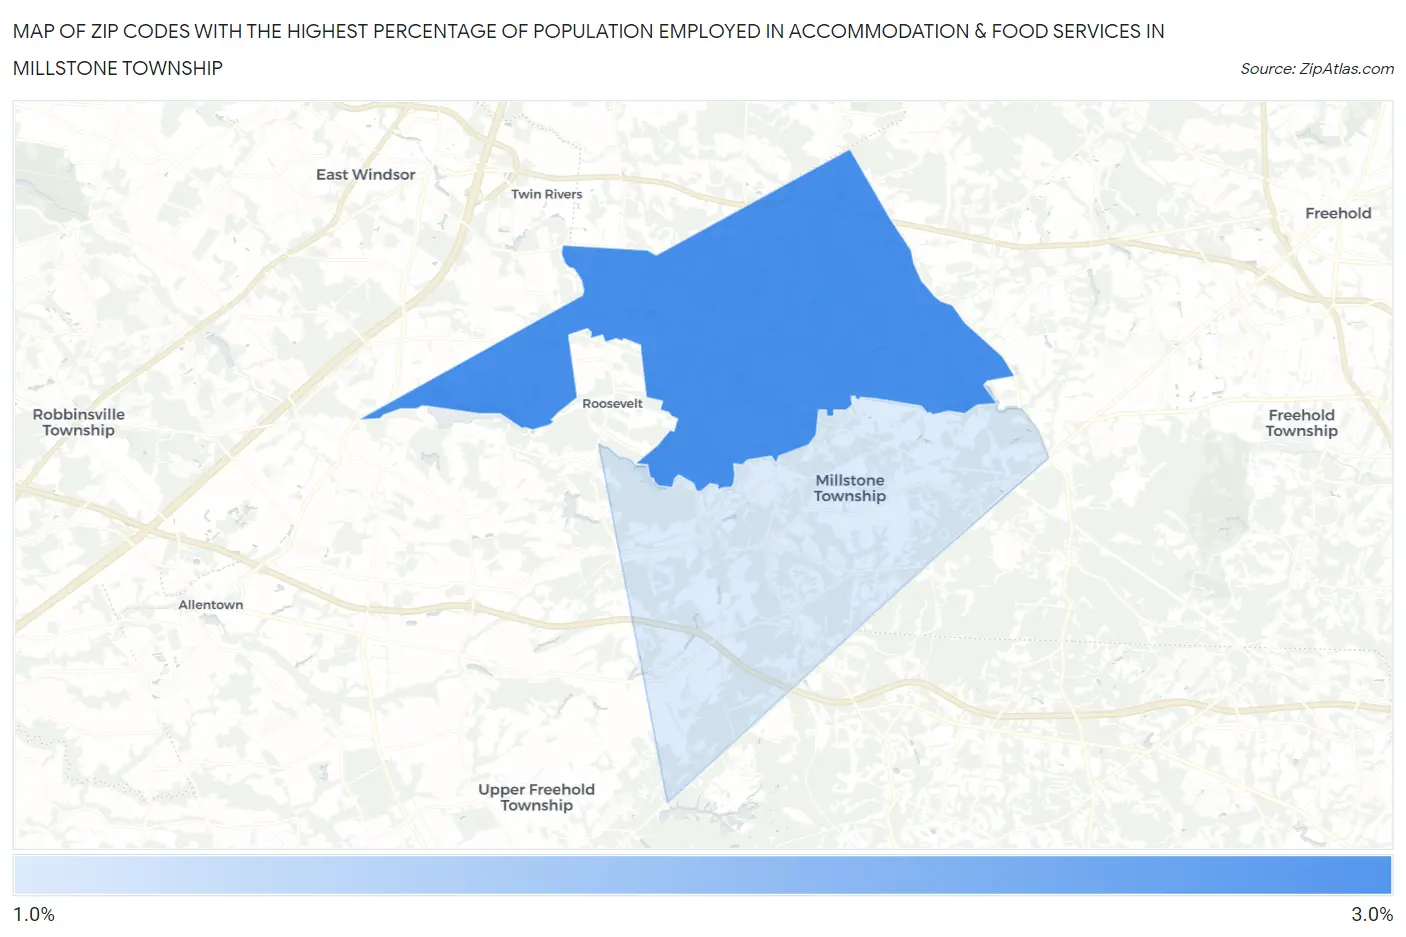
Map of Zip Codes with the Highest Percentage of Population Employed in Accommodation & Food Services in Millstone Township
1.6%
2.9%
Zip Codes with the Highest Percentage of Population Employed in Accommodation & Food Services in Millstone Township, NJ
| Zip Code | % Employed | vs State | vs National | |
| 1. | 08535 | 2.9% | 5.3%(-2.36)#444 | 6.9%(-3.97)#23,441 |
| 2. | 08510 | 1.6% | 5.3%(-3.68)#513 | 6.9%(-5.29)#26,303 |
1
Common Questions
What are the Top Zip Codes with the Highest Percentage of Population Employed in Accommodation & Food Services in Millstone Township, NJ?
Top Zip Codes with the Highest Percentage of Population Employed in Accommodation & Food Services in Millstone Township, NJ are:
What zip code has the Highest Percentage of Population Employed in Accommodation & Food Services in Millstone Township, NJ?
08535 has the Highest Percentage of Population Employed in Accommodation & Food Services in Millstone Township, NJ with 2.9%.
What is the Percentage of Population Employed in Accommodation & Food Services in New Jersey?
Percentage of Population Employed in Accommodation & Food Services in New Jersey is 5.3%.
What is the Percentage of Population Employed in Accommodation & Food Services in the United States?
Percentage of Population Employed in Accommodation & Food Services in the United States is 6.9%.