Zip Codes with the Highest Percentage of Population Employed in Accommodation & Food Services in Montclair, NJ
RELATED REPORTS & OPTIONS
Accommodation & Food Services
Montclair
Compare Zip Codes
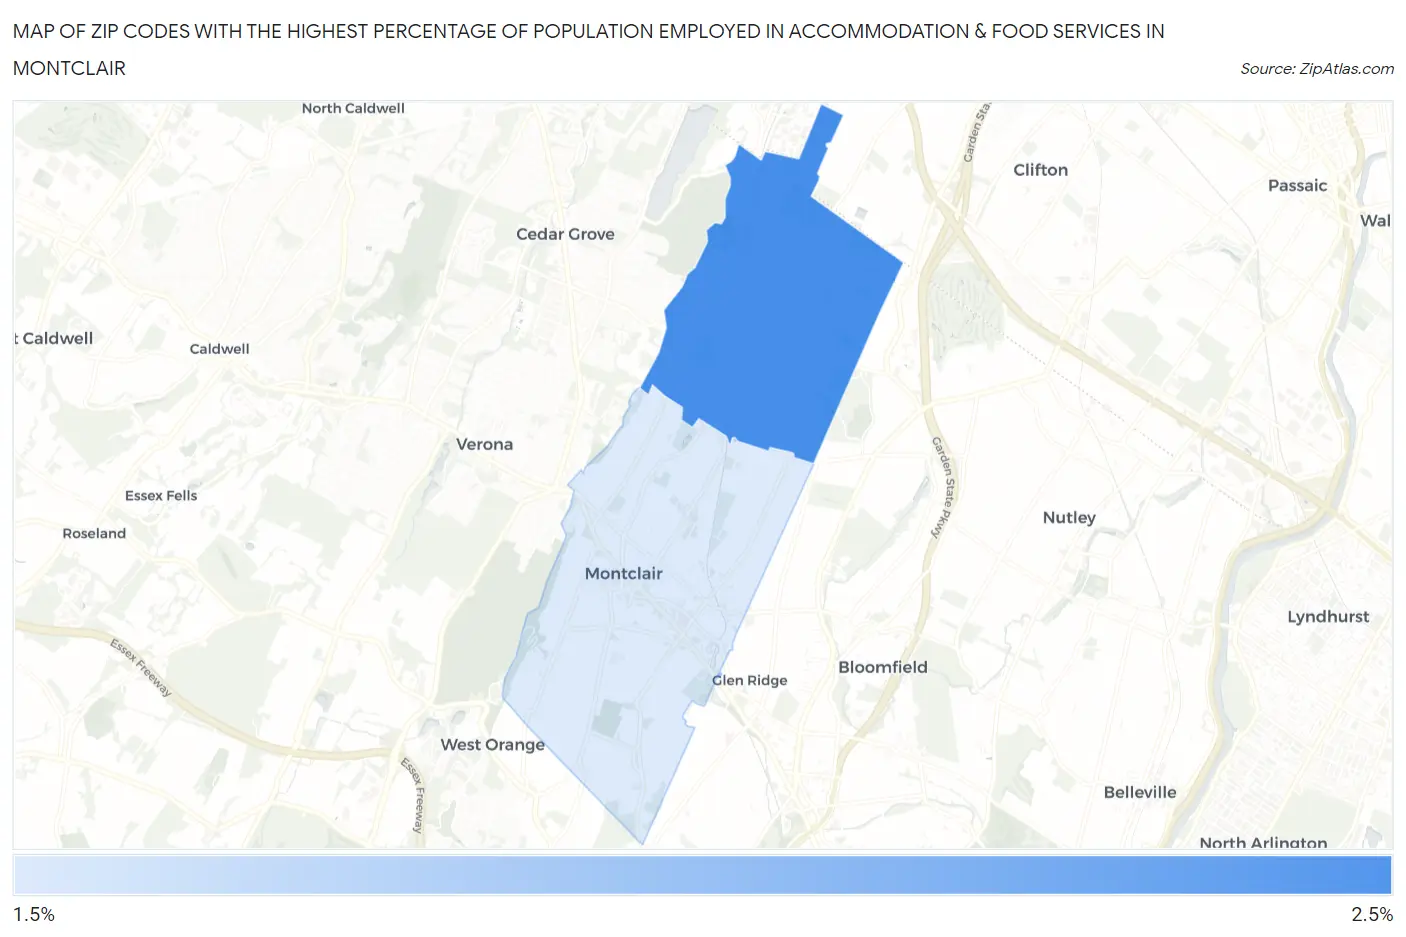
Map of Zip Codes with the Highest Percentage of Population Employed in Accommodation & Food Services in Montclair
2.3%
2.5%
Zip Codes with the Highest Percentage of Population Employed in Accommodation & Food Services in Montclair, NJ
| Zip Code | % Employed | vs State | vs National | |
| 1. | 07043 | 2.5% | 5.3%(-2.82)#471 | 6.9%(-4.42)#24,581 |
| 2. | 07042 | 2.3% | 5.3%(-2.95)#480 | 6.9%(-4.56)#24,890 |
1
Common Questions
What are the Top Zip Codes with the Highest Percentage of Population Employed in Accommodation & Food Services in Montclair, NJ?
Top Zip Codes with the Highest Percentage of Population Employed in Accommodation & Food Services in Montclair, NJ are:
What zip code has the Highest Percentage of Population Employed in Accommodation & Food Services in Montclair, NJ?
07043 has the Highest Percentage of Population Employed in Accommodation & Food Services in Montclair, NJ with 2.5%.
What is the Percentage of Population Employed in Accommodation & Food Services in New Jersey?
Percentage of Population Employed in Accommodation & Food Services in New Jersey is 5.3%.
What is the Percentage of Population Employed in Accommodation & Food Services in the United States?
Percentage of Population Employed in Accommodation & Food Services in the United States is 6.9%.