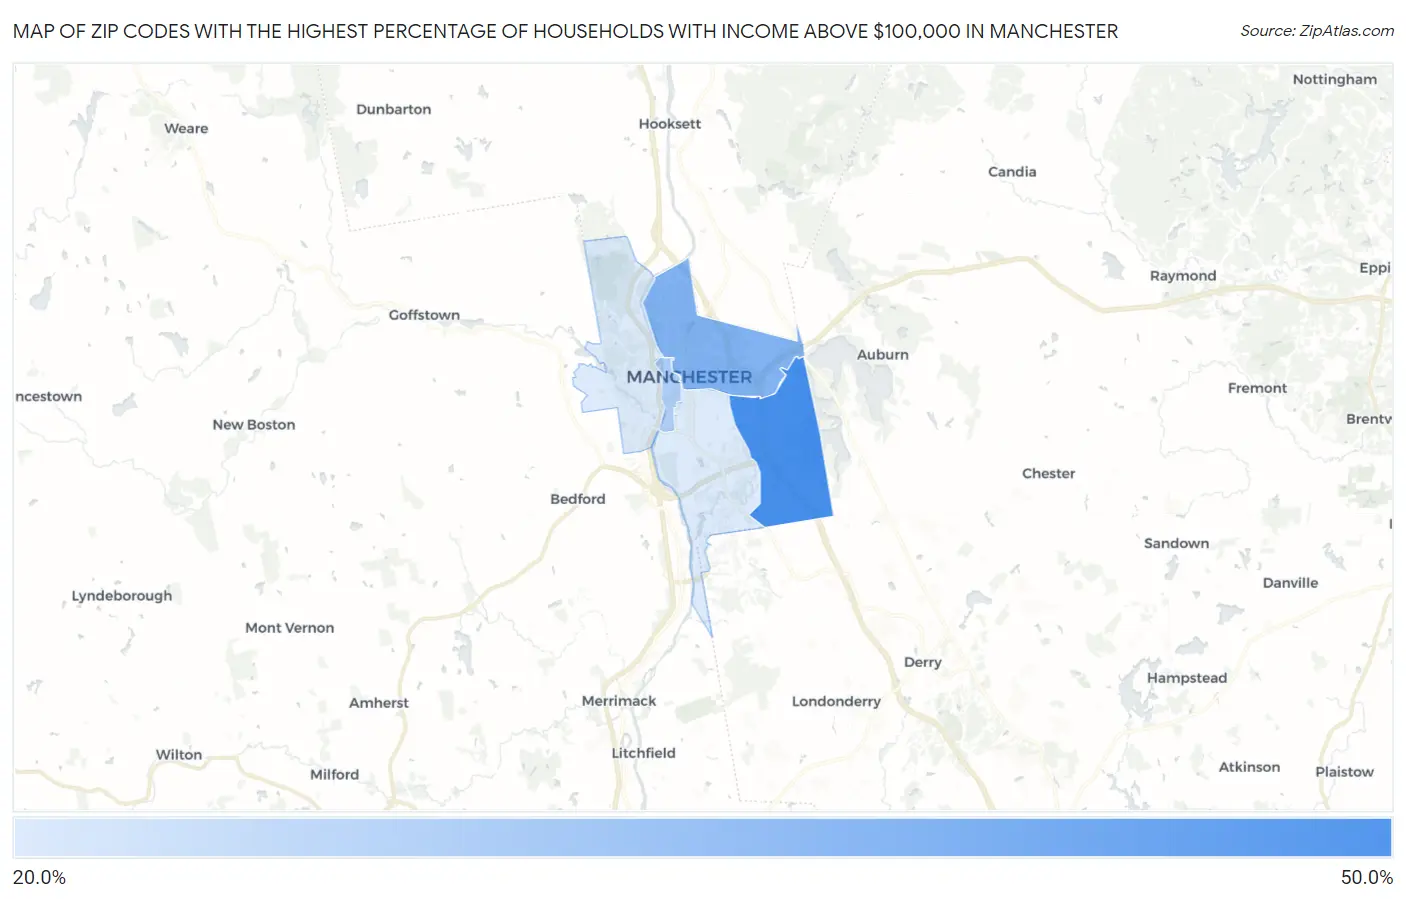
Zip Codes with the Highest Percentage of Households with Income Above $100,000 in Manchester, NH
RELATED REPORTS & OPTIONS
Household Income | $100k+
Manchester
Compare Zip Codes
Map of Zip Codes with the Highest Percentage of Households with Income Above $100,000 in Manchester
30.0%
47.2%
Zip Codes with the Highest Percentage of Households with Income Above $100,000 in Manchester, NH
| Zip Code | Households with Income > $100k | vs State | vs National | |
| 1. | 03109 | 47.2% | 45.5%(+1.70)#104 | 37.3%(+9.90)#5,774 |
| 2. | 03104 | 40.2% | 45.5%(-5.30)#146 | 37.3%(+2.90)#8,786 |
| 3. | 03101 | 35.3% | 45.5%(-10.2)#174 | 37.3%(-2.00)#11,608 |
| 4. | 03102 | 30.1% | 45.5%(-15.4)#201 | 37.3%(-7.20)#15,360 |
| 5. | 03103 | 30.0% | 45.5%(-15.5)#202 | 37.3%(-7.30)#15,440 |
1
Common Questions
What are the Top 3 Zip Codes with the Highest Percentage of Households with Income Above $100,000 in Manchester, NH?
Top 3 Zip Codes with the Highest Percentage of Households with Income Above $100,000 in Manchester, NH are:
What zip code has the Highest Percentage of Households with Income Above $100,000 in Manchester, NH?
03109 has the Highest Percentage of Households with Income Above $100,000 in Manchester, NH with 47.2%.
What is the Percentage of Households with Income Above $100,000 in Manchester, NH?
Percentage of Households with Income Above $100,000 in Manchester is 34.6%.
What is the Percentage of Households with Income Above $100,000 in New Hampshire?
Percentage of Households with Income Above $100,000 in New Hampshire is 45.5%.
What is the Percentage of Households with Income Above $100,000 in the United States?
Percentage of Households with Income Above $100,000 in the United States is 37.3%.