Zip Codes with the Highest Percentage of Population with a Degree in Business in Manchester, NH
RELATED REPORTS & OPTIONS
Business
Manchester
Compare Zip Codes
Map of Zip Codes with the Highest Percentage of Population with a Degree in Business in Manchester
16.7%
23.7%
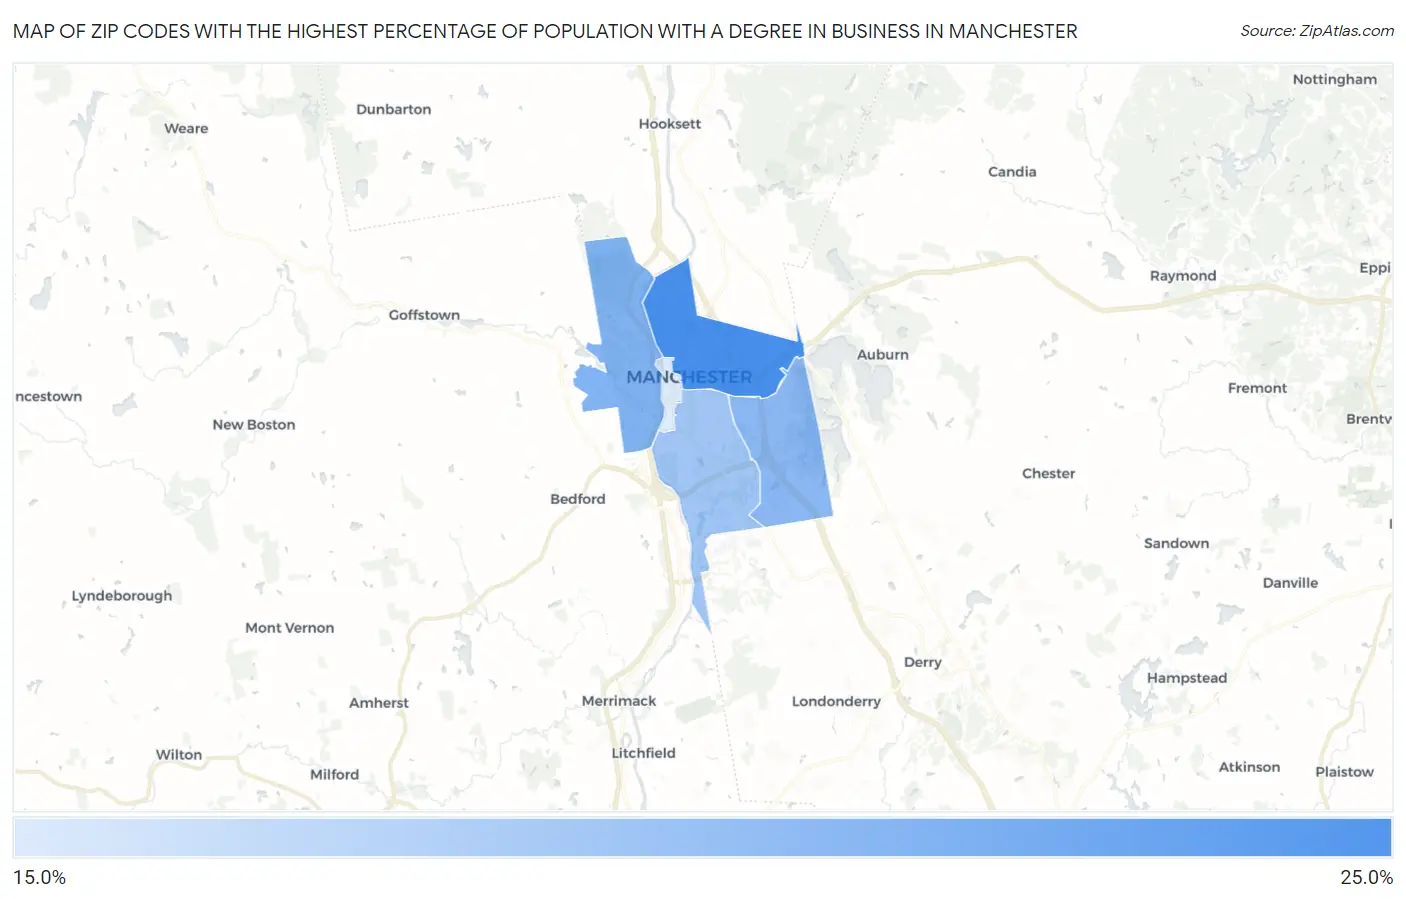
Zip Codes with the Highest Percentage of Population with a Degree in Business in Manchester, NH
| Zip Code | % Graduates | vs State | vs National | |
| 1. | 03104 | 23.7% | 18.2%(+5.49)#32 | 19.5%(+4.21)#6,897 |
| 2. | 03102 | 20.9% | 18.2%(+2.73)#55 | 19.5%(+1.45)#10,222 |
| 3. | 03109 | 20.5% | 18.2%(+2.33)#59 | 19.5%(+1.05)#10,818 |
| 4. | 03103 | 19.5% | 18.2%(+1.26)#71 | 19.5%(-0.022)#12,402 |
| 5. | 03101 | 16.7% | 18.2%(-1.51)#113 | 19.5%(-2.79)#16,575 |
1
Common Questions
What are the Top 3 Zip Codes with the Highest Percentage of Population with a Degree in Business in Manchester, NH?
Top 3 Zip Codes with the Highest Percentage of Population with a Degree in Business in Manchester, NH are:
What zip code has the Highest Percentage of Population with a Degree in Business in Manchester, NH?
03104 has the Highest Percentage of Population with a Degree in Business in Manchester, NH with 23.7%.
What is the Percentage of Population with a Degree in Business in Manchester, NH?
Percentage of Population with a Degree in Business in Manchester is 21.4%.
What is the Percentage of Population with a Degree in Business in New Hampshire?
Percentage of Population with a Degree in Business in New Hampshire is 18.2%.
What is the Percentage of Population with a Degree in Business in the United States?
Percentage of Population with a Degree in Business in the United States is 19.5%.