Zip Codes with the Highest Percentage of Population Employed in Health Diagnosing & Treating in Gastonia, NC
RELATED REPORTS & OPTIONS
Health Diagnosing & Treating
Gastonia
Compare Zip Codes
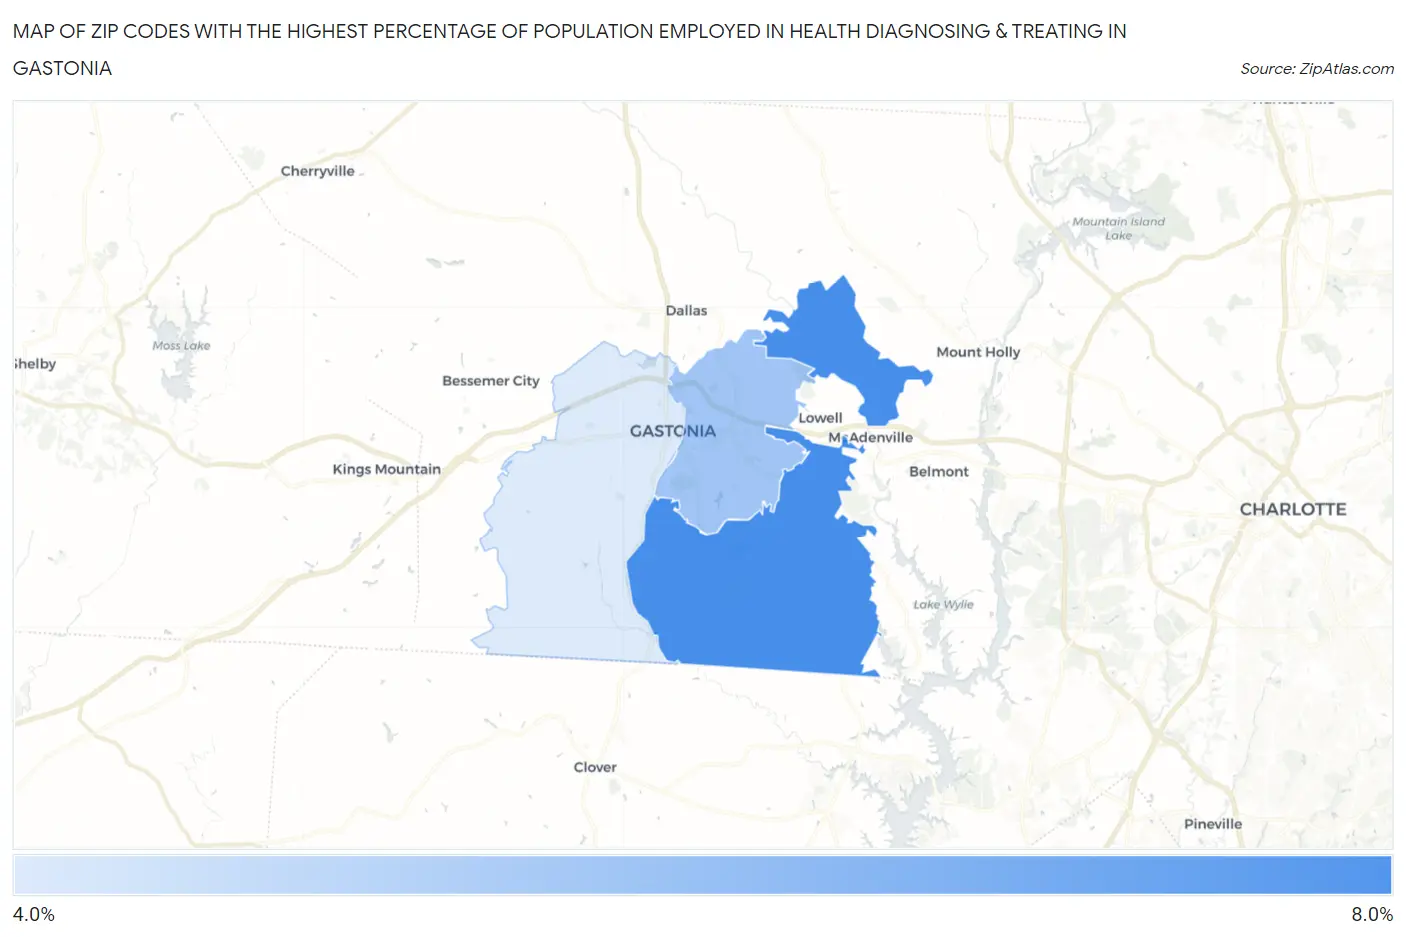
Map of Zip Codes with the Highest Percentage of Population Employed in Health Diagnosing & Treating in Gastonia
4.7%
7.9%
Zip Codes with the Highest Percentage of Population Employed in Health Diagnosing & Treating in Gastonia, NC
| Zip Code | % Employed | vs State | vs National | |
| 1. | 28056 | 7.9% | 6.4%(+1.43)#202 | 6.2%(+1.61)#7,872 |
| 2. | 28054 | 5.9% | 6.4%(-0.481)#370 | 6.2%(-0.305)#14,078 |
| 3. | 28052 | 4.7% | 6.4%(-1.70)#494 | 6.2%(-1.52)#18,782 |
1
Common Questions
What are the Top Zip Codes with the Highest Percentage of Population Employed in Health Diagnosing & Treating in Gastonia, NC?
Top Zip Codes with the Highest Percentage of Population Employed in Health Diagnosing & Treating in Gastonia, NC are:
What zip code has the Highest Percentage of Population Employed in Health Diagnosing & Treating in Gastonia, NC?
28056 has the Highest Percentage of Population Employed in Health Diagnosing & Treating in Gastonia, NC with 7.9%.
What is the Percentage of Population Employed in Health Diagnosing & Treating in Gastonia, NC?
Percentage of Population Employed in Health Diagnosing & Treating in Gastonia is 6.5%.
What is the Percentage of Population Employed in Health Diagnosing & Treating in North Carolina?
Percentage of Population Employed in Health Diagnosing & Treating in North Carolina is 6.4%.
What is the Percentage of Population Employed in Health Diagnosing & Treating in the United States?
Percentage of Population Employed in Health Diagnosing & Treating in the United States is 6.2%.