Zip Codes with the Highest Percentage of Population Employed in Health Diagnosing & Treating in Burlington, NC
RELATED REPORTS & OPTIONS
Health Diagnosing & Treating
Burlington
Compare Zip Codes
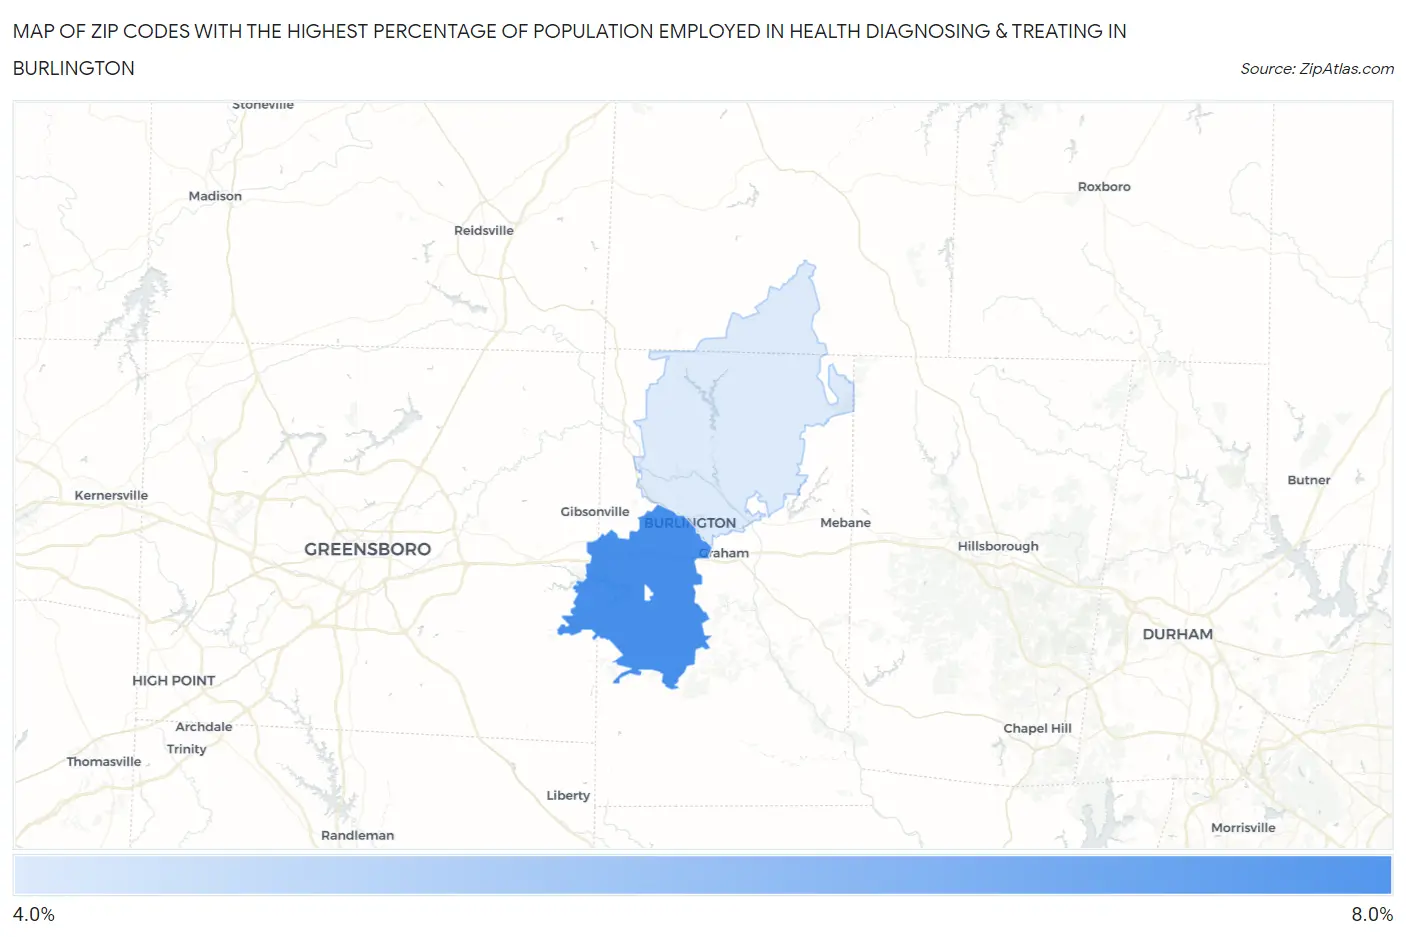
Map of Zip Codes with the Highest Percentage of Population Employed in Health Diagnosing & Treating in Burlington
4.5%
7.7%
Zip Codes with the Highest Percentage of Population Employed in Health Diagnosing & Treating in Burlington, NC
| Zip Code | % Employed | vs State | vs National | |
| 1. | 27215 | 7.7% | 6.4%(+1.25)#215 | 6.2%(+1.43)#8,310 |
| 2. | 27217 | 4.5% | 6.4%(-1.93)#529 | 6.2%(-1.76)#19,688 |
1
Common Questions
What are the Top Zip Codes with the Highest Percentage of Population Employed in Health Diagnosing & Treating in Burlington, NC?
Top Zip Codes with the Highest Percentage of Population Employed in Health Diagnosing & Treating in Burlington, NC are:
What zip code has the Highest Percentage of Population Employed in Health Diagnosing & Treating in Burlington, NC?
27215 has the Highest Percentage of Population Employed in Health Diagnosing & Treating in Burlington, NC with 7.7%.
What is the Percentage of Population Employed in Health Diagnosing & Treating in Burlington, NC?
Percentage of Population Employed in Health Diagnosing & Treating in Burlington is 6.5%.
What is the Percentage of Population Employed in Health Diagnosing & Treating in North Carolina?
Percentage of Population Employed in Health Diagnosing & Treating in North Carolina is 6.4%.
What is the Percentage of Population Employed in Health Diagnosing & Treating in the United States?
Percentage of Population Employed in Health Diagnosing & Treating in the United States is 6.2%.