Zip Codes with the Highest Percentage of Households with Income Above $100,000 in Fayetteville, NC

RELATED REPORTS & OPTIONS

Household Income | $100k+
Population
Families and Households
Female Fertility
Female Fertility (Unmarried)
Race (Community Size)
Race (Percentage)
Ancestry (Community Size)
AfghanAfricanAlbanianAmericanApacheArabArgentineanArmenianAustrianBahamianBarbadianBhutaneseBlackfeetBrazilianBritishBritish West IndianBulgarianBurmeseCajunCanadianCape VerdeanCelticCentral AmericanCentral American IndianCherokeeChickasawChileanChippewaChoctawColombianCosta RicanCreekCroatianCubanCzechCzechoslovakianDanishDominicanDutchDutch West IndianEastern EuropeanEcuadorianEnglishEthiopianEuropeanFinnishFrenchFrench CanadianGermanGhanaianGreekGuamanian / ChamorroGuatemalanGuyaneseHaitianHonduranHungarianIndian (Asian)IndonesianIranianIraqiIrishIroquoisIsraeliItalianJamaicanKenyanKoreanLaotianLebaneseLiberianLithuanianLumbeeMalaysianMexicanMexican American IndianMoroccanNative HawaiianNavajoNepaleseNew ZealanderNicaraguanNigerianNorthern EuropeanNorwegianPakistaniPalestinianPanamanianPennsylvania GermanPeruvianPolishPortuguesePuerto RicanRomanianRussianSalvadoranSamoanScandinavianScotch-IrishScottishSeminoleSerbianSiouxSlovakSloveneSouth AfricanSouth AmericanSpaniardSpanishSri LankanSubsaharan AfricanSwedishSwissSyrianThaiTrinidadian and TobagonianTurkishU.S. Virgin IslanderUkrainianVenezuelanWelshWest IndianYugoslavian
Ancestry (Percentage)
AfghanAfricanAlbanianAmericanApacheArabArgentineanArmenianAustrianBahamianBarbadianBhutaneseBlackfeetBrazilianBritishBritish West IndianBulgarianBurmeseCajunCanadianCape VerdeanCelticCentral AmericanCentral American IndianCherokeeChickasawChileanChippewaChoctawColombianCosta RicanCreekCroatianCubanCzechCzechoslovakianDanishDominicanDutchDutch West IndianEastern EuropeanEcuadorianEnglishEthiopianEuropeanFinnishFrenchFrench CanadianGermanGhanaianGreekGuamanian / ChamorroGuatemalanGuyaneseHaitianHonduranHungarianIndian (Asian)IndonesianIranianIraqiIrishIroquoisIsraeliItalianJamaicanKenyanKoreanLaotianLebaneseLiberianLithuanianLumbeeMalaysianMexicanMexican American IndianMoroccanNative HawaiianNavajoNepaleseNew ZealanderNicaraguanNigerianNorthern EuropeanNorwegianPakistaniPalestinianPanamanianPennsylvania GermanPeruvianPolishPortuguesePuerto RicanRomanianRussianSalvadoranSamoanScandinavianScotch-IrishScottishSeminoleSerbianSiouxSlovakSloveneSouth AfricanSouth AmericanSpaniardSpanishSri LankanSubsaharan AfricanSwedishSwissSyrianThaiTrinidadian and TobagonianTurkishU.S. Virgin IslanderUkrainianVenezuelanWelshWest IndianYugoslavian
Immigrant Origin (Total)
Immigrant Origin (Percentage)
Income
Income (Families)
Income (Households)
Poverty
Poverty (Families)
Unemployment
Employment Occupations
Employment Industries
Employer Class
Commute Time
Commute Means
School Enrollment
Education by Degree Field
Occupancy
Finances
Physical Characteristics
Fayetteville
Compare Zip Codes
Comparison Subject

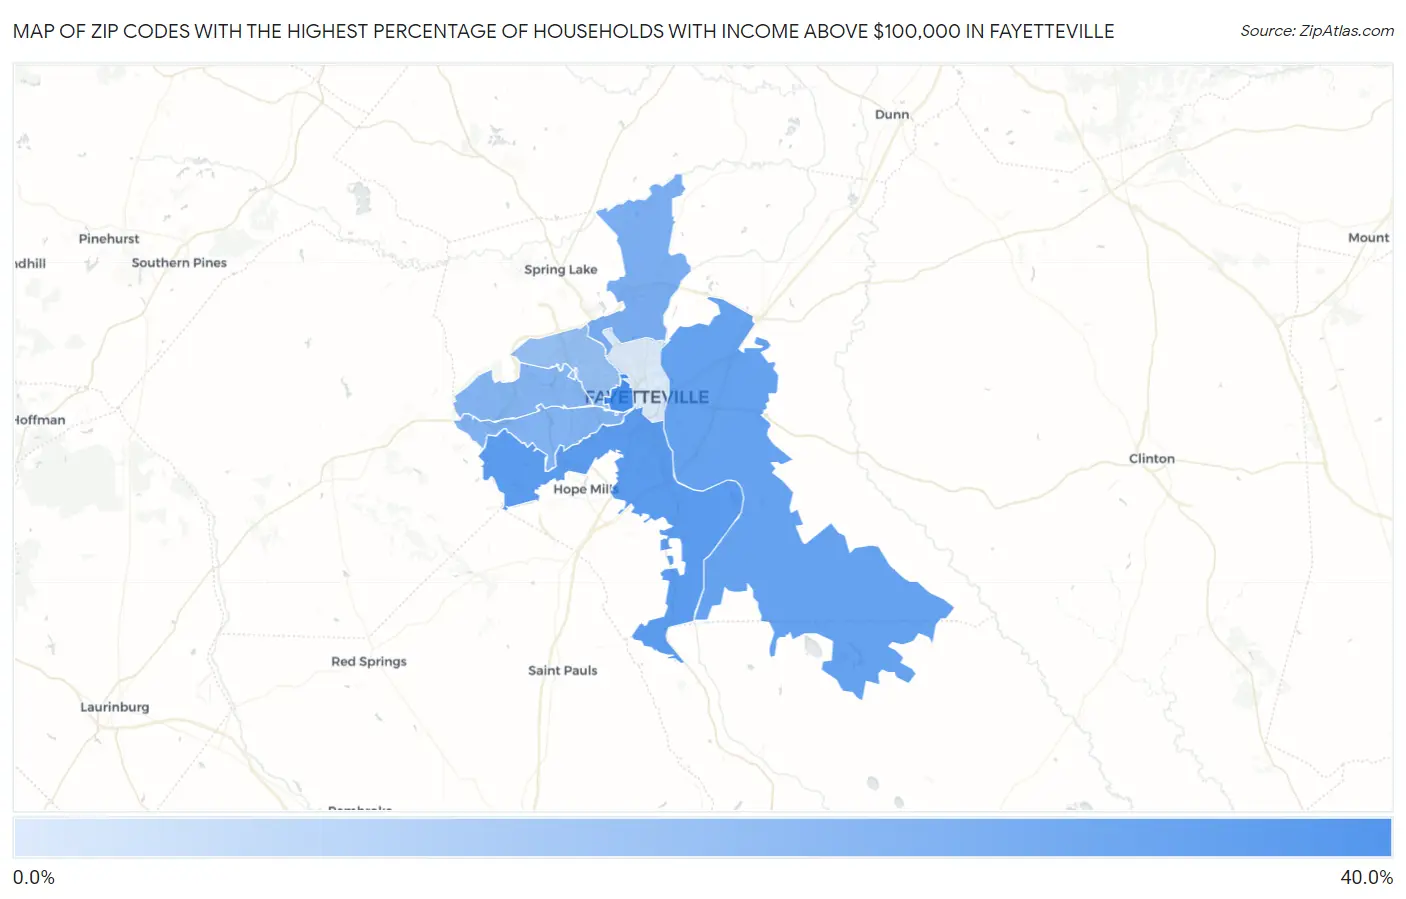
Map of Zip Codes with the Highest Percentage of Households with Income Above $100,000 in Fayetteville

0.0%
40.0%
Zip Codes with the Highest Percentage of Households with Income Above $100,000 in Fayetteville Map

Zip Codes with the Highest Percentage of Households with Income Above $100,000 in Fayetteville, NC

Zip Code Households with Income > $100k vs State vs National
1.2830531.2%31.6%(-0.400)#25037.3%(-6.10)#14,488
2.2830628.2%31.6%(-3.40)#30037.3%(-9.10)#16,933
3.2831226.5%31.6%(-5.10)#35337.3%(-10.8)#18,409
4.2831123.5%31.6%(-8.10)#42637.3%(-13.8)#21,116
5.2830422.5%31.6%(-9.10)#45637.3%(-14.8)#21,968
6.2831421.8%31.6%(-9.80)#48337.3%(-15.5)#22,566
7.2830319.5%31.6%(-12.1)#55737.3%(-17.8)#24,433
8.283019.5%31.6%(-22.1)#75137.3%(-27.8)#29,981

Common Questions

What are the Top 5 Zip Codes with the Highest Percentage of Households with Income Above $100,000 in Fayetteville, NC?
Top 5 Zip Codes with the Highest Percentage of Households with Income Above $100,000 in Fayetteville, NC are:
#1
31.2%
#2
28.2%
#3
26.5%
#4
23.5%
#5
22.5%
What zip code has the Highest Percentage of Households with Income Above $100,000 in Fayetteville, NC?
28305 has the Highest Percentage of Households with Income Above $100,000 in Fayetteville, NC with 31.2%.
What is the Percentage of Households with Income Above $100,000 in Fayetteville, NC?
Percentage of Households with Income Above $100,000 in Fayetteville is 20.8%.
What is the Percentage of Households with Income Above $100,000 in North Carolina?
Percentage of Households with Income Above $100,000 in North Carolina is 31.6%.
What is the Percentage of Households with Income Above $100,000 in the United States?
Percentage of Households with Income Above $100,000 in the United States is 37.3%.