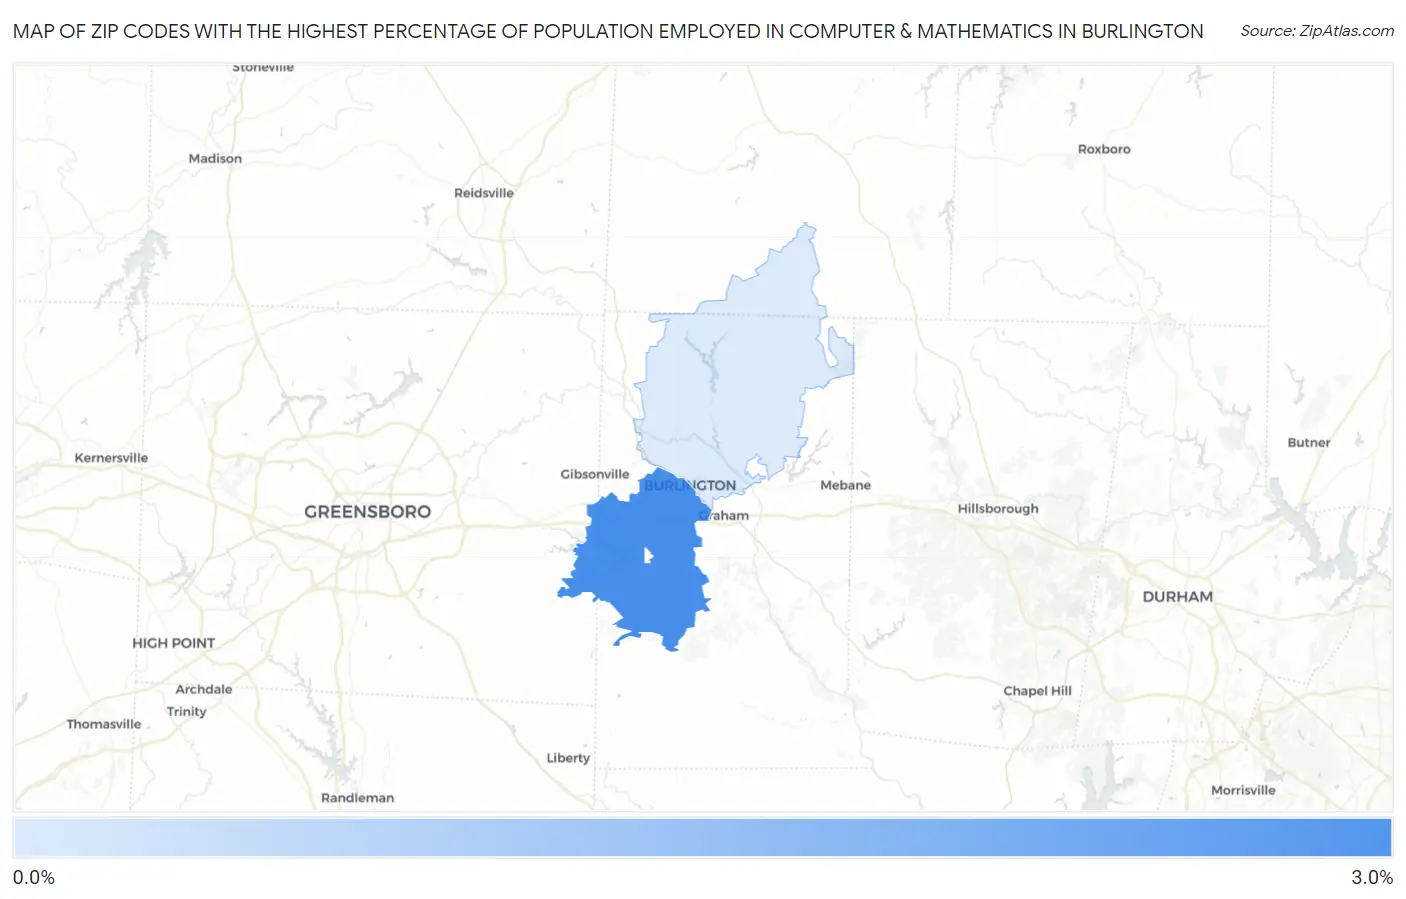
Zip Codes with the Highest Percentage of Population Employed in Computer & Mathematics in Burlington, NC
RELATED REPORTS & OPTIONS
Computer & Mathematics
Burlington
Compare Zip Codes
Map of Zip Codes with the Highest Percentage of Population Employed in Computer & Mathematics in Burlington
0.81%
2.7%
Zip Codes with the Highest Percentage of Population Employed in Computer & Mathematics in Burlington, NC
| Zip Code | % Employed | vs State | vs National | |
| 1. | 27215 | 2.7% | 3.5%(-0.881)#216 | 3.5%(-0.859)#8,966 |
| 2. | 27217 | 0.81% | 3.5%(-2.74)#498 | 3.5%(-2.71)#18,567 |
1
Common Questions
What are the Top Zip Codes with the Highest Percentage of Population Employed in Computer & Mathematics in Burlington, NC?
Top Zip Codes with the Highest Percentage of Population Employed in Computer & Mathematics in Burlington, NC are:
What zip code has the Highest Percentage of Population Employed in Computer & Mathematics in Burlington, NC?
27215 has the Highest Percentage of Population Employed in Computer & Mathematics in Burlington, NC with 2.7%.
What is the Percentage of Population Employed in Computer & Mathematics in Burlington, NC?
Percentage of Population Employed in Computer & Mathematics in Burlington is 1.7%.
What is the Percentage of Population Employed in Computer & Mathematics in North Carolina?
Percentage of Population Employed in Computer & Mathematics in North Carolina is 3.5%.
What is the Percentage of Population Employed in Computer & Mathematics in the United States?
Percentage of Population Employed in Computer & Mathematics in the United States is 3.5%.