Willow Springs, MO Map & Demographics
Willow Springs Map
Willow Springs Overview
$22,393
PER CAPITA INCOME
$51,818
AVG FAMILY INCOME
$39,654
AVG HOUSEHOLD INCOME
47.9%
WAGE / INCOME GAP [ % ]
52.1¢/ $1
WAGE / INCOME GAP [ $ ]
0.44
INEQUALITY / GINI INDEX
2,125
TOTAL POPULATION
1,087
MALE POPULATION
1,038
FEMALE POPULATION
104.72
MALES / 100 FEMALES
95.49
FEMALES / 100 MALES
33.8
MEDIAN AGE
3.3
AVG FAMILY SIZE
2.5
AVG HOUSEHOLD SIZE
1,028
LABOR FORCE [ PEOPLE ]
59.0%
PERCENT IN LABOR FORCE
9.0%
UNEMPLOYMENT RATE
Willow Springs Zip Codes
Willow Springs Area Codes
Income in Willow Springs
Income Overview in Willow Springs
Per Capita Income in Willow Springs is $22,393, while median incomes of families and households are $51,818 and $39,654 respectively.
| Characteristic | Number | Measure |
| Per Capita Income | 2,125 | $22,393 |
| Median Family Income | 502 | $51,818 |
| Mean Family Income | 502 | $64,480 |
| Median Household Income | 846 | $39,654 |
| Mean Household Income | 846 | $52,730 |
| Income Deficit | 502 | $0 |
| Wage / Income Gap (%) | 2,125 | 47.90% |
| Wage / Income Gap ($) | 2,125 | 52.10¢ per $1 |
| Gini / Inequality Index | 2,125 | 0.44 |
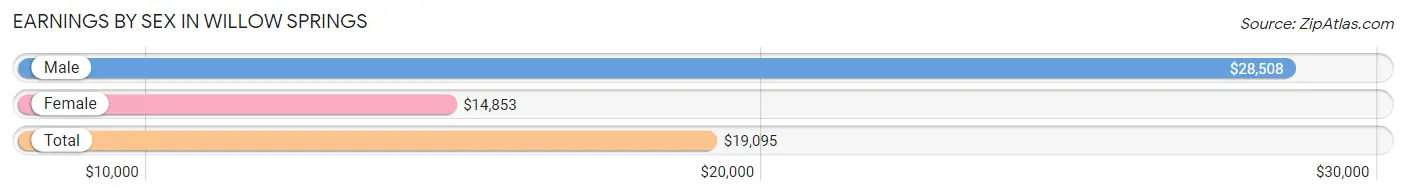
Earnings by Sex in Willow Springs
Average Earnings in Willow Springs are $19,095, $28,508 for men and $14,853 for women, a difference of 47.9%.
| Sex | Number | Average Earnings |
| Male | 621 (52.7%) | $28,508 |
| Female | 558 (47.3%) | $14,853 |
| Total | 1,179 (100.0%) | $19,095 |
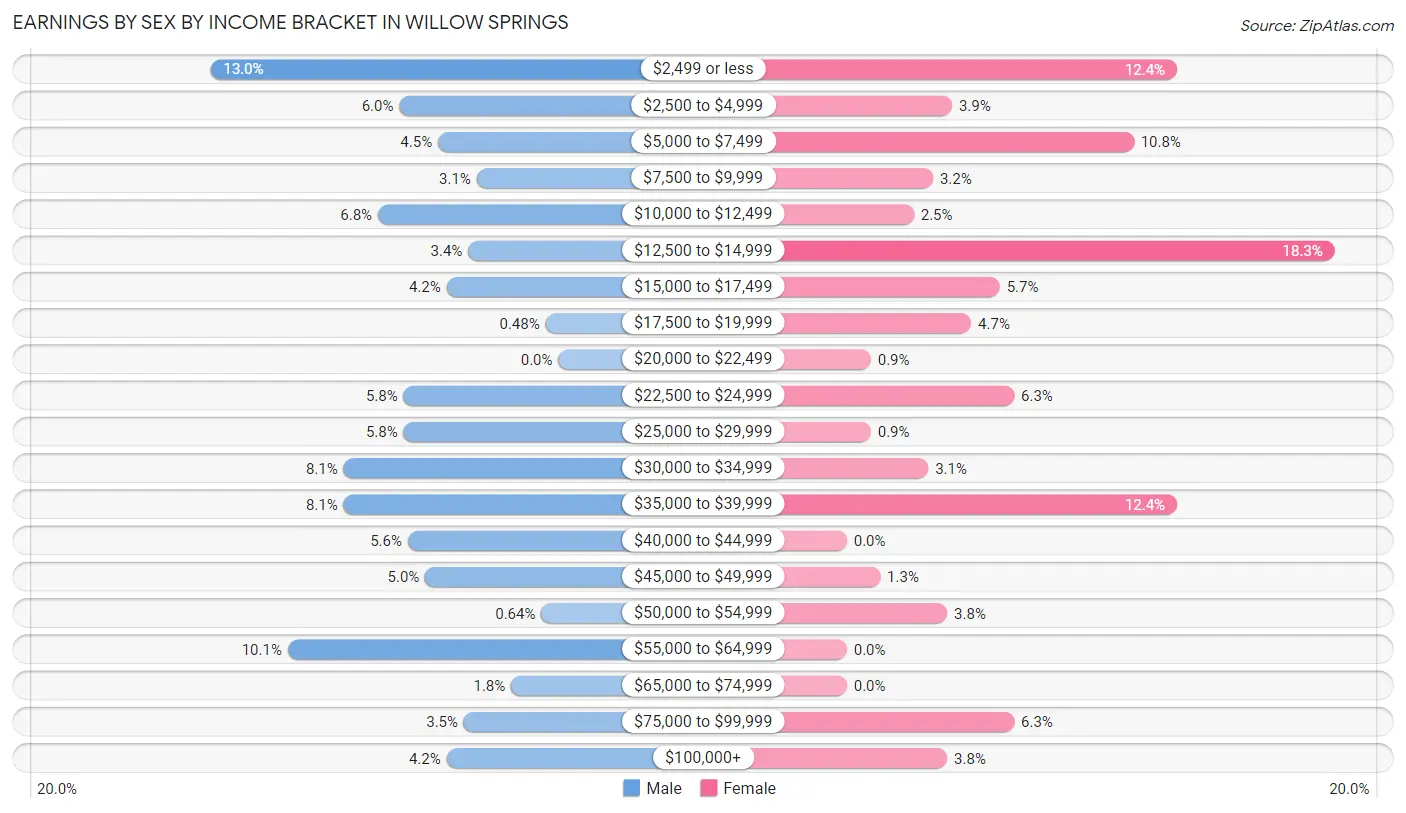
Earnings by Sex by Income Bracket in Willow Springs
The most common earnings brackets in Willow Springs are $2,499 or less for men (81 | 13.0%) and $12,500 to $14,999 for women (102 | 18.3%).
| Income | Male | Female |
| $2,499 or less | 81 (13.0%) | 69 (12.4%) |
| $2,500 to $4,999 | 37 (6.0%) | 22 (3.9%) |
| $5,000 to $7,499 | 28 (4.5%) | 60 (10.7%) |
| $7,500 to $9,999 | 19 (3.1%) | 18 (3.2%) |
| $10,000 to $12,499 | 42 (6.8%) | 14 (2.5%) |
| $12,500 to $14,999 | 21 (3.4%) | 102 (18.3%) |
| $15,000 to $17,499 | 26 (4.2%) | 32 (5.7%) |
| $17,500 to $19,999 | 3 (0.5%) | 26 (4.7%) |
| $20,000 to $22,499 | 0 (0.0%) | 5 (0.9%) |
| $22,500 to $24,999 | 36 (5.8%) | 35 (6.3%) |
| $25,000 to $29,999 | 36 (5.8%) | 5 (0.9%) |
| $30,000 to $34,999 | 50 (8.1%) | 17 (3.0%) |
| $35,000 to $39,999 | 50 (8.1%) | 69 (12.4%) |
| $40,000 to $44,999 | 35 (5.6%) | 0 (0.0%) |
| $45,000 to $49,999 | 31 (5.0%) | 7 (1.3%) |
| $50,000 to $54,999 | 4 (0.6%) | 21 (3.8%) |
| $55,000 to $64,999 | 63 (10.1%) | 0 (0.0%) |
| $65,000 to $74,999 | 11 (1.8%) | 0 (0.0%) |
| $75,000 to $99,999 | 22 (3.5%) | 35 (6.3%) |
| $100,000+ | 26 (4.2%) | 21 (3.8%) |
| Total | 621 (100.0%) | 558 (100.0%) |
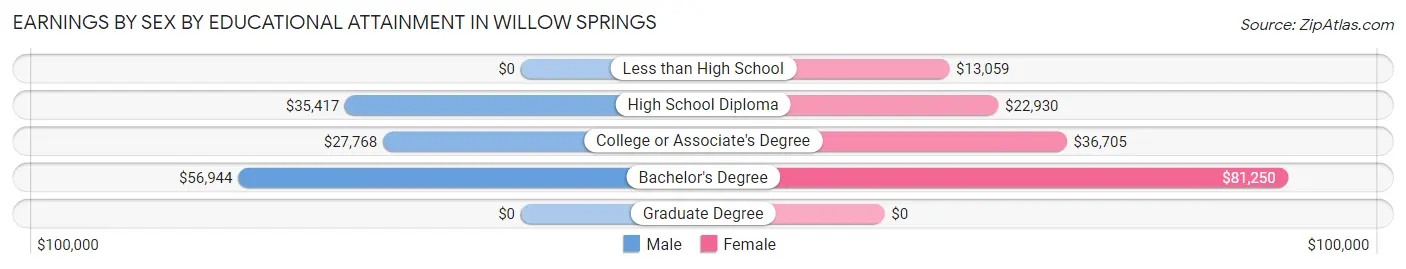
Earnings by Sex by Educational Attainment in Willow Springs
Average earnings in Willow Springs are $34,628 for men and $19,188 for women, a difference of 44.6%. Men with an educational attainment of bachelor's degree enjoy the highest average annual earnings of $56,944, while those with college or associate's degree education earn the least with $27,768. Women with an educational attainment of bachelor's degree earn the most with the average annual earnings of $81,250, while those with less than high school education have the smallest earnings of $13,059.
| Educational Attainment | Male Income | Female Income |
| Less than High School | - | - |
| High School Diploma | $35,417 | $22,930 |
| College or Associate's Degree | $27,768 | $36,705 |
| Bachelor's Degree | $56,944 | $81,250 |
| Graduate Degree | - | - |
| Total | $34,628 | $19,188 |
Family Income in Willow Springs
Family Income Brackets in Willow Springs
According to the Willow Springs family income data, there are 130 families falling into the $50,000 to $74,999 income range, which is the most common income bracket and makes up 25.9% of all families. Conversely, the $10,000 to $14,999 income bracket is the least frequent group with only 8 families (1.6%) belonging to this category.
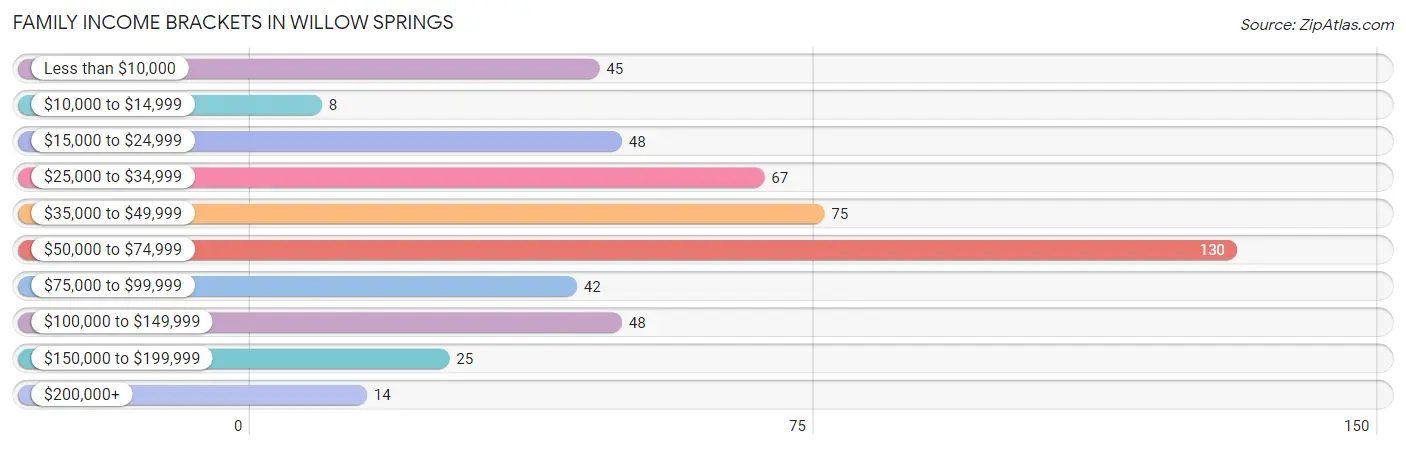
| Income Bracket | # Families | % Families |
| Less than $10,000 | 45 | 9.0% |
| $10,000 to $14,999 | 8 | 1.6% |
| $15,000 to $24,999 | 48 | 9.6% |
| $25,000 to $34,999 | 67 | 13.3% |
| $35,000 to $49,999 | 75 | 14.9% |
| $50,000 to $74,999 | 130 | 25.9% |
| $75,000 to $99,999 | 42 | 8.4% |
| $100,000 to $149,999 | 48 | 9.6% |
| $150,000 to $199,999 | 25 | 5.0% |
| $200,000+ | 14 | 2.8% |
Family Income by Famaliy Size in Willow Springs
6-person families (24 | 4.8%) account for the highest median family income in Willow Springs with $109,643 per family, while 2-person families (283 | 56.4%) have the highest median income of $24,729 per family member.
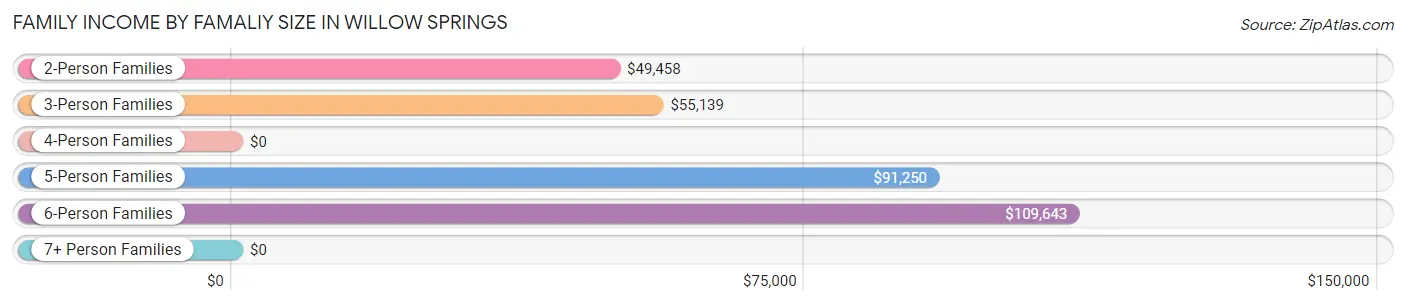
| Income Bracket | # Families | Median Income |
| 2-Person Families | 283 (56.4%) | $49,458 |
| 3-Person Families | 83 (16.5%) | $55,139 |
| 4-Person Families | 91 (18.1%) | $0 |
| 5-Person Families | 21 (4.2%) | $91,250 |
| 6-Person Families | 24 (4.8%) | $109,643 |
| 7+ Person Families | 0 (0.0%) | $0 |
| Total | 502 (100.0%) | $51,818 |
Family Income by Number of Earners in Willow Springs
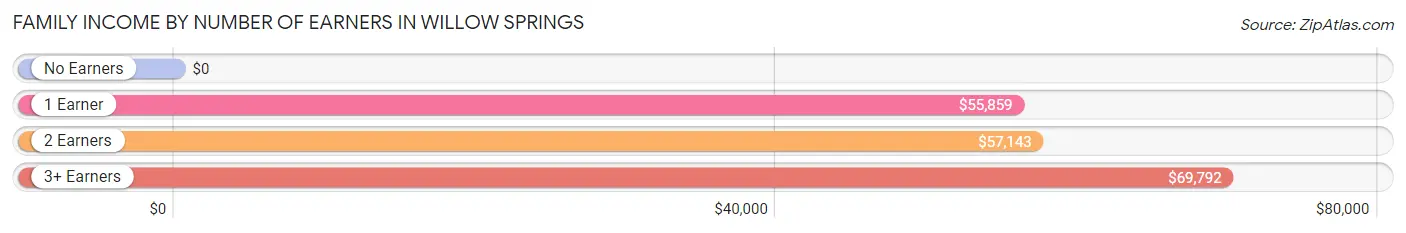
| Number of Earners | # Families | Median Income |
| No Earners | 105 (20.9%) | $0 |
| 1 Earner | 117 (23.3%) | $55,859 |
| 2 Earners | 194 (38.7%) | $57,143 |
| 3+ Earners | 86 (17.1%) | $69,792 |
| Total | 502 (100.0%) | $51,818 |
Household Income in Willow Springs
Household Income Brackets in Willow Springs
With 174 households falling in the category, the $50,000 to $74,999 income range is the most frequent in Willow Springs, accounting for 20.6% of all households. In contrast, only 14 households (1.7%) fall into the $200,000+ income bracket, making it the least populous group.
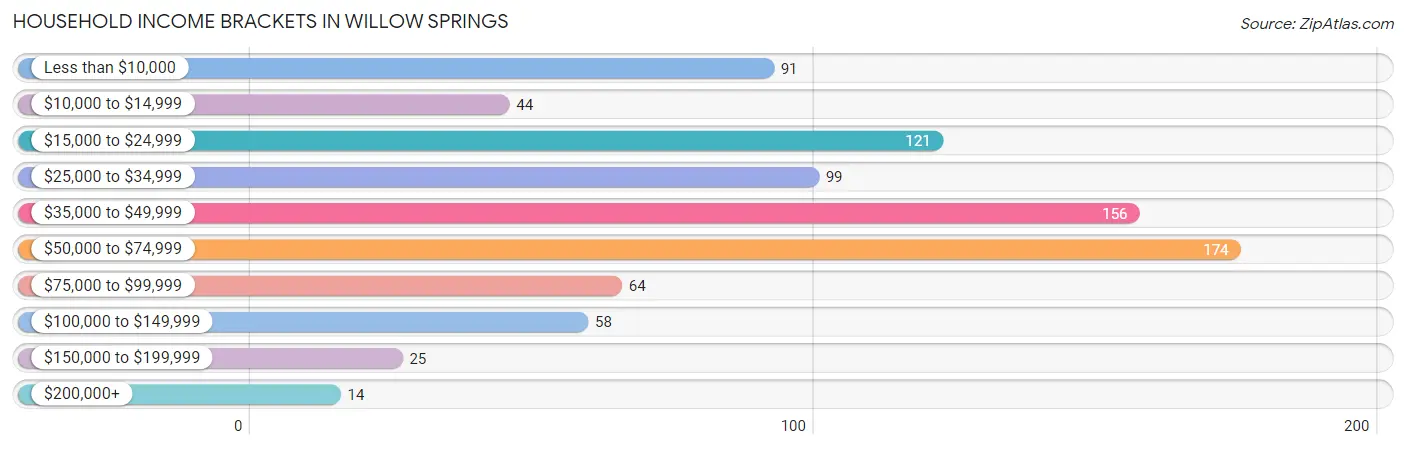
| Income Bracket | # Households | % Households |
| Less than $10,000 | 91 | 10.8% |
| $10,000 to $14,999 | 44 | 5.2% |
| $15,000 to $24,999 | 121 | 14.3% |
| $25,000 to $34,999 | 99 | 11.7% |
| $35,000 to $49,999 | 156 | 18.4% |
| $50,000 to $74,999 | 174 | 20.6% |
| $75,000 to $99,999 | 64 | 7.6% |
| $100,000 to $149,999 | 58 | 6.9% |
| $150,000 to $199,999 | 25 | 3.0% |
| $200,000+ | 14 | 1.7% |
Household Income by Householder Age in Willow Springs
The median household income in Willow Springs is $39,654, with the highest median household income of $47,813 found in the 25 to 44 years age bracket for the primary householder. A total of 299 households (35.3%) fall into this category. Meanwhile, the 15 to 24 years age bracket for the primary householder has the lowest median household income of $0, with 68 households (8.0%) in this group.
| Income Bracket | # Households | Median Income |
| 15 to 24 Years | 68 (8.0%) | $0 |
| 25 to 44 Years | 299 (35.3%) | $47,813 |
| 45 to 64 Years | 265 (31.3%) | $39,647 |
| 65+ Years | 214 (25.3%) | $31,458 |
| Total | 846 (100.0%) | $39,654 |
Poverty in Willow Springs
Income Below Poverty by Sex and Age in Willow Springs
With 12.9% poverty level for males and 22.0% for females among the residents of Willow Springs, 35 to 44 year old males and 16 and 17 year old females are the most vulnerable to poverty, with 46 males (37.4%) and 27 females (77.1%) in their respective age groups living below the poverty level.
| Age Bracket | Male | Female |
| Under 5 Years | 16 (15.5%) | 3 (3.5%) |
| 5 Years | 0 (0.0%) | 0 (0.0%) |
| 6 to 11 Years | 22 (37.3%) | 38 (64.4%) |
| 12 to 14 Years | 6 (24.0%) | 12 (42.9%) |
| 15 Years | 0 (0.0%) | 0 (0.0%) |
| 16 and 17 Years | 0 (0.0%) | 27 (77.1%) |
| 18 to 24 Years | 0 (0.0%) | 21 (18.9%) |
| 25 to 34 Years | 12 (6.9%) | 47 (34.8%) |
| 35 to 44 Years | 46 (37.4%) | 6 (5.2%) |
| 45 to 54 Years | 23 (35.9%) | 41 (43.6%) |
| 55 to 64 Years | 10 (8.3%) | 11 (6.9%) |
| 65 to 74 Years | 4 (6.1%) | 12 (8.0%) |
| 75 Years and over | 0 (0.0%) | 9 (15.8%) |
| Total | 139 (12.9%) | 227 (22.0%) |
Income Above Poverty by Sex and Age in Willow Springs
According to the poverty statistics in Willow Springs, males aged 5 years and females aged under 5 years are the age groups that are most secure financially, with 100.0% of males and 96.5% of females in these age groups living above the poverty line.
| Age Bracket | Male | Female |
| Under 5 Years | 87 (84.5%) | 82 (96.5%) |
| 5 Years | 11 (100.0%) | 0 (0.0%) |
| 6 to 11 Years | 37 (62.7%) | 21 (35.6%) |
| 12 to 14 Years | 19 (76.0%) | 16 (57.1%) |
| 15 Years | 13 (100.0%) | 0 (0.0%) |
| 16 and 17 Years | 105 (100.0%) | 8 (22.9%) |
| 18 to 24 Years | 153 (100.0%) | 90 (81.1%) |
| 25 to 34 Years | 161 (93.1%) | 88 (65.2%) |
| 35 to 44 Years | 77 (62.6%) | 110 (94.8%) |
| 45 to 54 Years | 41 (64.1%) | 53 (56.4%) |
| 55 to 64 Years | 111 (91.7%) | 149 (93.1%) |
| 65 to 74 Years | 62 (93.9%) | 138 (92.0%) |
| 75 Years and over | 64 (100.0%) | 48 (84.2%) |
| Total | 941 (87.1%) | 803 (78.0%) |
Income Below Poverty Among Married-Couple Families in Willow Springs
The poverty statistics for married-couple families in Willow Springs show that 7.6% or 27 of the total 356 families live below the poverty line. Families with 1 or 2 children have the highest poverty rate of 21.0%, comprising of 20 families. On the other hand, families with 3 or 4 children have the lowest poverty rate of 0.0%, which includes 0 families.
| Children | Above Poverty | Below Poverty |
| No Children | 225 (97.0%) | 7 (3.0%) |
| 1 or 2 Children | 75 (78.9%) | 20 (21.0%) |
| 3 or 4 Children | 29 (100.0%) | 0 (0.0%) |
| 5 or more Children | 0 (0.0%) | 0 (0.0%) |
| Total | 329 (92.4%) | 27 (7.6%) |
Income Below Poverty Among Single-Parent Households in Willow Springs
According to the poverty data in Willow Springs, 25.0% or 9 single-father households and 28.2% or 31 single-mother households are living below the poverty line. Among single-father households, those with 1 or 2 children have the highest poverty rate, with 9 households (75.0%) experiencing poverty. Likewise, among single-mother households, those with 1 or 2 children have the highest poverty rate, with 26 households (29.9%) falling below the poverty line.
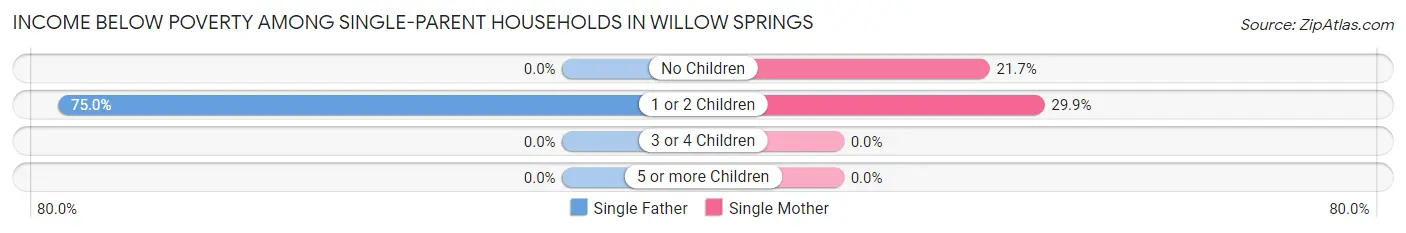
| Children | Single Father | Single Mother |
| No Children | 0 (0.0%) | 5 (21.7%) |
| 1 or 2 Children | 9 (75.0%) | 26 (29.9%) |
| 3 or 4 Children | 0 (0.0%) | 0 (0.0%) |
| 5 or more Children | 0 (0.0%) | 0 (0.0%) |
| Total | 9 (25.0%) | 31 (28.2%) |
Income Below Poverty Among Married-Couple vs Single-Parent Households in Willow Springs
The poverty data for Willow Springs shows that 27 of the married-couple family households (7.6%) and 40 of the single-parent households (27.4%) are living below the poverty level. Within the married-couple family households, those with 1 or 2 children have the highest poverty rate, with 20 households (21.0%) falling below the poverty line. Among the single-parent households, those with 1 or 2 children have the highest poverty rate, with 35 household (35.3%) living below poverty.
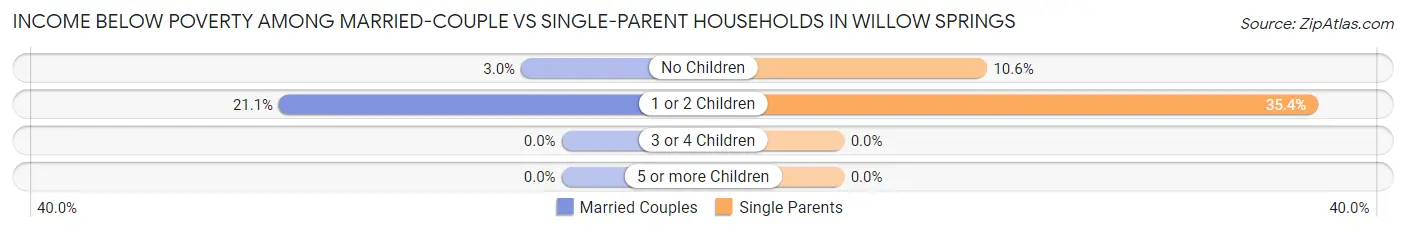
| Children | Married-Couple Families | Single-Parent Households |
| No Children | 7 (3.0%) | 5 (10.6%) |
| 1 or 2 Children | 20 (21.0%) | 35 (35.3%) |
| 3 or 4 Children | 0 (0.0%) | 0 (0.0%) |
| 5 or more Children | 0 (0.0%) | 0 (0.0%) |
| Total | 27 (7.6%) | 40 (27.4%) |
Race in Willow Springs
The most populous races in Willow Springs are White / Caucasian (1,927 | 90.7%), Two or more Races (81 | 3.8%), and Black / African American (68 | 3.2%).
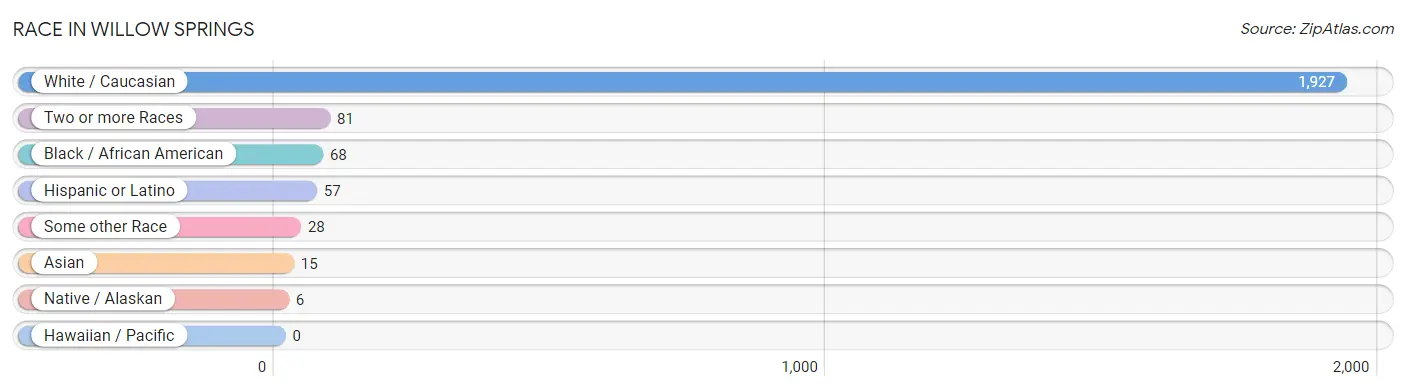
| Race | # Population | % Population |
| Asian | 15 | 0.7% |
| Black / African American | 68 | 3.2% |
| Hawaiian / Pacific | 0 | 0.0% |
| Hispanic or Latino | 57 | 2.7% |
| Native / Alaskan | 6 | 0.3% |
| White / Caucasian | 1,927 | 90.7% |
| Two or more Races | 81 | 3.8% |
| Some other Race | 28 | 1.3% |
| Total | 2,125 | 100.0% |
Ancestry in Willow Springs
The most populous ancestries reported in Willow Springs are German (247 | 11.6%), English (191 | 9.0%), American (143 | 6.7%), Irish (123 | 5.8%), and African (68 | 3.2%), together accounting for 36.3% of all Willow Springs residents.
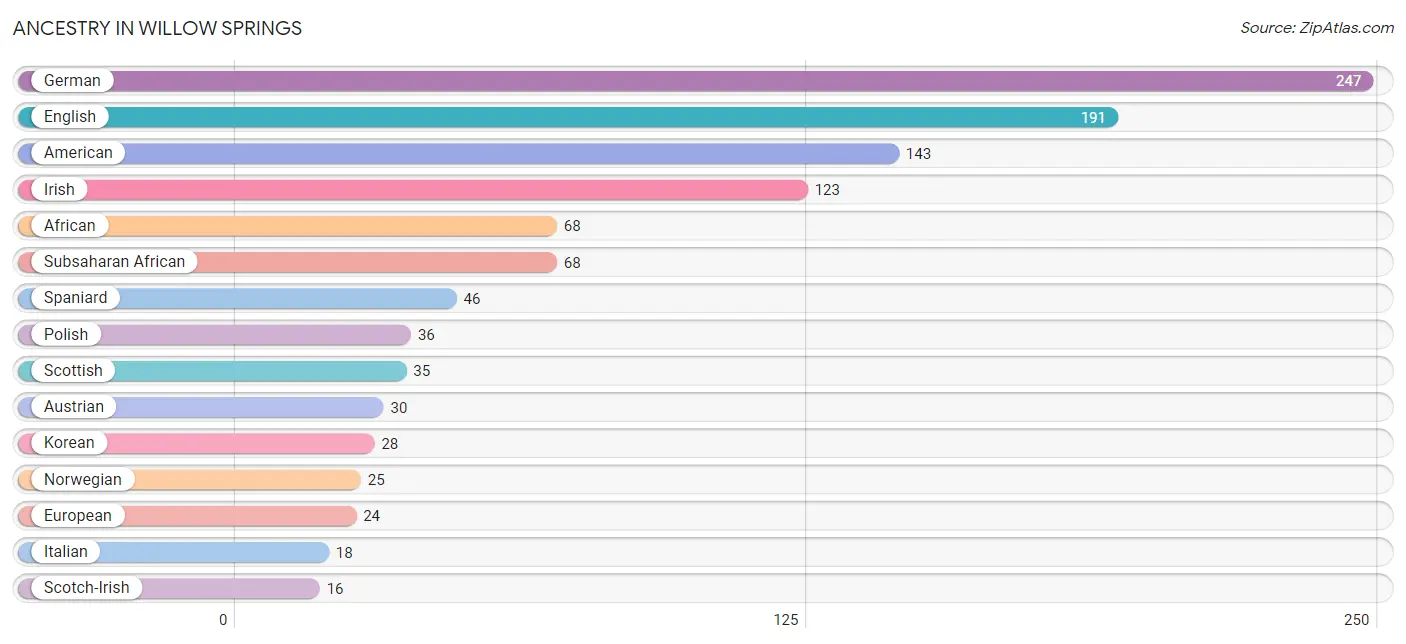
| Ancestry | # Population | % Population |
| African | 68 | 3.2% |
| American | 143 | 6.7% |
| Austrian | 30 | 1.4% |
| Barbadian | 8 | 0.4% |
| British | 3 | 0.1% |
| Burmese | 4 | 0.2% |
| Cajun | 3 | 0.1% |
| Cherokee | 3 | 0.1% |
| Danish | 6 | 0.3% |
| Dutch | 9 | 0.4% |
| English | 191 | 9.0% |
| European | 24 | 1.1% |
| Finnish | 3 | 0.1% |
| French | 9 | 0.4% |
| German | 247 | 11.6% |
| Irish | 123 | 5.8% |
| Italian | 18 | 0.9% |
| Korean | 28 | 1.3% |
| Norwegian | 25 | 1.2% |
| Polish | 36 | 1.7% |
| Portuguese | 4 | 0.2% |
| Puerto Rican | 11 | 0.5% |
| Scotch-Irish | 16 | 0.7% |
| Scottish | 35 | 1.7% |
| Spaniard | 46 | 2.2% |
| Subsaharan African | 68 | 3.2% |
| Swedish | 9 | 0.4% |
| Welsh | 6 | 0.3% | View All 28 Rows |
Immigrants in Willow Springs
The most numerous immigrant groups reported in Willow Springs came from Africa (68 | 3.2%), and Eastern Africa (68 | 3.2%), together accounting for 6.4% of all Willow Springs residents.
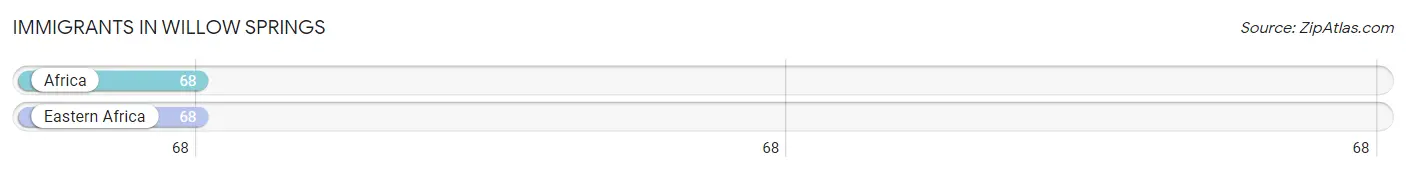
| Immigration Origin | # Population | % Population |
| Africa | 68 | 3.2% |
| Eastern Africa | 68 | 3.2% | View All 2 Rows |
Sex and Age in Willow Springs
Sex and Age in Willow Springs
The most populous age groups in Willow Springs are 15 to 19 Years (172 | 15.8%) for men and 30 to 34 Years (101 | 9.7%) for women.
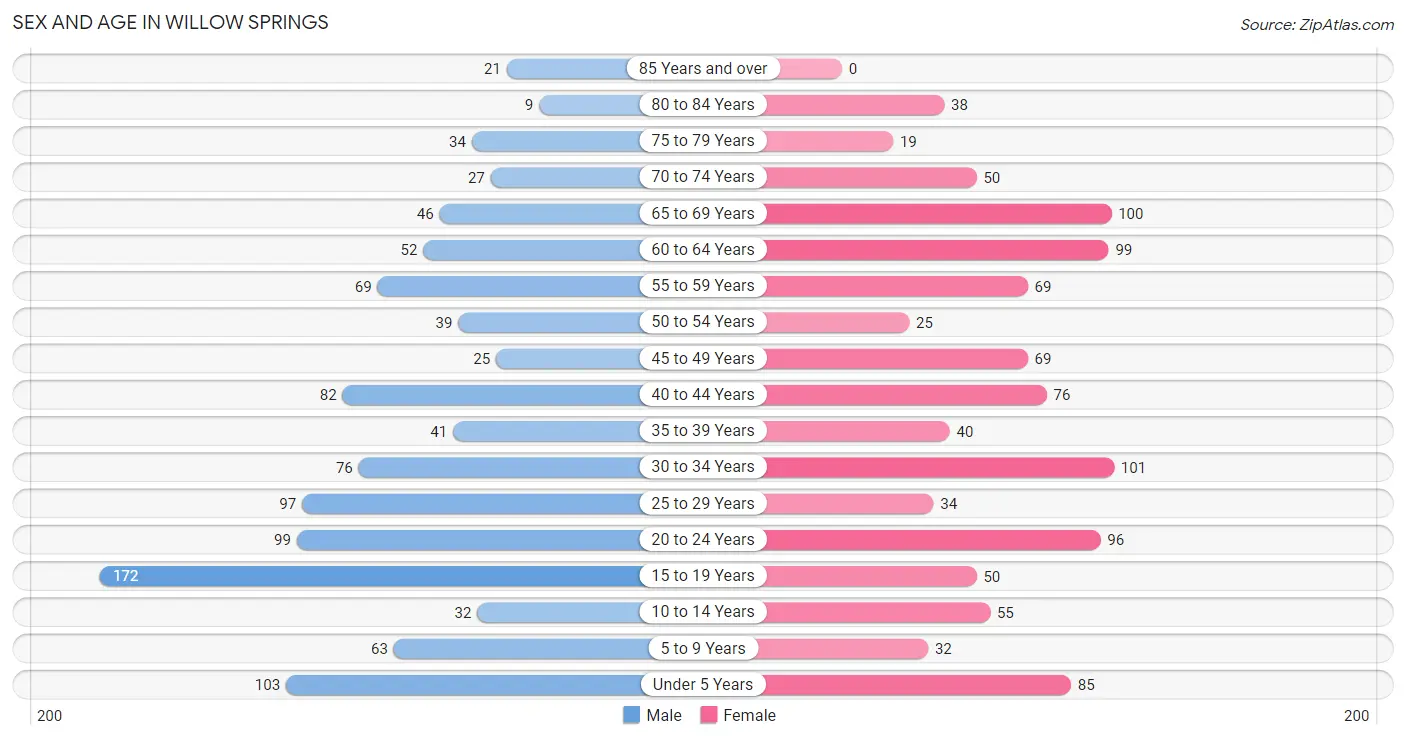
| Age Bracket | Male | Female |
| Under 5 Years | 103 (9.5%) | 85 (8.2%) |
| 5 to 9 Years | 63 (5.8%) | 32 (3.1%) |
| 10 to 14 Years | 32 (2.9%) | 55 (5.3%) |
| 15 to 19 Years | 172 (15.8%) | 50 (4.8%) |
| 20 to 24 Years | 99 (9.1%) | 96 (9.2%) |
| 25 to 29 Years | 97 (8.9%) | 34 (3.3%) |
| 30 to 34 Years | 76 (7.0%) | 101 (9.7%) |
| 35 to 39 Years | 41 (3.8%) | 40 (3.8%) |
| 40 to 44 Years | 82 (7.5%) | 76 (7.3%) |
| 45 to 49 Years | 25 (2.3%) | 69 (6.7%) |
| 50 to 54 Years | 39 (3.6%) | 25 (2.4%) |
| 55 to 59 Years | 69 (6.4%) | 69 (6.7%) |
| 60 to 64 Years | 52 (4.8%) | 99 (9.5%) |
| 65 to 69 Years | 46 (4.2%) | 100 (9.6%) |
| 70 to 74 Years | 27 (2.5%) | 50 (4.8%) |
| 75 to 79 Years | 34 (3.1%) | 19 (1.8%) |
| 80 to 84 Years | 9 (0.8%) | 38 (3.7%) |
| 85 Years and over | 21 (1.9%) | 0 (0.0%) |
| Total | 1,087 (100.0%) | 1,038 (100.0%) |
Families and Households in Willow Springs
Median Family Size in Willow Springs
The median family size in Willow Springs is 3.30 persons per family, with single female/mother families (110 | 21.9%) accounting for the largest median family size of 3.59 persons per family. On the other hand, married-couple families (356 | 70.9%) represent the smallest median family size with 3.21 persons per family.
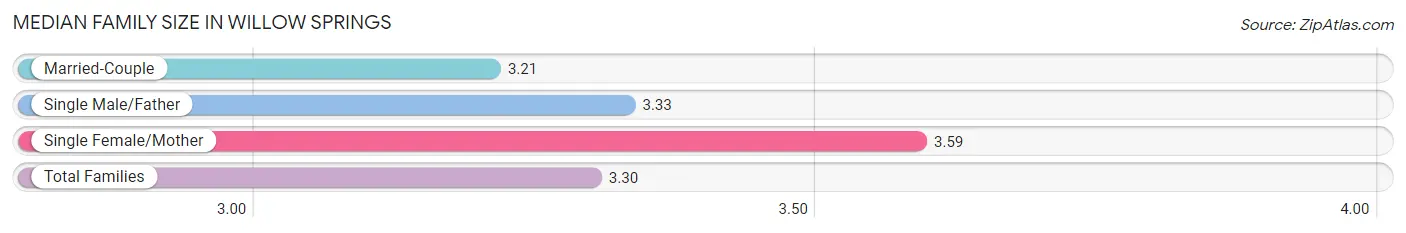
| Family Type | # Families | Family Size |
| Married-Couple | 356 (70.9%) | 3.21 |
| Single Male/Father | 36 (7.2%) | 3.33 |
| Single Female/Mother | 110 (21.9%) | 3.59 |
| Total Families | 502 (100.0%) | 3.30 |
Median Household Size in Willow Springs
The median household size in Willow Springs is 2.49 persons per household, with single female/mother households (110 | 13.0%) accounting for the largest median household size of 4.12 persons per household. non-family households (344 | 40.7%) represent the smallest median household size with 1.10 persons per household.
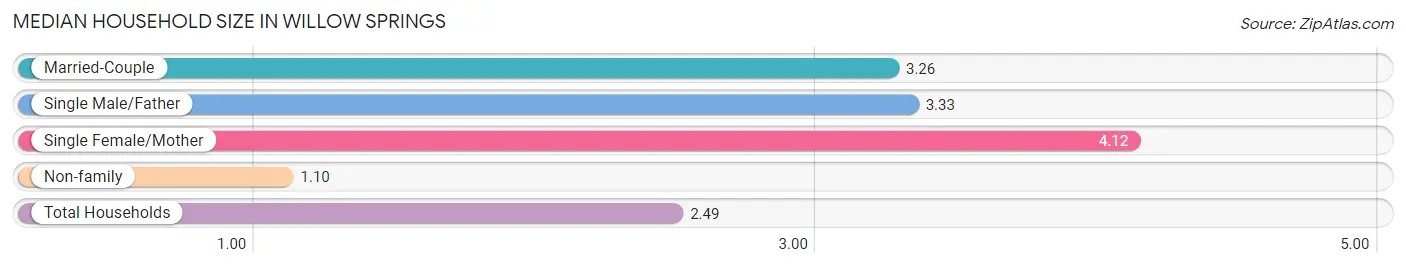
| Household Type | # Households | Household Size |
| Married-Couple | 356 (42.1%) | 3.26 |
| Single Male/Father | 36 (4.3%) | 3.33 |
| Single Female/Mother | 110 (13.0%) | 4.12 |
| Non-family | 344 (40.7%) | 1.10 |
| Total Households | 846 (100.0%) | 2.49 |
Household Size by Marriage Status in Willow Springs
Out of a total of 846 households in Willow Springs, 502 (59.3%) are family households, while 344 (40.7%) are nonfamily households. The most numerous type of family households are 2-person households, comprising 264, and the most common type of nonfamily households are 1-person households, comprising 314.
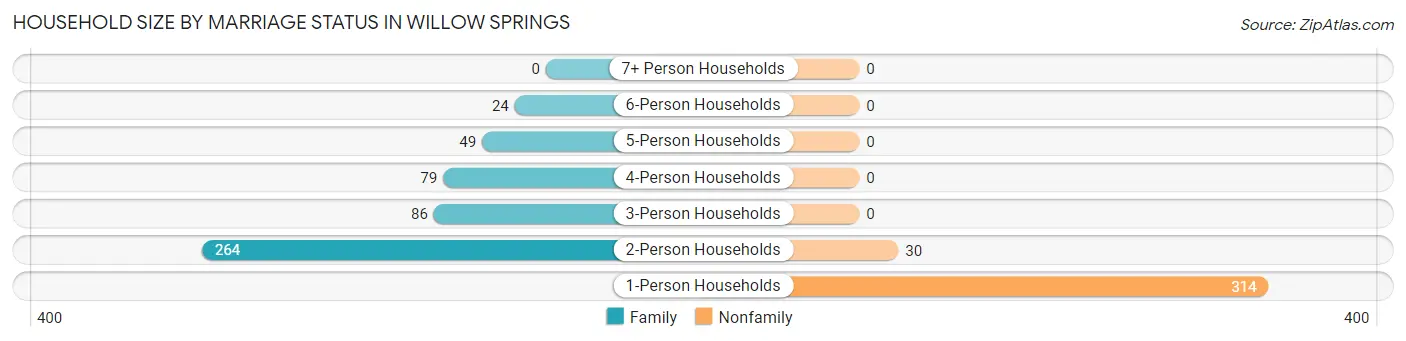
| Household Size | Family Households | Nonfamily Households |
| 1-Person Households | - | 314 (37.1%) |
| 2-Person Households | 264 (31.2%) | 30 (3.5%) |
| 3-Person Households | 86 (10.2%) | 0 (0.0%) |
| 4-Person Households | 79 (9.3%) | 0 (0.0%) |
| 5-Person Households | 49 (5.8%) | 0 (0.0%) |
| 6-Person Households | 24 (2.8%) | 0 (0.0%) |
| 7+ Person Households | 0 (0.0%) | 0 (0.0%) |
| Total | 502 (59.3%) | 344 (40.7%) |
Female Fertility in Willow Springs
Fertility by Age in Willow Springs
Average fertility rate in Willow Springs is 148.0 births per 1,000 women. Women in the age bracket of 20 to 34 years have the highest fertility rate with 299.0 births per 1,000 women. Women in the age bracket of 20 to 34 years acount for 100.0% of all women with births.
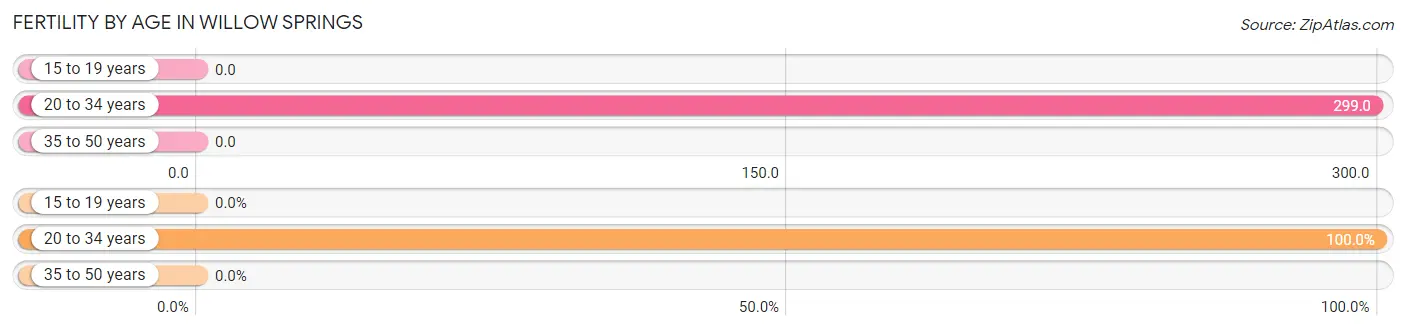
| Age Bracket | Women with Births | Births / 1,000 Women |
| 15 to 19 years | 0 (0.0%) | 0.0 |
| 20 to 34 years | 69 (100.0%) | 299.0 |
| 35 to 50 years | 0 (0.0%) | 0.0 |
| Total | 69 (100.0%) | 148.0 |
Fertility by Age by Marriage Status in Willow Springs
50.7% of women with births (69) in Willow Springs are married. The highest percentage of unmarried women with births falls into 20 to 34 years age bracket with 49.3% of them unmarried at the time of birth, while the lowest percentage of unmarried women with births belong to 20 to 34 years age bracket with 49.3% of them unmarried.
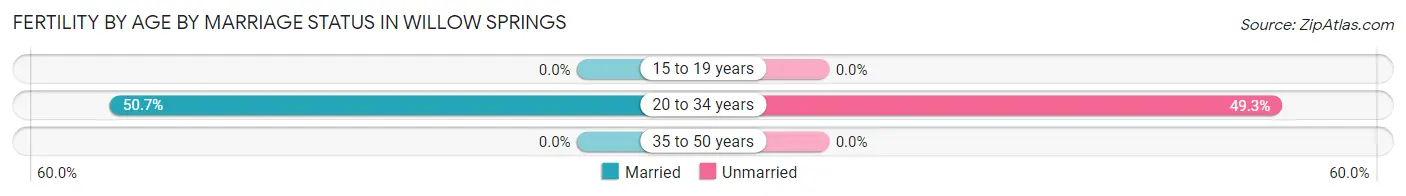
| Age Bracket | Married | Unmarried |
| 15 to 19 years | 0 (0.0%) | 0 (0.0%) |
| 20 to 34 years | 35 (50.7%) | 34 (49.3%) |
| 35 to 50 years | 0 (0.0%) | 0 (0.0%) |
| Total | 35 (50.7%) | 34 (49.3%) |
Fertility by Education in Willow Springs
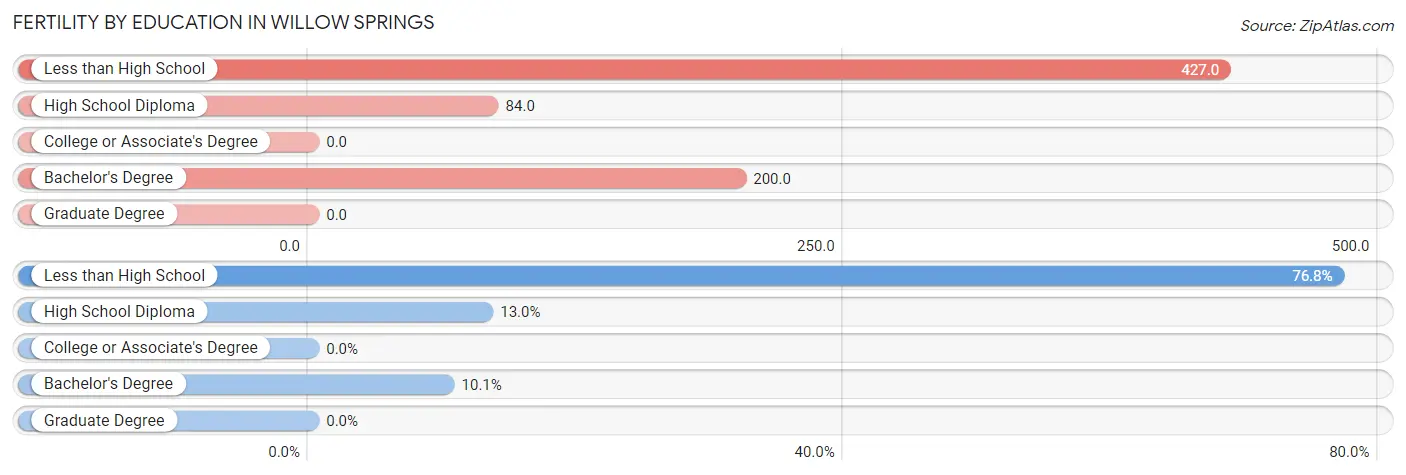
| Educational Attainment | Women with Births | Births / 1,000 Women |
| Less than High School | 53 (76.8%) | 427.0 |
| High School Diploma | 9 (13.0%) | 84.0 |
| College or Associate's Degree | 0 (0.0%) | 0.0 |
| Bachelor's Degree | 7 (10.1%) | 200.0 |
| Graduate Degree | 0 (0.0%) | 0.0 |
| Total | 69 (100.0%) | 148.0 |
Fertility by Education by Marriage Status in Willow Springs
49.3% of women with births in Willow Springs are unmarried. Women with the educational attainment of high school diploma are most likely to be married with 100.0% of them married at childbirth, while women with the educational attainment of less than high school are least likely to be married with 64.1% of them unmarried at childbirth.
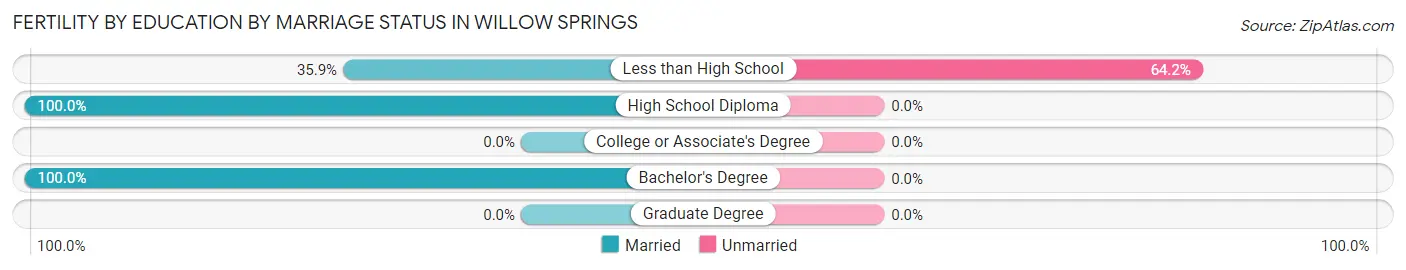
| Educational Attainment | Married | Unmarried |
| Less than High School | 19 (35.8%) | 34 (64.1%) |
| High School Diploma | 9 (100.0%) | 0 (0.0%) |
| College or Associate's Degree | 0 (0.0%) | 0 (0.0%) |
| Bachelor's Degree | 7 (100.0%) | 0 (0.0%) |
| Graduate Degree | 0 (0.0%) | 0 (0.0%) |
| Total | 35 (50.7%) | 34 (49.3%) |
Employment Characteristics in Willow Springs
Employment by Class of Employer in Willow Springs
Among the 927 employed individuals in Willow Springs, private company employees (631 | 68.1%), not-for-profit organizations (80 | 8.6%), and local government employees (60 | 6.5%) make up the most common classes of employment.
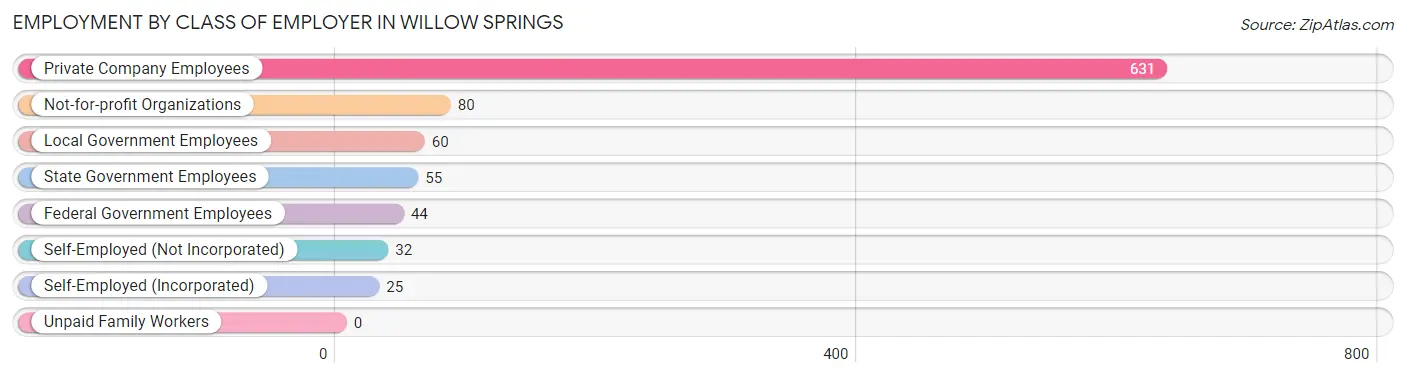
| Employer Class | # Employees | % Employees |
| Private Company Employees | 631 | 68.1% |
| Self-Employed (Incorporated) | 25 | 2.7% |
| Self-Employed (Not Incorporated) | 32 | 3.5% |
| Not-for-profit Organizations | 80 | 8.6% |
| Local Government Employees | 60 | 6.5% |
| State Government Employees | 55 | 5.9% |
| Federal Government Employees | 44 | 4.8% |
| Unpaid Family Workers | 0 | 0.0% |
| Total | 927 | 100.0% |
Employment Status by Age in Willow Springs
According to the labor force statistics for Willow Springs, out of the total population over 16 years of age (1,742), 59.0% or 1,028 individuals are in the labor force, with 9.0% or 93 of them unemployed. The age group with the highest labor force participation rate is 25 to 29 years, with 85.5% or 112 individuals in the labor force. Within the labor force, the 25 to 29 years age range has the highest percentage of unemployed individuals, with 36.6% or 41 of them being unemployed.
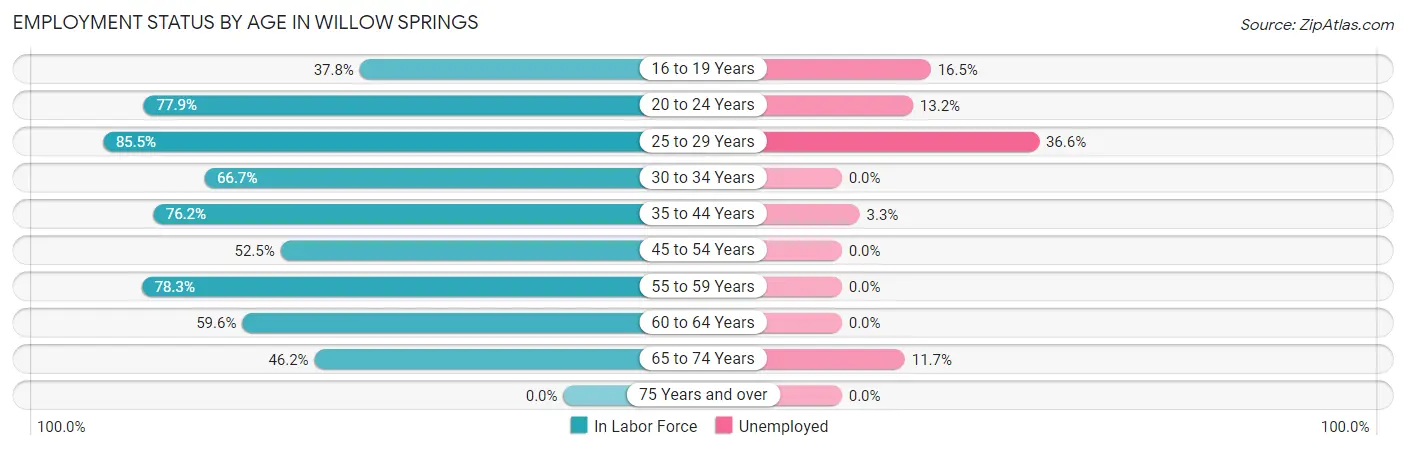
| Age Bracket | In Labor Force | Unemployed |
| 16 to 19 Years | 79 (37.8%) | 13 (16.5%) |
| 20 to 24 Years | 152 (77.9%) | 20 (13.2%) |
| 25 to 29 Years | 112 (85.5%) | 41 (36.6%) |
| 30 to 34 Years | 118 (66.7%) | 0 (0.0%) |
| 35 to 44 Years | 182 (76.2%) | 6 (3.3%) |
| 45 to 54 Years | 83 (52.5%) | 0 (0.0%) |
| 55 to 59 Years | 108 (78.3%) | 0 (0.0%) |
| 60 to 64 Years | 90 (59.6%) | 0 (0.0%) |
| 65 to 74 Years | 103 (46.2%) | 12 (11.7%) |
| 75 Years and over | 0 (0.0%) | 0 (0.0%) |
| Total | 1,028 (59.0%) | 93 (9.0%) |
Employment Status by Educational Attainment in Willow Springs
According to labor force statistics for Willow Springs, 69.7% of individuals (693) out of the total population between 25 and 64 years of age (994) are in the labor force, with 6.8% or 47 of them being unemployed. The group with the highest labor force participation rate are those with the educational attainment of bachelor's degree or higher, with 80.5% or 107 individuals in the labor force. Within the labor force, individuals with college / associate degree education have the highest percentage of unemployment, with 9.9% or 25 of them being unemployed.
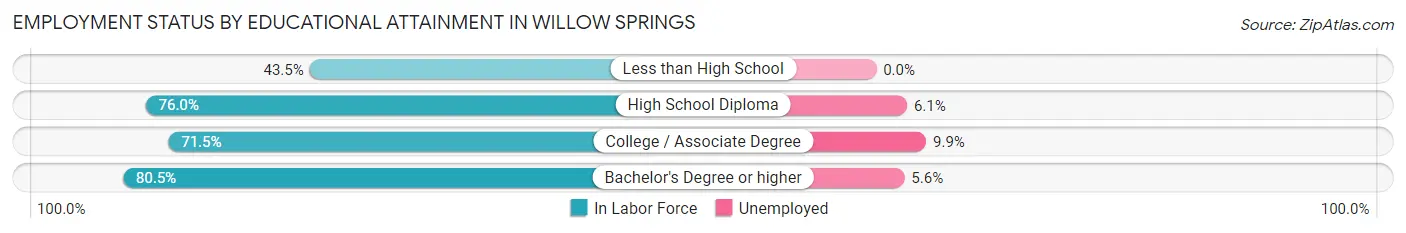
| Educational Attainment | In Labor Force | Unemployed |
| Less than High School | 70 (43.5%) | 0 (0.0%) |
| High School Diploma | 263 (76.0%) | 21 (6.1%) |
| College / Associate Degree | 253 (71.5%) | 35 (9.9%) |
| Bachelor's Degree or higher | 107 (80.5%) | 7 (5.6%) |
| Total | 693 (69.7%) | 68 (6.8%) |
Employment Occupations by Sex in Willow Springs
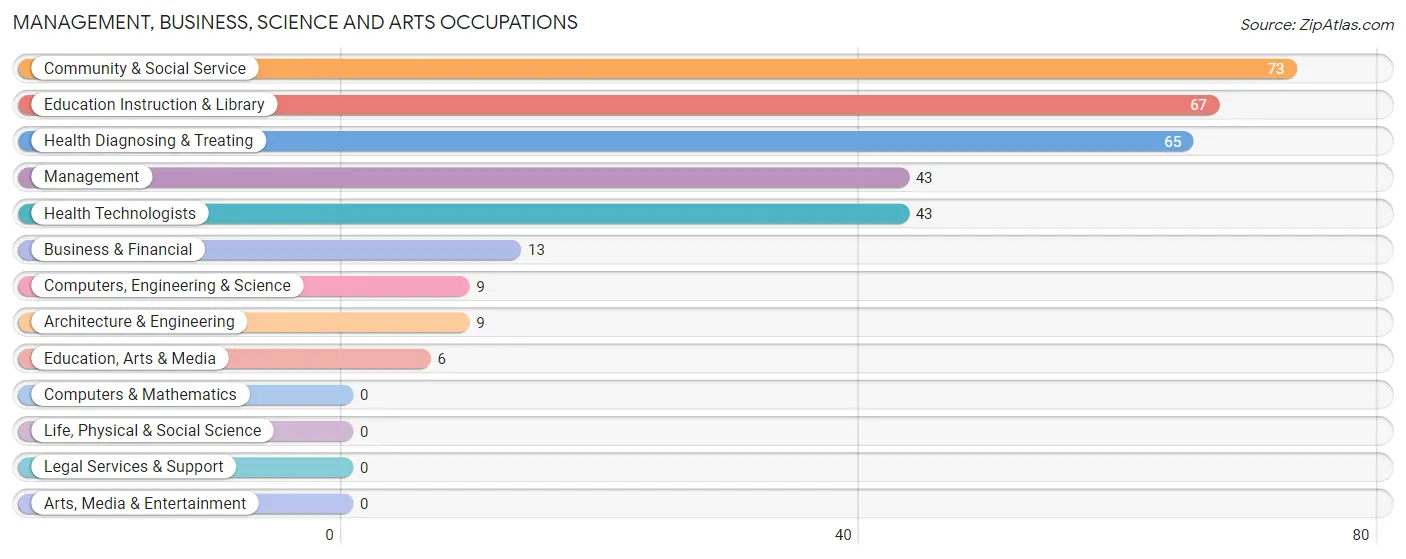
Management, Business, Science and Arts Occupations
The most common Management, Business, Science and Arts occupations in Willow Springs are Community & Social Service (73 | 7.8%), Education Instruction & Library (67 | 7.2%), Health Diagnosing & Treating (65 | 7.0%), Management (43 | 4.6%), and Health Technologists (43 | 4.6%).
Management, Business, Science and Arts Occupations by Sex
Within the Management, Business, Science and Arts occupations in Willow Springs, the most male-oriented occupations are Computers, Engineering & Science (100.0%), Architecture & Engineering (100.0%), and Education, Arts & Media (100.0%), while the most female-oriented occupations are Education Instruction & Library (100.0%), Community & Social Service (91.8%), and Health Diagnosing & Treating (63.1%).
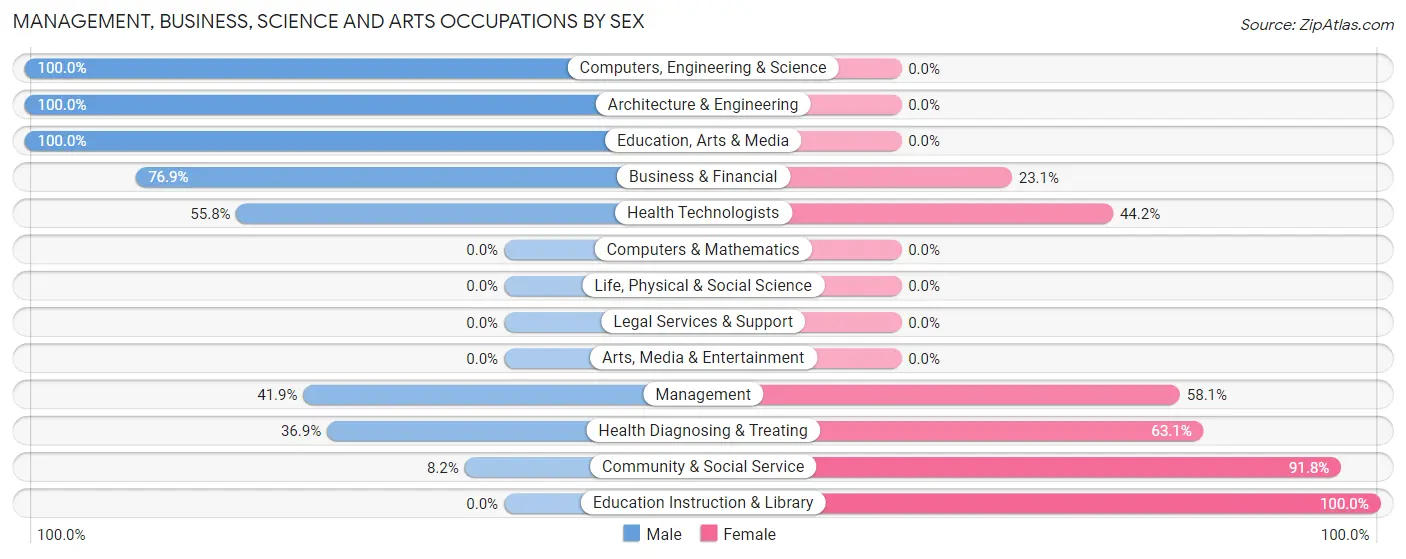
| Occupation | Male | Female |
| Management | 18 (41.9%) | 25 (58.1%) |
| Business & Financial | 10 (76.9%) | 3 (23.1%) |
| Computers, Engineering & Science | 9 (100.0%) | 0 (0.0%) |
| Computers & Mathematics | 0 (0.0%) | 0 (0.0%) |
| Architecture & Engineering | 9 (100.0%) | 0 (0.0%) |
| Life, Physical & Social Science | 0 (0.0%) | 0 (0.0%) |
| Community & Social Service | 6 (8.2%) | 67 (91.8%) |
| Education, Arts & Media | 6 (100.0%) | 0 (0.0%) |
| Legal Services & Support | 0 (0.0%) | 0 (0.0%) |
| Education Instruction & Library | 0 (0.0%) | 67 (100.0%) |
| Arts, Media & Entertainment | 0 (0.0%) | 0 (0.0%) |
| Health Diagnosing & Treating | 24 (36.9%) | 41 (63.1%) |
| Health Technologists | 24 (55.8%) | 19 (44.2%) |
| Total (Category) | 67 (33.0%) | 136 (67.0%) |
| Total (Overall) | 451 (48.2%) | 484 (51.8%) |
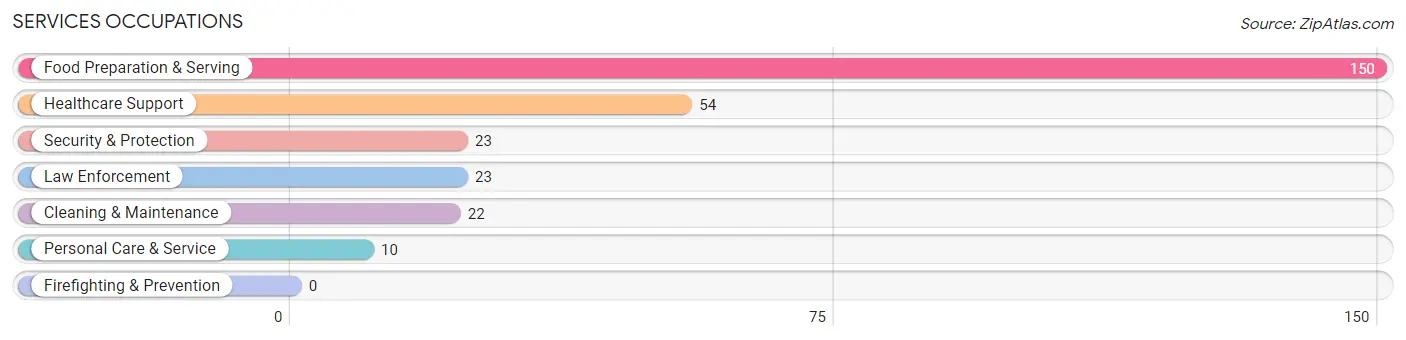
Services Occupations
The most common Services occupations in Willow Springs are Food Preparation & Serving (150 | 16.0%), Healthcare Support (54 | 5.8%), Security & Protection (23 | 2.5%), Law Enforcement (23 | 2.5%), and Cleaning & Maintenance (22 | 2.4%).
Services Occupations by Sex
Within the Services occupations in Willow Springs, the most male-oriented occupations are Security & Protection (100.0%), Law Enforcement (100.0%), and Food Preparation & Serving (36.0%), while the most female-oriented occupations are Cleaning & Maintenance (100.0%), Personal Care & Service (100.0%), and Healthcare Support (98.2%).
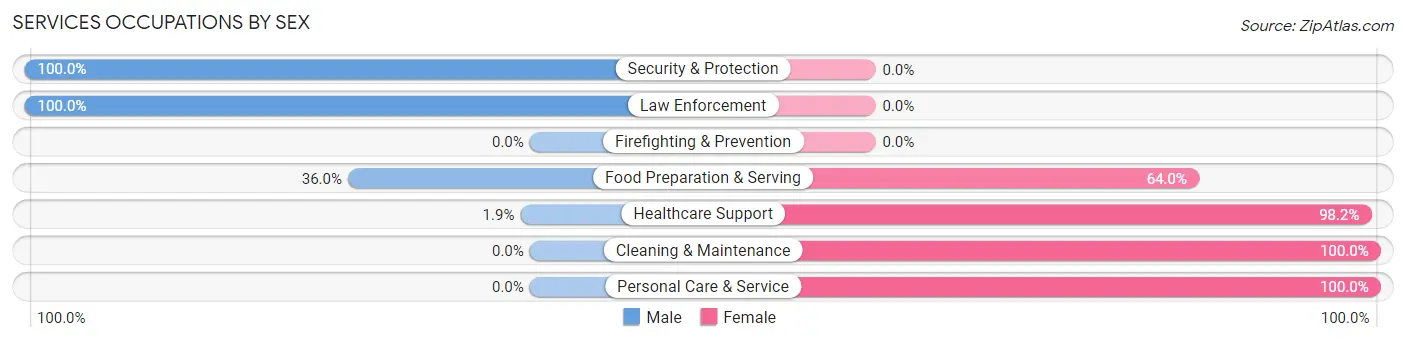
| Occupation | Male | Female |
| Healthcare Support | 1 (1.8%) | 53 (98.2%) |
| Security & Protection | 23 (100.0%) | 0 (0.0%) |
| Firefighting & Prevention | 0 (0.0%) | 0 (0.0%) |
| Law Enforcement | 23 (100.0%) | 0 (0.0%) |
| Food Preparation & Serving | 54 (36.0%) | 96 (64.0%) |
| Cleaning & Maintenance | 0 (0.0%) | 22 (100.0%) |
| Personal Care & Service | 0 (0.0%) | 10 (100.0%) |
| Total (Category) | 78 (30.1%) | 181 (69.9%) |
| Total (Overall) | 451 (48.2%) | 484 (51.8%) |
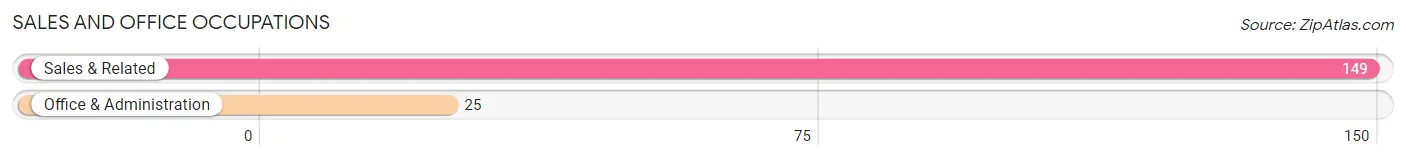
Sales and Office Occupations
The most common Sales and Office occupations in Willow Springs are Sales & Related (149 | 15.9%), and Office & Administration (25 | 2.7%).
Sales and Office Occupations by Sex
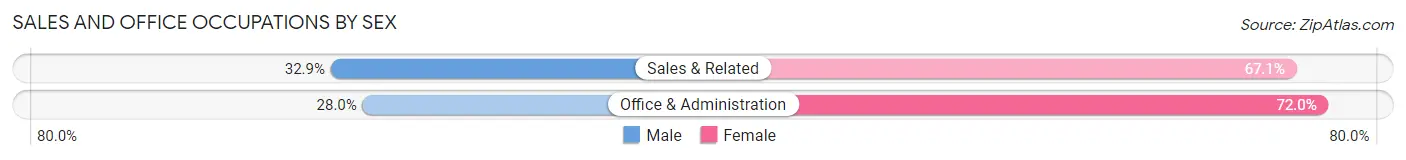
| Occupation | Male | Female |
| Sales & Related | 49 (32.9%) | 100 (67.1%) |
| Office & Administration | 7 (28.0%) | 18 (72.0%) |
| Total (Category) | 56 (32.2%) | 118 (67.8%) |
| Total (Overall) | 451 (48.2%) | 484 (51.8%) |
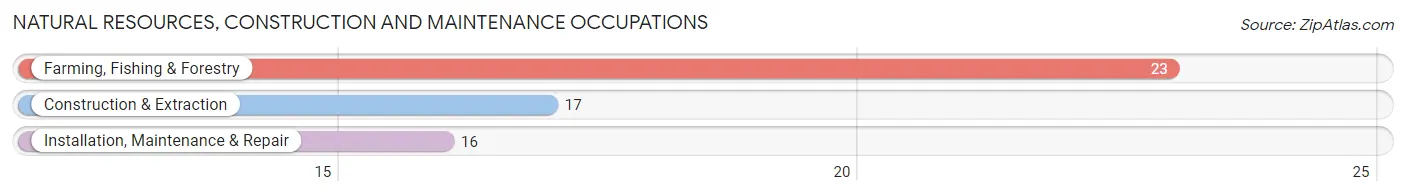
Natural Resources, Construction and Maintenance Occupations
The most common Natural Resources, Construction and Maintenance occupations in Willow Springs are Farming, Fishing & Forestry (23 | 2.5%), Construction & Extraction (17 | 1.8%), and Installation, Maintenance & Repair (16 | 1.7%).
Natural Resources, Construction and Maintenance Occupations by Sex
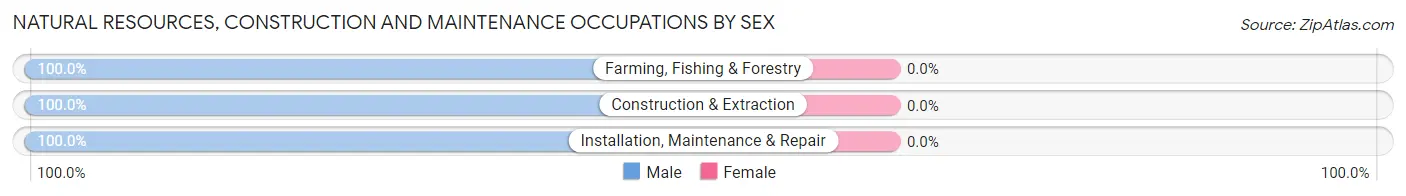
| Occupation | Male | Female |
| Farming, Fishing & Forestry | 23 (100.0%) | 0 (0.0%) |
| Construction & Extraction | 17 (100.0%) | 0 (0.0%) |
| Installation, Maintenance & Repair | 16 (100.0%) | 0 (0.0%) |
| Total (Category) | 56 (100.0%) | 0 (0.0%) |
| Total (Overall) | 451 (48.2%) | 484 (51.8%) |
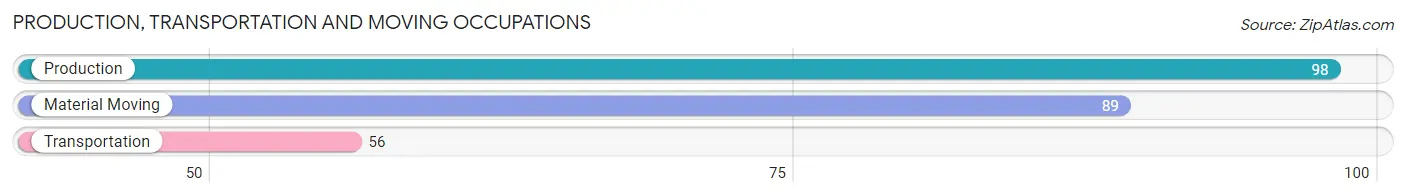
Production, Transportation and Moving Occupations
The most common Production, Transportation and Moving occupations in Willow Springs are Production (98 | 10.5%), Material Moving (89 | 9.5%), and Transportation (56 | 6.0%).
Production, Transportation and Moving Occupations by Sex
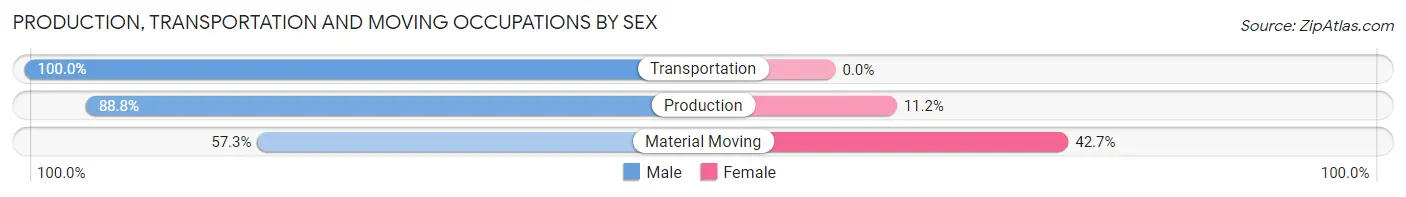
| Occupation | Male | Female |
| Production | 87 (88.8%) | 11 (11.2%) |
| Transportation | 56 (100.0%) | 0 (0.0%) |
| Material Moving | 51 (57.3%) | 38 (42.7%) |
| Total (Category) | 194 (79.8%) | 49 (20.2%) |
| Total (Overall) | 451 (48.2%) | 484 (51.8%) |
Employment Industries by Sex in Willow Springs
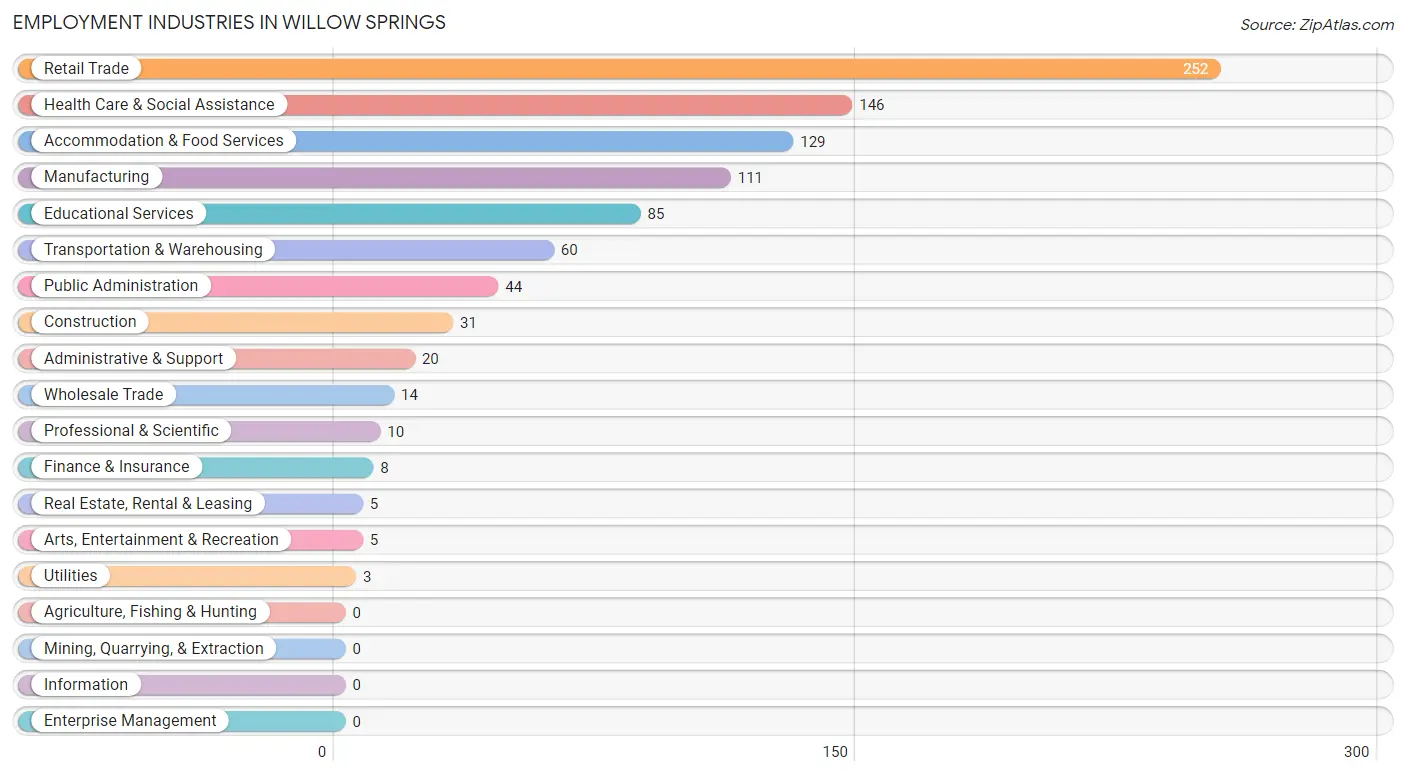
Employment Industries in Willow Springs
The major employment industries in Willow Springs include Retail Trade (252 | 27.0%), Health Care & Social Assistance (146 | 15.6%), Accommodation & Food Services (129 | 13.8%), Manufacturing (111 | 11.9%), and Educational Services (85 | 9.1%).
Employment Industries by Sex in Willow Springs
The Willow Springs industries that see more men than women are Construction (100.0%), Wholesale Trade (100.0%), and Transportation & Warehousing (100.0%), whereas the industries that tend to have a higher number of women are Finance & Insurance (100.0%), Educational Services (100.0%), and Health Care & Social Assistance (79.4%).
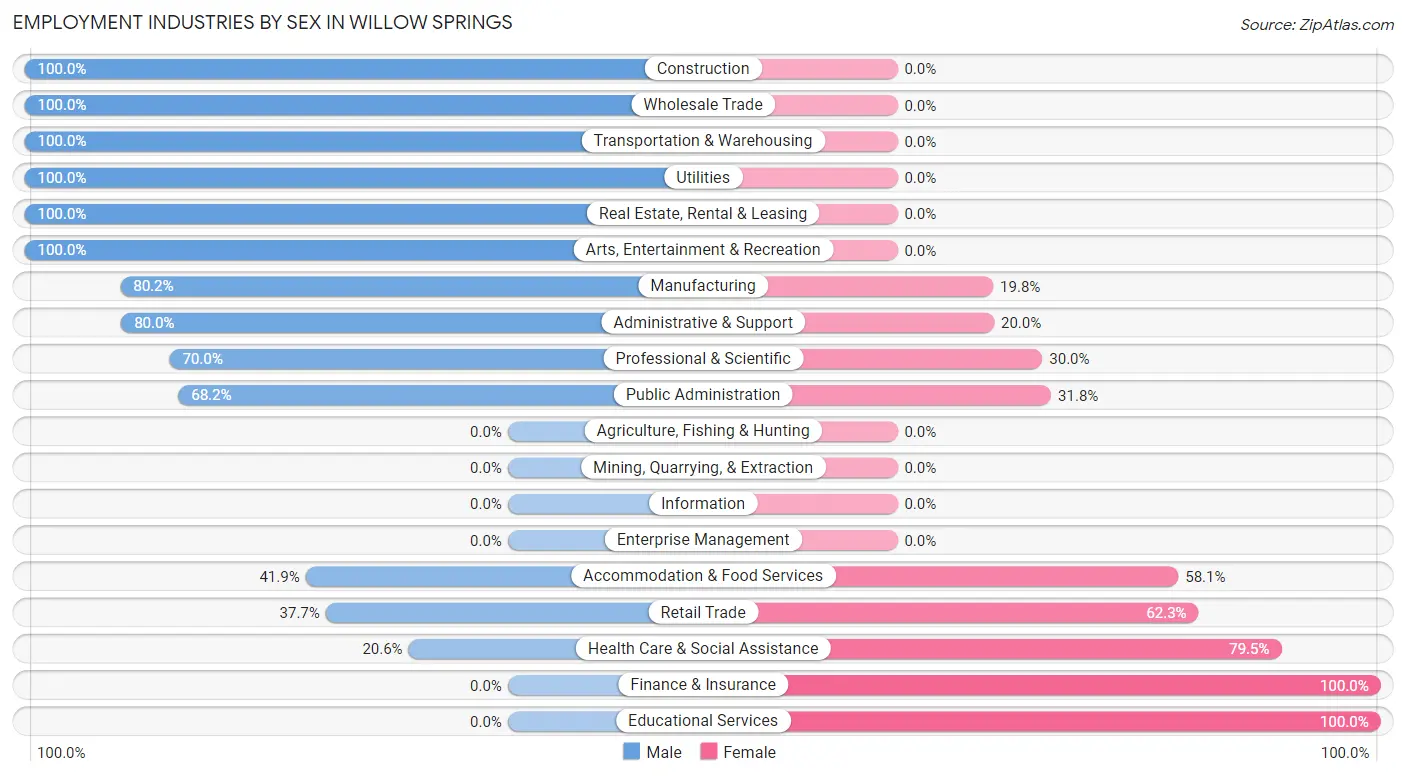
| Industry | Male | Female |
| Agriculture, Fishing & Hunting | 0 (0.0%) | 0 (0.0%) |
| Mining, Quarrying, & Extraction | 0 (0.0%) | 0 (0.0%) |
| Construction | 31 (100.0%) | 0 (0.0%) |
| Manufacturing | 89 (80.2%) | 22 (19.8%) |
| Wholesale Trade | 14 (100.0%) | 0 (0.0%) |
| Retail Trade | 95 (37.7%) | 157 (62.3%) |
| Transportation & Warehousing | 60 (100.0%) | 0 (0.0%) |
| Utilities | 3 (100.0%) | 0 (0.0%) |
| Information | 0 (0.0%) | 0 (0.0%) |
| Finance & Insurance | 0 (0.0%) | 8 (100.0%) |
| Real Estate, Rental & Leasing | 5 (100.0%) | 0 (0.0%) |
| Professional & Scientific | 7 (70.0%) | 3 (30.0%) |
| Enterprise Management | 0 (0.0%) | 0 (0.0%) |
| Administrative & Support | 16 (80.0%) | 4 (20.0%) |
| Educational Services | 0 (0.0%) | 85 (100.0%) |
| Health Care & Social Assistance | 30 (20.5%) | 116 (79.4%) |
| Arts, Entertainment & Recreation | 5 (100.0%) | 0 (0.0%) |
| Accommodation & Food Services | 54 (41.9%) | 75 (58.1%) |
| Public Administration | 30 (68.2%) | 14 (31.8%) |
| Total | 451 (48.2%) | 484 (51.8%) |
Education in Willow Springs
School Enrollment in Willow Springs
The most common levels of schooling among the 440 students in Willow Springs are high school (169 | 38.4%), college / undergraduate (100 | 22.7%), and elementary school (86 | 19.6%).
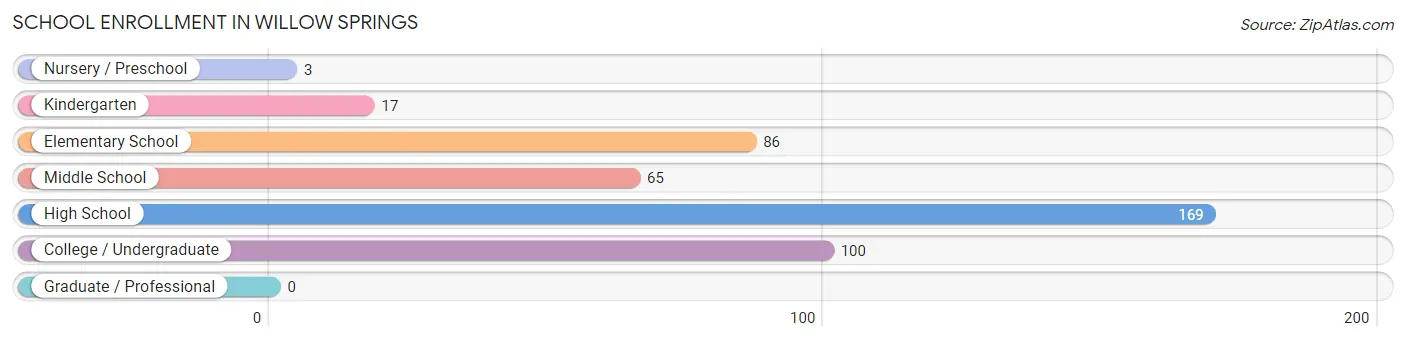
| School Level | # Students | % Students |
| Nursery / Preschool | 3 | 0.7% |
| Kindergarten | 17 | 3.9% |
| Elementary School | 86 | 19.6% |
| Middle School | 65 | 14.8% |
| High School | 169 | 38.4% |
| College / Undergraduate | 100 | 22.7% |
| Graduate / Professional | 0 | 0.0% |
| Total | 440 | 100.0% |
School Enrollment by Age by Funding Source in Willow Springs
Out of a total of 440 students who are enrolled in schools in Willow Springs, 66 (15.0%) attend a private institution, while the remaining 374 (85.0%) are enrolled in public schools. The age group of 3 to 4 year olds has the highest likelihood of being enrolled in private schools, with 3 (100.0% in the age bracket) enrolled. Conversely, the age group of 5 to 9 year old has the lowest likelihood of being enrolled in a private school, with 95 (100.0% in the age bracket) attending a public institution.
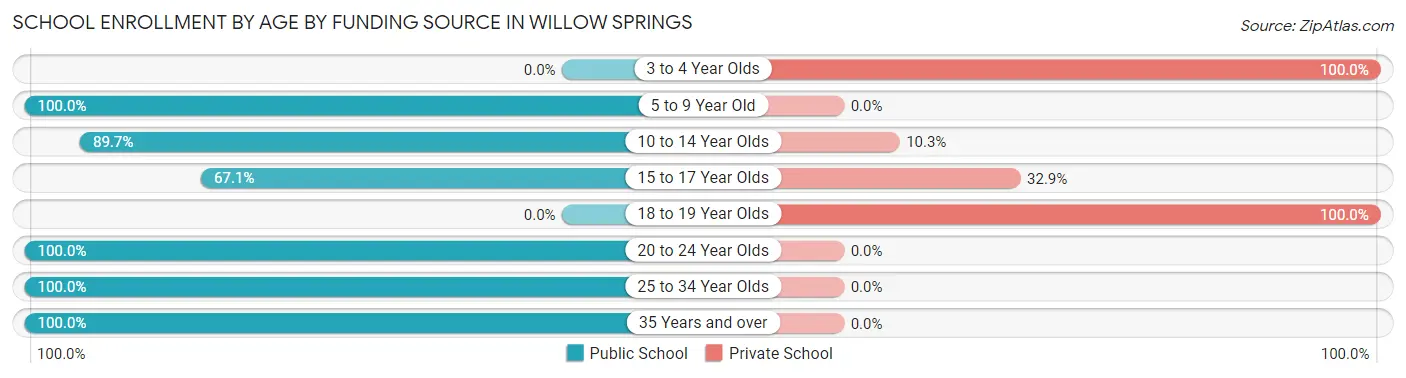
| Age Bracket | Public School | Private School |
| 3 to 4 Year Olds | 0 (0.0%) | 3 (100.0%) |
| 5 to 9 Year Old | 95 (100.0%) | 0 (0.0%) |
| 10 to 14 Year Olds | 78 (89.7%) | 9 (10.3%) |
| 15 to 17 Year Olds | 94 (67.1%) | 46 (32.9%) |
| 18 to 19 Year Olds | 0 (0.0%) | 8 (100.0%) |
| 20 to 24 Year Olds | 37 (100.0%) | 0 (0.0%) |
| 25 to 34 Year Olds | 21 (100.0%) | 0 (0.0%) |
| 35 Years and over | 49 (100.0%) | 0 (0.0%) |
| Total | 374 (85.0%) | 66 (15.0%) |
Educational Attainment by Field of Study in Willow Springs
Education (45 | 23.9%), science & technology (44 | 23.4%), business (38 | 20.2%), liberal arts & history (17 | 9.0%), and engineering (16 | 8.5%) are the most common fields of study among 188 individuals in Willow Springs who have obtained a bachelor's degree or higher.
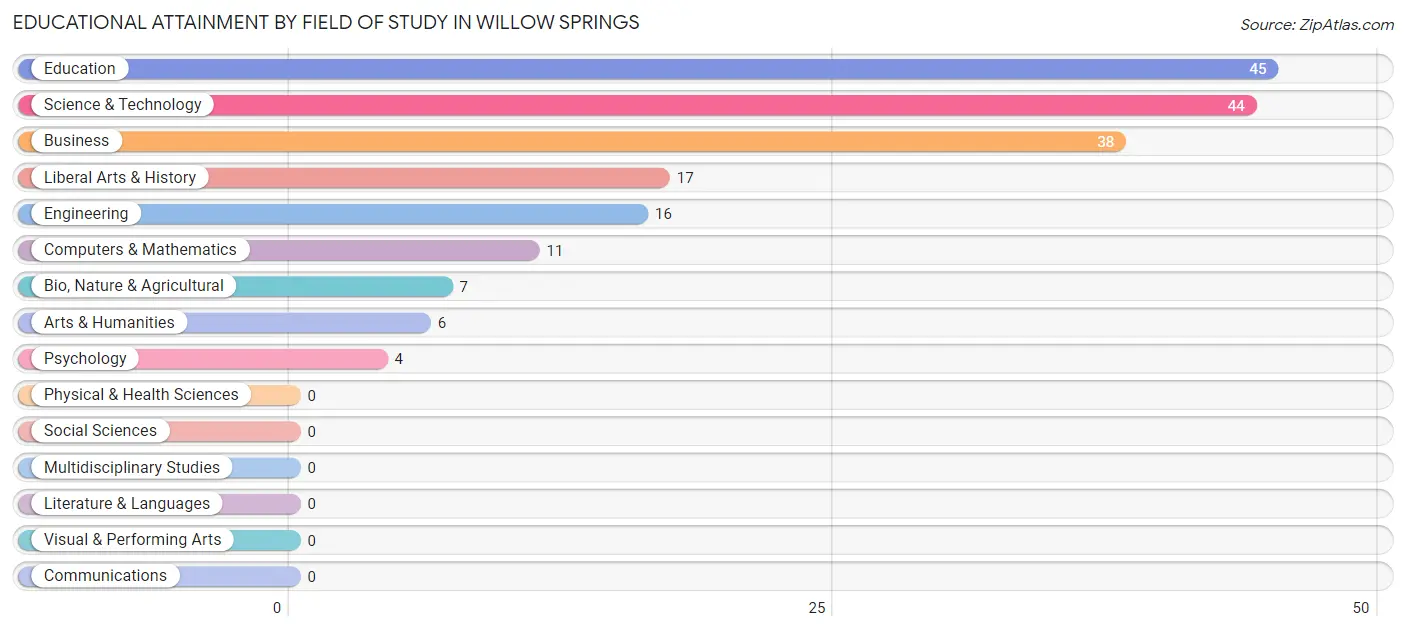
| Field of Study | # Graduates | % Graduates |
| Computers & Mathematics | 11 | 5.9% |
| Bio, Nature & Agricultural | 7 | 3.7% |
| Physical & Health Sciences | 0 | 0.0% |
| Psychology | 4 | 2.1% |
| Social Sciences | 0 | 0.0% |
| Engineering | 16 | 8.5% |
| Multidisciplinary Studies | 0 | 0.0% |
| Science & Technology | 44 | 23.4% |
| Business | 38 | 20.2% |
| Education | 45 | 23.9% |
| Literature & Languages | 0 | 0.0% |
| Liberal Arts & History | 17 | 9.0% |
| Visual & Performing Arts | 0 | 0.0% |
| Communications | 0 | 0.0% |
| Arts & Humanities | 6 | 3.2% |
| Total | 188 | 100.0% |
Transportation & Commute in Willow Springs
Vehicle Availability by Sex in Willow Springs
The most prevalent vehicle ownership categories in Willow Springs are males with 2 vehicles (147, accounting for 32.6%) and females with 2 vehicles (123, making up 30.9%).
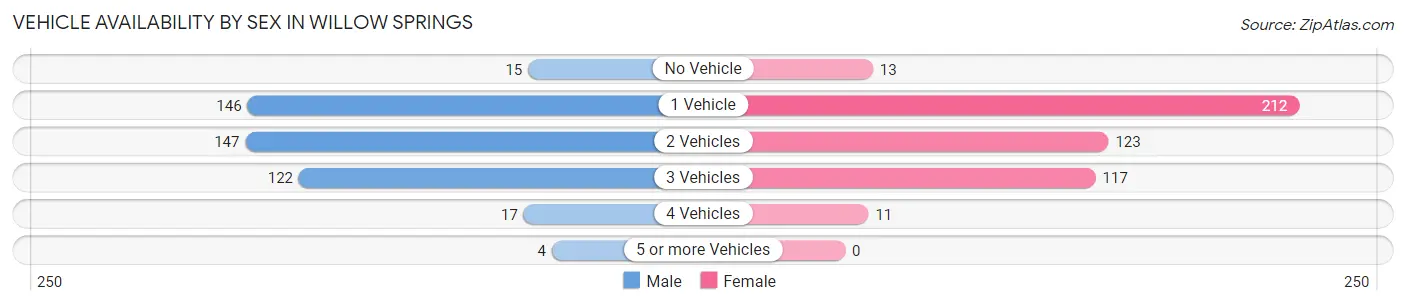
| Vehicles Available | Male | Female |
| No Vehicle | 15 (3.3%) | 13 (2.7%) |
| 1 Vehicle | 146 (32.4%) | 212 (44.5%) |
| 2 Vehicles | 147 (32.6%) | 123 (25.8%) |
| 3 Vehicles | 122 (27.1%) | 117 (24.6%) |
| 4 Vehicles | 17 (3.8%) | 11 (2.3%) |
| 5 or more Vehicles | 4 (0.9%) | 0 (0.0%) |
| Total | 451 (100.0%) | 476 (100.0%) |
Commute Time in Willow Springs
The most frequently occuring commute durations in Willow Springs are 5 to 9 minutes (255 commuters, 27.5%), 10 to 14 minutes (152 commuters, 16.4%), and less than 5 minutes (136 commuters, 14.7%).
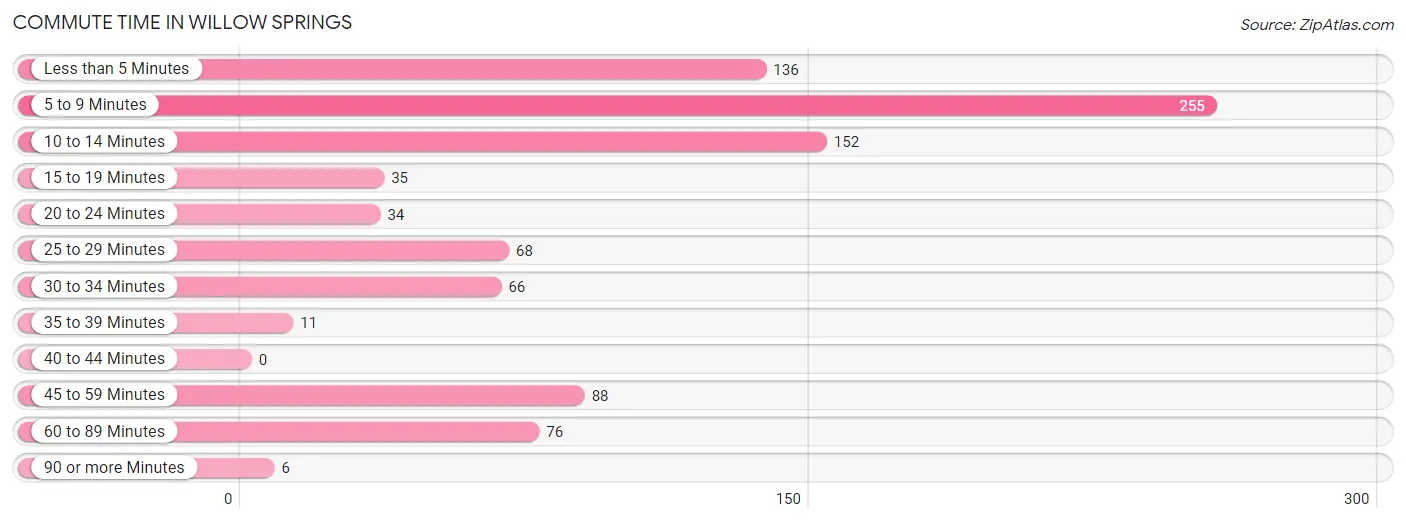
| Commute Time | # Commuters | % Commuters |
| Less than 5 Minutes | 136 | 14.7% |
| 5 to 9 Minutes | 255 | 27.5% |
| 10 to 14 Minutes | 152 | 16.4% |
| 15 to 19 Minutes | 35 | 3.8% |
| 20 to 24 Minutes | 34 | 3.7% |
| 25 to 29 Minutes | 68 | 7.3% |
| 30 to 34 Minutes | 66 | 7.1% |
| 35 to 39 Minutes | 11 | 1.2% |
| 40 to 44 Minutes | 0 | 0.0% |
| 45 to 59 Minutes | 88 | 9.5% |
| 60 to 89 Minutes | 76 | 8.2% |
| 90 or more Minutes | 6 | 0.6% |
Commute Time by Sex in Willow Springs
The most common commute times in Willow Springs are 5 to 9 minutes (108 commuters, 23.9%) for males and 5 to 9 minutes (147 commuters, 30.9%) for females.
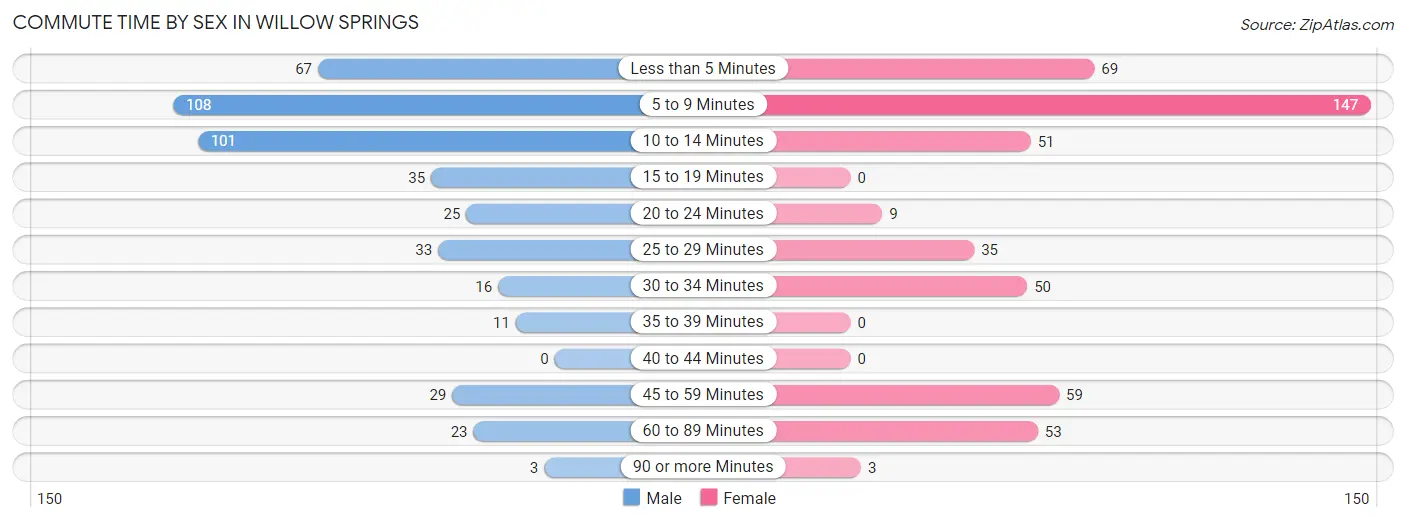
| Commute Time | Male | Female |
| Less than 5 Minutes | 67 (14.9%) | 69 (14.5%) |
| 5 to 9 Minutes | 108 (23.9%) | 147 (30.9%) |
| 10 to 14 Minutes | 101 (22.4%) | 51 (10.7%) |
| 15 to 19 Minutes | 35 (7.8%) | 0 (0.0%) |
| 20 to 24 Minutes | 25 (5.5%) | 9 (1.9%) |
| 25 to 29 Minutes | 33 (7.3%) | 35 (7.3%) |
| 30 to 34 Minutes | 16 (3.5%) | 50 (10.5%) |
| 35 to 39 Minutes | 11 (2.4%) | 0 (0.0%) |
| 40 to 44 Minutes | 0 (0.0%) | 0 (0.0%) |
| 45 to 59 Minutes | 29 (6.4%) | 59 (12.4%) |
| 60 to 89 Minutes | 23 (5.1%) | 53 (11.1%) |
| 90 or more Minutes | 3 (0.7%) | 3 (0.6%) |
Time of Departure to Work by Sex in Willow Springs
The most frequent times of departure to work in Willow Springs are 6:30 AM to 6:59 AM (76, 16.9%) for males and 7:00 AM to 7:29 AM (104, 21.8%) for females.
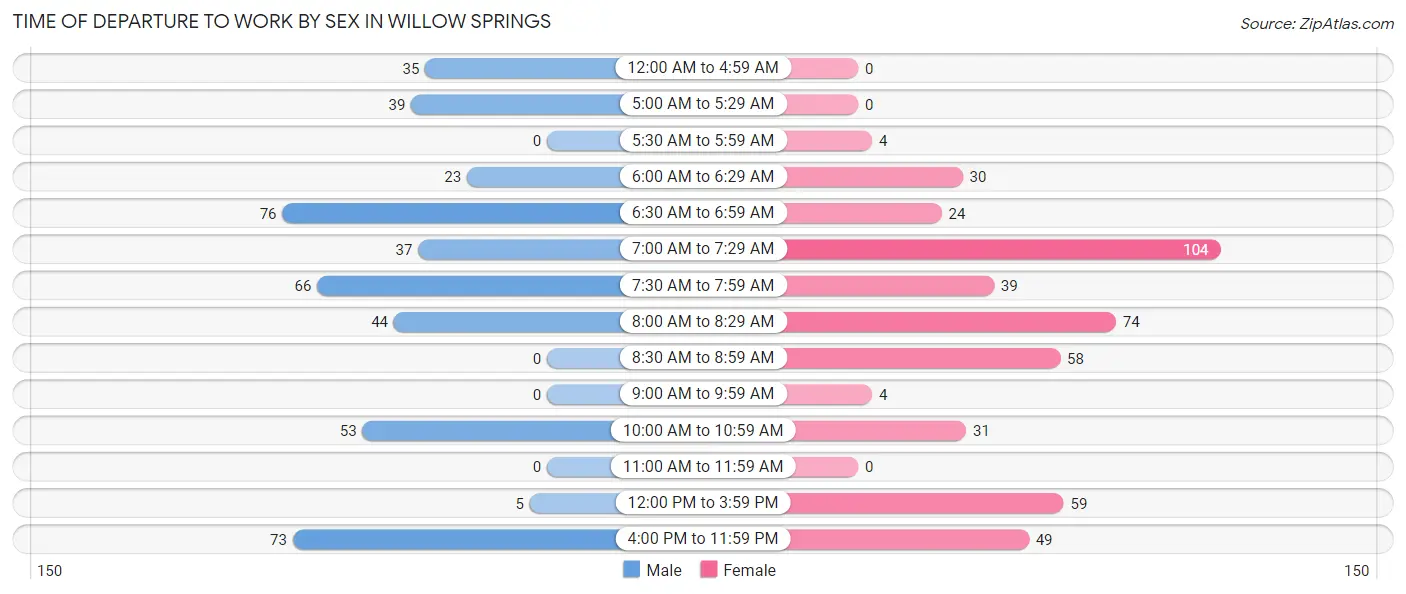
| Time of Departure | Male | Female |
| 12:00 AM to 4:59 AM | 35 (7.8%) | 0 (0.0%) |
| 5:00 AM to 5:29 AM | 39 (8.6%) | 0 (0.0%) |
| 5:30 AM to 5:59 AM | 0 (0.0%) | 4 (0.8%) |
| 6:00 AM to 6:29 AM | 23 (5.1%) | 30 (6.3%) |
| 6:30 AM to 6:59 AM | 76 (16.9%) | 24 (5.0%) |
| 7:00 AM to 7:29 AM | 37 (8.2%) | 104 (21.8%) |
| 7:30 AM to 7:59 AM | 66 (14.6%) | 39 (8.2%) |
| 8:00 AM to 8:29 AM | 44 (9.8%) | 74 (15.5%) |
| 8:30 AM to 8:59 AM | 0 (0.0%) | 58 (12.2%) |
| 9:00 AM to 9:59 AM | 0 (0.0%) | 4 (0.8%) |
| 10:00 AM to 10:59 AM | 53 (11.7%) | 31 (6.5%) |
| 11:00 AM to 11:59 AM | 0 (0.0%) | 0 (0.0%) |
| 12:00 PM to 3:59 PM | 5 (1.1%) | 59 (12.4%) |
| 4:00 PM to 11:59 PM | 73 (16.2%) | 49 (10.3%) |
| Total | 451 (100.0%) | 476 (100.0%) |
Housing Occupancy in Willow Springs
Occupancy by Ownership in Willow Springs
Of the total 846 dwellings in Willow Springs, owner-occupied units account for 453 (53.5%), while renter-occupied units make up 393 (46.5%).
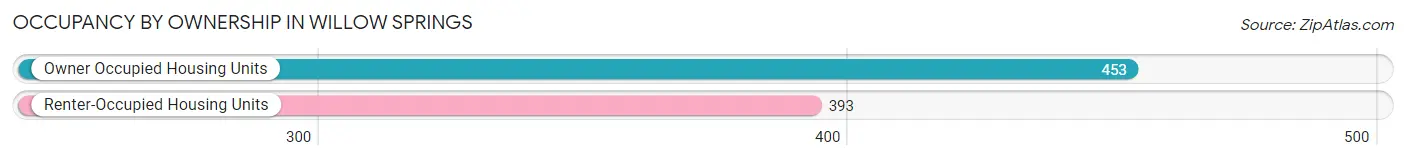
| Occupancy | # Housing Units | % Housing Units |
| Owner Occupied Housing Units | 453 | 53.5% |
| Renter-Occupied Housing Units | 393 | 46.5% |
| Total Occupied Housing Units | 846 | 100.0% |
Occupancy by Household Size in Willow Springs
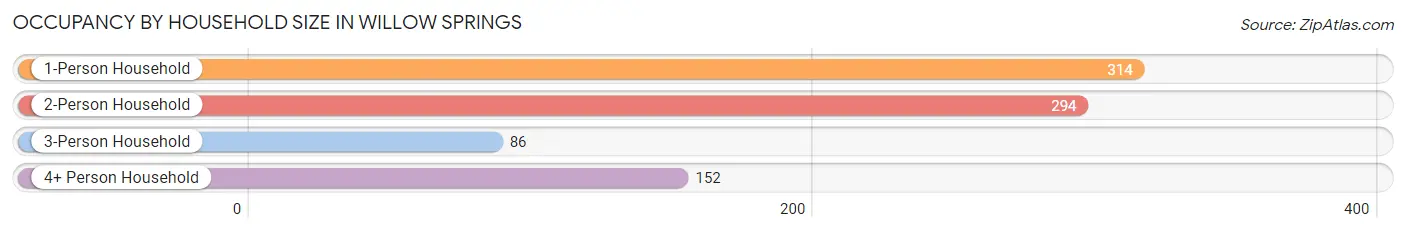
| Household Size | # Housing Units | % Housing Units |
| 1-Person Household | 314 | 37.1% |
| 2-Person Household | 294 | 34.7% |
| 3-Person Household | 86 | 10.2% |
| 4+ Person Household | 152 | 18.0% |
| Total Housing Units | 846 | 100.0% |
Occupancy by Ownership by Household Size in Willow Springs
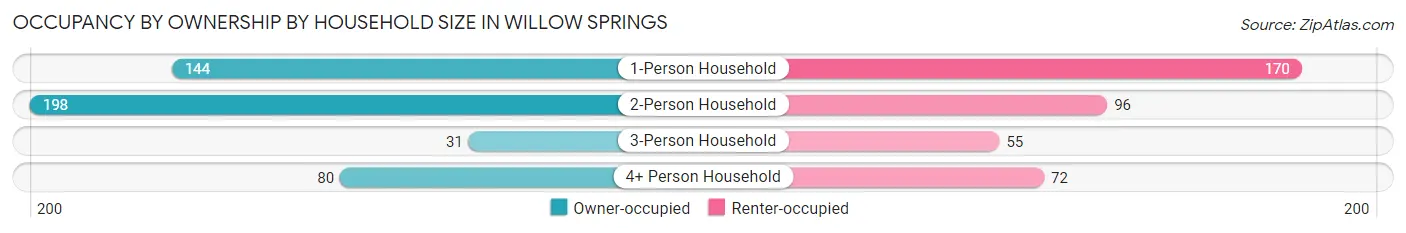
| Household Size | Owner-occupied | Renter-occupied |
| 1-Person Household | 144 (45.9%) | 170 (54.1%) |
| 2-Person Household | 198 (67.3%) | 96 (32.7%) |
| 3-Person Household | 31 (36.0%) | 55 (63.9%) |
| 4+ Person Household | 80 (52.6%) | 72 (47.4%) |
| Total Housing Units | 453 (53.5%) | 393 (46.5%) |
Occupancy by Educational Attainment in Willow Springs
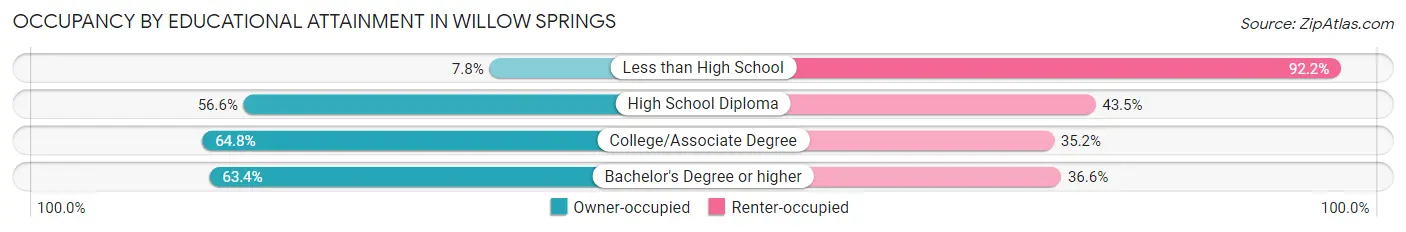
| Household Size | Owner-occupied | Renter-occupied |
| Less than High School | 9 (7.8%) | 106 (92.2%) |
| High School Diploma | 190 (56.6%) | 146 (43.4%) |
| College/Associate Degree | 171 (64.8%) | 93 (35.2%) |
| Bachelor's Degree or higher | 83 (63.4%) | 48 (36.6%) |
Occupancy by Age of Householder in Willow Springs
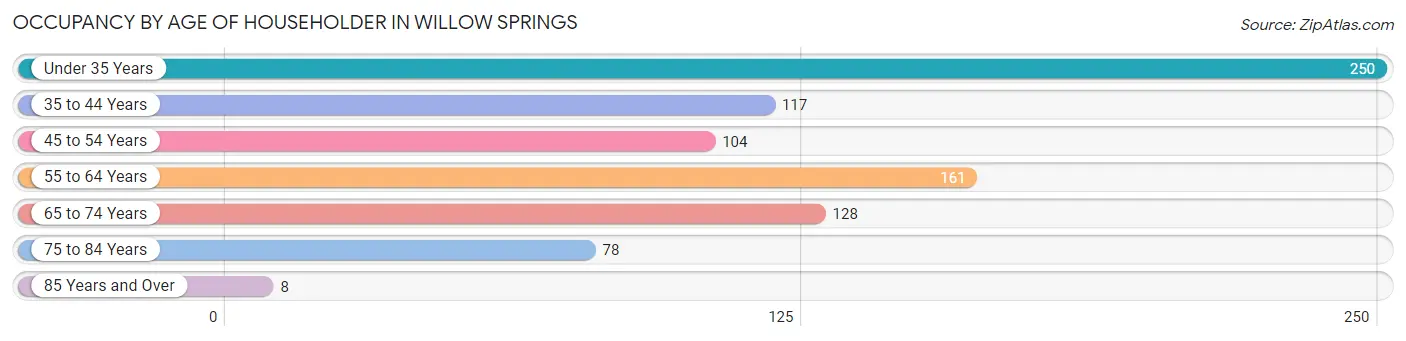
| Age Bracket | # Households | % Households |
| Under 35 Years | 250 | 29.5% |
| 35 to 44 Years | 117 | 13.8% |
| 45 to 54 Years | 104 | 12.3% |
| 55 to 64 Years | 161 | 19.0% |
| 65 to 74 Years | 128 | 15.1% |
| 75 to 84 Years | 78 | 9.2% |
| 85 Years and Over | 8 | 0.9% |
| Total | 846 | 100.0% |
Housing Finances in Willow Springs
Median Income by Occupancy in Willow Springs
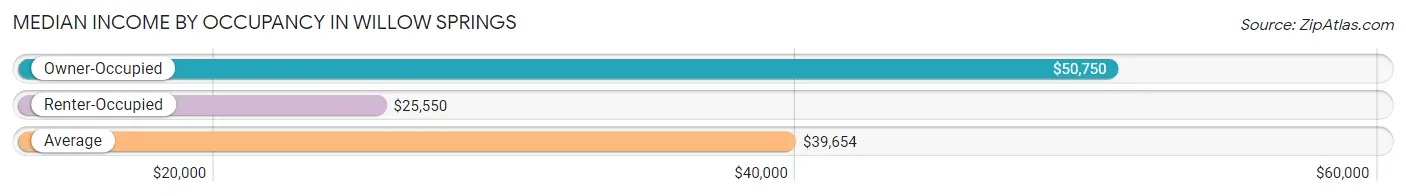
| Occupancy Type | # Households | Median Income |
| Owner-Occupied | 453 (53.5%) | $50,750 |
| Renter-Occupied | 393 (46.5%) | $25,550 |
| Average | 846 (100.0%) | $39,654 |
Occupancy by Householder Income Bracket in Willow Springs
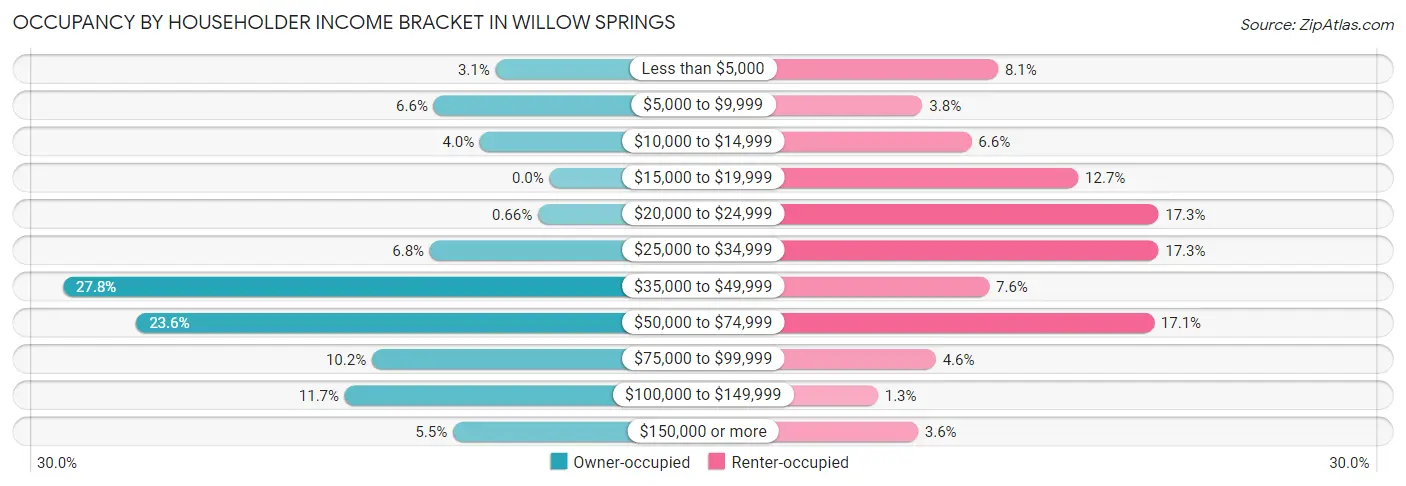
| Income Bracket | Owner-occupied | Renter-occupied |
| Less than $5,000 | 14 (3.1%) | 32 (8.1%) |
| $5,000 to $9,999 | 30 (6.6%) | 15 (3.8%) |
| $10,000 to $14,999 | 18 (4.0%) | 26 (6.6%) |
| $15,000 to $19,999 | 0 (0.0%) | 50 (12.7%) |
| $20,000 to $24,999 | 3 (0.7%) | 68 (17.3%) |
| $25,000 to $34,999 | 31 (6.8%) | 68 (17.3%) |
| $35,000 to $49,999 | 126 (27.8%) | 30 (7.6%) |
| $50,000 to $74,999 | 107 (23.6%) | 67 (17.1%) |
| $75,000 to $99,999 | 46 (10.2%) | 18 (4.6%) |
| $100,000 to $149,999 | 53 (11.7%) | 5 (1.3%) |
| $150,000 or more | 25 (5.5%) | 14 (3.6%) |
| Total | 453 (100.0%) | 393 (100.0%) |
Monthly Housing Cost Tiers in Willow Springs
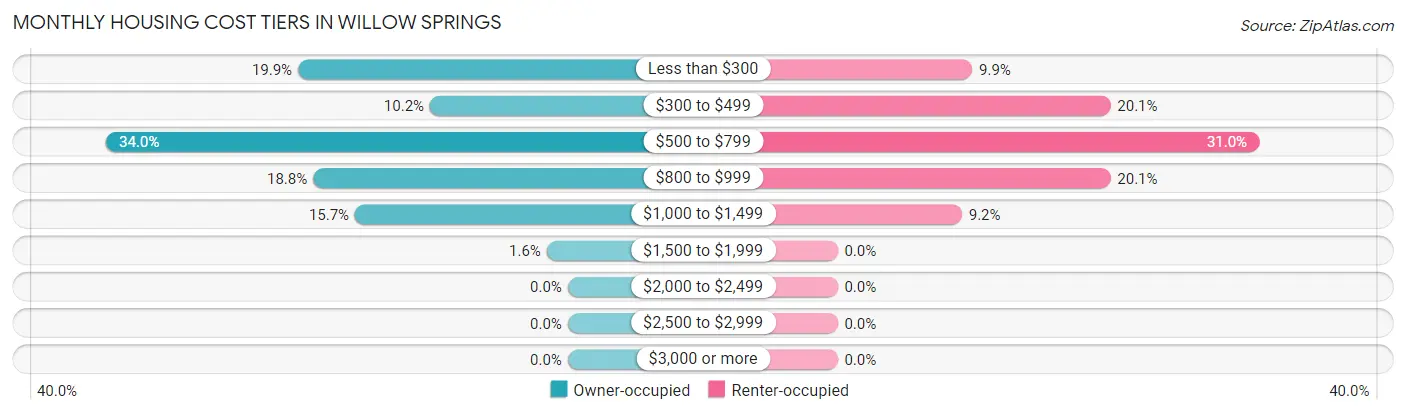
| Monthly Cost | Owner-occupied | Renter-occupied |
| Less than $300 | 90 (19.9%) | 39 (9.9%) |
| $300 to $499 | 46 (10.2%) | 79 (20.1%) |
| $500 to $799 | 154 (34.0%) | 122 (31.0%) |
| $800 to $999 | 85 (18.8%) | 79 (20.1%) |
| $1,000 to $1,499 | 71 (15.7%) | 36 (9.2%) |
| $1,500 to $1,999 | 7 (1.5%) | 0 (0.0%) |
| $2,000 to $2,499 | 0 (0.0%) | 0 (0.0%) |
| $2,500 to $2,999 | 0 (0.0%) | 0 (0.0%) |
| $3,000 or more | 0 (0.0%) | 0 (0.0%) |
| Total | 453 (100.0%) | 393 (100.0%) |
Physical Housing Characteristics in Willow Springs
Housing Structures in Willow Springs
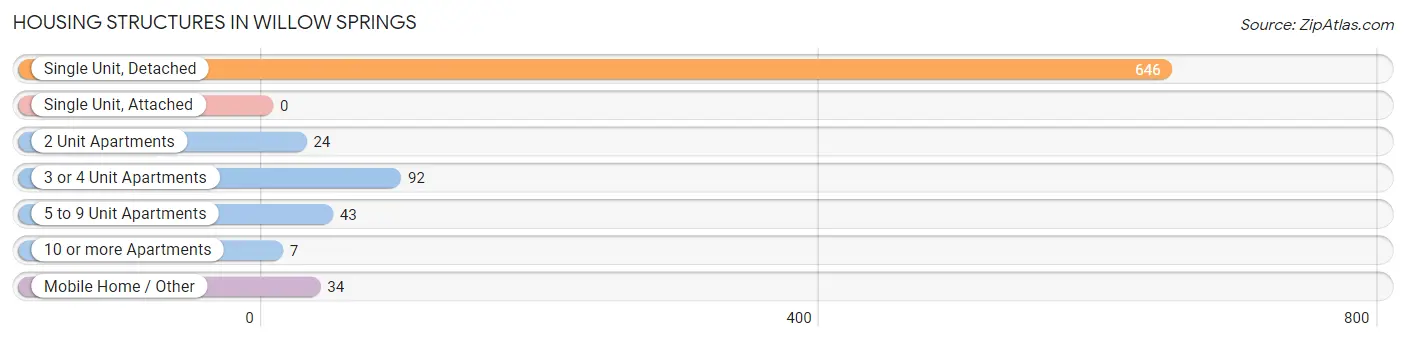
| Structure Type | # Housing Units | % Housing Units |
| Single Unit, Detached | 646 | 76.4% |
| Single Unit, Attached | 0 | 0.0% |
| 2 Unit Apartments | 24 | 2.8% |
| 3 or 4 Unit Apartments | 92 | 10.9% |
| 5 to 9 Unit Apartments | 43 | 5.1% |
| 10 or more Apartments | 7 | 0.8% |
| Mobile Home / Other | 34 | 4.0% |
| Total | 846 | 100.0% |
Housing Structures by Occupancy in Willow Springs
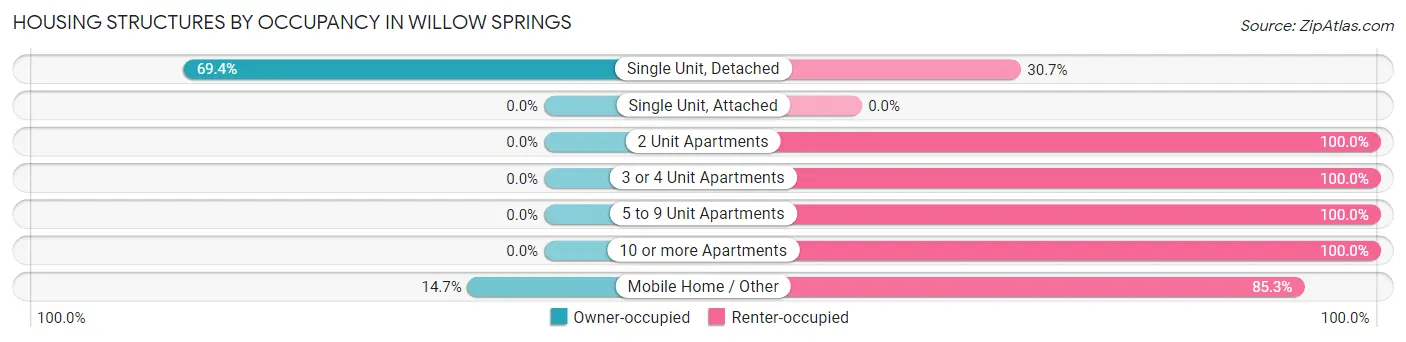
| Structure Type | Owner-occupied | Renter-occupied |
| Single Unit, Detached | 448 (69.4%) | 198 (30.6%) |
| Single Unit, Attached | 0 (0.0%) | 0 (0.0%) |
| 2 Unit Apartments | 0 (0.0%) | 24 (100.0%) |
| 3 or 4 Unit Apartments | 0 (0.0%) | 92 (100.0%) |
| 5 to 9 Unit Apartments | 0 (0.0%) | 43 (100.0%) |
| 10 or more Apartments | 0 (0.0%) | 7 (100.0%) |
| Mobile Home / Other | 5 (14.7%) | 29 (85.3%) |
| Total | 453 (53.5%) | 393 (46.5%) |
Housing Structures by Number of Rooms in Willow Springs
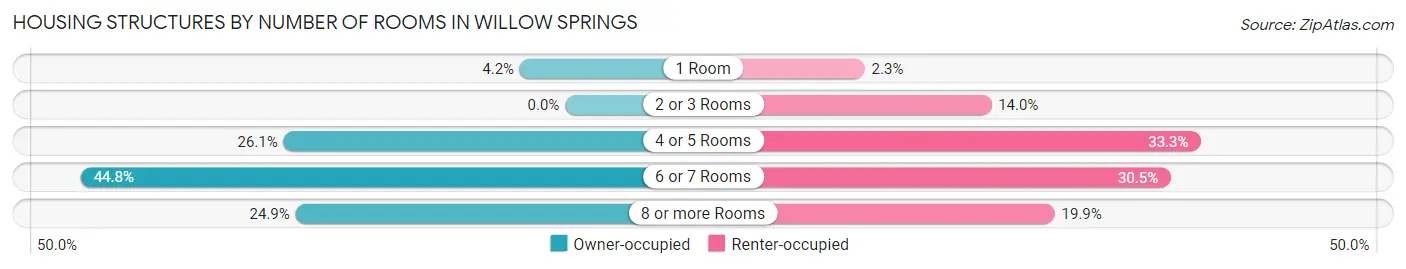
| Number of Rooms | Owner-occupied | Renter-occupied |
| 1 Room | 19 (4.2%) | 9 (2.3%) |
| 2 or 3 Rooms | 0 (0.0%) | 55 (14.0%) |
| 4 or 5 Rooms | 118 (26.1%) | 131 (33.3%) |
| 6 or 7 Rooms | 203 (44.8%) | 120 (30.5%) |
| 8 or more Rooms | 113 (24.9%) | 78 (19.9%) |
| Total | 453 (100.0%) | 393 (100.0%) |
Housing Structure by Heating Type in Willow Springs
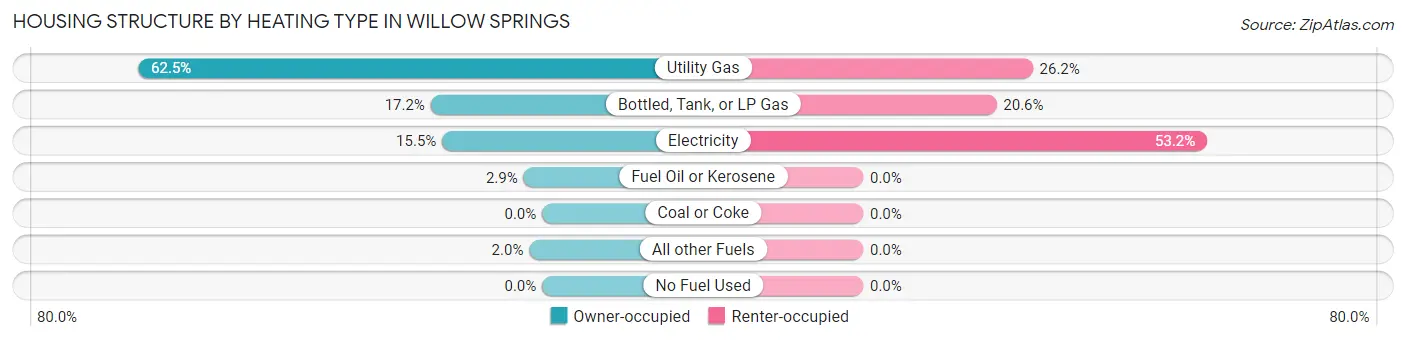
| Heating Type | Owner-occupied | Renter-occupied |
| Utility Gas | 283 (62.5%) | 103 (26.2%) |
| Bottled, Tank, or LP Gas | 78 (17.2%) | 81 (20.6%) |
| Electricity | 70 (15.4%) | 209 (53.2%) |
| Fuel Oil or Kerosene | 13 (2.9%) | 0 (0.0%) |
| Coal or Coke | 0 (0.0%) | 0 (0.0%) |
| All other Fuels | 9 (2.0%) | 0 (0.0%) |
| No Fuel Used | 0 (0.0%) | 0 (0.0%) |
| Total | 453 (100.0%) | 393 (100.0%) |
Household Vehicle Usage in Willow Springs
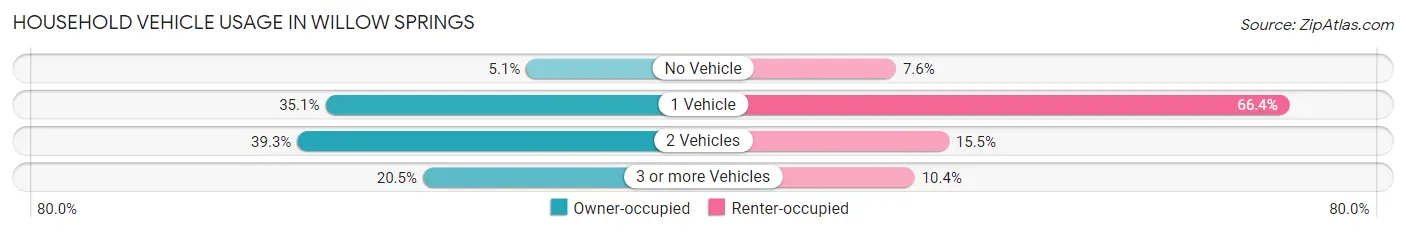
| Vehicles per Household | Owner-occupied | Renter-occupied |
| No Vehicle | 23 (5.1%) | 30 (7.6%) |
| 1 Vehicle | 159 (35.1%) | 261 (66.4%) |
| 2 Vehicles | 178 (39.3%) | 61 (15.5%) |
| 3 or more Vehicles | 93 (20.5%) | 41 (10.4%) |
| Total | 453 (100.0%) | 393 (100.0%) |
Real Estate & Mortgages in Willow Springs
Real Estate and Mortgage Overview in Willow Springs
| Characteristic | Without Mortgage | With Mortgage |
| Housing Units | 256 | 197 |
| Median Property Value | - | - |
| Median Household Income | $44,773 | $15 |
| Monthly Housing Costs | $503 | $0 |
| Real Estate Taxes | $554 | $0 |
Property Value by Mortgage Status in Willow Springs
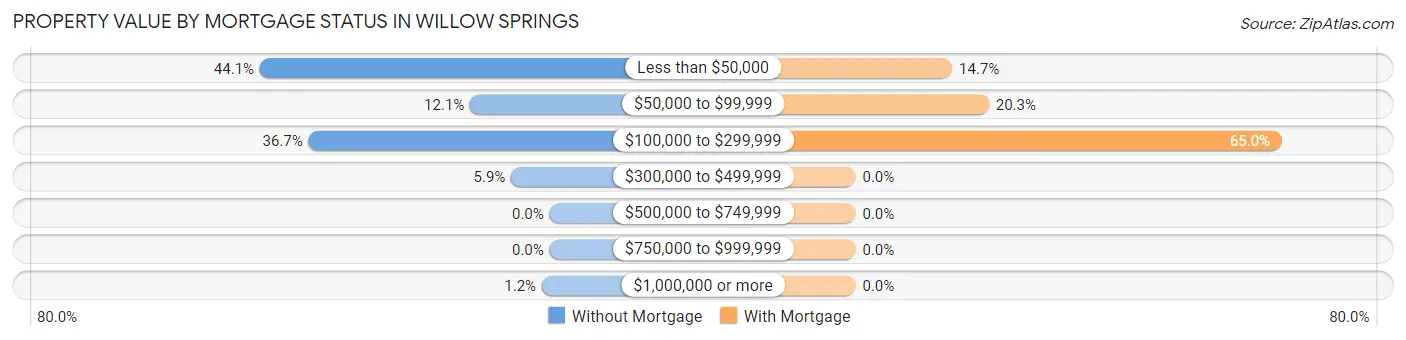
| Property Value | Without Mortgage | With Mortgage |
| Less than $50,000 | 113 (44.1%) | 29 (14.7%) |
| $50,000 to $99,999 | 31 (12.1%) | 40 (20.3%) |
| $100,000 to $299,999 | 94 (36.7%) | 128 (65.0%) |
| $300,000 to $499,999 | 15 (5.9%) | 0 (0.0%) |
| $500,000 to $749,999 | 0 (0.0%) | 0 (0.0%) |
| $750,000 to $999,999 | 0 (0.0%) | 0 (0.0%) |
| $1,000,000 or more | 3 (1.2%) | 0 (0.0%) |
| Total | 256 (100.0%) | 197 (100.0%) |
Household Income by Mortgage Status in Willow Springs
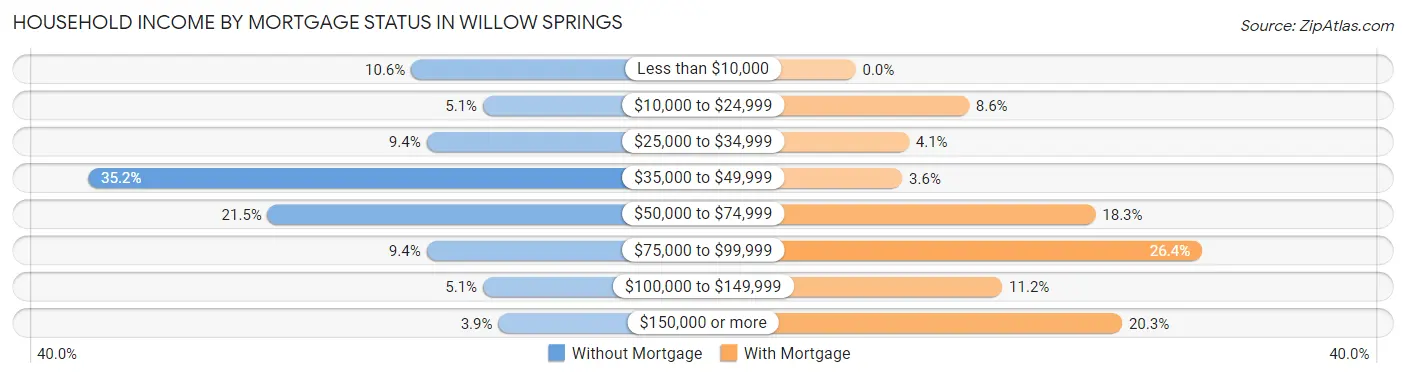
| Household Income | Without Mortgage | With Mortgage |
| Less than $10,000 | 27 (10.5%) | 0 (0.0%) |
| $10,000 to $24,999 | 13 (5.1%) | 17 (8.6%) |
| $25,000 to $34,999 | 24 (9.4%) | 8 (4.1%) |
| $35,000 to $49,999 | 90 (35.2%) | 7 (3.5%) |
| $50,000 to $74,999 | 55 (21.5%) | 36 (18.3%) |
| $75,000 to $99,999 | 24 (9.4%) | 52 (26.4%) |
| $100,000 to $149,999 | 13 (5.1%) | 22 (11.2%) |
| $150,000 or more | 10 (3.9%) | 40 (20.3%) |
| Total | 256 (100.0%) | 197 (100.0%) |
Property Value to Household Income Ratio in Willow Springs
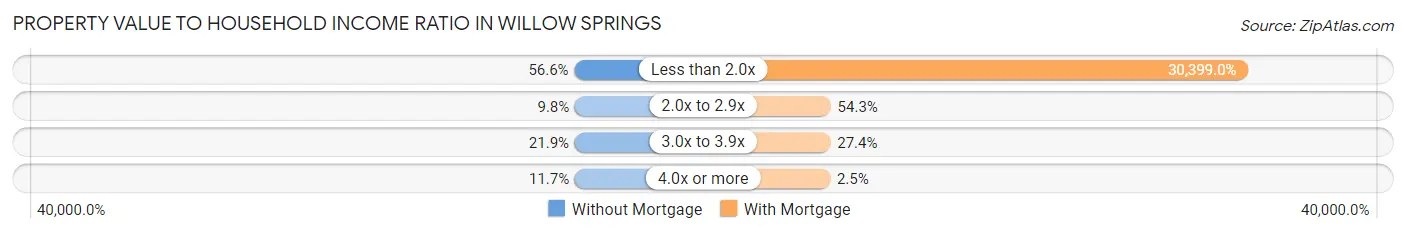
| Value-to-Income Ratio | Without Mortgage | With Mortgage |
| Less than 2.0x | 145 (56.6%) | 59,886 (30,399.0%) |
| 2.0x to 2.9x | 25 (9.8%) | 107 (54.3%) |
| 3.0x to 3.9x | 56 (21.9%) | 54 (27.4%) |
| 4.0x or more | 30 (11.7%) | 5 (2.5%) |
| Total | 256 (100.0%) | 197 (100.0%) |
Real Estate Taxes by Mortgage Status in Willow Springs
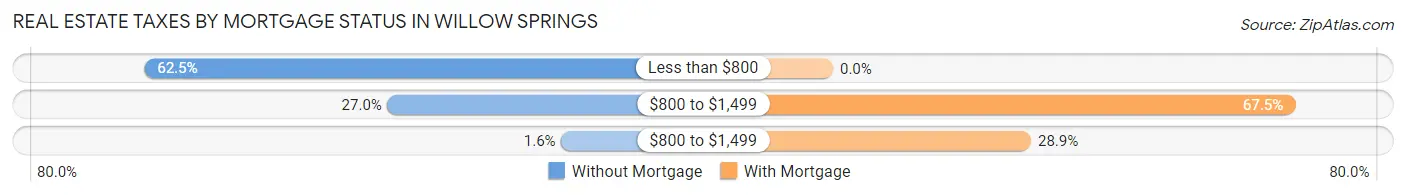
| Property Taxes | Without Mortgage | With Mortgage |
| Less than $800 | 160 (62.5%) | 0 (0.0%) |
| $800 to $1,499 | 69 (27.0%) | 133 (67.5%) |
| $800 to $1,499 | 4 (1.6%) | 57 (28.9%) |
| Total | 256 (100.0%) | 197 (100.0%) |
Health & Disability in Willow Springs
Health Insurance Coverage by Age in Willow Springs
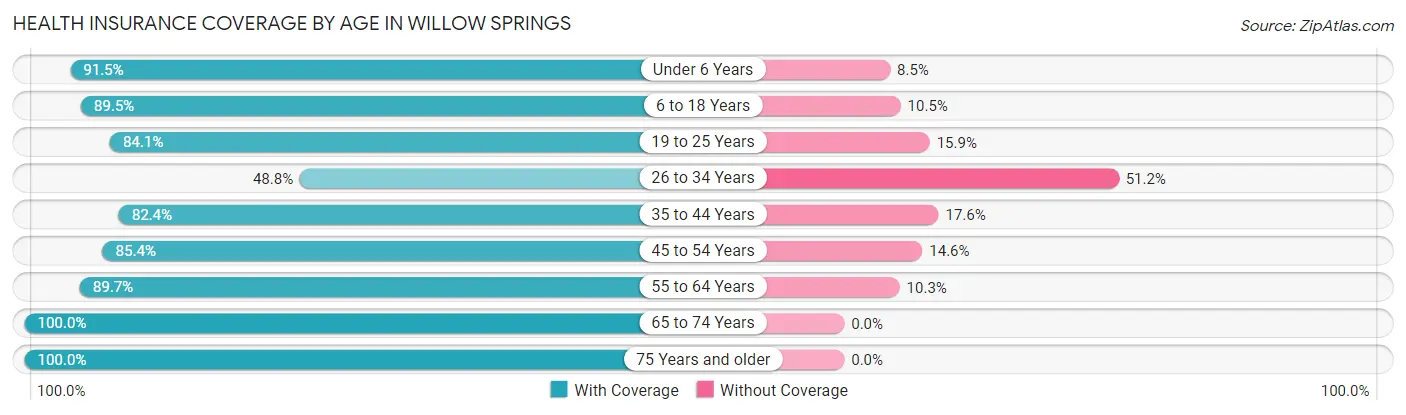
| Age Bracket | With Coverage | Without Coverage |
| Under 6 Years | 182 (91.5%) | 17 (8.5%) |
| 6 to 18 Years | 332 (89.5%) | 39 (10.5%) |
| 19 to 25 Years | 190 (84.1%) | 36 (15.9%) |
| 26 to 34 Years | 146 (48.8%) | 153 (51.2%) |
| 35 to 44 Years | 197 (82.4%) | 42 (17.6%) |
| 45 to 54 Years | 135 (85.4%) | 23 (14.6%) |
| 55 to 64 Years | 252 (89.7%) | 29 (10.3%) |
| 65 to 74 Years | 216 (100.0%) | 0 (0.0%) |
| 75 Years and older | 121 (100.0%) | 0 (0.0%) |
| Total | 1,771 (83.9%) | 339 (16.1%) |
Health Insurance Coverage by Citizenship Status in Willow Springs

| Citizenship Status | With Coverage | Without Coverage |
| Native Born | 182 (91.5%) | 17 (8.5%) |
| Foreign Born, Citizen | 332 (89.5%) | 39 (10.5%) |
| Foreign Born, not a Citizen | 190 (84.1%) | 36 (15.9%) |
Health Insurance Coverage by Household Income in Willow Springs
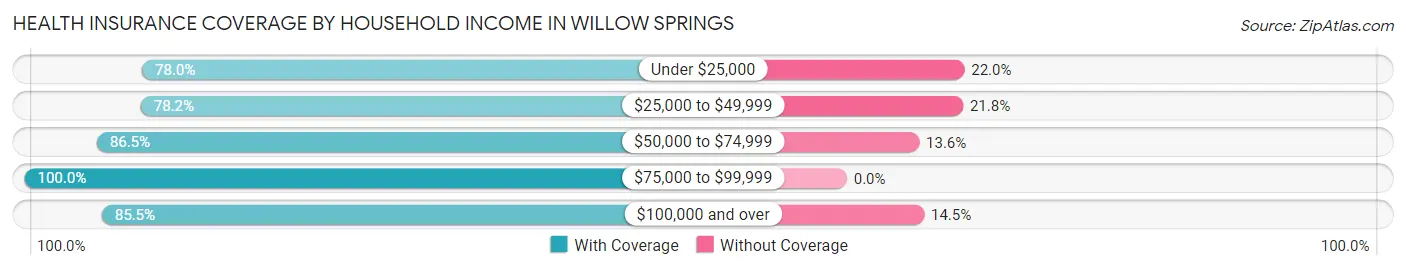
| Household Income | With Coverage | Without Coverage |
| Under $25,000 | 347 (78.0%) | 98 (22.0%) |
| $25,000 to $49,999 | 381 (78.2%) | 106 (21.8%) |
| $50,000 to $74,999 | 504 (86.5%) | 79 (13.6%) |
| $75,000 to $99,999 | 208 (100.0%) | 0 (0.0%) |
| $100,000 and over | 331 (85.5%) | 56 (14.5%) |
Public vs Private Health Insurance Coverage by Age in Willow Springs
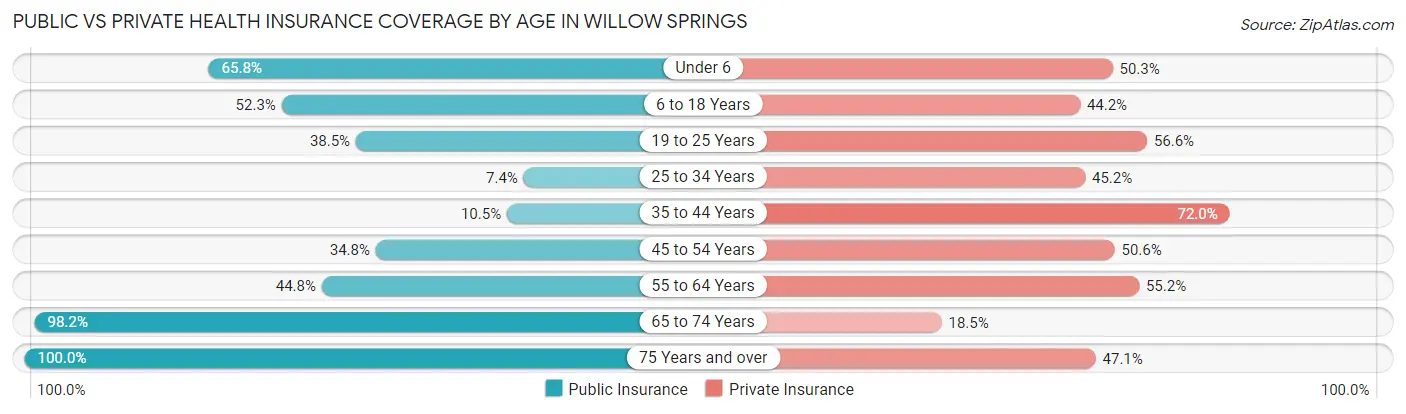
| Age Bracket | Public Insurance | Private Insurance |
| Under 6 | 131 (65.8%) | 100 (50.2%) |
| 6 to 18 Years | 194 (52.3%) | 164 (44.2%) |
| 19 to 25 Years | 87 (38.5%) | 128 (56.6%) |
| 25 to 34 Years | 22 (7.4%) | 135 (45.2%) |
| 35 to 44 Years | 25 (10.5%) | 172 (72.0%) |
| 45 to 54 Years | 55 (34.8%) | 80 (50.6%) |
| 55 to 64 Years | 126 (44.8%) | 155 (55.2%) |
| 65 to 74 Years | 212 (98.2%) | 40 (18.5%) |
| 75 Years and over | 121 (100.0%) | 57 (47.1%) |
| Total | 973 (46.1%) | 1,031 (48.9%) |
Disability Status by Sex by Age in Willow Springs
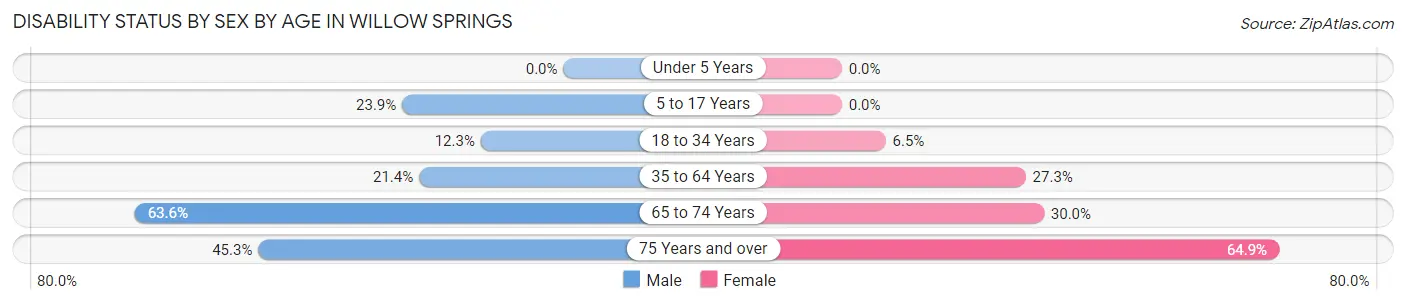
| Age Bracket | Male | Female |
| Under 5 Years | 0 (0.0%) | 0 (0.0%) |
| 5 to 17 Years | 51 (23.9%) | 0 (0.0%) |
| 18 to 34 Years | 40 (12.3%) | 16 (6.5%) |
| 35 to 64 Years | 66 (21.4%) | 101 (27.3%) |
| 65 to 74 Years | 42 (63.6%) | 45 (30.0%) |
| 75 Years and over | 29 (45.3%) | 37 (64.9%) |
Disability Class by Sex by Age in Willow Springs
Disability Class: Hearing Difficulty
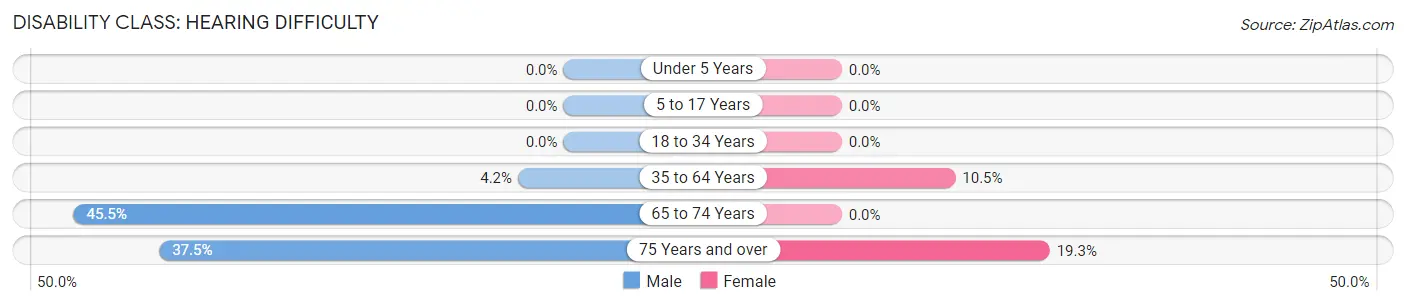
| Age Bracket | Male | Female |
| Under 5 Years | 0 (0.0%) | 0 (0.0%) |
| 5 to 17 Years | 0 (0.0%) | 0 (0.0%) |
| 18 to 34 Years | 0 (0.0%) | 0 (0.0%) |
| 35 to 64 Years | 13 (4.2%) | 39 (10.5%) |
| 65 to 74 Years | 30 (45.5%) | 0 (0.0%) |
| 75 Years and over | 24 (37.5%) | 11 (19.3%) |
Disability Class: Vision Difficulty
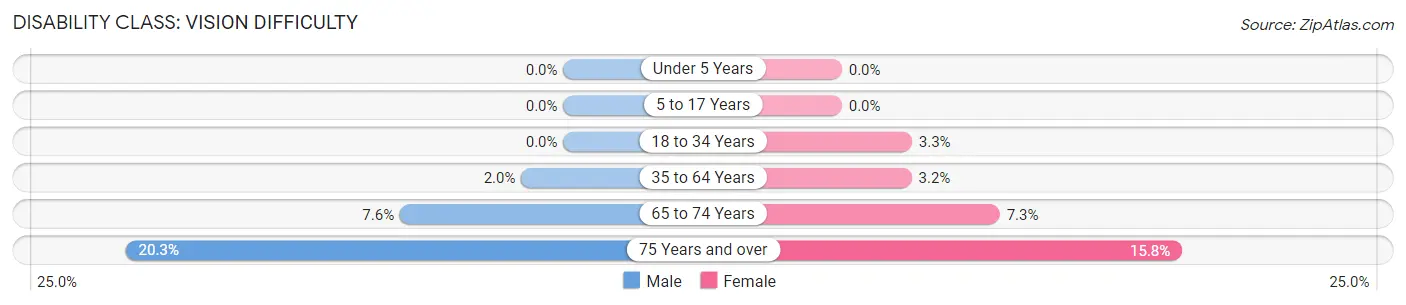
| Age Bracket | Male | Female |
| Under 5 Years | 0 (0.0%) | 0 (0.0%) |
| 5 to 17 Years | 0 (0.0%) | 0 (0.0%) |
| 18 to 34 Years | 0 (0.0%) | 8 (3.3%) |
| 35 to 64 Years | 6 (1.9%) | 12 (3.2%) |
| 65 to 74 Years | 5 (7.6%) | 11 (7.3%) |
| 75 Years and over | 13 (20.3%) | 9 (15.8%) |
Disability Class: Cognitive Difficulty
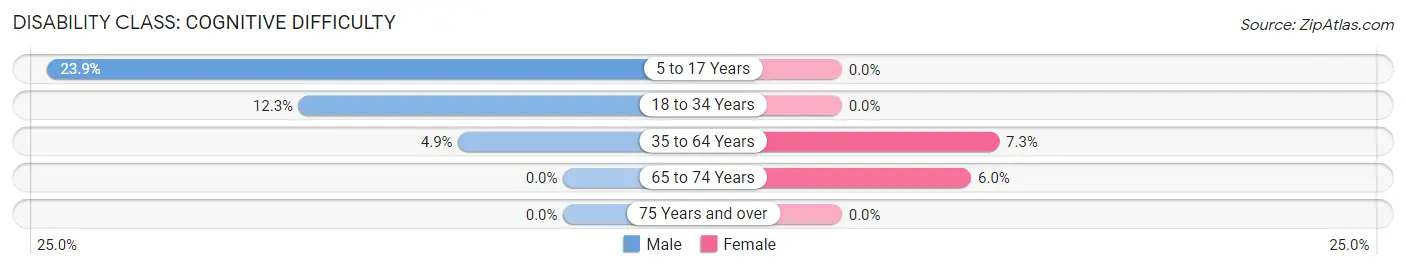
| Age Bracket | Male | Female |
| 5 to 17 Years | 51 (23.9%) | 0 (0.0%) |
| 18 to 34 Years | 40 (12.3%) | 0 (0.0%) |
| 35 to 64 Years | 15 (4.9%) | 27 (7.3%) |
| 65 to 74 Years | 0 (0.0%) | 9 (6.0%) |
| 75 Years and over | 0 (0.0%) | 0 (0.0%) |
Disability Class: Ambulatory Difficulty
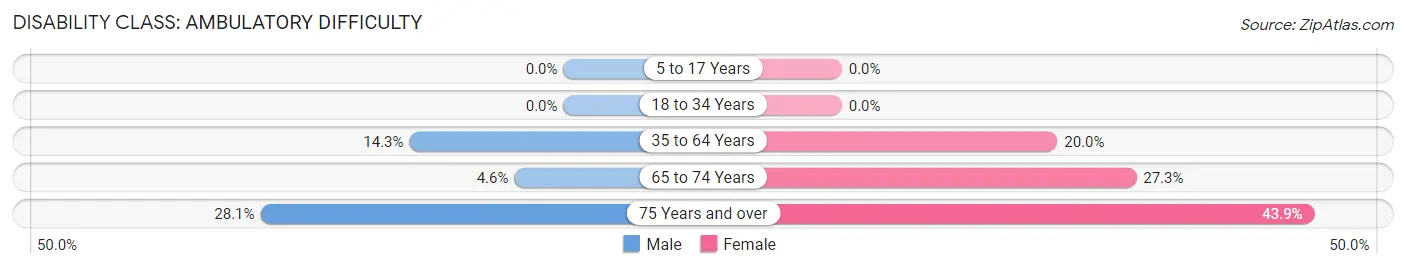
| Age Bracket | Male | Female |
| 5 to 17 Years | 0 (0.0%) | 0 (0.0%) |
| 18 to 34 Years | 0 (0.0%) | 0 (0.0%) |
| 35 to 64 Years | 44 (14.3%) | 74 (20.0%) |
| 65 to 74 Years | 3 (4.5%) | 41 (27.3%) |
| 75 Years and over | 18 (28.1%) | 25 (43.9%) |
Disability Class: Self-Care Difficulty
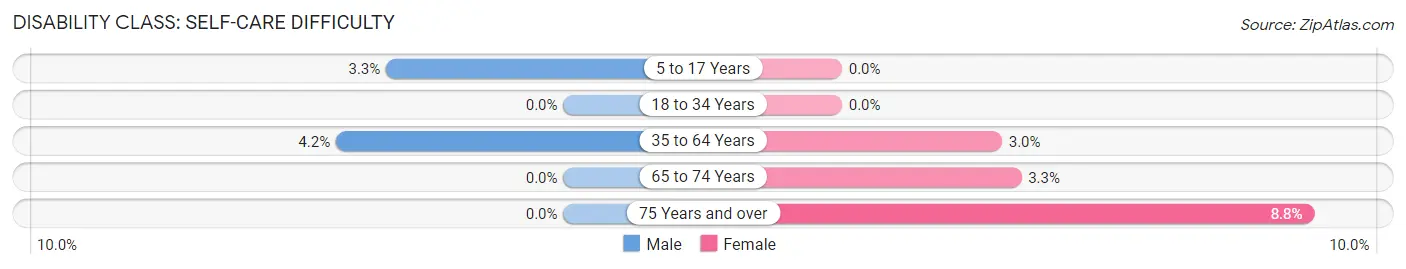
| Age Bracket | Male | Female |
| 5 to 17 Years | 7 (3.3%) | 0 (0.0%) |
| 18 to 34 Years | 0 (0.0%) | 0 (0.0%) |
| 35 to 64 Years | 13 (4.2%) | 11 (3.0%) |
| 65 to 74 Years | 0 (0.0%) | 5 (3.3%) |
| 75 Years and over | 0 (0.0%) | 5 (8.8%) |
Technology Access in Willow Springs
Computing Device Access in Willow Springs
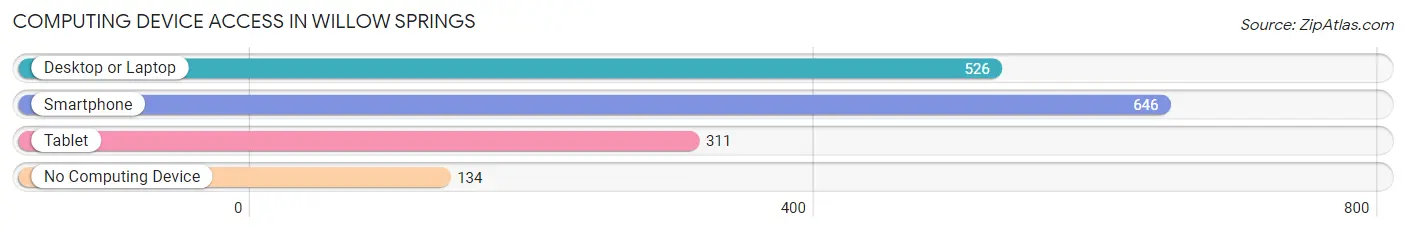
| Device Type | # Households | % Households |
| Desktop or Laptop | 526 | 62.2% |
| Smartphone | 646 | 76.4% |
| Tablet | 311 | 36.8% |
| No Computing Device | 134 | 15.8% |
| Total | 846 | 100.0% |
Internet Access in Willow Springs
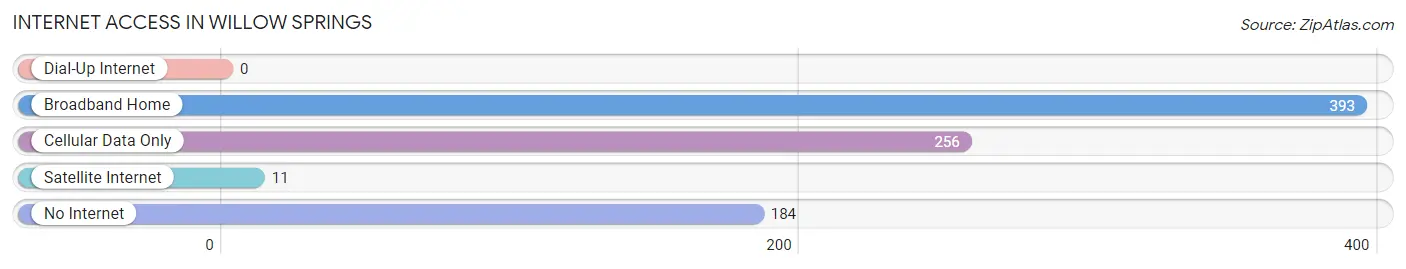
| Internet Type | # Households | % Households |
| Dial-Up Internet | 0 | 0.0% |
| Broadband Home | 393 | 46.5% |
| Cellular Data Only | 256 | 30.3% |
| Satellite Internet | 11 | 1.3% |
| No Internet | 184 | 21.7% |
| Total | 846 | 100.0% |
Willow Springs Summary
Willow Springs is a small city located in the Ozark Mountains of Missouri. It is the county seat of Howell County and is located in the southeastern corner of the state. The city has a population of approximately 4,000 people and is located about 90 miles south of Springfield, Missouri.
History
Willow Springs was founded in 1883 by the Missouri Pacific Railroad. The city was named after the nearby Willow Springs, which was a popular stop for travelers on the railroad. The city was incorporated in 1887 and quickly became a popular destination for tourists and travelers.
The city was home to a variety of businesses, including a hotel, a bank, a newspaper, a sawmill, and a variety of other businesses. The city was also home to a variety of churches, including the First Baptist Church, which was founded in 1884.
In the early 1900s, the city was home to a variety of industries, including a flour mill, a canning factory, and a furniture factory. The city also had a variety of stores, including a general store, a drug store, and a hardware store.
Geography
Willow Springs is located in the Ozark Mountains of Missouri. The city is located in the southeastern corner of the state, about 90 miles south of Springfield, Missouri. The city is located in Howell County and is surrounded by the Mark Twain National Forest.
The city is located at an elevation of 1,000 feet and is located on the banks of the North Fork River. The city is located in a valley surrounded by hills and mountains. The city is located in a temperate climate, with hot summers and cold winters.
Economy
Willow Springs is a small city with a population of approximately 4,000 people. The city is home to a variety of businesses, including a variety of retail stores, restaurants, and other businesses. The city is also home to a variety of industries, including a flour mill, a canning factory, and a furniture factory.
The city is also home to a variety of tourist attractions, including the Mark Twain National Forest, the North Fork River, and the Ozark Mountains. The city is also home to a variety of outdoor activities, including fishing, hunting, camping, and hiking.
Demographics
As of the 2010 census, the population of Willow Springs was 4,000 people. The city is predominantly white, with approximately 95% of the population being white. The city is also home to a variety of other ethnicities, including African American, Hispanic, and Native American.
The median household income in Willow Springs is $35,000, and the median home value is $90,000. The city has a poverty rate of approximately 15%, and the unemployment rate is approximately 5%. The city is home to a variety of educational institutions, including a public school system and a community college.
Common Questions
What is Per Capita Income in Willow Springs?
Per Capita income in Willow Springs is $22,393.
What is the Median Family Income in Willow Springs?
Median Family Income in Willow Springs is $51,818.
What is the Median Household income in Willow Springs?
Median Household Income in Willow Springs is $39,654.
What is Income or Wage Gap in Willow Springs?
Income or Wage Gap in Willow Springs is 47.9%.
Women in Willow Springs earn 52.1 cents for every dollar earned by a man.
What is Inequality or Gini Index in Willow Springs?
Inequality or Gini Index in Willow Springs is 0.44.
What is the Total Population of Willow Springs?
Total Population of Willow Springs is 2,125.
What is the Total Male Population of Willow Springs?
Total Male Population of Willow Springs is 1,087.
What is the Total Female Population of Willow Springs?
Total Female Population of Willow Springs is 1,038.
What is the Ratio of Males per 100 Females in Willow Springs?
There are 104.72 Males per 100 Females in Willow Springs.
What is the Ratio of Females per 100 Males in Willow Springs?
There are 95.49 Females per 100 Males in Willow Springs.
What is the Median Population Age in Willow Springs?
Median Population Age in Willow Springs is 33.8 Years.
What is the Average Family Size in Willow Springs
Average Family Size in Willow Springs is 3.3 People.
What is the Average Household Size in Willow Springs
Average Household Size in Willow Springs is 2.5 People.
How Large is the Labor Force in Willow Springs?
There are 1,028 People in the Labor Forcein in Willow Springs.
What is the Percentage of People in the Labor Force in Willow Springs?
59.0% of People are in the Labor Force in Willow Springs.
What is the Unemployment Rate in Willow Springs?
Unemployment Rate in Willow Springs is 9.0%.