Willard, MO Map & Demographics
Willard Map
Willard Overview
$28,836
PER CAPITA INCOME
$90,168
AVG FAMILY INCOME
$76,500
AVG HOUSEHOLD INCOME
11.7%
WAGE / INCOME GAP [ % ]
88.3¢/ $1
WAGE / INCOME GAP [ $ ]
0.39
INEQUALITY / GINI INDEX
6,342
TOTAL POPULATION
3,204
MALE POPULATION
3,138
FEMALE POPULATION
102.10
MALES / 100 FEMALES
97.94
FEMALES / 100 MALES
31.1
MEDIAN AGE
3.3
AVG FAMILY SIZE
2.9
AVG HOUSEHOLD SIZE
2,997
LABOR FORCE [ PEOPLE ]
68.2%
PERCENT IN LABOR FORCE
2.9%
UNEMPLOYMENT RATE
Willard Zip Codes
Willard Area Codes
Income in Willard
Income Overview in Willard
Per Capita Income in Willard is $28,836, while median incomes of families and households are $90,168 and $76,500 respectively.
| Characteristic | Number | Measure |
| Per Capita Income | 6,342 | $28,836 |
| Median Family Income | 1,679 | $90,168 |
| Mean Family Income | 1,679 | $91,176 |
| Median Household Income | 2,172 | $76,500 |
| Mean Household Income | 2,172 | $86,273 |
| Income Deficit | 1,679 | $0 |
| Wage / Income Gap (%) | 6,342 | 11.73% |
| Wage / Income Gap ($) | 6,342 | 88.27¢ per $1 |
| Gini / Inequality Index | 6,342 | 0.39 |
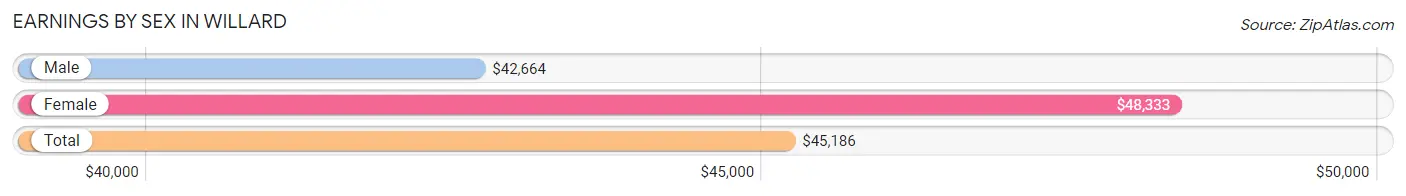
Earnings by Sex in Willard
Average Earnings in Willard are $45,186, $42,664 for men and $48,333 for women, a difference of 11.7%.
| Sex | Number | Average Earnings |
| Male | 1,713 (55.0%) | $42,664 |
| Female | 1,400 (45.0%) | $48,333 |
| Total | 3,113 (100.0%) | $45,186 |
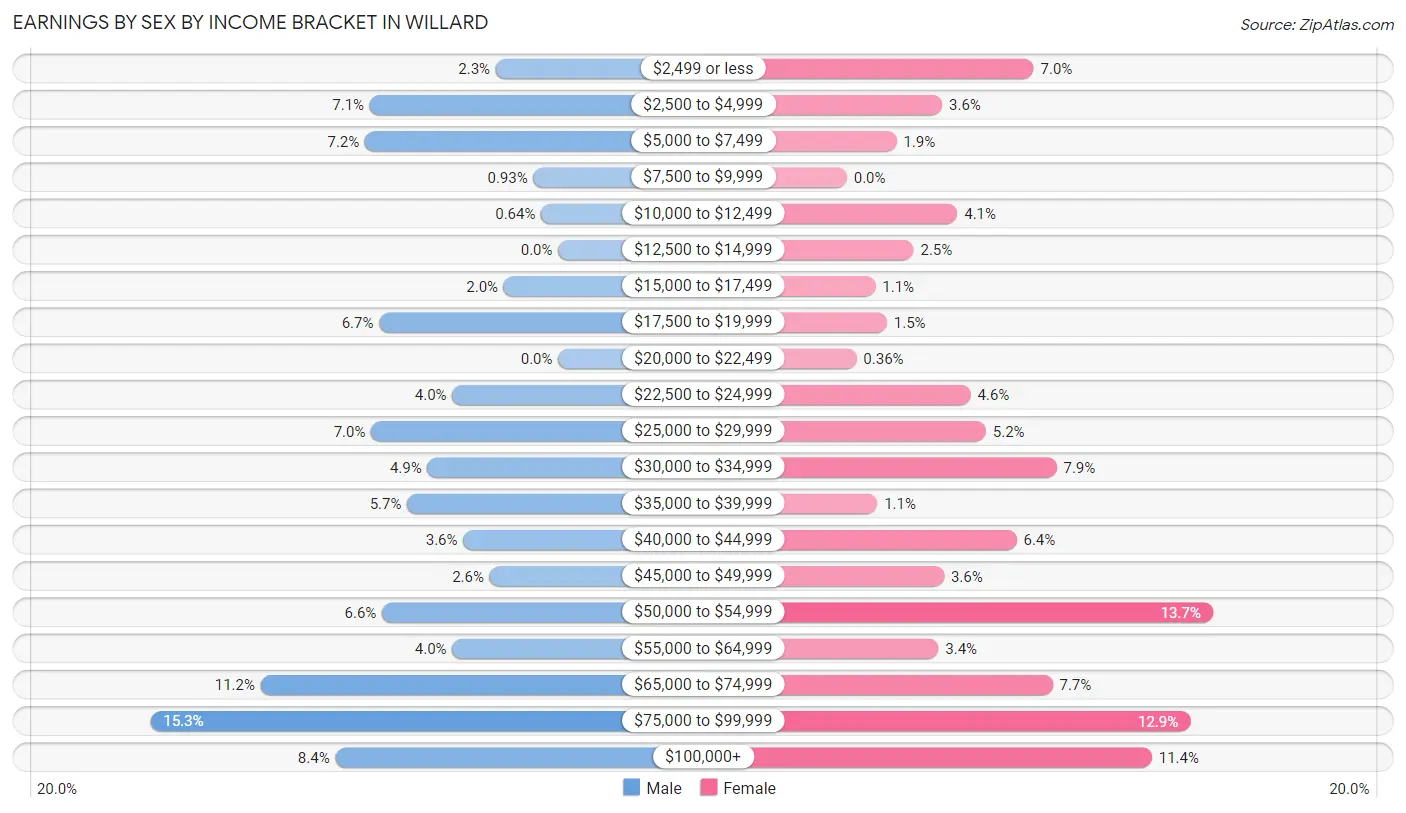
Earnings by Sex by Income Bracket in Willard
The most common earnings brackets in Willard are $75,000 to $99,999 for men (262 | 15.3%) and $50,000 to $54,999 for women (192 | 13.7%).
| Income | Male | Female |
| $2,499 or less | 40 (2.3%) | 98 (7.0%) |
| $2,500 to $4,999 | 121 (7.1%) | 50 (3.6%) |
| $5,000 to $7,499 | 124 (7.2%) | 26 (1.9%) |
| $7,500 to $9,999 | 16 (0.9%) | 0 (0.0%) |
| $10,000 to $12,499 | 11 (0.6%) | 58 (4.1%) |
| $12,500 to $14,999 | 0 (0.0%) | 35 (2.5%) |
| $15,000 to $17,499 | 35 (2.0%) | 15 (1.1%) |
| $17,500 to $19,999 | 115 (6.7%) | 21 (1.5%) |
| $20,000 to $22,499 | 0 (0.0%) | 5 (0.4%) |
| $22,500 to $24,999 | 68 (4.0%) | 65 (4.6%) |
| $25,000 to $29,999 | 120 (7.0%) | 73 (5.2%) |
| $30,000 to $34,999 | 84 (4.9%) | 110 (7.9%) |
| $35,000 to $39,999 | 97 (5.7%) | 16 (1.1%) |
| $40,000 to $44,999 | 61 (3.6%) | 89 (6.4%) |
| $45,000 to $49,999 | 44 (2.6%) | 51 (3.6%) |
| $50,000 to $54,999 | 113 (6.6%) | 192 (13.7%) |
| $55,000 to $64,999 | 68 (4.0%) | 48 (3.4%) |
| $65,000 to $74,999 | 191 (11.2%) | 108 (7.7%) |
| $75,000 to $99,999 | 262 (15.3%) | 180 (12.9%) |
| $100,000+ | 143 (8.4%) | 160 (11.4%) |
| Total | 1,713 (100.0%) | 1,400 (100.0%) |
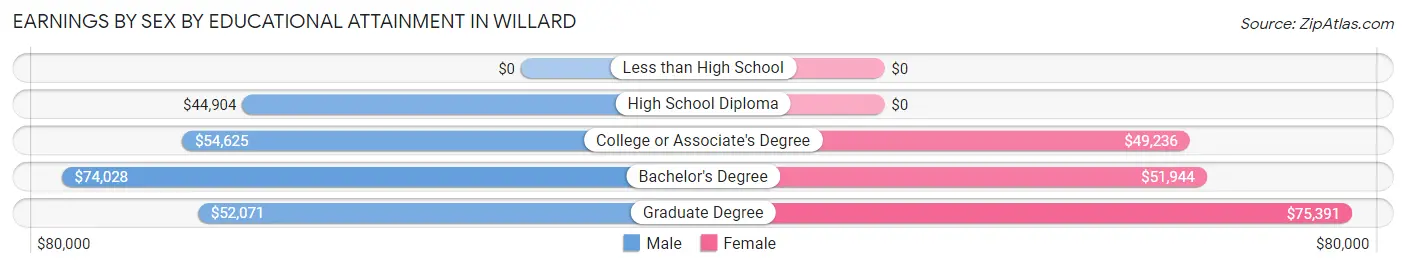
Earnings by Sex by Educational Attainment in Willard
Average earnings in Willard are $55,208 for men and $51,133 for women, a difference of 7.4%. Men with an educational attainment of bachelor's degree enjoy the highest average annual earnings of $74,028, while those with high school diploma education earn the least with $44,904. Women with an educational attainment of graduate degree earn the most with the average annual earnings of $75,391, while those with college or associate's degree education have the smallest earnings of $49,236.
| Educational Attainment | Male Income | Female Income |
| Less than High School | - | - |
| High School Diploma | $44,904 | $0 |
| College or Associate's Degree | $54,625 | $49,236 |
| Bachelor's Degree | $74,028 | $51,944 |
| Graduate Degree | $52,071 | $75,391 |
| Total | $55,208 | $51,133 |
Family Income in Willard
Family Income Brackets in Willard
According to the Willard family income data, there are 490 families falling into the $100,000 to $149,999 income range, which is the most common income bracket and makes up 29.2% of all families.
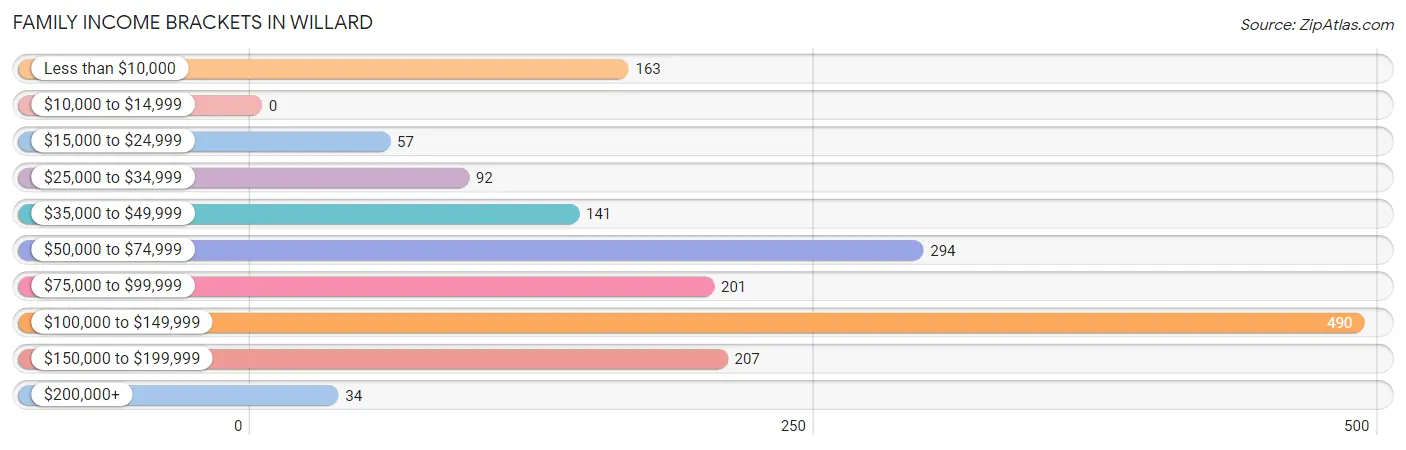
| Income Bracket | # Families | % Families |
| Less than $10,000 | 163 | 9.7% |
| $10,000 to $14,999 | 0 | 0.0% |
| $15,000 to $24,999 | 57 | 3.4% |
| $25,000 to $34,999 | 92 | 5.5% |
| $35,000 to $49,999 | 141 | 8.4% |
| $50,000 to $74,999 | 294 | 17.5% |
| $75,000 to $99,999 | 201 | 12.0% |
| $100,000 to $149,999 | 490 | 29.2% |
| $150,000 to $199,999 | 207 | 12.3% |
| $200,000+ | 34 | 2.0% |
Family Income by Famaliy Size in Willard
5-person families (170 | 10.1%) account for the highest median family income in Willard with $145,128 per family, while 2-person families (693 | 41.3%) have the highest median income of $30,276 per family member.
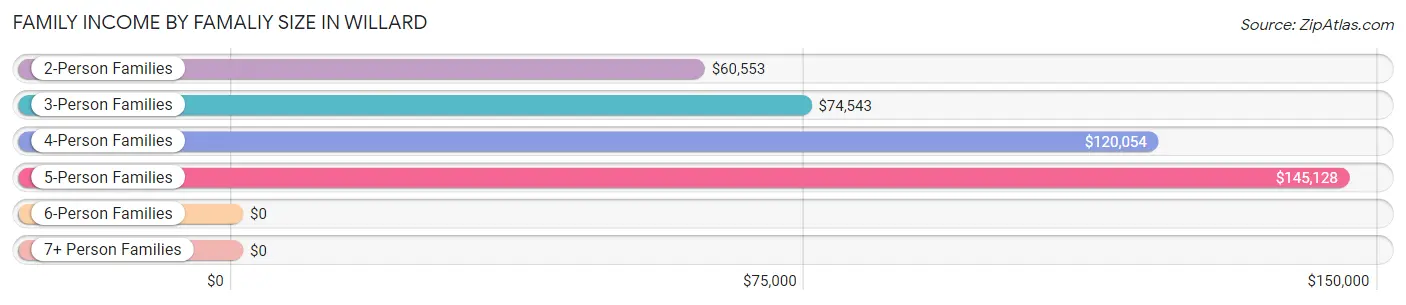
| Income Bracket | # Families | Median Income |
| 2-Person Families | 693 (41.3%) | $60,553 |
| 3-Person Families | 347 (20.7%) | $74,543 |
| 4-Person Families | 283 (16.9%) | $120,054 |
| 5-Person Families | 170 (10.1%) | $145,128 |
| 6-Person Families | 147 (8.8%) | $0 |
| 7+ Person Families | 39 (2.3%) | $0 |
| Total | 1,679 (100.0%) | $90,168 |
Family Income by Number of Earners in Willard
The median family income in Willard is $90,168, with families comprising 3+ earners (296) having the highest median family income of $136,843, while families with no earners (185) have the lowest median family income of $29,844, accounting for 17.6% and 11.0% of families, respectively.
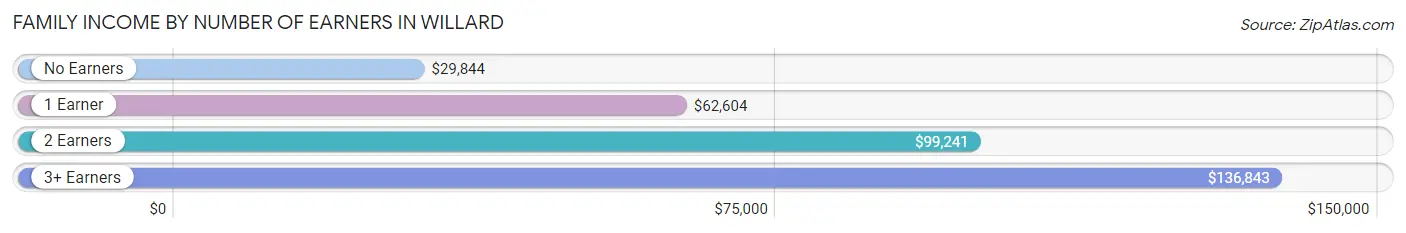
| Number of Earners | # Families | Median Income |
| No Earners | 185 (11.0%) | $29,844 |
| 1 Earner | 529 (31.5%) | $62,604 |
| 2 Earners | 669 (39.9%) | $99,241 |
| 3+ Earners | 296 (17.6%) | $136,843 |
| Total | 1,679 (100.0%) | $90,168 |
Household Income in Willard
Household Income Brackets in Willard
With 506 households falling in the category, the $100,000 to $149,999 income range is the most frequent in Willard, accounting for 23.3% of all households. In contrast, only 4 households (0.2%) fall into the $10,000 to $14,999 income bracket, making it the least populous group.
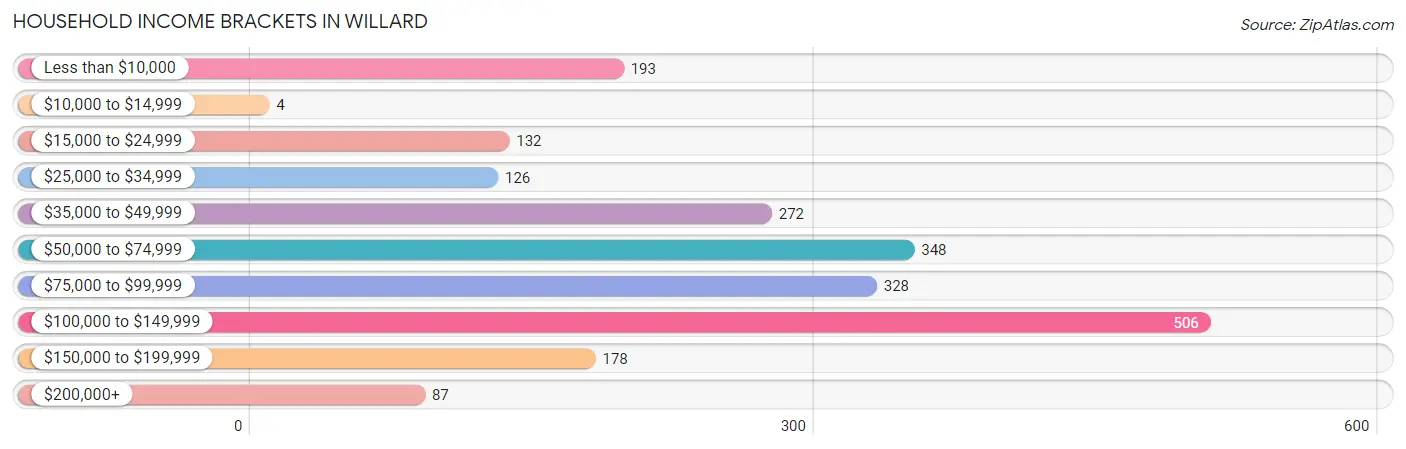
| Income Bracket | # Households | % Households |
| Less than $10,000 | 193 | 8.9% |
| $10,000 to $14,999 | 4 | 0.2% |
| $15,000 to $24,999 | 132 | 6.1% |
| $25,000 to $34,999 | 126 | 5.8% |
| $35,000 to $49,999 | 272 | 12.5% |
| $50,000 to $74,999 | 348 | 16.0% |
| $75,000 to $99,999 | 328 | 15.1% |
| $100,000 to $149,999 | 506 | 23.3% |
| $150,000 to $199,999 | 178 | 8.2% |
| $200,000+ | 87 | 4.0% |
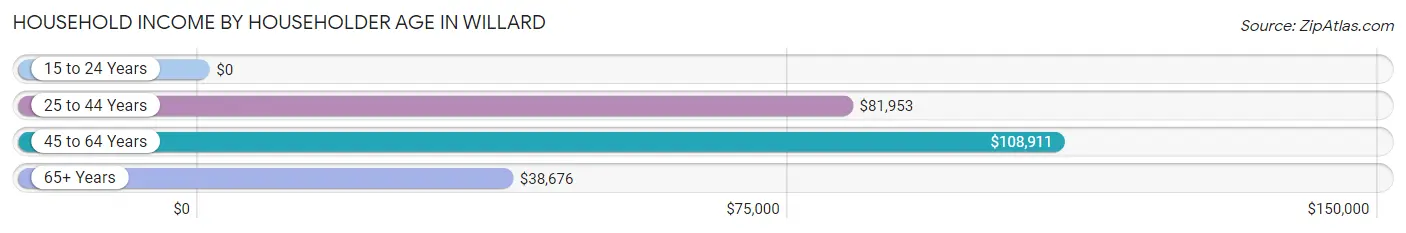
Household Income by Householder Age in Willard
The median household income in Willard is $76,500, with the highest median household income of $108,911 found in the 45 to 64 years age bracket for the primary householder. A total of 968 households (44.6%) fall into this category. Meanwhile, the 15 to 24 years age bracket for the primary householder has the lowest median household income of $0, with 204 households (9.4%) in this group.
| Income Bracket | # Households | Median Income |
| 15 to 24 Years | 204 (9.4%) | $0 |
| 25 to 44 Years | 590 (27.2%) | $81,953 |
| 45 to 64 Years | 968 (44.6%) | $108,911 |
| 65+ Years | 410 (18.9%) | $38,676 |
| Total | 2,172 (100.0%) | $76,500 |
Poverty in Willard
Income Below Poverty by Sex and Age in Willard
With 11.2% poverty level for males and 11.8% for females among the residents of Willard, under 5 year old males and 18 to 24 year old females are the most vulnerable to poverty, with 102 males (49.3%) and 144 females (54.5%) in their respective age groups living below the poverty level.
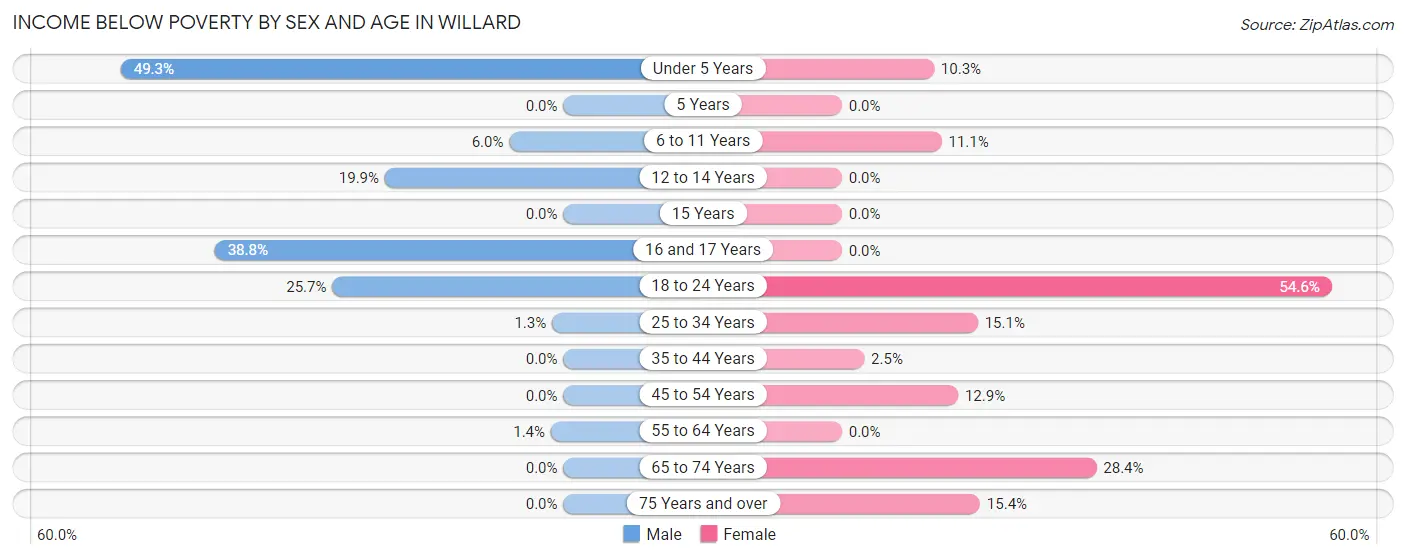
| Age Bracket | Male | Female |
| Under 5 Years | 102 (49.3%) | 24 (10.3%) |
| 5 Years | 0 (0.0%) | 0 (0.0%) |
| 6 to 11 Years | 21 (6.0%) | 23 (11.1%) |
| 12 to 14 Years | 68 (19.9%) | 0 (0.0%) |
| 15 Years | 0 (0.0%) | 0 (0.0%) |
| 16 and 17 Years | 33 (38.8%) | 0 (0.0%) |
| 18 to 24 Years | 124 (25.7%) | 144 (54.5%) |
| 25 to 34 Years | 5 (1.3%) | 38 (15.1%) |
| 35 to 44 Years | 0 (0.0%) | 12 (2.5%) |
| 45 to 54 Years | 0 (0.0%) | 44 (12.9%) |
| 55 to 64 Years | 4 (1.4%) | 0 (0.0%) |
| 65 to 74 Years | 0 (0.0%) | 55 (28.3%) |
| 75 Years and over | 0 (0.0%) | 26 (15.4%) |
| Total | 357 (11.2%) | 366 (11.8%) |
Income Above Poverty by Sex and Age in Willard
According to the poverty statistics in Willard, males aged 5 years and females aged 5 years are the age groups that are most secure financially, with 100.0% of males and 100.0% of females in these age groups living above the poverty line.
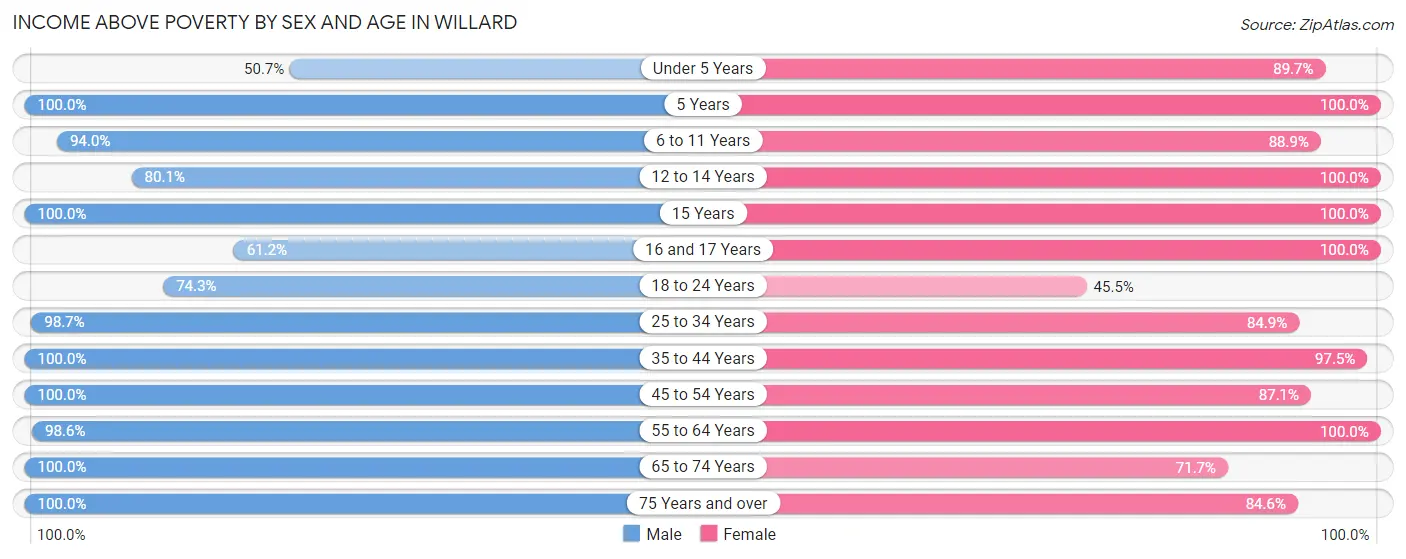
| Age Bracket | Male | Female |
| Under 5 Years | 105 (50.7%) | 210 (89.7%) |
| 5 Years | 41 (100.0%) | 31 (100.0%) |
| 6 to 11 Years | 328 (94.0%) | 184 (88.9%) |
| 12 to 14 Years | 274 (80.1%) | 446 (100.0%) |
| 15 Years | 63 (100.0%) | 26 (100.0%) |
| 16 and 17 Years | 52 (61.2%) | 53 (100.0%) |
| 18 to 24 Years | 358 (74.3%) | 120 (45.5%) |
| 25 to 34 Years | 393 (98.7%) | 213 (84.9%) |
| 35 to 44 Years | 259 (100.0%) | 469 (97.5%) |
| 45 to 54 Years | 430 (100.0%) | 296 (87.1%) |
| 55 to 64 Years | 284 (98.6%) | 411 (100.0%) |
| 65 to 74 Years | 174 (100.0%) | 139 (71.7%) |
| 75 Years and over | 67 (100.0%) | 143 (84.6%) |
| Total | 2,828 (88.8%) | 2,741 (88.2%) |
Income Below Poverty Among Married-Couple Families in Willard
The poverty statistics for married-couple families in Willard show that 7.8% or 105 of the total 1,352 families live below the poverty line. Families with 1 or 2 children have the highest poverty rate of 16.6%, comprising of 72 families. On the other hand, families with 3 or 4 children have the lowest poverty rate of 0.0%, which includes 0 families.
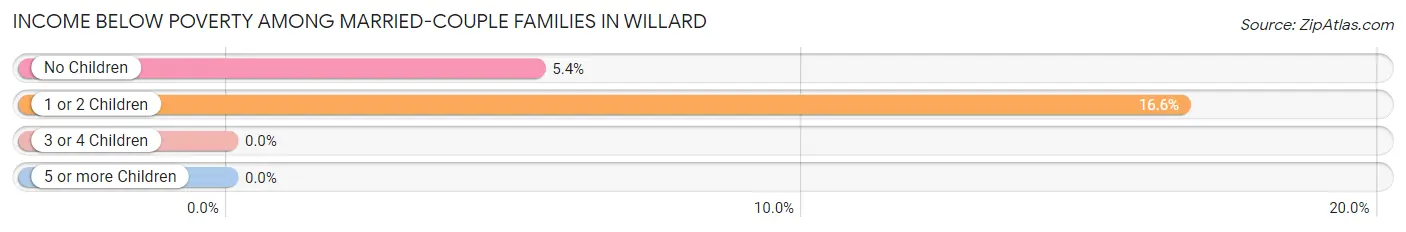
| Children | Above Poverty | Below Poverty |
| No Children | 584 (94.7%) | 33 (5.3%) |
| 1 or 2 Children | 362 (83.4%) | 72 (16.6%) |
| 3 or 4 Children | 293 (100.0%) | 0 (0.0%) |
| 5 or more Children | 8 (100.0%) | 0 (0.0%) |
| Total | 1,247 (92.2%) | 105 (7.8%) |
Income Below Poverty Among Single-Parent Households in Willard
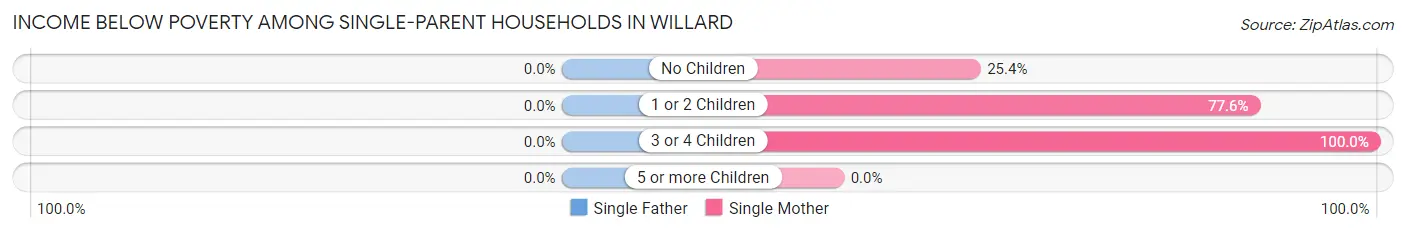
| Children | Single Father | Single Mother |
| No Children | 0 (0.0%) | 43 (25.4%) |
| 1 or 2 Children | 0 (0.0%) | 45 (77.6%) |
| 3 or 4 Children | 0 (0.0%) | 38 (100.0%) |
| 5 or more Children | 0 (0.0%) | 0 (0.0%) |
| Total | 0 (0.0%) | 126 (47.5%) |
Income Below Poverty Among Married-Couple vs Single-Parent Households in Willard
The poverty data for Willard shows that 105 of the married-couple family households (7.8%) and 126 of the single-parent households (38.5%) are living below the poverty level. Within the married-couple family households, those with 1 or 2 children have the highest poverty rate, with 72 households (16.6%) falling below the poverty line. Among the single-parent households, those with 3 or 4 children have the highest poverty rate, with 38 household (100.0%) living below poverty.
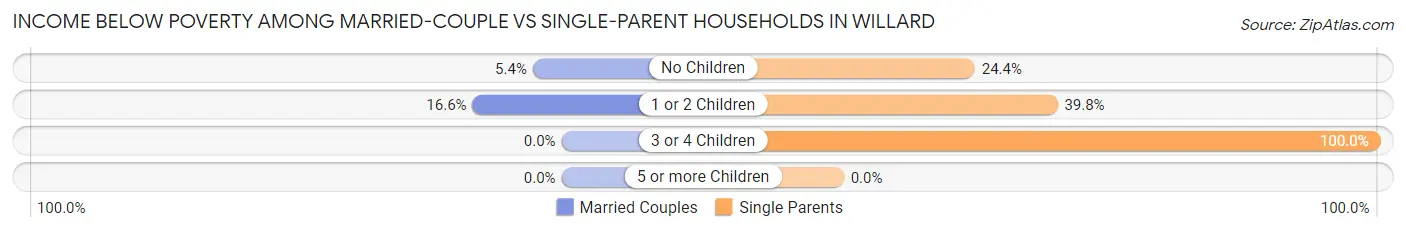
| Children | Married-Couple Families | Single-Parent Households |
| No Children | 33 (5.3%) | 43 (24.4%) |
| 1 or 2 Children | 72 (16.6%) | 45 (39.8%) |
| 3 or 4 Children | 0 (0.0%) | 38 (100.0%) |
| 5 or more Children | 0 (0.0%) | 0 (0.0%) |
| Total | 105 (7.8%) | 126 (38.5%) |
Race in Willard
The most populous races in Willard are White / Caucasian (6,021 | 94.9%), Two or more Races (186 | 2.9%), and Hispanic or Latino (159 | 2.5%).
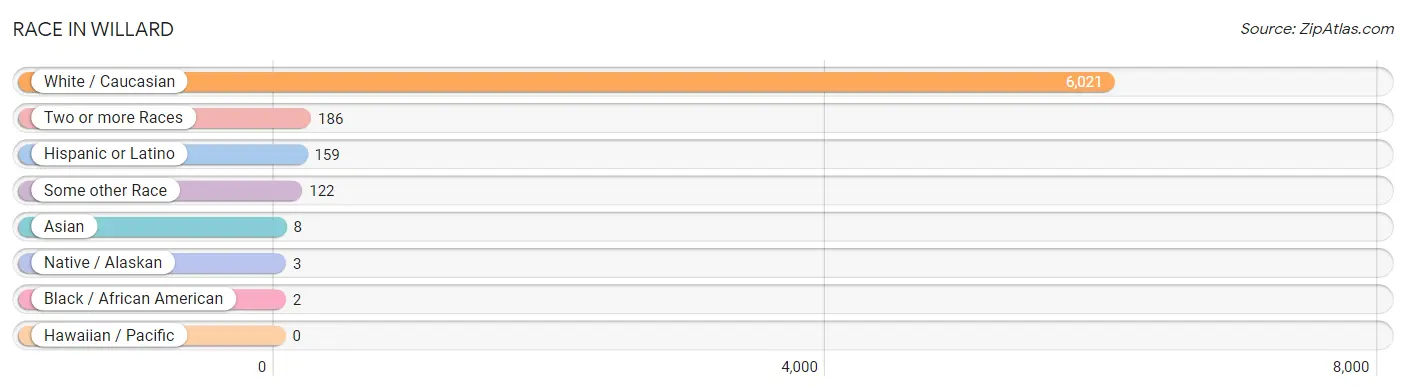
| Race | # Population | % Population |
| Asian | 8 | 0.1% |
| Black / African American | 2 | 0.0% |
| Hawaiian / Pacific | 0 | 0.0% |
| Hispanic or Latino | 159 | 2.5% |
| Native / Alaskan | 3 | 0.1% |
| White / Caucasian | 6,021 | 94.9% |
| Two or more Races | 186 | 2.9% |
| Some other Race | 122 | 1.9% |
| Total | 6,342 | 100.0% |
Ancestry in Willard
The most populous ancestries reported in Willard are American (1,468 | 23.2%), German (1,282 | 20.2%), English (792 | 12.5%), Irish (554 | 8.7%), and Italian (266 | 4.2%), together accounting for 68.8% of all Willard residents.
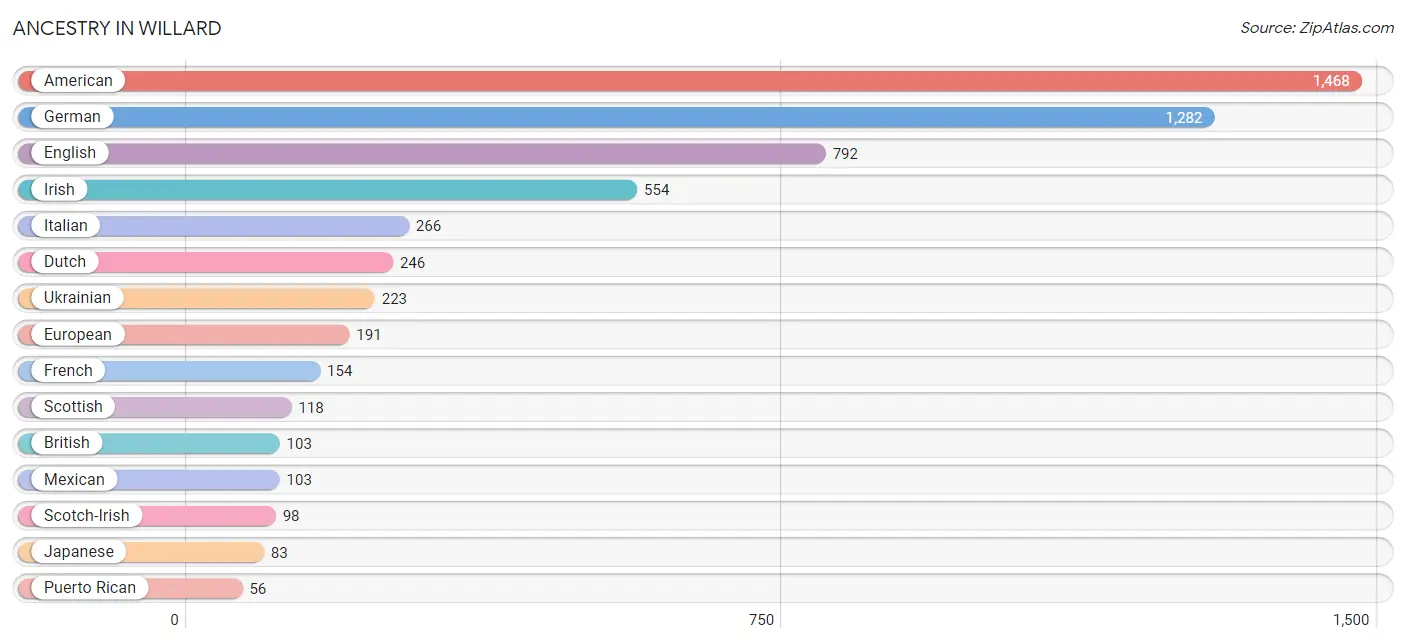
| Ancestry | # Population | % Population |
| American | 1,468 | 23.2% |
| Belgian | 11 | 0.2% |
| British | 103 | 1.6% |
| Burmese | 44 | 0.7% |
| Canadian | 11 | 0.2% |
| Central American Indian | 9 | 0.1% |
| Cherokee | 28 | 0.4% |
| Choctaw | 32 | 0.5% |
| Comanche | 3 | 0.1% |
| Croatian | 43 | 0.7% |
| Czech | 11 | 0.2% |
| Danish | 42 | 0.7% |
| Dutch | 246 | 3.9% |
| English | 792 | 12.5% |
| European | 191 | 3.0% |
| Finnish | 11 | 0.2% |
| French | 154 | 2.4% |
| German | 1,282 | 20.2% |
| Irish | 554 | 8.7% |
| Italian | 266 | 4.2% |
| Japanese | 83 | 1.3% |
| Kiowa | 3 | 0.1% |
| Mexican | 103 | 1.6% |
| Navajo | 9 | 0.1% |
| Nigerian | 2 | 0.0% |
| Norwegian | 45 | 0.7% |
| Polish | 15 | 0.2% |
| Puerto Rican | 56 | 0.9% |
| Russian | 24 | 0.4% |
| Scotch-Irish | 98 | 1.5% |
| Scottish | 118 | 1.9% |
| Slavic | 27 | 0.4% |
| Sri Lankan | 2 | 0.0% |
| Subsaharan African | 2 | 0.0% |
| Swedish | 48 | 0.8% |
| Ukrainian | 223 | 3.5% |
| Welsh | 54 | 0.9% | View All 37 Rows |
Immigrants in Willard
The most numerous immigrant groups reported in Willard came from Europe (109 | 1.7%), Eastern Europe (95 | 1.5%), Central America (94 | 1.5%), Latin America (94 | 1.5%), and Mexico (94 | 1.5%), together accounting for 7.7% of all Willard residents.
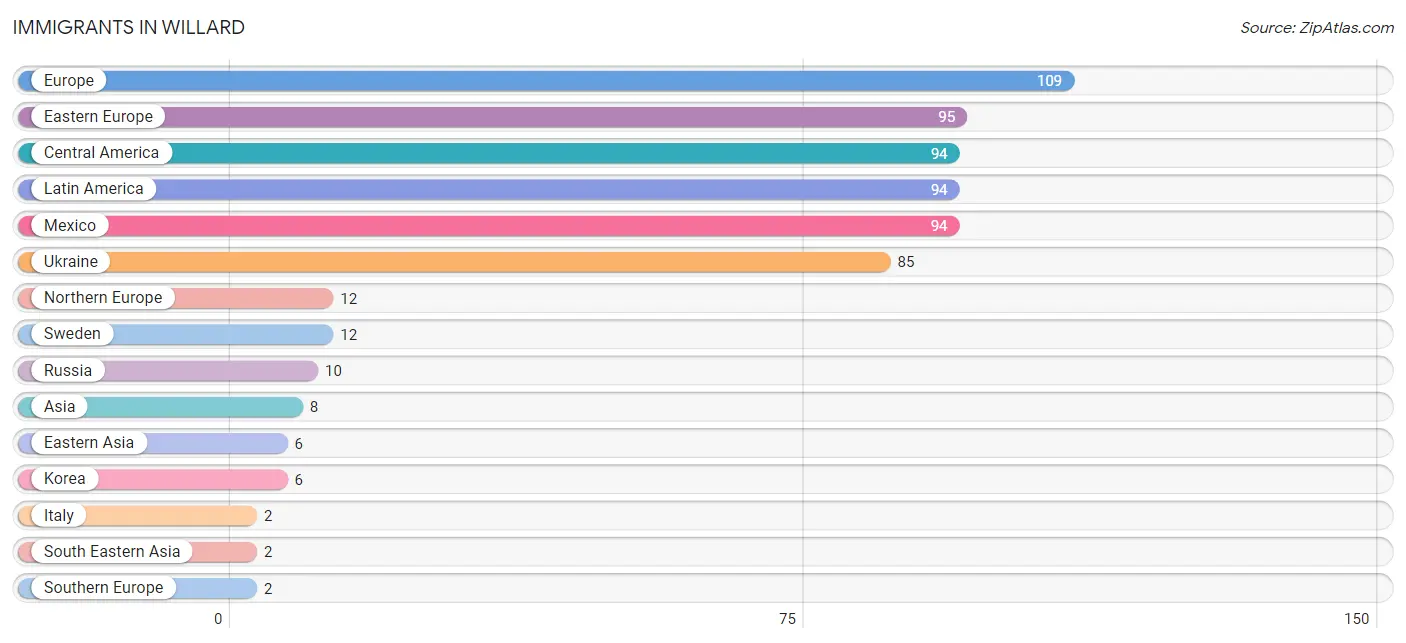
| Immigration Origin | # Population | % Population |
| Asia | 8 | 0.1% |
| Central America | 94 | 1.5% |
| Eastern Asia | 6 | 0.1% |
| Eastern Europe | 95 | 1.5% |
| Europe | 109 | 1.7% |
| Italy | 2 | 0.0% |
| Korea | 6 | 0.1% |
| Latin America | 94 | 1.5% |
| Mexico | 94 | 1.5% |
| Northern Europe | 12 | 0.2% |
| Russia | 10 | 0.2% |
| South Eastern Asia | 2 | 0.0% |
| Southern Europe | 2 | 0.0% |
| Sweden | 12 | 0.2% |
| Ukraine | 85 | 1.3% |
| Vietnam | 2 | 0.0% | View All 16 Rows |
Sex and Age in Willard
Sex and Age in Willard
The most populous age groups in Willard are 10 to 14 Years (419 | 13.1%) for men and 10 to 14 Years (486 | 15.5%) for women.
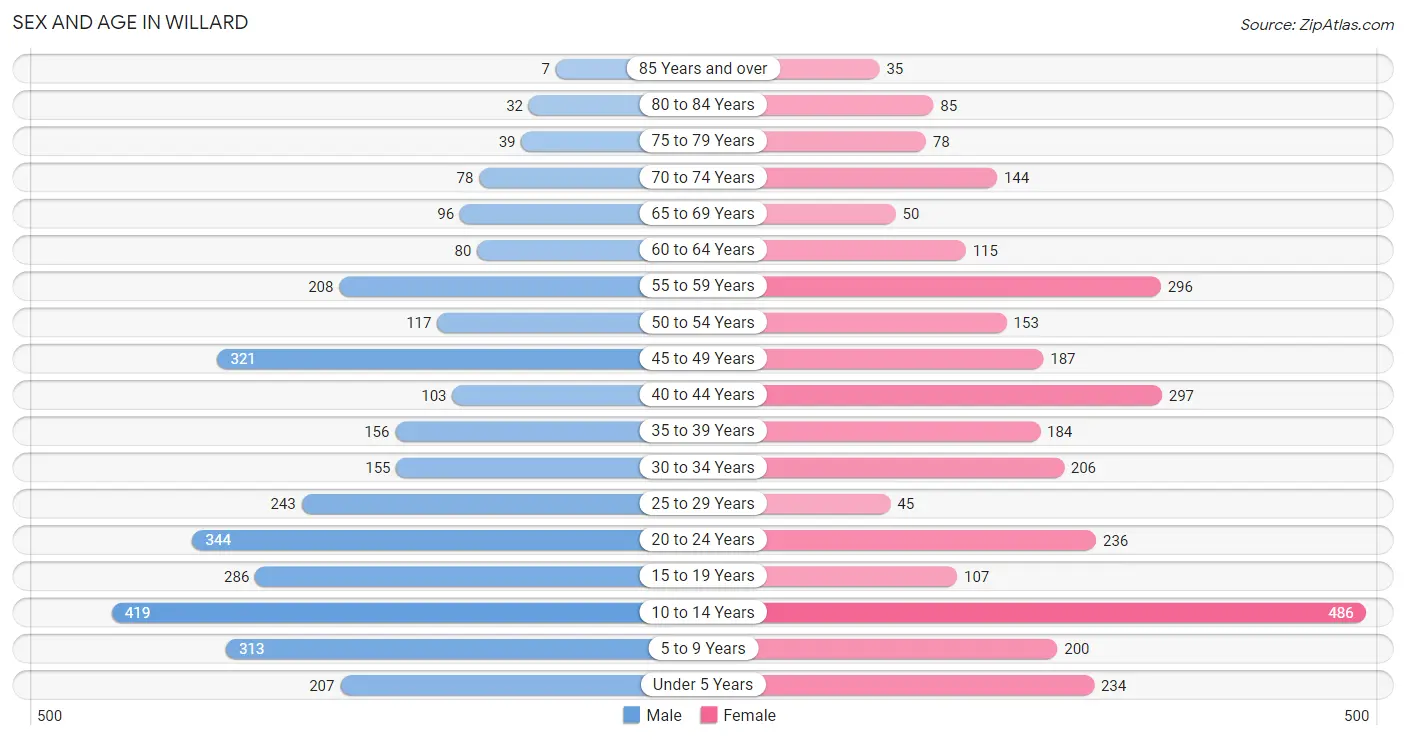
| Age Bracket | Male | Female |
| Under 5 Years | 207 (6.5%) | 234 (7.5%) |
| 5 to 9 Years | 313 (9.8%) | 200 (6.4%) |
| 10 to 14 Years | 419 (13.1%) | 486 (15.5%) |
| 15 to 19 Years | 286 (8.9%) | 107 (3.4%) |
| 20 to 24 Years | 344 (10.7%) | 236 (7.5%) |
| 25 to 29 Years | 243 (7.6%) | 45 (1.4%) |
| 30 to 34 Years | 155 (4.8%) | 206 (6.6%) |
| 35 to 39 Years | 156 (4.9%) | 184 (5.9%) |
| 40 to 44 Years | 103 (3.2%) | 297 (9.5%) |
| 45 to 49 Years | 321 (10.0%) | 187 (6.0%) |
| 50 to 54 Years | 117 (3.6%) | 153 (4.9%) |
| 55 to 59 Years | 208 (6.5%) | 296 (9.4%) |
| 60 to 64 Years | 80 (2.5%) | 115 (3.7%) |
| 65 to 69 Years | 96 (3.0%) | 50 (1.6%) |
| 70 to 74 Years | 78 (2.4%) | 144 (4.6%) |
| 75 to 79 Years | 39 (1.2%) | 78 (2.5%) |
| 80 to 84 Years | 32 (1.0%) | 85 (2.7%) |
| 85 Years and over | 7 (0.2%) | 35 (1.1%) |
| Total | 3,204 (100.0%) | 3,138 (100.0%) |
Families and Households in Willard
Median Family Size in Willard
The median family size in Willard is 3.29 persons per family, with married-couple families (1,352 | 80.5%) accounting for the largest median family size of 3.52 persons per family. On the other hand, single female/mother families (265 | 15.8%) represent the smallest median family size with 2.33 persons per family.
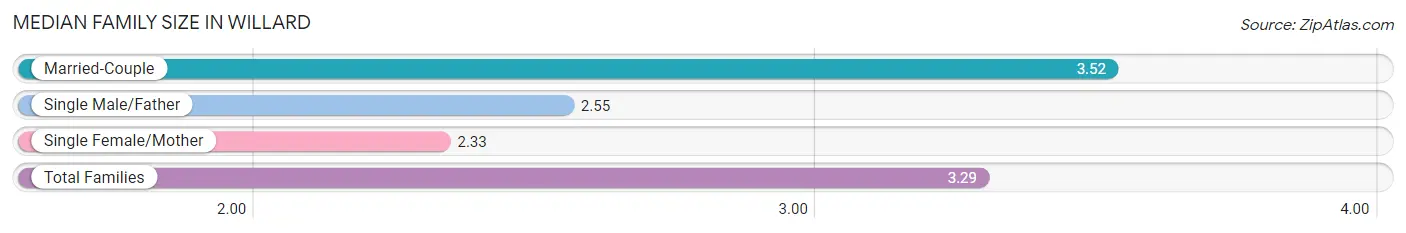
| Family Type | # Families | Family Size |
| Married-Couple | 1,352 (80.5%) | 3.52 |
| Single Male/Father | 62 (3.7%) | 2.55 |
| Single Female/Mother | 265 (15.8%) | 2.33 |
| Total Families | 1,679 (100.0%) | 3.29 |
Median Household Size in Willard
The median household size in Willard is 2.89 persons per household, with married-couple households (1,352 | 62.3%) accounting for the largest median household size of 3.53 persons per household. non-family households (493 | 22.7%) represent the smallest median household size with 1.39 persons per household.
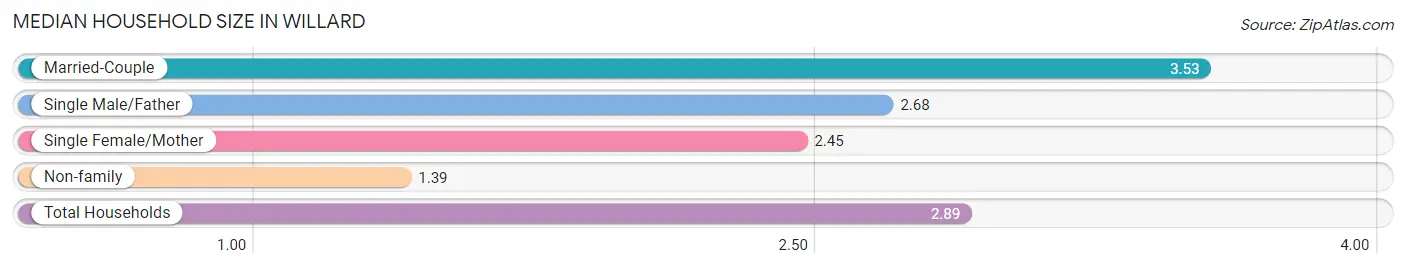
| Household Type | # Households | Household Size |
| Married-Couple | 1,352 (62.3%) | 3.53 |
| Single Male/Father | 62 (2.9%) | 2.68 |
| Single Female/Mother | 265 (12.2%) | 2.45 |
| Non-family | 493 (22.7%) | 1.39 |
| Total Households | 2,172 (100.0%) | 2.89 |
Household Size by Marriage Status in Willard
Out of a total of 2,172 households in Willard, 1,679 (77.3%) are family households, while 493 (22.7%) are nonfamily households. The most numerous type of family households are 2-person households, comprising 662, and the most common type of nonfamily households are 1-person households, comprising 355.
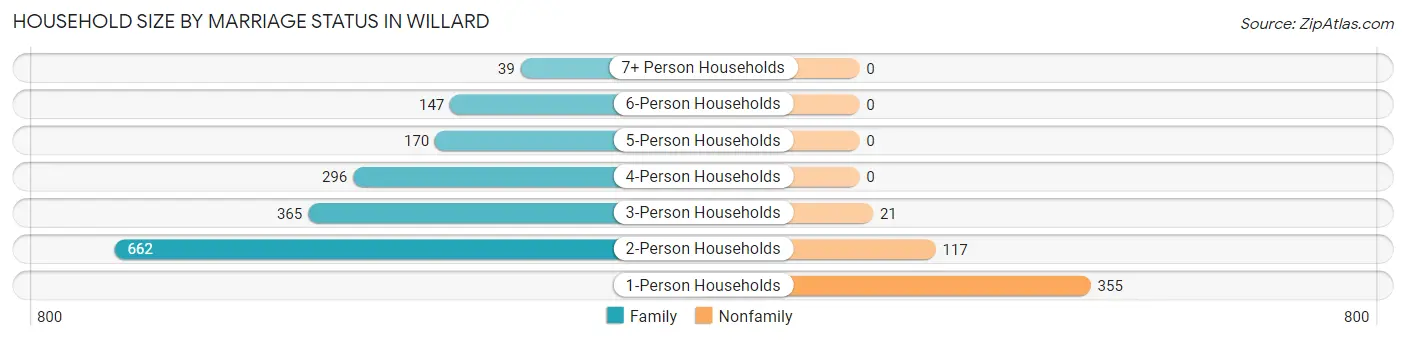
| Household Size | Family Households | Nonfamily Households |
| 1-Person Households | - | 355 (16.3%) |
| 2-Person Households | 662 (30.5%) | 117 (5.4%) |
| 3-Person Households | 365 (16.8%) | 21 (1.0%) |
| 4-Person Households | 296 (13.6%) | 0 (0.0%) |
| 5-Person Households | 170 (7.8%) | 0 (0.0%) |
| 6-Person Households | 147 (6.8%) | 0 (0.0%) |
| 7+ Person Households | 39 (1.8%) | 0 (0.0%) |
| Total | 1,679 (77.3%) | 493 (22.7%) |
Female Fertility in Willard
Fertility by Age in Willard
Average fertility rate in Willard is 77.0 births per 1,000 women. Women in the age bracket of 20 to 34 years have the highest fertility rate with 94.0 births per 1,000 women. Women in the age bracket of 35 to 50 years acount for 52.6% of all women with births.
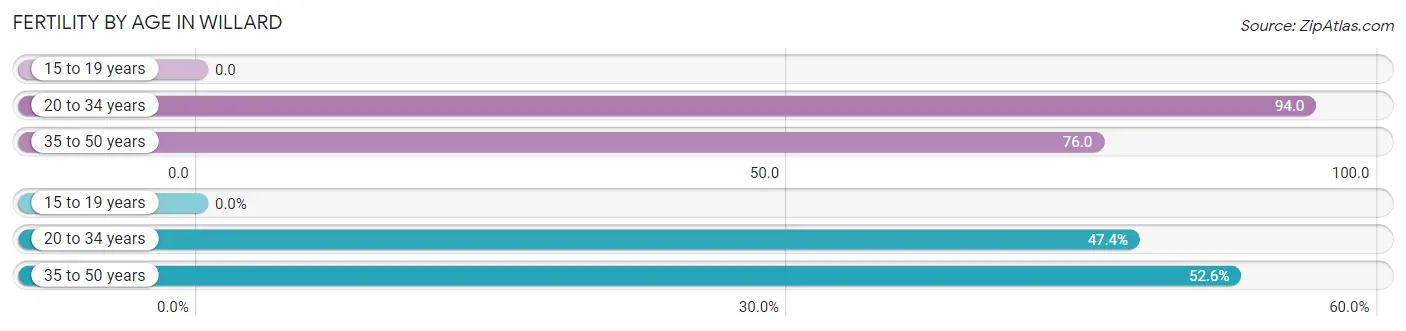
| Age Bracket | Women with Births | Births / 1,000 Women |
| 15 to 19 years | 0 (0.0%) | 0.0 |
| 20 to 34 years | 46 (47.4%) | 94.0 |
| 35 to 50 years | 51 (52.6%) | 76.0 |
| Total | 97 (100.0%) | 77.0 |
Fertility by Age by Marriage Status in Willard
47.4% of women with births (97) in Willard are married. The highest percentage of unmarried women with births falls into 35 to 50 years age bracket with 100.0% of them unmarried at the time of birth, while the lowest percentage of unmarried women with births belong to 20 to 34 years age bracket with 0.0% of them unmarried.
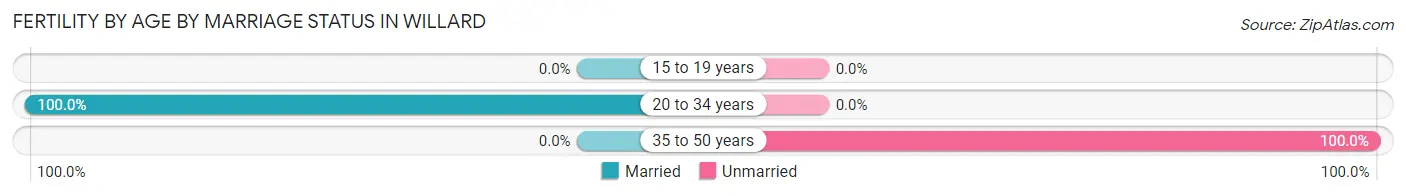
| Age Bracket | Married | Unmarried |
| 15 to 19 years | 0 (0.0%) | 0 (0.0%) |
| 20 to 34 years | 46 (100.0%) | 0 (0.0%) |
| 35 to 50 years | 0 (0.0%) | 51 (100.0%) |
| Total | 46 (47.4%) | 51 (52.6%) |
Fertility by Education in Willard
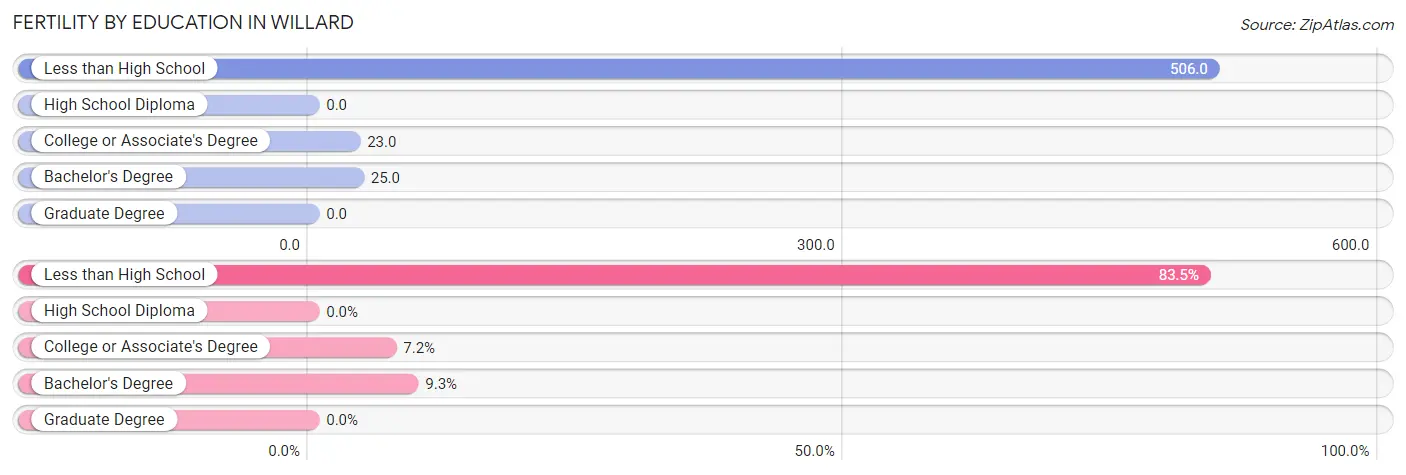
| Educational Attainment | Women with Births | Births / 1,000 Women |
| Less than High School | 81 (83.5%) | 506.0 |
| High School Diploma | 0 (0.0%) | 0.0 |
| College or Associate's Degree | 7 (7.2%) | 23.0 |
| Bachelor's Degree | 9 (9.3%) | 25.0 |
| Graduate Degree | 0 (0.0%) | 0.0 |
| Total | 97 (100.0%) | 77.0 |
Fertility by Education by Marriage Status in Willard
52.6% of women with births in Willard are unmarried. Women with the educational attainment of college or associate's degree are most likely to be married with 100.0% of them married at childbirth, while women with the educational attainment of less than high school are least likely to be married with 63.0% of them unmarried at childbirth.
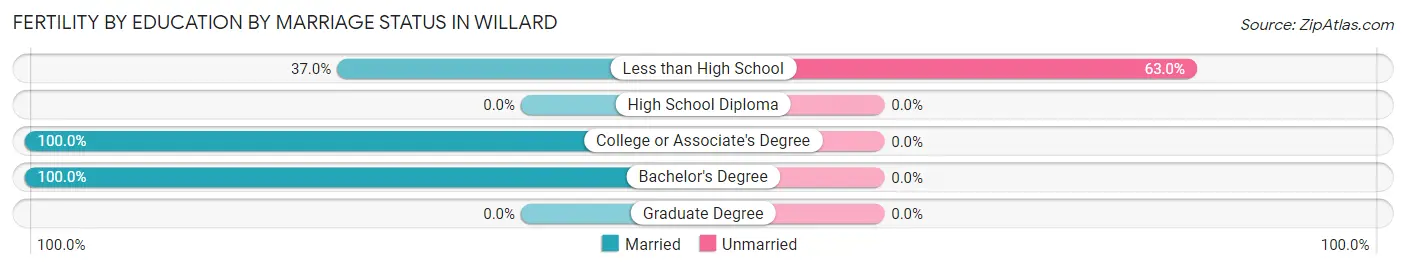
| Educational Attainment | Married | Unmarried |
| Less than High School | 30 (37.0%) | 51 (63.0%) |
| High School Diploma | 0 (0.0%) | 0 (0.0%) |
| College or Associate's Degree | 7 (100.0%) | 0 (0.0%) |
| Bachelor's Degree | 9 (100.0%) | 0 (0.0%) |
| Graduate Degree | 0 (0.0%) | 0 (0.0%) |
| Total | 46 (47.4%) | 51 (52.6%) |
Employment Characteristics in Willard
Employment by Class of Employer in Willard
Among the 2,859 employed individuals in Willard, private company employees (1,729 | 60.5%), local government employees (388 | 13.6%), and not-for-profit organizations (302 | 10.6%) make up the most common classes of employment.
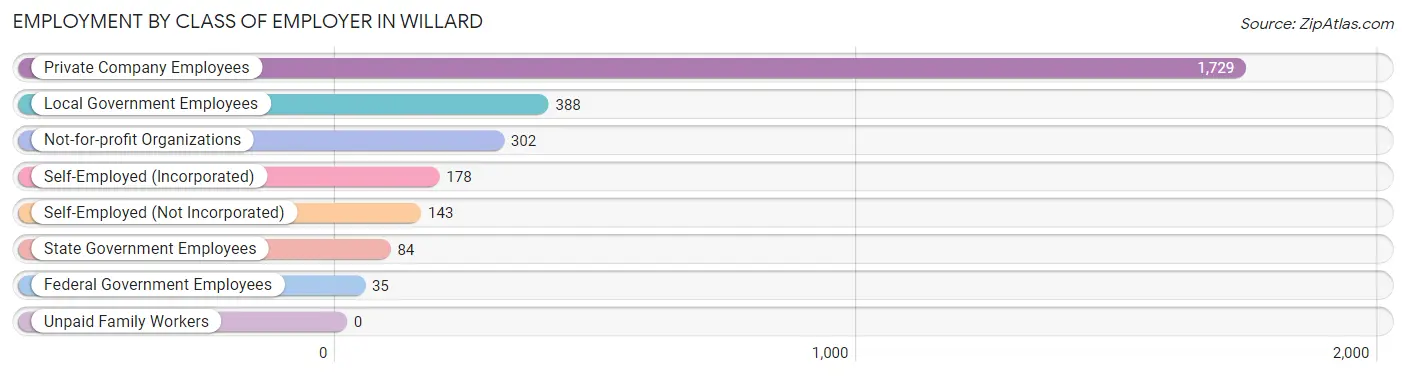
| Employer Class | # Employees | % Employees |
| Private Company Employees | 1,729 | 60.5% |
| Self-Employed (Incorporated) | 178 | 6.2% |
| Self-Employed (Not Incorporated) | 143 | 5.0% |
| Not-for-profit Organizations | 302 | 10.6% |
| Local Government Employees | 388 | 13.6% |
| State Government Employees | 84 | 2.9% |
| Federal Government Employees | 35 | 1.2% |
| Unpaid Family Workers | 0 | 0.0% |
| Total | 2,859 | 100.0% |
Employment Status by Age in Willard
According to the labor force statistics for Willard, out of the total population over 16 years of age (4,394), 68.2% or 2,997 individuals are in the labor force, with 2.9% or 87 of them unemployed. The age group with the highest labor force participation rate is 45 to 54 years, with 91.8% or 714 individuals in the labor force. Within the labor force, the 25 to 29 years age range has the highest percentage of unemployed individuals, with 33.7% or 87 of them being unemployed.
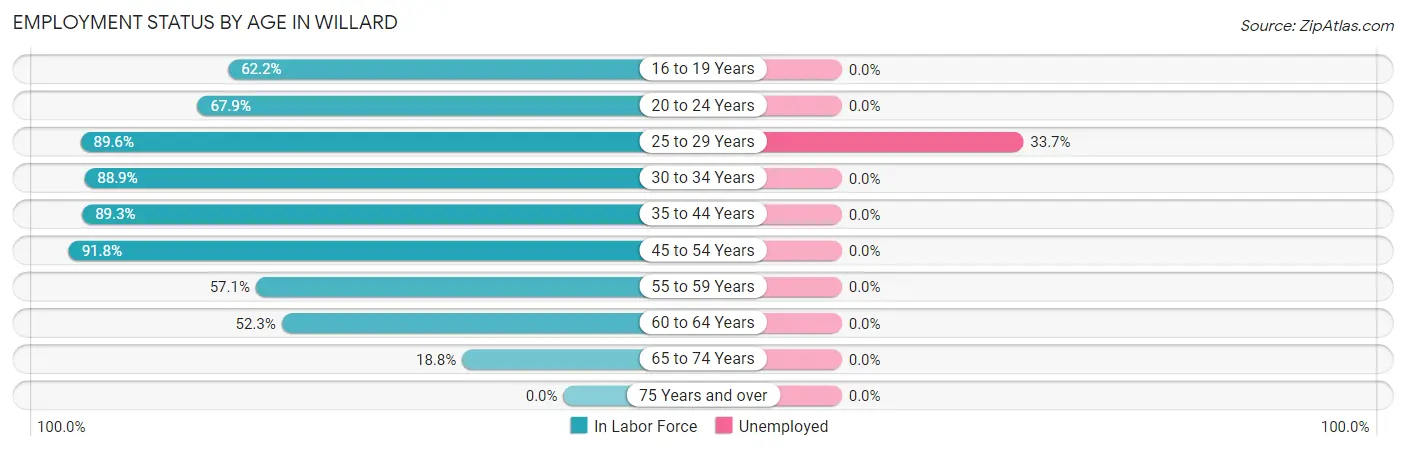
| Age Bracket | In Labor Force | Unemployed |
| 16 to 19 Years | 189 (62.2%) | 0 (0.0%) |
| 20 to 24 Years | 394 (67.9%) | 0 (0.0%) |
| 25 to 29 Years | 258 (89.6%) | 87 (33.7%) |
| 30 to 34 Years | 321 (88.9%) | 0 (0.0%) |
| 35 to 44 Years | 661 (89.3%) | 0 (0.0%) |
| 45 to 54 Years | 714 (91.8%) | 0 (0.0%) |
| 55 to 59 Years | 288 (57.1%) | 0 (0.0%) |
| 60 to 64 Years | 102 (52.3%) | 0 (0.0%) |
| 65 to 74 Years | 69 (18.8%) | 0 (0.0%) |
| 75 Years and over | 0 (0.0%) | 0 (0.0%) |
| Total | 2,997 (68.2%) | 87 (2.9%) |
Employment Status by Educational Attainment in Willard
According to labor force statistics for Willard, 81.8% of individuals (2,344) out of the total population between 25 and 64 years of age (2,866) are in the labor force, with 3.7% or 87 of them being unemployed. The group with the highest labor force participation rate are those with the educational attainment of college / associate degree, with 90.2% or 641 individuals in the labor force. Within the labor force, individuals with high school diploma education have the highest percentage of unemployment, with 13.2% or 87 of them being unemployed.
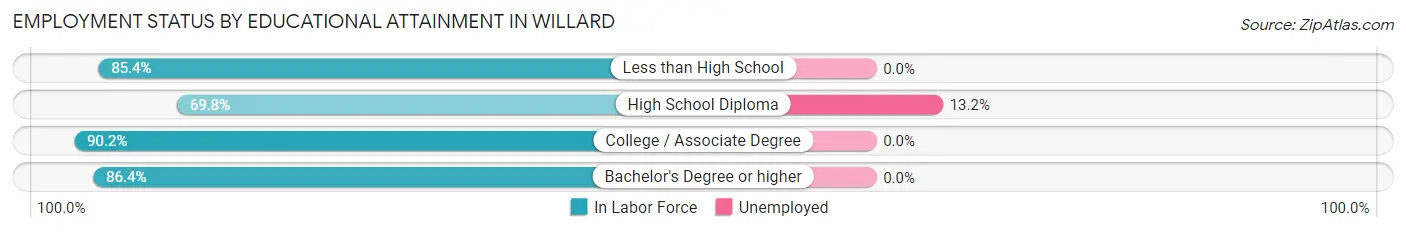
| Educational Attainment | In Labor Force | Unemployed |
| Less than High School | 176 (85.4%) | 0 (0.0%) |
| High School Diploma | 660 (69.8%) | 125 (13.2%) |
| College / Associate Degree | 641 (90.2%) | 0 (0.0%) |
| Bachelor's Degree or higher | 867 (86.4%) | 0 (0.0%) |
| Total | 2,344 (81.8%) | 106 (3.7%) |
Employment Occupations by Sex in Willard
Management, Business, Science and Arts Occupations
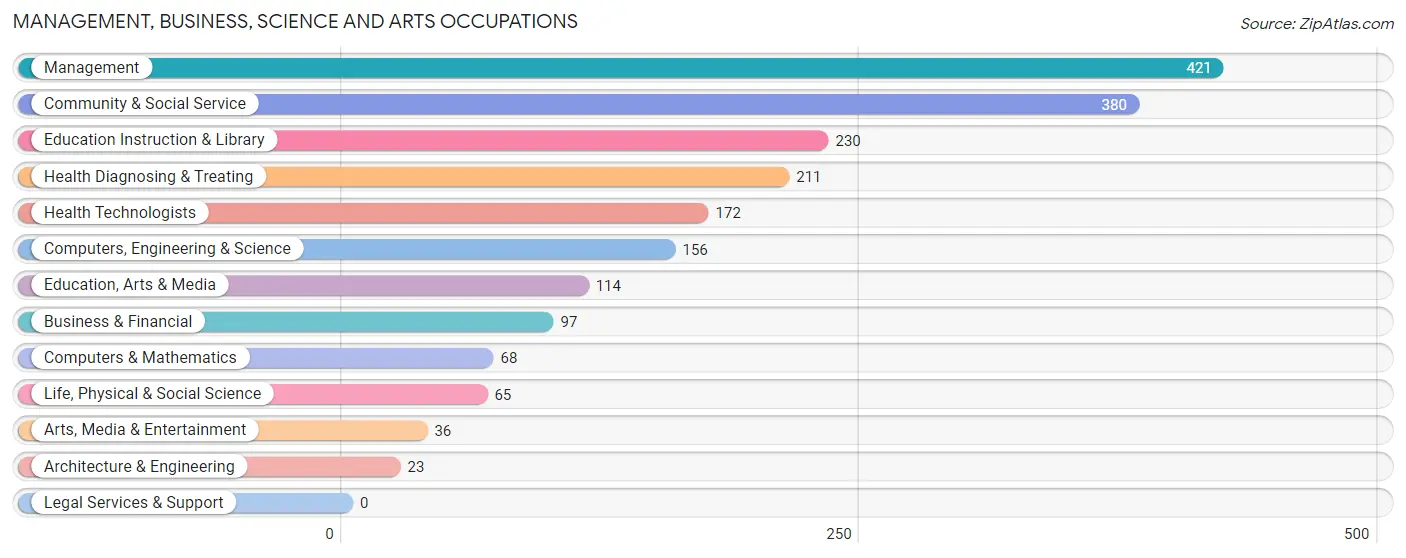
The most common Management, Business, Science and Arts occupations in Willard are Management (421 | 14.5%), Community & Social Service (380 | 13.1%), Education Instruction & Library (230 | 7.9%), Health Diagnosing & Treating (211 | 7.2%), and Health Technologists (172 | 5.9%).
Management, Business, Science and Arts Occupations by Sex
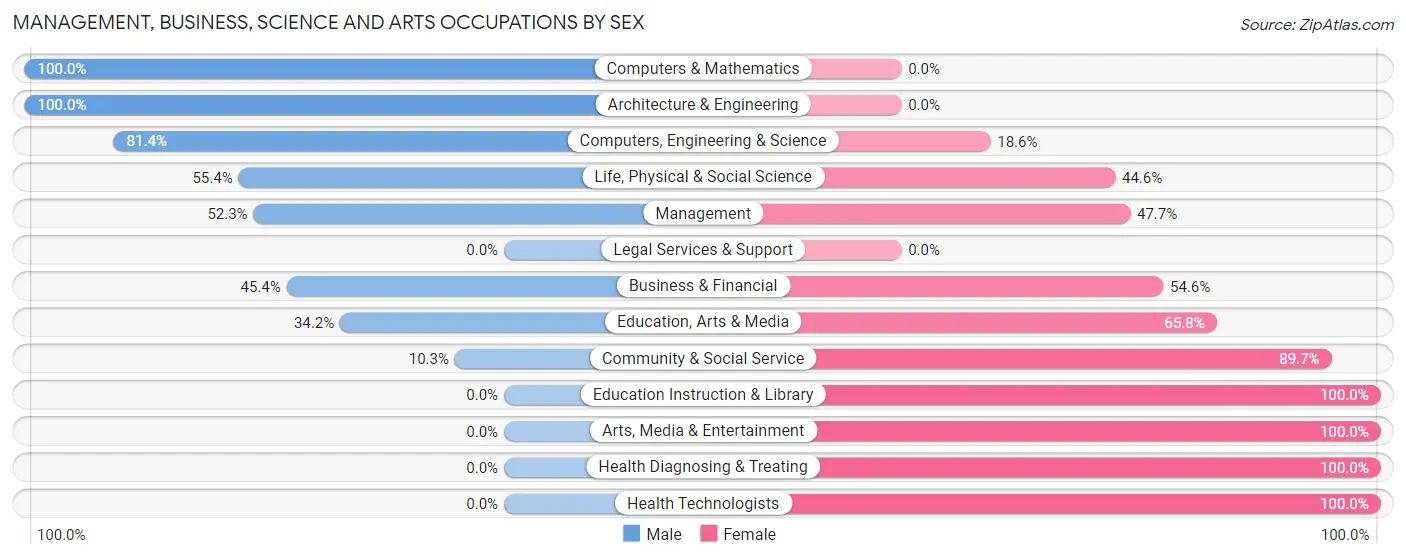
Within the Management, Business, Science and Arts occupations in Willard, the most male-oriented occupations are Computers & Mathematics (100.0%), Architecture & Engineering (100.0%), and Computers, Engineering & Science (81.4%), while the most female-oriented occupations are Education Instruction & Library (100.0%), Arts, Media & Entertainment (100.0%), and Health Diagnosing & Treating (100.0%).
| Occupation | Male | Female |
| Management | 220 (52.3%) | 201 (47.7%) |
| Business & Financial | 44 (45.4%) | 53 (54.6%) |
| Computers, Engineering & Science | 127 (81.4%) | 29 (18.6%) |
| Computers & Mathematics | 68 (100.0%) | 0 (0.0%) |
| Architecture & Engineering | 23 (100.0%) | 0 (0.0%) |
| Life, Physical & Social Science | 36 (55.4%) | 29 (44.6%) |
| Community & Social Service | 39 (10.3%) | 341 (89.7%) |
| Education, Arts & Media | 39 (34.2%) | 75 (65.8%) |
| Legal Services & Support | 0 (0.0%) | 0 (0.0%) |
| Education Instruction & Library | 0 (0.0%) | 230 (100.0%) |
| Arts, Media & Entertainment | 0 (0.0%) | 36 (100.0%) |
| Health Diagnosing & Treating | 0 (0.0%) | 211 (100.0%) |
| Health Technologists | 0 (0.0%) | 172 (100.0%) |
| Total (Category) | 430 (34.0%) | 835 (66.0%) |
| Total (Overall) | 1,571 (54.0%) | 1,338 (46.0%) |
Services Occupations
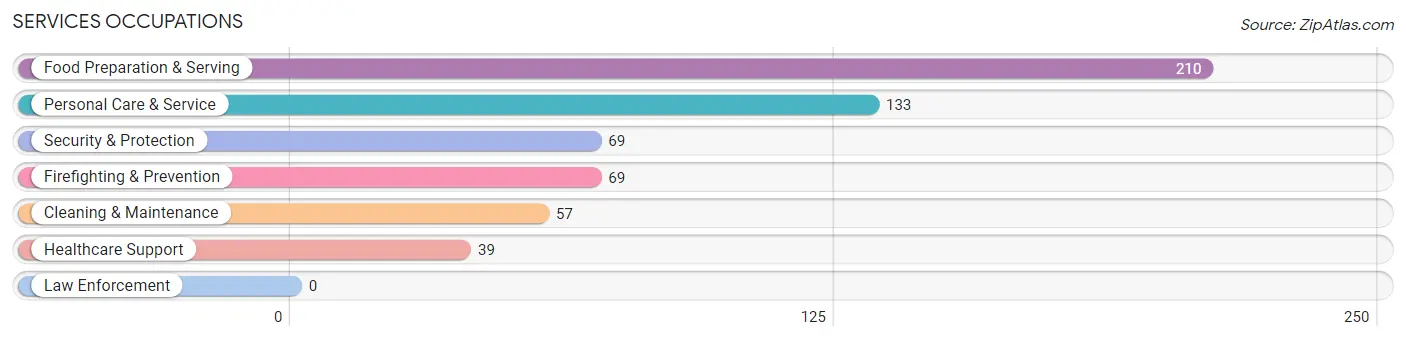
The most common Services occupations in Willard are Food Preparation & Serving (210 | 7.2%), Personal Care & Service (133 | 4.6%), Security & Protection (69 | 2.4%), Firefighting & Prevention (69 | 2.4%), and Cleaning & Maintenance (57 | 2.0%).
Services Occupations by Sex
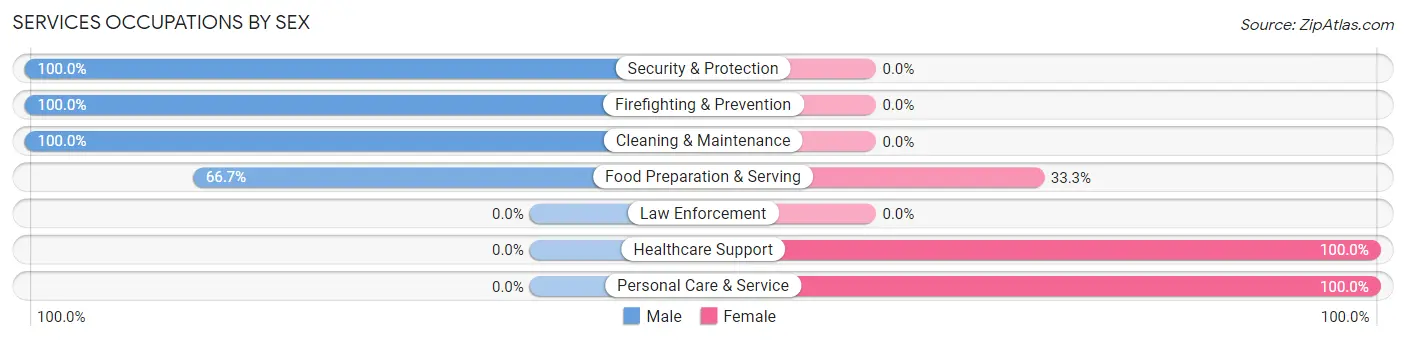
Within the Services occupations in Willard, the most male-oriented occupations are Security & Protection (100.0%), Firefighting & Prevention (100.0%), and Cleaning & Maintenance (100.0%), while the most female-oriented occupations are Healthcare Support (100.0%), Personal Care & Service (100.0%), and Food Preparation & Serving (33.3%).
| Occupation | Male | Female |
| Healthcare Support | 0 (0.0%) | 39 (100.0%) |
| Security & Protection | 69 (100.0%) | 0 (0.0%) |
| Firefighting & Prevention | 69 (100.0%) | 0 (0.0%) |
| Law Enforcement | 0 (0.0%) | 0 (0.0%) |
| Food Preparation & Serving | 140 (66.7%) | 70 (33.3%) |
| Cleaning & Maintenance | 57 (100.0%) | 0 (0.0%) |
| Personal Care & Service | 0 (0.0%) | 133 (100.0%) |
| Total (Category) | 266 (52.4%) | 242 (47.6%) |
| Total (Overall) | 1,571 (54.0%) | 1,338 (46.0%) |
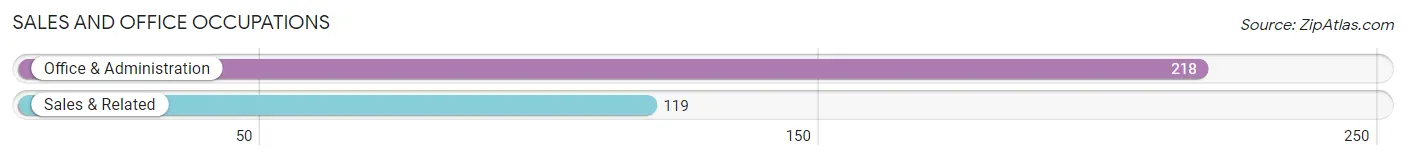
Sales and Office Occupations
The most common Sales and Office occupations in Willard are Office & Administration (218 | 7.5%), and Sales & Related (119 | 4.1%).
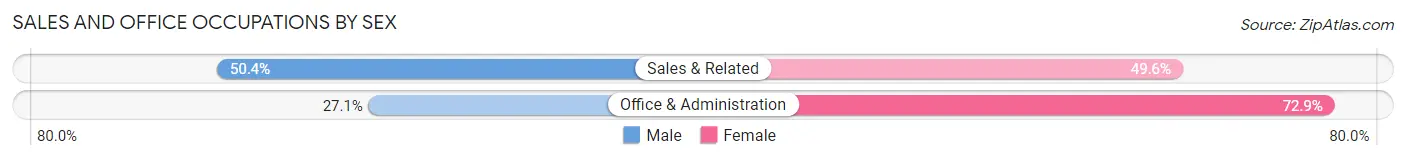
Sales and Office Occupations by Sex
| Occupation | Male | Female |
| Sales & Related | 60 (50.4%) | 59 (49.6%) |
| Office & Administration | 59 (27.1%) | 159 (72.9%) |
| Total (Category) | 119 (35.3%) | 218 (64.7%) |
| Total (Overall) | 1,571 (54.0%) | 1,338 (46.0%) |
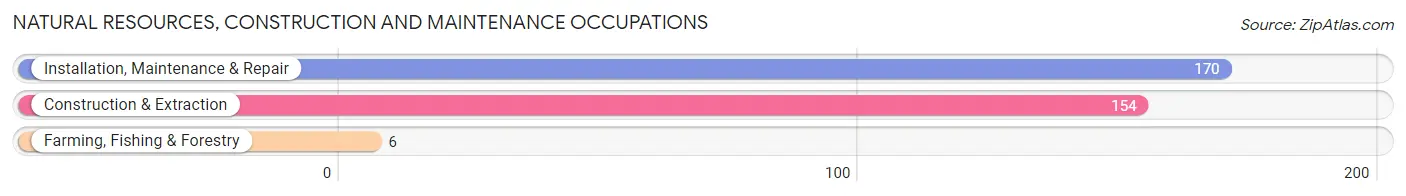
Natural Resources, Construction and Maintenance Occupations
The most common Natural Resources, Construction and Maintenance occupations in Willard are Installation, Maintenance & Repair (170 | 5.8%), Construction & Extraction (154 | 5.3%), and Farming, Fishing & Forestry (6 | 0.2%).
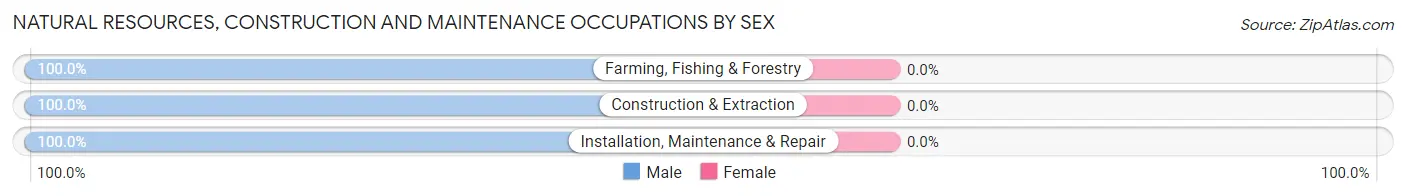
Natural Resources, Construction and Maintenance Occupations by Sex
| Occupation | Male | Female |
| Farming, Fishing & Forestry | 6 (100.0%) | 0 (0.0%) |
| Construction & Extraction | 154 (100.0%) | 0 (0.0%) |
| Installation, Maintenance & Repair | 170 (100.0%) | 0 (0.0%) |
| Total (Category) | 330 (100.0%) | 0 (0.0%) |
| Total (Overall) | 1,571 (54.0%) | 1,338 (46.0%) |
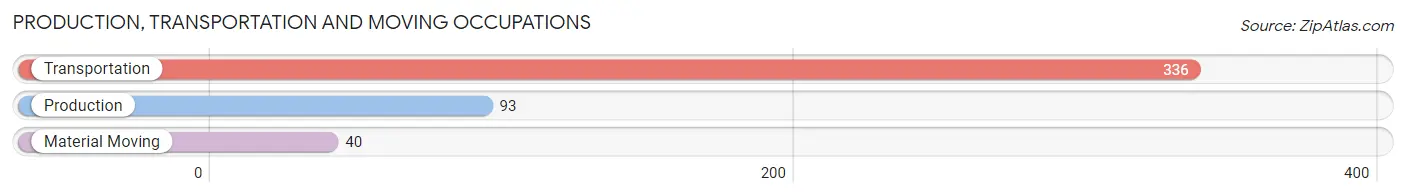
Production, Transportation and Moving Occupations
The most common Production, Transportation and Moving occupations in Willard are Transportation (336 | 11.6%), Production (93 | 3.2%), and Material Moving (40 | 1.4%).
Production, Transportation and Moving Occupations by Sex
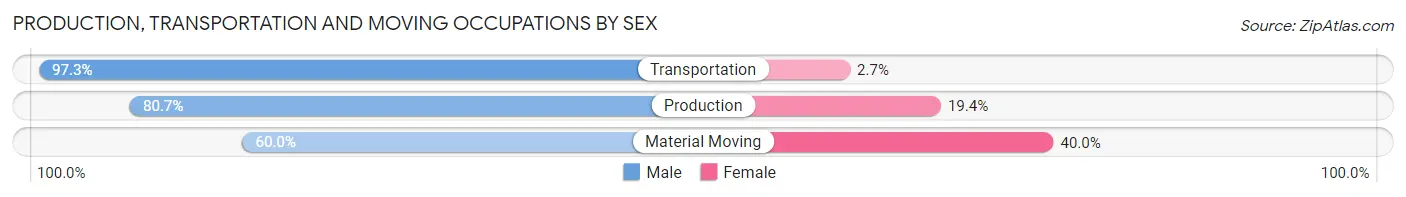
| Occupation | Male | Female |
| Production | 75 (80.6%) | 18 (19.4%) |
| Transportation | 327 (97.3%) | 9 (2.7%) |
| Material Moving | 24 (60.0%) | 16 (40.0%) |
| Total (Category) | 426 (90.8%) | 43 (9.2%) |
| Total (Overall) | 1,571 (54.0%) | 1,338 (46.0%) |
Employment Industries by Sex in Willard
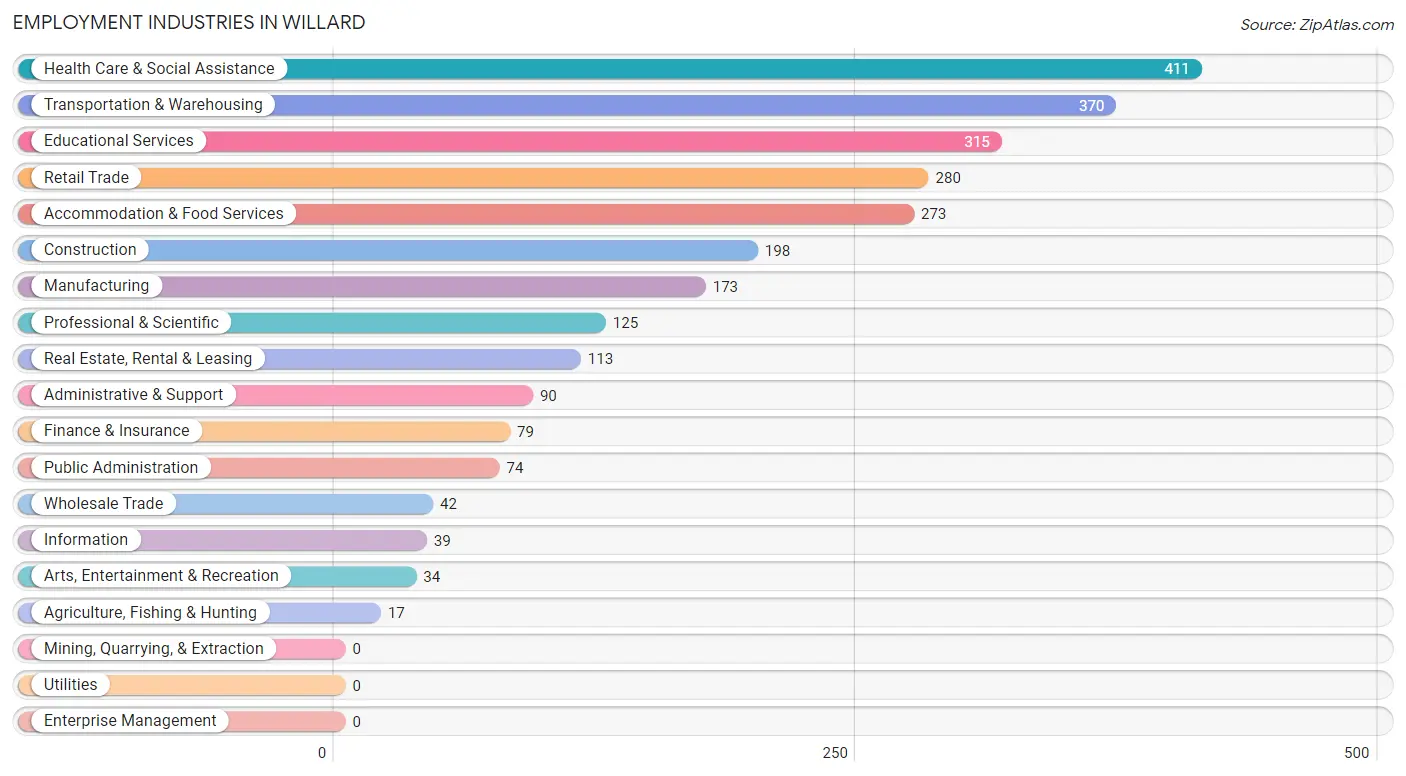
Employment Industries in Willard
The major employment industries in Willard include Health Care & Social Assistance (411 | 14.1%), Transportation & Warehousing (370 | 12.7%), Educational Services (315 | 10.8%), Retail Trade (280 | 9.6%), and Accommodation & Food Services (273 | 9.4%).
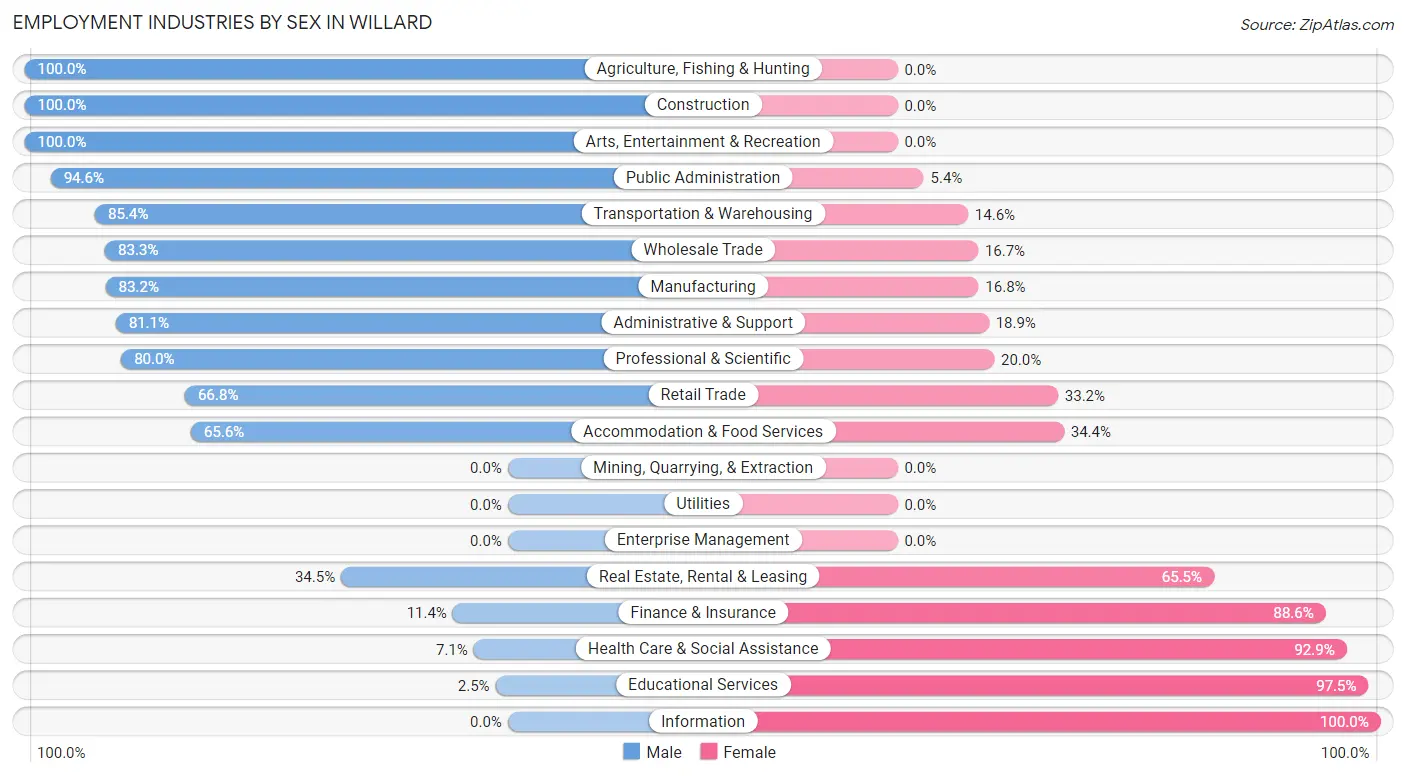
Employment Industries by Sex in Willard
The Willard industries that see more men than women are Agriculture, Fishing & Hunting (100.0%), Construction (100.0%), and Arts, Entertainment & Recreation (100.0%), whereas the industries that tend to have a higher number of women are Information (100.0%), Educational Services (97.5%), and Health Care & Social Assistance (92.9%).
| Industry | Male | Female |
| Agriculture, Fishing & Hunting | 17 (100.0%) | 0 (0.0%) |
| Mining, Quarrying, & Extraction | 0 (0.0%) | 0 (0.0%) |
| Construction | 198 (100.0%) | 0 (0.0%) |
| Manufacturing | 144 (83.2%) | 29 (16.8%) |
| Wholesale Trade | 35 (83.3%) | 7 (16.7%) |
| Retail Trade | 187 (66.8%) | 93 (33.2%) |
| Transportation & Warehousing | 316 (85.4%) | 54 (14.6%) |
| Utilities | 0 (0.0%) | 0 (0.0%) |
| Information | 0 (0.0%) | 39 (100.0%) |
| Finance & Insurance | 9 (11.4%) | 70 (88.6%) |
| Real Estate, Rental & Leasing | 39 (34.5%) | 74 (65.5%) |
| Professional & Scientific | 100 (80.0%) | 25 (20.0%) |
| Enterprise Management | 0 (0.0%) | 0 (0.0%) |
| Administrative & Support | 73 (81.1%) | 17 (18.9%) |
| Educational Services | 8 (2.5%) | 307 (97.5%) |
| Health Care & Social Assistance | 29 (7.1%) | 382 (92.9%) |
| Arts, Entertainment & Recreation | 34 (100.0%) | 0 (0.0%) |
| Accommodation & Food Services | 179 (65.6%) | 94 (34.4%) |
| Public Administration | 70 (94.6%) | 4 (5.4%) |
| Total | 1,571 (54.0%) | 1,338 (46.0%) |
Education in Willard
School Enrollment in Willard
The most common levels of schooling among the 1,926 students in Willard are middle school (817 | 42.4%), elementary school (438 | 22.7%), and high school (386 | 20.0%).
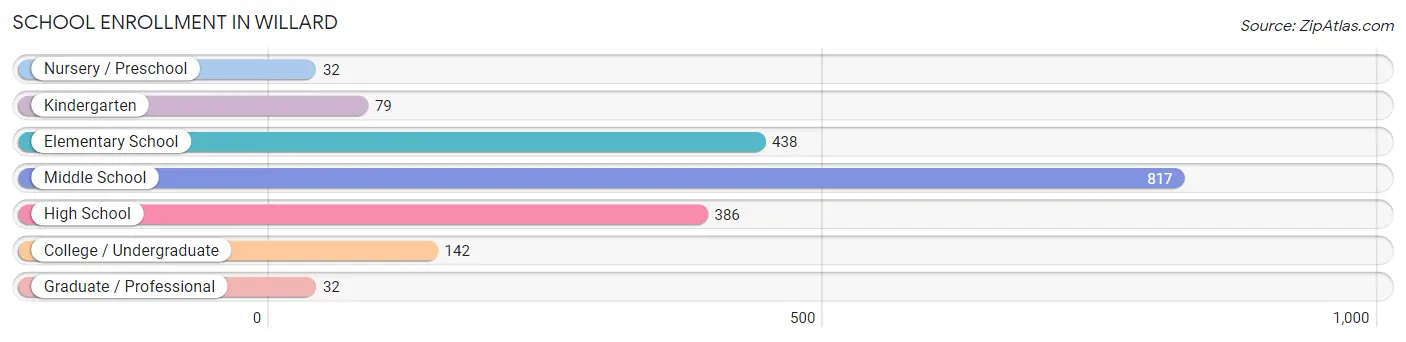
| School Level | # Students | % Students |
| Nursery / Preschool | 32 | 1.7% |
| Kindergarten | 79 | 4.1% |
| Elementary School | 438 | 22.7% |
| Middle School | 817 | 42.4% |
| High School | 386 | 20.0% |
| College / Undergraduate | 142 | 7.4% |
| Graduate / Professional | 32 | 1.7% |
| Total | 1,926 | 100.0% |
School Enrollment by Age by Funding Source in Willard
Out of a total of 1,926 students who are enrolled in schools in Willard, 164 (8.5%) attend a private institution, while the remaining 1,762 (91.5%) are enrolled in public schools. The age group of 3 to 4 year olds has the highest likelihood of being enrolled in private schools, with 22 (91.7% in the age bracket) enrolled. Conversely, the age group of 10 to 14 year olds has the lowest likelihood of being enrolled in a private school, with 905 (100.0% in the age bracket) attending a public institution.
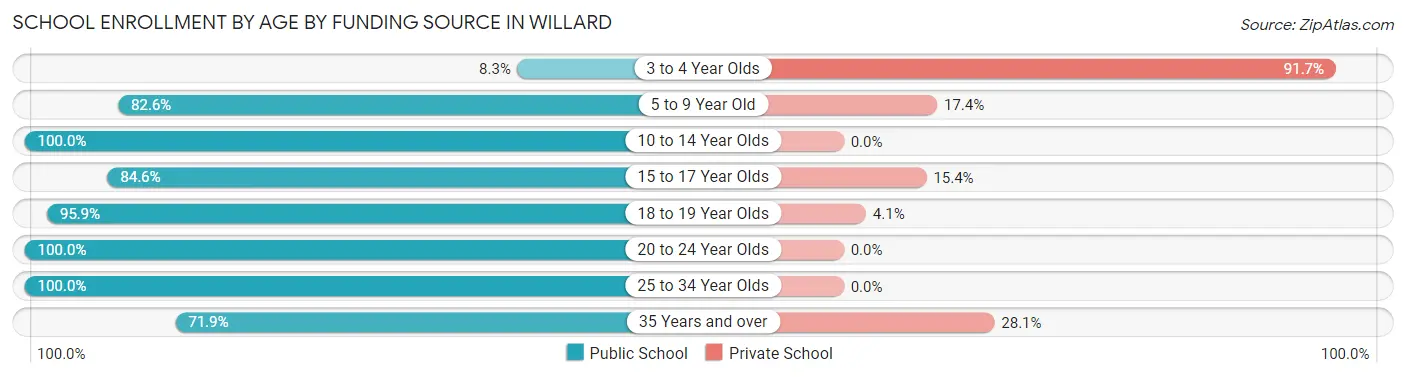
| Age Bracket | Public School | Private School |
| 3 to 4 Year Olds | 2 (8.3%) | 22 (91.7%) |
| 5 to 9 Year Old | 399 (82.6%) | 84 (17.4%) |
| 10 to 14 Year Olds | 905 (100.0%) | 0 (0.0%) |
| 15 to 17 Year Olds | 192 (84.6%) | 35 (15.4%) |
| 18 to 19 Year Olds | 139 (95.9%) | 6 (4.1%) |
| 20 to 24 Year Olds | 77 (100.0%) | 0 (0.0%) |
| 25 to 34 Year Olds | 8 (100.0%) | 0 (0.0%) |
| 35 Years and over | 41 (71.9%) | 16 (28.1%) |
| Total | 1,762 (91.5%) | 164 (8.5%) |
Educational Attainment by Field of Study in Willard
Business (227 | 19.4%), science & technology (198 | 16.9%), bio, nature & agricultural (175 | 15.0%), arts & humanities (113 | 9.7%), and liberal arts & history (102 | 8.7%) are the most common fields of study among 1,169 individuals in Willard who have obtained a bachelor's degree or higher.
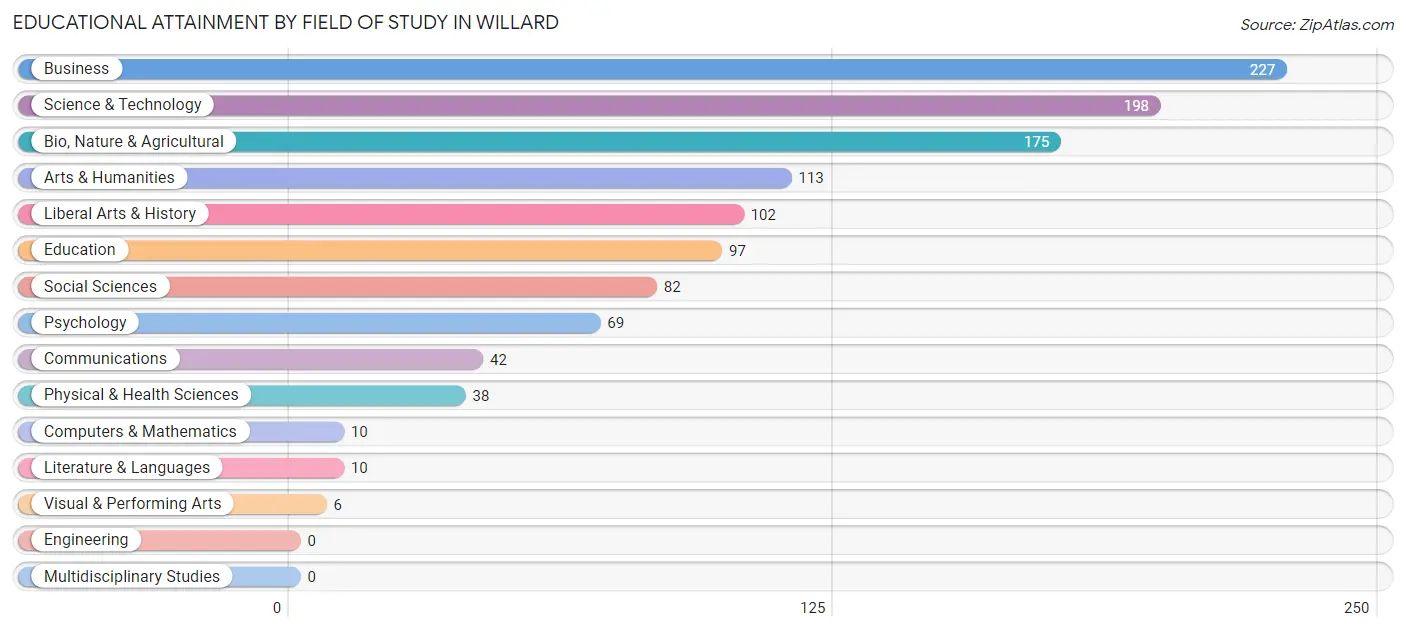
| Field of Study | # Graduates | % Graduates |
| Computers & Mathematics | 10 | 0.9% |
| Bio, Nature & Agricultural | 175 | 15.0% |
| Physical & Health Sciences | 38 | 3.3% |
| Psychology | 69 | 5.9% |
| Social Sciences | 82 | 7.0% |
| Engineering | 0 | 0.0% |
| Multidisciplinary Studies | 0 | 0.0% |
| Science & Technology | 198 | 16.9% |
| Business | 227 | 19.4% |
| Education | 97 | 8.3% |
| Literature & Languages | 10 | 0.9% |
| Liberal Arts & History | 102 | 8.7% |
| Visual & Performing Arts | 6 | 0.5% |
| Communications | 42 | 3.6% |
| Arts & Humanities | 113 | 9.7% |
| Total | 1,169 | 100.0% |
Transportation & Commute in Willard
Vehicle Availability by Sex in Willard
The most prevalent vehicle ownership categories in Willard are males with 2 vehicles (822, accounting for 54.0%) and females with 2 vehicles (460, making up 61.6%).
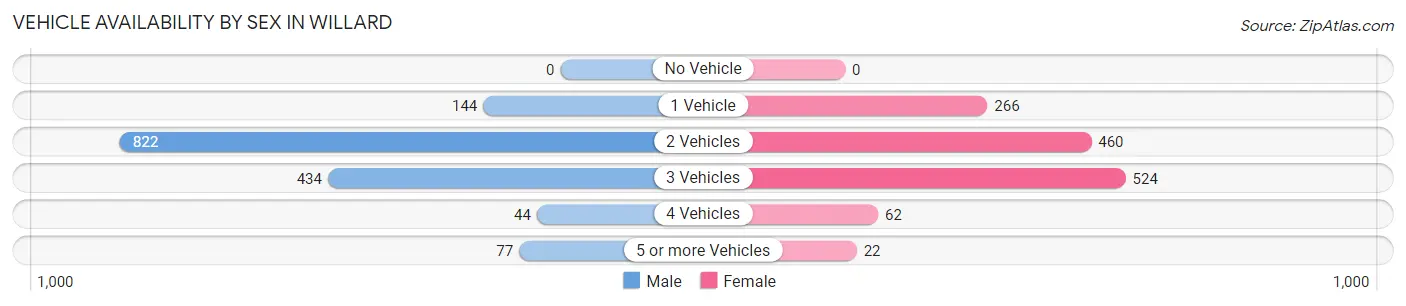
| Vehicles Available | Male | Female |
| No Vehicle | 0 (0.0%) | 0 (0.0%) |
| 1 Vehicle | 144 (9.5%) | 266 (19.9%) |
| 2 Vehicles | 822 (54.0%) | 460 (34.5%) |
| 3 Vehicles | 434 (28.5%) | 524 (39.3%) |
| 4 Vehicles | 44 (2.9%) | 62 (4.6%) |
| 5 or more Vehicles | 77 (5.1%) | 22 (1.7%) |
| Total | 1,521 (100.0%) | 1,334 (100.0%) |
Commute Time in Willard
The most frequently occuring commute durations in Willard are 30 to 34 minutes (544 commuters, 22.1%), 20 to 24 minutes (524 commuters, 21.3%), and 25 to 29 minutes (488 commuters, 19.8%).
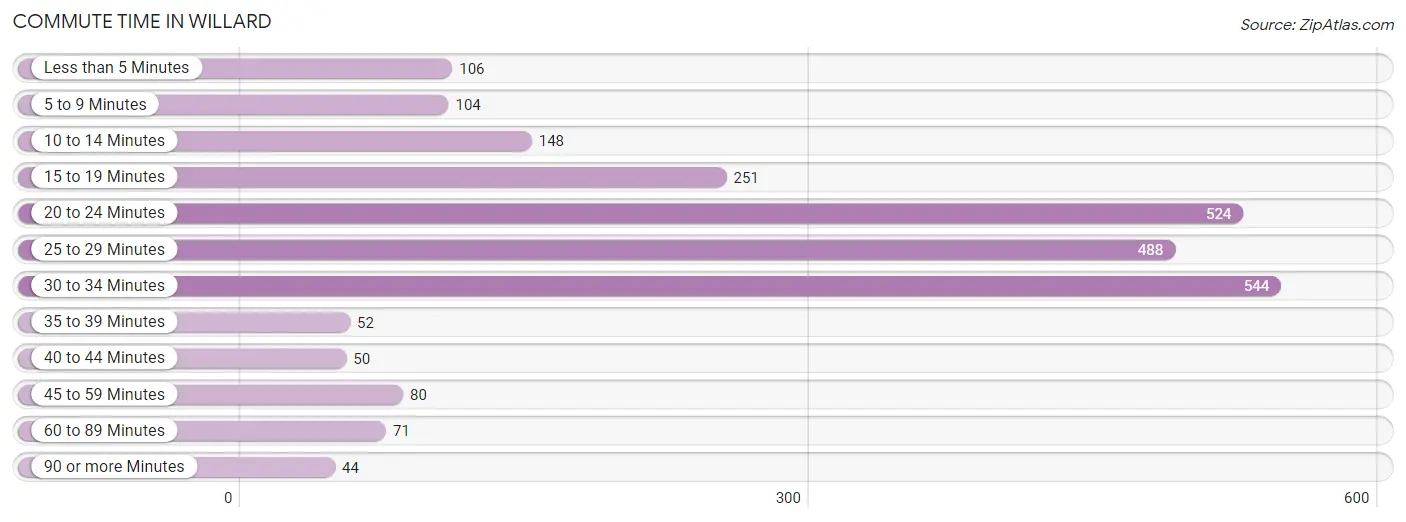
| Commute Time | # Commuters | % Commuters |
| Less than 5 Minutes | 106 | 4.3% |
| 5 to 9 Minutes | 104 | 4.2% |
| 10 to 14 Minutes | 148 | 6.0% |
| 15 to 19 Minutes | 251 | 10.2% |
| 20 to 24 Minutes | 524 | 21.3% |
| 25 to 29 Minutes | 488 | 19.8% |
| 30 to 34 Minutes | 544 | 22.1% |
| 35 to 39 Minutes | 52 | 2.1% |
| 40 to 44 Minutes | 50 | 2.0% |
| 45 to 59 Minutes | 80 | 3.3% |
| 60 to 89 Minutes | 71 | 2.9% |
| 90 or more Minutes | 44 | 1.8% |
Commute Time by Sex in Willard
The most common commute times in Willard are 25 to 29 minutes (400 commuters, 27.2%) for males and 30 to 34 minutes (261 commuters, 26.4%) for females.
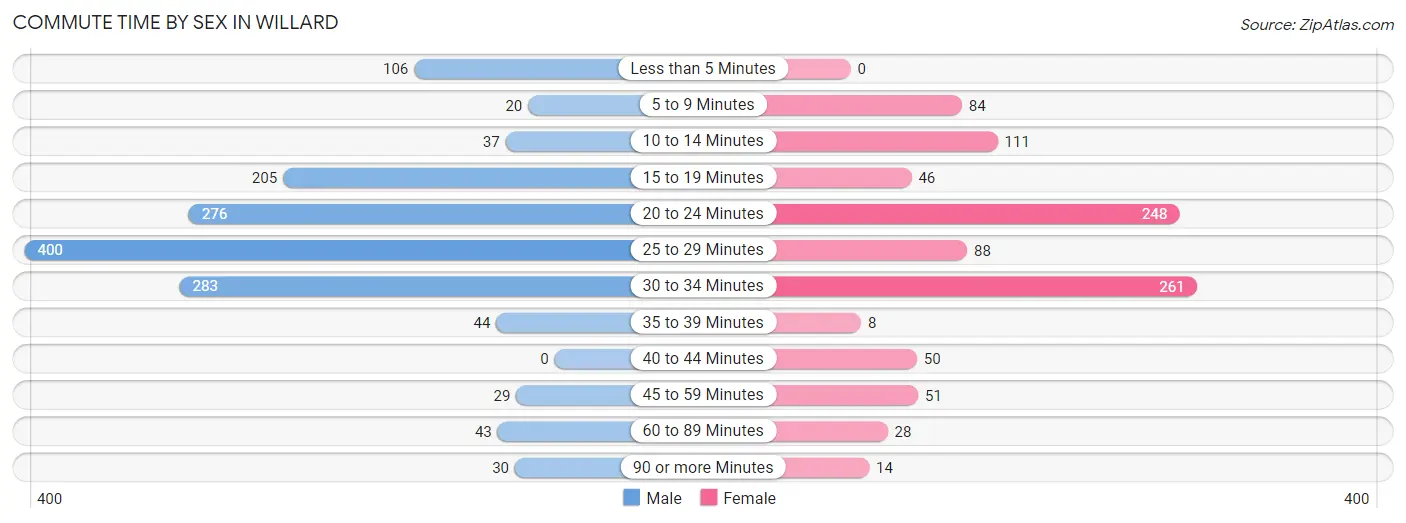
| Commute Time | Male | Female |
| Less than 5 Minutes | 106 (7.2%) | 0 (0.0%) |
| 5 to 9 Minutes | 20 (1.4%) | 84 (8.5%) |
| 10 to 14 Minutes | 37 (2.5%) | 111 (11.2%) |
| 15 to 19 Minutes | 205 (13.9%) | 46 (4.6%) |
| 20 to 24 Minutes | 276 (18.7%) | 248 (25.1%) |
| 25 to 29 Minutes | 400 (27.2%) | 88 (8.9%) |
| 30 to 34 Minutes | 283 (19.2%) | 261 (26.4%) |
| 35 to 39 Minutes | 44 (3.0%) | 8 (0.8%) |
| 40 to 44 Minutes | 0 (0.0%) | 50 (5.1%) |
| 45 to 59 Minutes | 29 (2.0%) | 51 (5.2%) |
| 60 to 89 Minutes | 43 (2.9%) | 28 (2.8%) |
| 90 or more Minutes | 30 (2.0%) | 14 (1.4%) |
Time of Departure to Work by Sex in Willard
The most frequent times of departure to work in Willard are 7:00 AM to 7:29 AM (384, 26.1%) for males and 7:00 AM to 7:29 AM (198, 20.0%) for females.
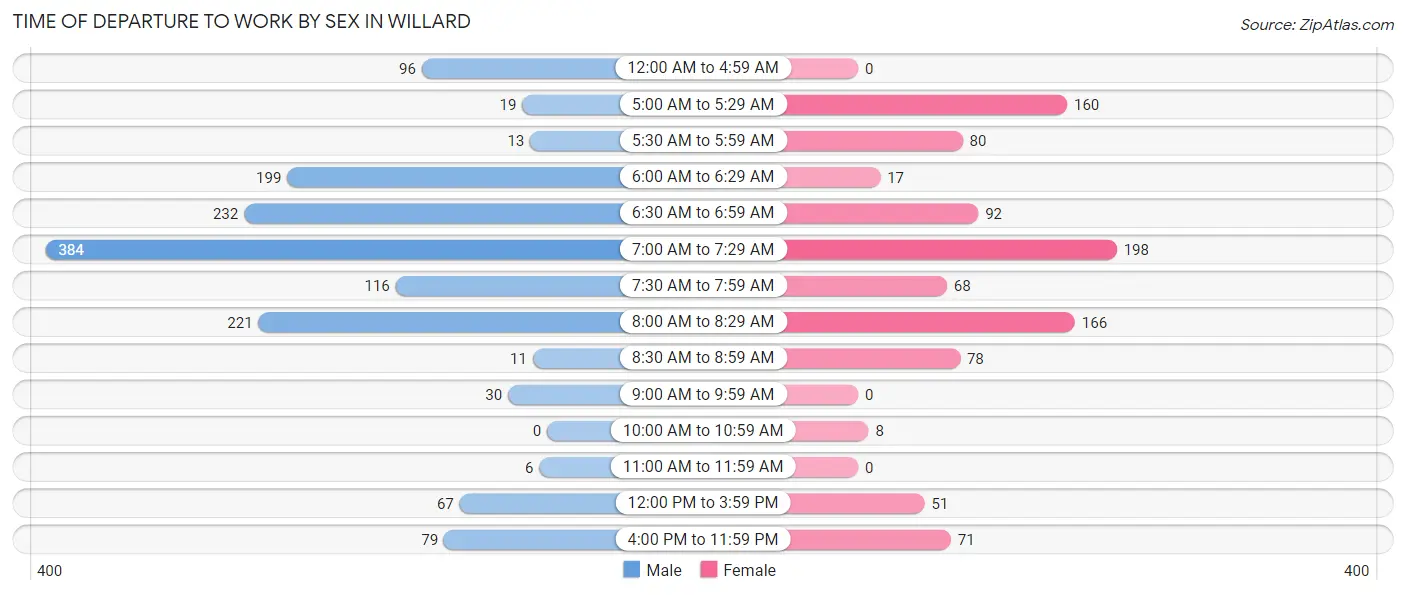
| Time of Departure | Male | Female |
| 12:00 AM to 4:59 AM | 96 (6.5%) | 0 (0.0%) |
| 5:00 AM to 5:29 AM | 19 (1.3%) | 160 (16.2%) |
| 5:30 AM to 5:59 AM | 13 (0.9%) | 80 (8.1%) |
| 6:00 AM to 6:29 AM | 199 (13.5%) | 17 (1.7%) |
| 6:30 AM to 6:59 AM | 232 (15.8%) | 92 (9.3%) |
| 7:00 AM to 7:29 AM | 384 (26.1%) | 198 (20.0%) |
| 7:30 AM to 7:59 AM | 116 (7.9%) | 68 (6.9%) |
| 8:00 AM to 8:29 AM | 221 (15.0%) | 166 (16.8%) |
| 8:30 AM to 8:59 AM | 11 (0.7%) | 78 (7.9%) |
| 9:00 AM to 9:59 AM | 30 (2.0%) | 0 (0.0%) |
| 10:00 AM to 10:59 AM | 0 (0.0%) | 8 (0.8%) |
| 11:00 AM to 11:59 AM | 6 (0.4%) | 0 (0.0%) |
| 12:00 PM to 3:59 PM | 67 (4.5%) | 51 (5.2%) |
| 4:00 PM to 11:59 PM | 79 (5.4%) | 71 (7.2%) |
| Total | 1,473 (100.0%) | 989 (100.0%) |
Housing Occupancy in Willard
Occupancy by Ownership in Willard
Of the total 2,172 dwellings in Willard, owner-occupied units account for 1,515 (69.8%), while renter-occupied units make up 657 (30.2%).
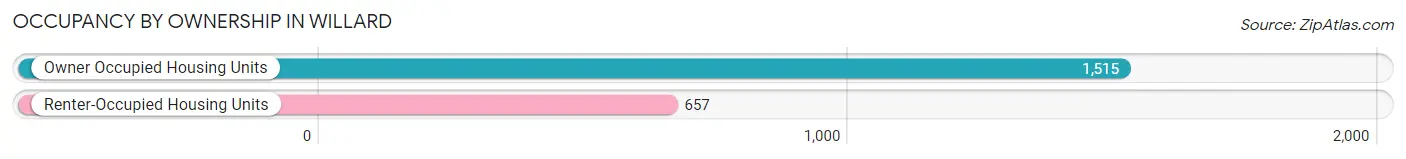
| Occupancy | # Housing Units | % Housing Units |
| Owner Occupied Housing Units | 1,515 | 69.8% |
| Renter-Occupied Housing Units | 657 | 30.2% |
| Total Occupied Housing Units | 2,172 | 100.0% |
Occupancy by Household Size in Willard
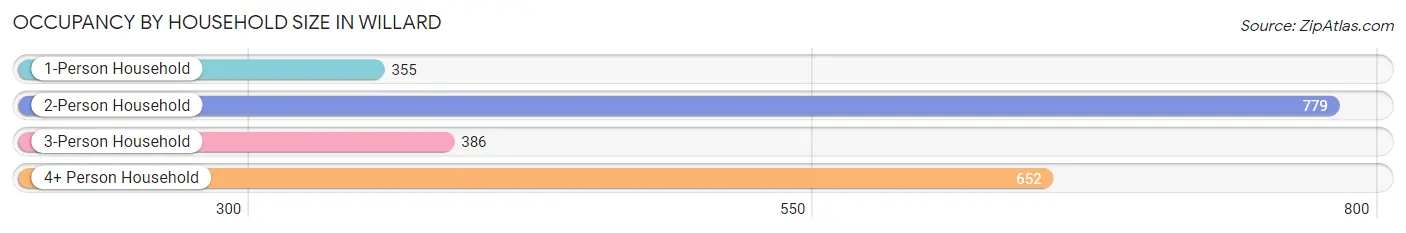
| Household Size | # Housing Units | % Housing Units |
| 1-Person Household | 355 | 16.3% |
| 2-Person Household | 779 | 35.9% |
| 3-Person Household | 386 | 17.8% |
| 4+ Person Household | 652 | 30.0% |
| Total Housing Units | 2,172 | 100.0% |
Occupancy by Ownership by Household Size in Willard
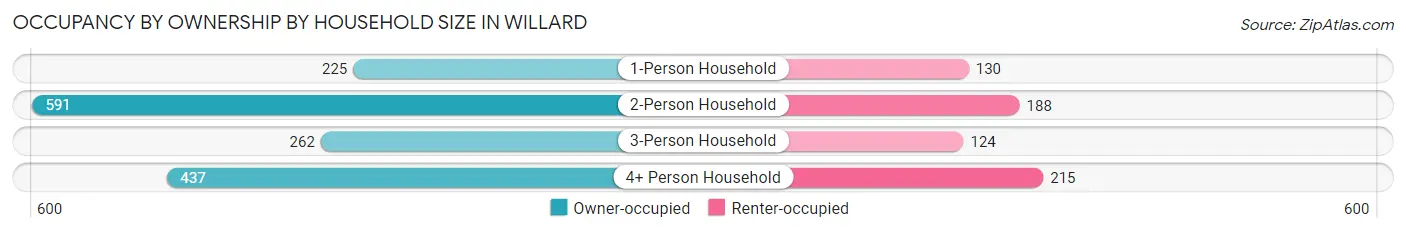
| Household Size | Owner-occupied | Renter-occupied |
| 1-Person Household | 225 (63.4%) | 130 (36.6%) |
| 2-Person Household | 591 (75.9%) | 188 (24.1%) |
| 3-Person Household | 262 (67.9%) | 124 (32.1%) |
| 4+ Person Household | 437 (67.0%) | 215 (33.0%) |
| Total Housing Units | 1,515 (69.8%) | 657 (30.2%) |
Occupancy by Educational Attainment in Willard
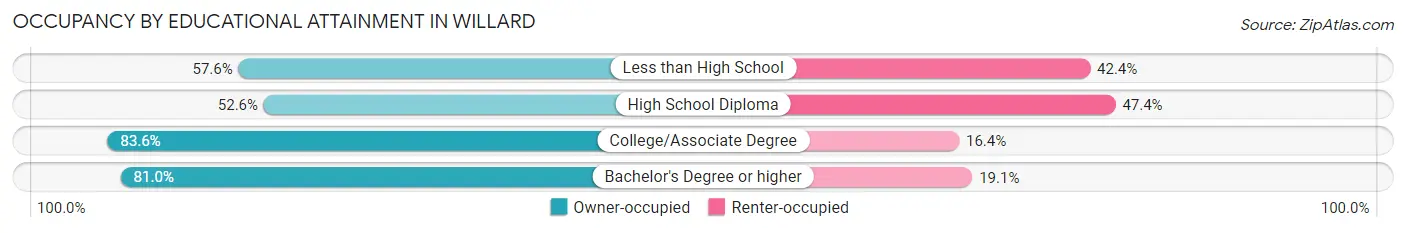
| Household Size | Owner-occupied | Renter-occupied |
| Less than High School | 95 (57.6%) | 70 (42.4%) |
| High School Diploma | 410 (52.6%) | 370 (47.4%) |
| College/Associate Degree | 534 (83.6%) | 105 (16.4%) |
| Bachelor's Degree or higher | 476 (80.9%) | 112 (19.1%) |
Occupancy by Age of Householder in Willard
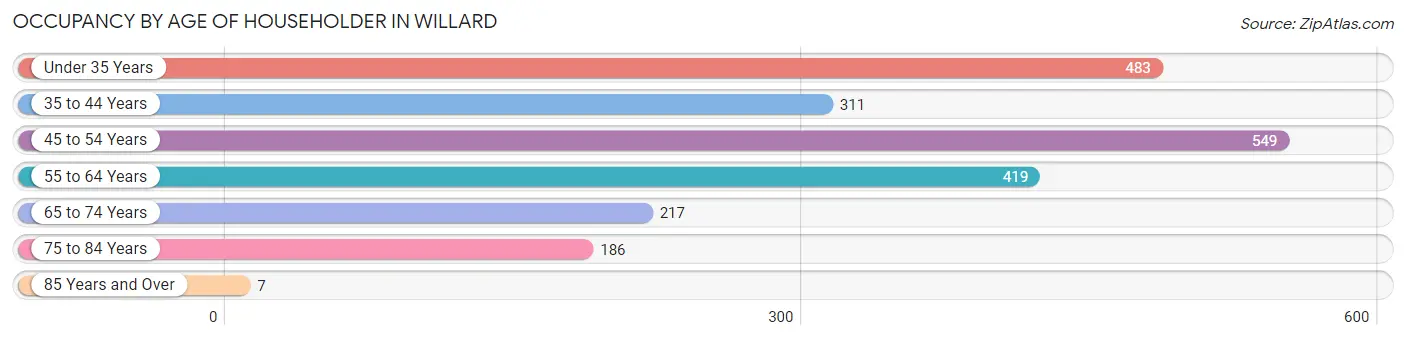
| Age Bracket | # Households | % Households |
| Under 35 Years | 483 | 22.2% |
| 35 to 44 Years | 311 | 14.3% |
| 45 to 54 Years | 549 | 25.3% |
| 55 to 64 Years | 419 | 19.3% |
| 65 to 74 Years | 217 | 10.0% |
| 75 to 84 Years | 186 | 8.6% |
| 85 Years and Over | 7 | 0.3% |
| Total | 2,172 | 100.0% |
Housing Finances in Willard
Median Income by Occupancy in Willard
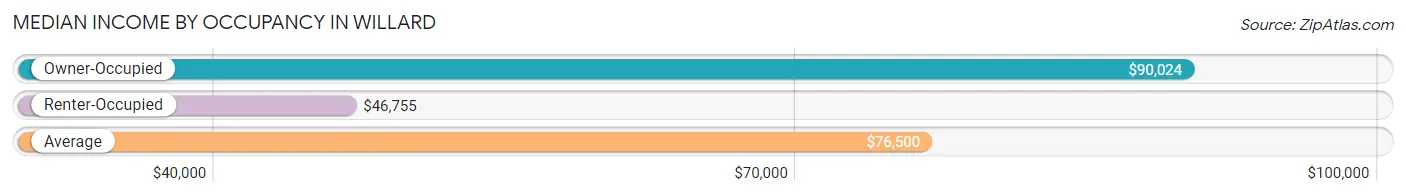
| Occupancy Type | # Households | Median Income |
| Owner-Occupied | 1,515 (69.8%) | $90,024 |
| Renter-Occupied | 657 (30.2%) | $46,755 |
| Average | 2,172 (100.0%) | $76,500 |
Occupancy by Householder Income Bracket in Willard
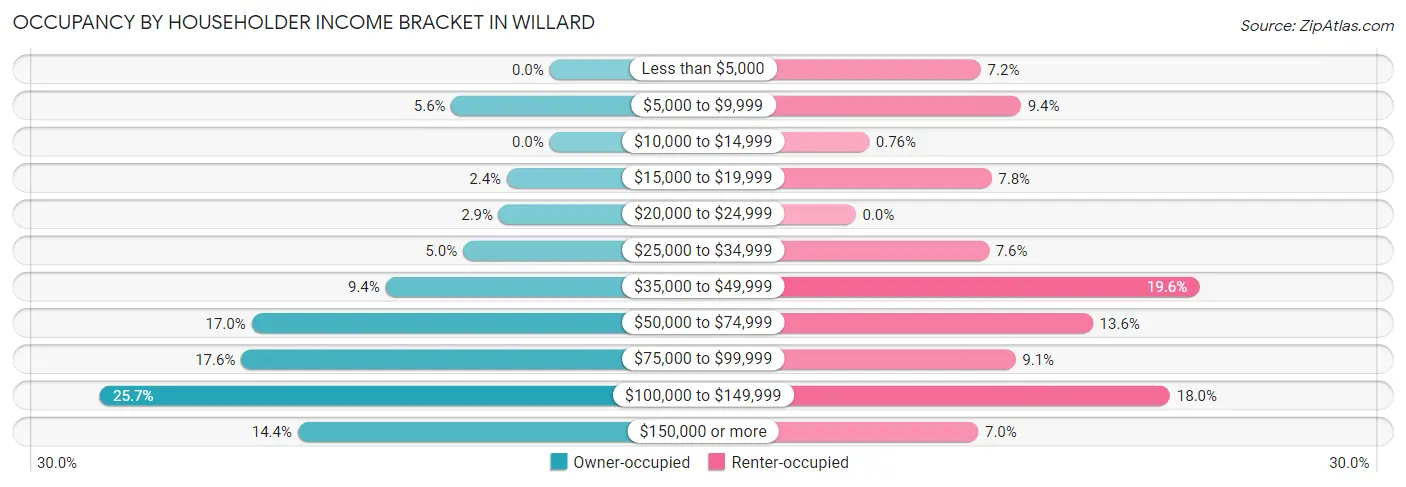
| Income Bracket | Owner-occupied | Renter-occupied |
| Less than $5,000 | 0 (0.0%) | 47 (7.1%) |
| $5,000 to $9,999 | 85 (5.6%) | 62 (9.4%) |
| $10,000 to $14,999 | 0 (0.0%) | 5 (0.8%) |
| $15,000 to $19,999 | 37 (2.4%) | 51 (7.8%) |
| $20,000 to $24,999 | 44 (2.9%) | 0 (0.0%) |
| $25,000 to $34,999 | 75 (5.0%) | 50 (7.6%) |
| $35,000 to $49,999 | 142 (9.4%) | 129 (19.6%) |
| $50,000 to $74,999 | 258 (17.0%) | 89 (13.6%) |
| $75,000 to $99,999 | 267 (17.6%) | 60 (9.1%) |
| $100,000 to $149,999 | 389 (25.7%) | 118 (18.0%) |
| $150,000 or more | 218 (14.4%) | 46 (7.0%) |
| Total | 1,515 (100.0%) | 657 (100.0%) |
Monthly Housing Cost Tiers in Willard
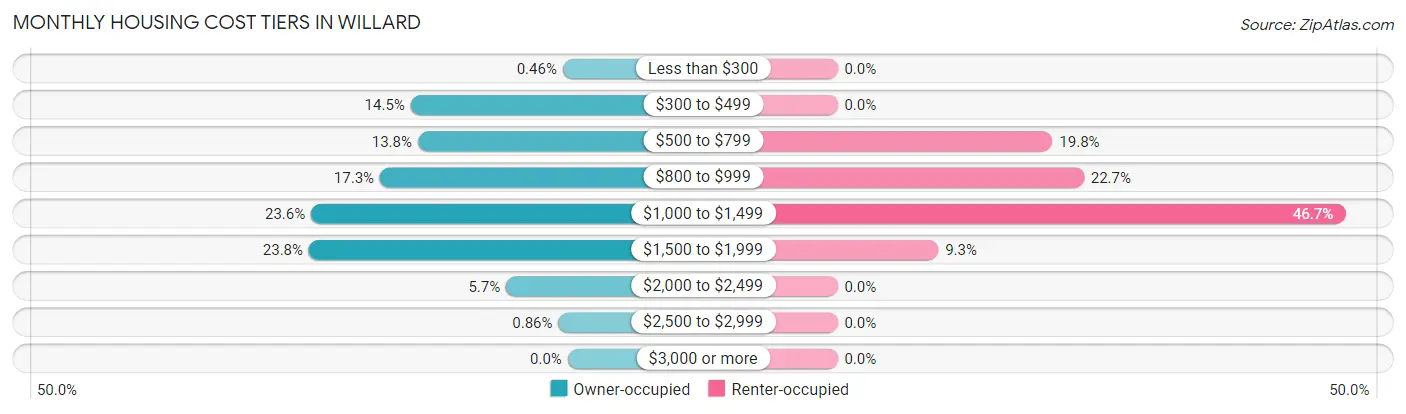
| Monthly Cost | Owner-occupied | Renter-occupied |
| Less than $300 | 7 (0.5%) | 0 (0.0%) |
| $300 to $499 | 219 (14.5%) | 0 (0.0%) |
| $500 to $799 | 209 (13.8%) | 130 (19.8%) |
| $800 to $999 | 262 (17.3%) | 149 (22.7%) |
| $1,000 to $1,499 | 358 (23.6%) | 307 (46.7%) |
| $1,500 to $1,999 | 361 (23.8%) | 61 (9.3%) |
| $2,000 to $2,499 | 86 (5.7%) | 0 (0.0%) |
| $2,500 to $2,999 | 13 (0.9%) | 0 (0.0%) |
| $3,000 or more | 0 (0.0%) | 0 (0.0%) |
| Total | 1,515 (100.0%) | 657 (100.0%) |
Physical Housing Characteristics in Willard
Housing Structures in Willard
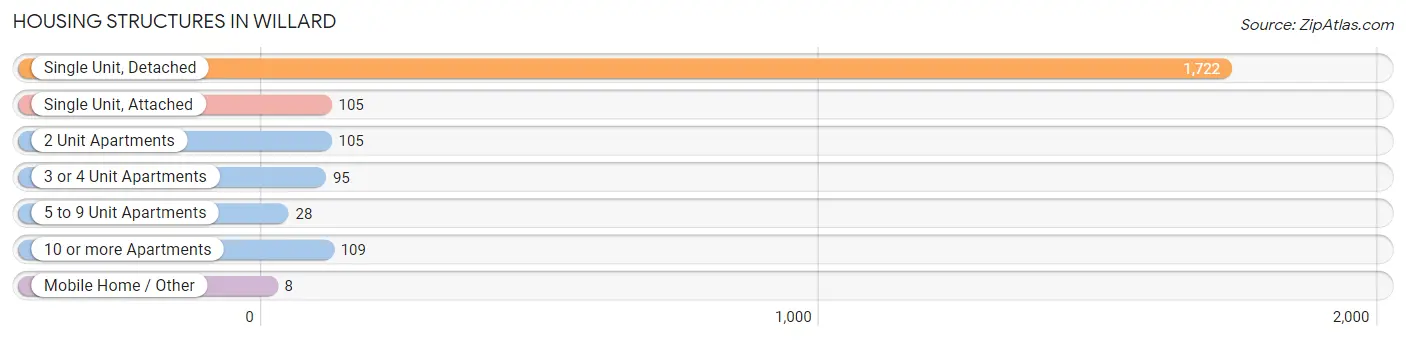
| Structure Type | # Housing Units | % Housing Units |
| Single Unit, Detached | 1,722 | 79.3% |
| Single Unit, Attached | 105 | 4.8% |
| 2 Unit Apartments | 105 | 4.8% |
| 3 or 4 Unit Apartments | 95 | 4.4% |
| 5 to 9 Unit Apartments | 28 | 1.3% |
| 10 or more Apartments | 109 | 5.0% |
| Mobile Home / Other | 8 | 0.4% |
| Total | 2,172 | 100.0% |
Housing Structures by Occupancy in Willard
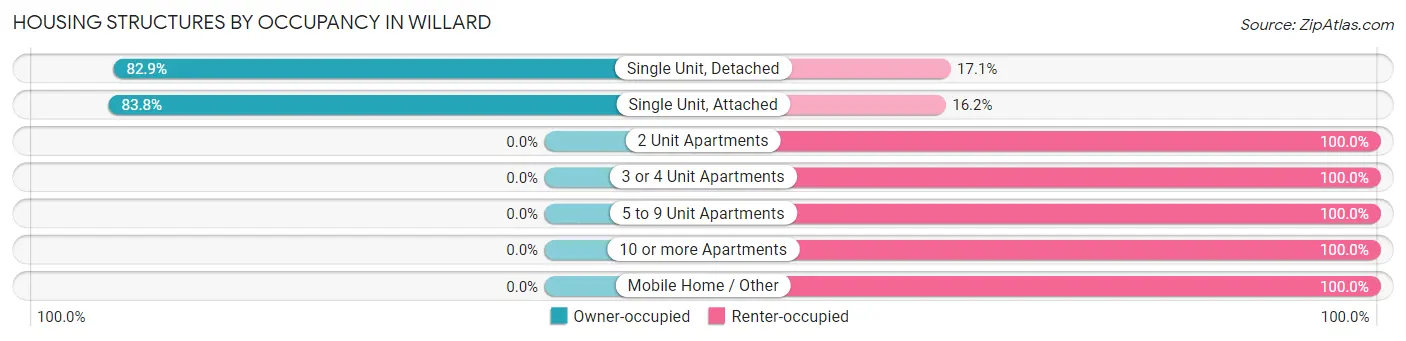
| Structure Type | Owner-occupied | Renter-occupied |
| Single Unit, Detached | 1,427 (82.9%) | 295 (17.1%) |
| Single Unit, Attached | 88 (83.8%) | 17 (16.2%) |
| 2 Unit Apartments | 0 (0.0%) | 105 (100.0%) |
| 3 or 4 Unit Apartments | 0 (0.0%) | 95 (100.0%) |
| 5 to 9 Unit Apartments | 0 (0.0%) | 28 (100.0%) |
| 10 or more Apartments | 0 (0.0%) | 109 (100.0%) |
| Mobile Home / Other | 0 (0.0%) | 8 (100.0%) |
| Total | 1,515 (69.8%) | 657 (30.2%) |
Housing Structures by Number of Rooms in Willard
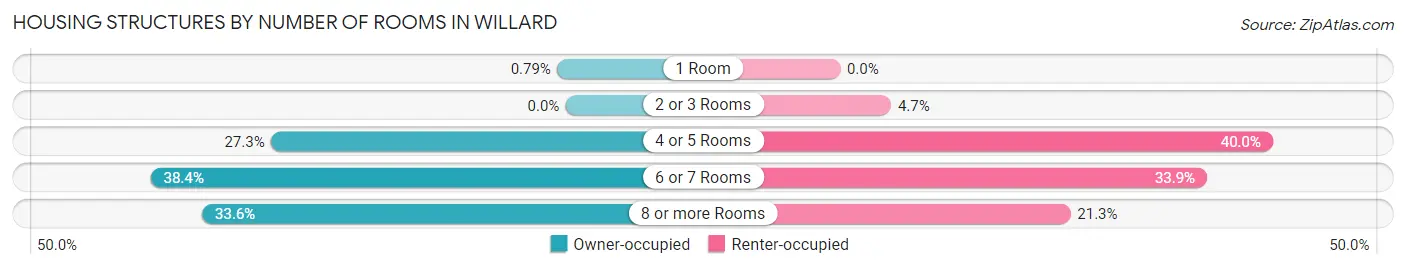
| Number of Rooms | Owner-occupied | Renter-occupied |
| 1 Room | 12 (0.8%) | 0 (0.0%) |
| 2 or 3 Rooms | 0 (0.0%) | 31 (4.7%) |
| 4 or 5 Rooms | 413 (27.3%) | 263 (40.0%) |
| 6 or 7 Rooms | 581 (38.4%) | 223 (33.9%) |
| 8 or more Rooms | 509 (33.6%) | 140 (21.3%) |
| Total | 1,515 (100.0%) | 657 (100.0%) |
Housing Structure by Heating Type in Willard
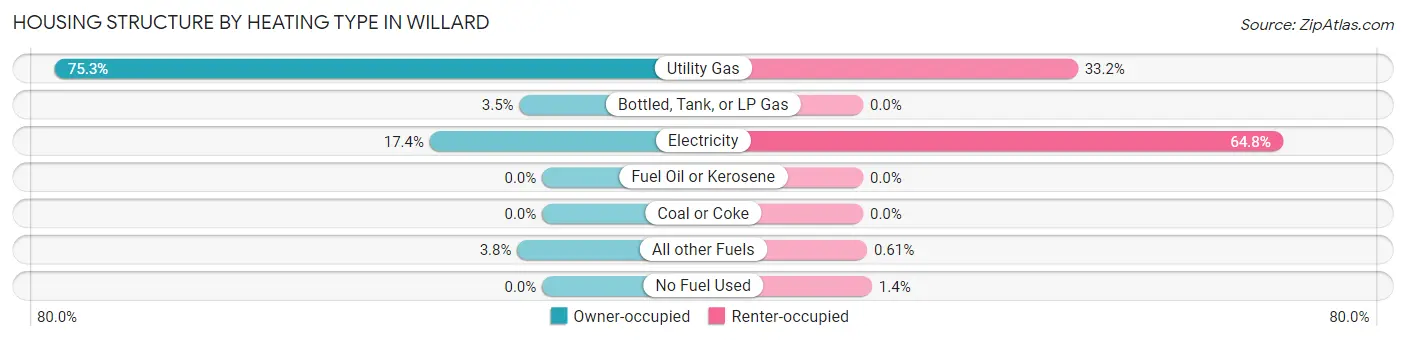
| Heating Type | Owner-occupied | Renter-occupied |
| Utility Gas | 1,141 (75.3%) | 218 (33.2%) |
| Bottled, Tank, or LP Gas | 53 (3.5%) | 0 (0.0%) |
| Electricity | 263 (17.4%) | 426 (64.8%) |
| Fuel Oil or Kerosene | 0 (0.0%) | 0 (0.0%) |
| Coal or Coke | 0 (0.0%) | 0 (0.0%) |
| All other Fuels | 58 (3.8%) | 4 (0.6%) |
| No Fuel Used | 0 (0.0%) | 9 (1.4%) |
| Total | 1,515 (100.0%) | 657 (100.0%) |
Household Vehicle Usage in Willard
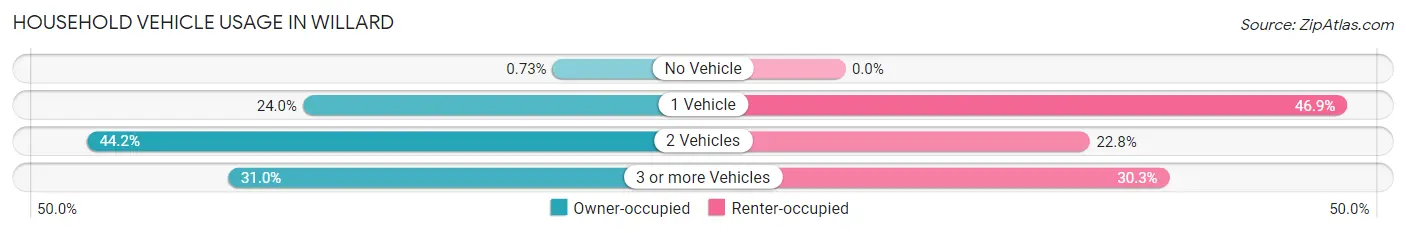
| Vehicles per Household | Owner-occupied | Renter-occupied |
| No Vehicle | 11 (0.7%) | 0 (0.0%) |
| 1 Vehicle | 364 (24.0%) | 308 (46.9%) |
| 2 Vehicles | 670 (44.2%) | 150 (22.8%) |
| 3 or more Vehicles | 470 (31.0%) | 199 (30.3%) |
| Total | 1,515 (100.0%) | 657 (100.0%) |
Real Estate & Mortgages in Willard
Real Estate and Mortgage Overview in Willard
| Characteristic | Without Mortgage | With Mortgage |
| Housing Units | 451 | 1,064 |
| Median Property Value | $182,600 | $176,400 |
| Median Household Income | $44,688 | $195 |
| Monthly Housing Costs | $499 | $0 |
| Real Estate Taxes | $1,489 | $25 |
Property Value by Mortgage Status in Willard
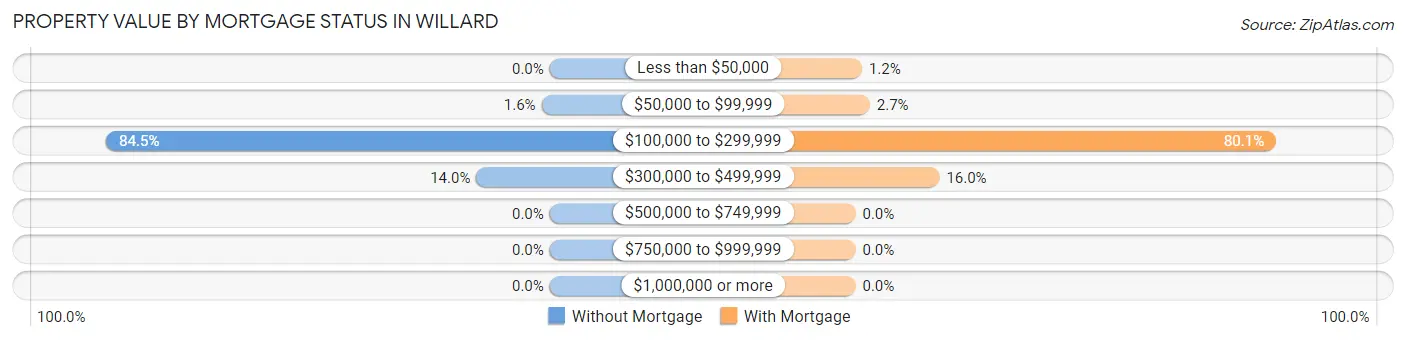
| Property Value | Without Mortgage | With Mortgage |
| Less than $50,000 | 0 (0.0%) | 13 (1.2%) |
| $50,000 to $99,999 | 7 (1.5%) | 29 (2.7%) |
| $100,000 to $299,999 | 381 (84.5%) | 852 (80.1%) |
| $300,000 to $499,999 | 63 (14.0%) | 170 (16.0%) |
| $500,000 to $749,999 | 0 (0.0%) | 0 (0.0%) |
| $750,000 to $999,999 | 0 (0.0%) | 0 (0.0%) |
| $1,000,000 or more | 0 (0.0%) | 0 (0.0%) |
| Total | 451 (100.0%) | 1,064 (100.0%) |
Household Income by Mortgage Status in Willard
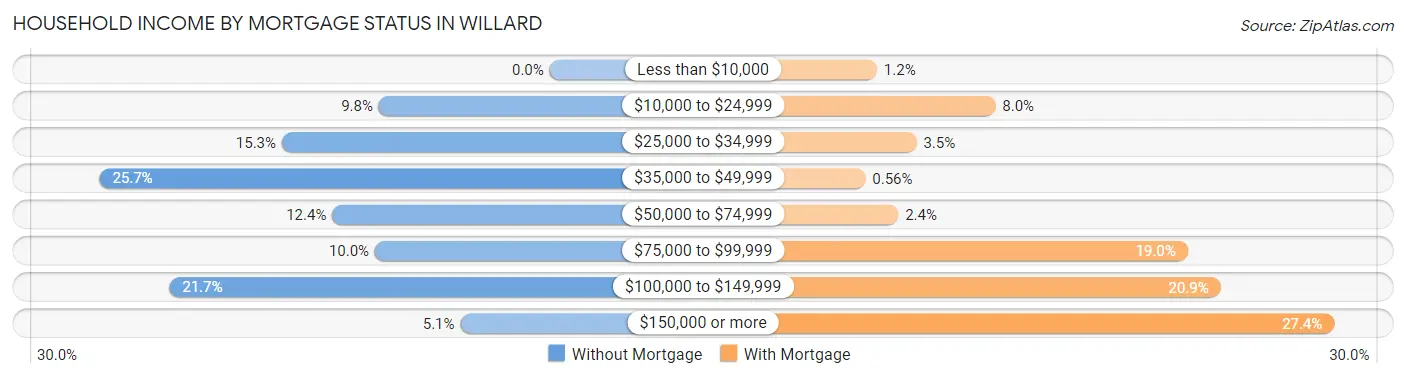
| Household Income | Without Mortgage | With Mortgage |
| Less than $10,000 | 0 (0.0%) | 13 (1.2%) |
| $10,000 to $24,999 | 44 (9.8%) | 85 (8.0%) |
| $25,000 to $34,999 | 69 (15.3%) | 37 (3.5%) |
| $35,000 to $49,999 | 116 (25.7%) | 6 (0.6%) |
| $50,000 to $74,999 | 56 (12.4%) | 26 (2.4%) |
| $75,000 to $99,999 | 45 (10.0%) | 202 (19.0%) |
| $100,000 to $149,999 | 98 (21.7%) | 222 (20.9%) |
| $150,000 or more | 23 (5.1%) | 291 (27.4%) |
| Total | 451 (100.0%) | 1,064 (100.0%) |
Property Value to Household Income Ratio in Willard
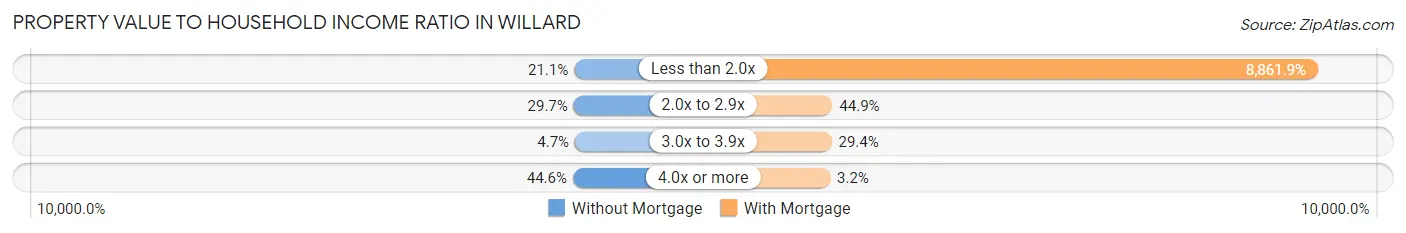
| Value-to-Income Ratio | Without Mortgage | With Mortgage |
| Less than 2.0x | 95 (21.1%) | 94,291 (8,861.9%) |
| 2.0x to 2.9x | 134 (29.7%) | 478 (44.9%) |
| 3.0x to 3.9x | 21 (4.7%) | 313 (29.4%) |
| 4.0x or more | 201 (44.6%) | 34 (3.2%) |
| Total | 451 (100.0%) | 1,064 (100.0%) |
Real Estate Taxes by Mortgage Status in Willard
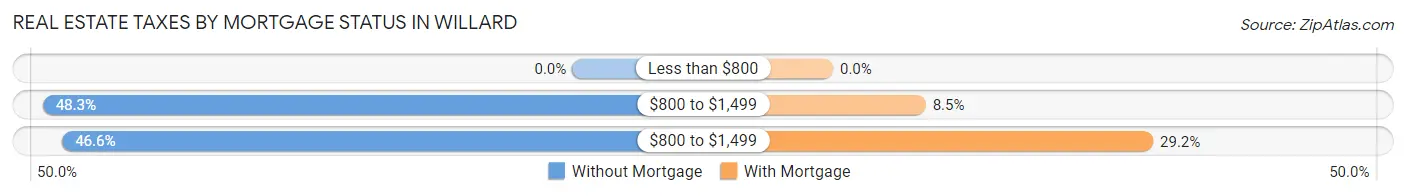
| Property Taxes | Without Mortgage | With Mortgage |
| Less than $800 | 0 (0.0%) | 0 (0.0%) |
| $800 to $1,499 | 218 (48.3%) | 90 (8.5%) |
| $800 to $1,499 | 210 (46.6%) | 311 (29.2%) |
| Total | 451 (100.0%) | 1,064 (100.0%) |
Health & Disability in Willard
Health Insurance Coverage by Age in Willard
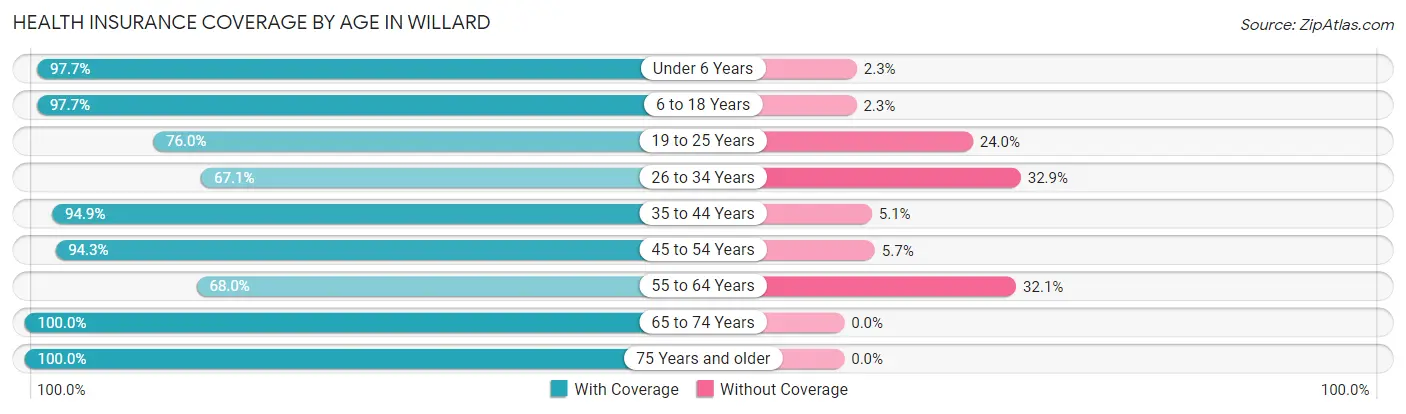
| Age Bracket | With Coverage | Without Coverage |
| Under 6 Years | 501 (97.7%) | 12 (2.3%) |
| 6 to 18 Years | 1,638 (97.7%) | 38 (2.3%) |
| 19 to 25 Years | 495 (76.0%) | 156 (24.0%) |
| 26 to 34 Years | 430 (67.1%) | 211 (32.9%) |
| 35 to 44 Years | 702 (94.9%) | 38 (5.1%) |
| 45 to 54 Years | 726 (94.3%) | 44 (5.7%) |
| 55 to 64 Years | 475 (67.9%) | 224 (32.1%) |
| 65 to 74 Years | 368 (100.0%) | 0 (0.0%) |
| 75 Years and older | 236 (100.0%) | 0 (0.0%) |
| Total | 5,571 (88.5%) | 723 (11.5%) |
Health Insurance Coverage by Citizenship Status in Willard
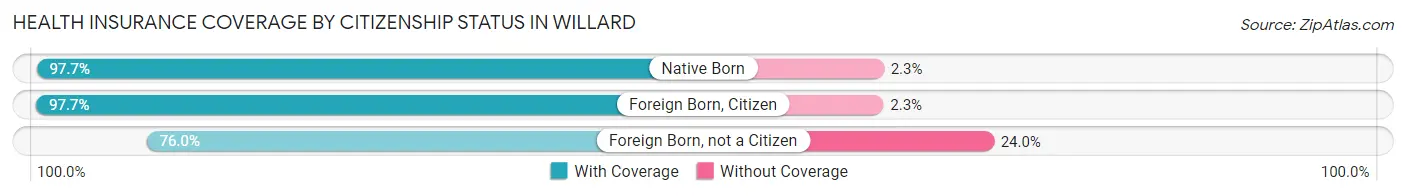
| Citizenship Status | With Coverage | Without Coverage |
| Native Born | 501 (97.7%) | 12 (2.3%) |
| Foreign Born, Citizen | 1,638 (97.7%) | 38 (2.3%) |
| Foreign Born, not a Citizen | 495 (76.0%) | 156 (24.0%) |
Health Insurance Coverage by Household Income in Willard
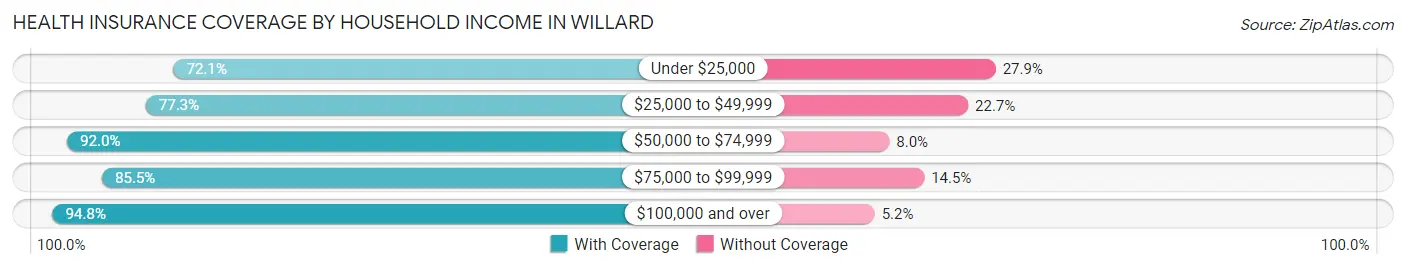
| Household Income | With Coverage | Without Coverage |
| Under $25,000 | 491 (72.1%) | 190 (27.9%) |
| $25,000 to $49,999 | 605 (77.3%) | 178 (22.7%) |
| $50,000 to $74,999 | 738 (92.0%) | 64 (8.0%) |
| $75,000 to $99,999 | 684 (85.5%) | 116 (14.5%) |
| $100,000 and over | 3,044 (94.8%) | 168 (5.2%) |
Public vs Private Health Insurance Coverage by Age in Willard
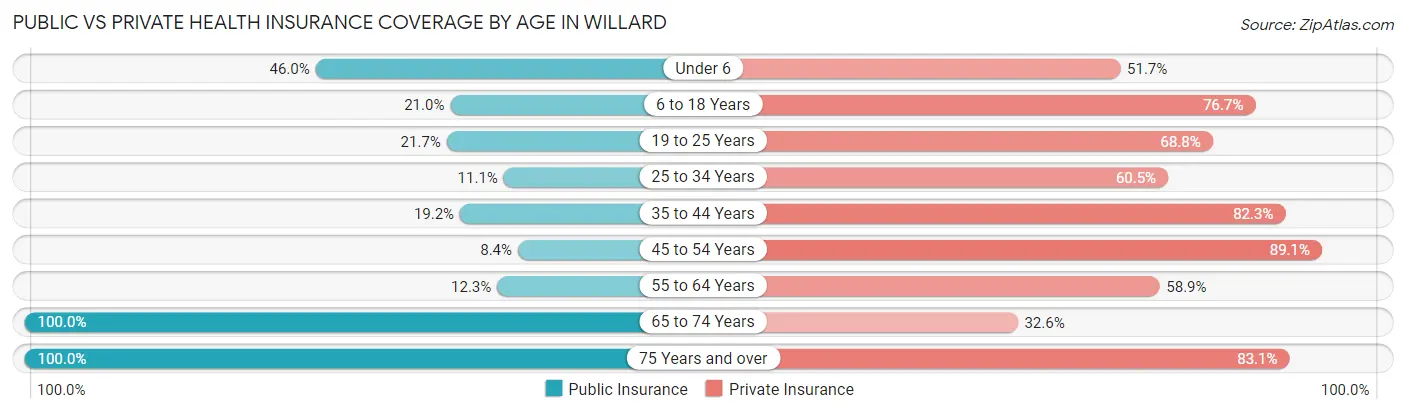
| Age Bracket | Public Insurance | Private Insurance |
| Under 6 | 236 (46.0%) | 265 (51.7%) |
| 6 to 18 Years | 352 (21.0%) | 1,286 (76.7%) |
| 19 to 25 Years | 141 (21.7%) | 448 (68.8%) |
| 25 to 34 Years | 71 (11.1%) | 388 (60.5%) |
| 35 to 44 Years | 142 (19.2%) | 609 (82.3%) |
| 45 to 54 Years | 65 (8.4%) | 686 (89.1%) |
| 55 to 64 Years | 86 (12.3%) | 412 (58.9%) |
| 65 to 74 Years | 368 (100.0%) | 120 (32.6%) |
| 75 Years and over | 236 (100.0%) | 196 (83.1%) |
| Total | 1,697 (27.0%) | 4,410 (70.1%) |
Disability Status by Sex by Age in Willard
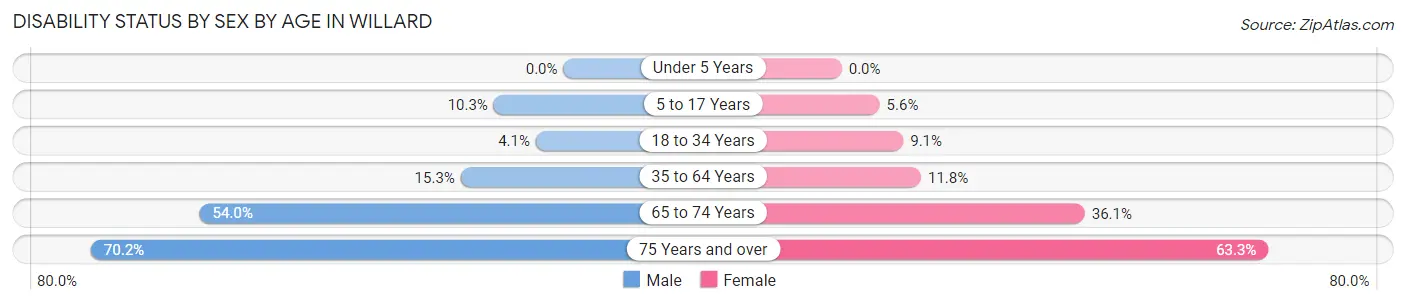
| Age Bracket | Male | Female |
| Under 5 Years | 0 (0.0%) | 0 (0.0%) |
| 5 to 17 Years | 91 (10.3%) | 43 (5.6%) |
| 18 to 34 Years | 36 (4.1%) | 47 (9.1%) |
| 35 to 64 Years | 149 (15.2%) | 145 (11.8%) |
| 65 to 74 Years | 94 (54.0%) | 70 (36.1%) |
| 75 Years and over | 47 (70.2%) | 107 (63.3%) |
Disability Class by Sex by Age in Willard
Disability Class: Hearing Difficulty
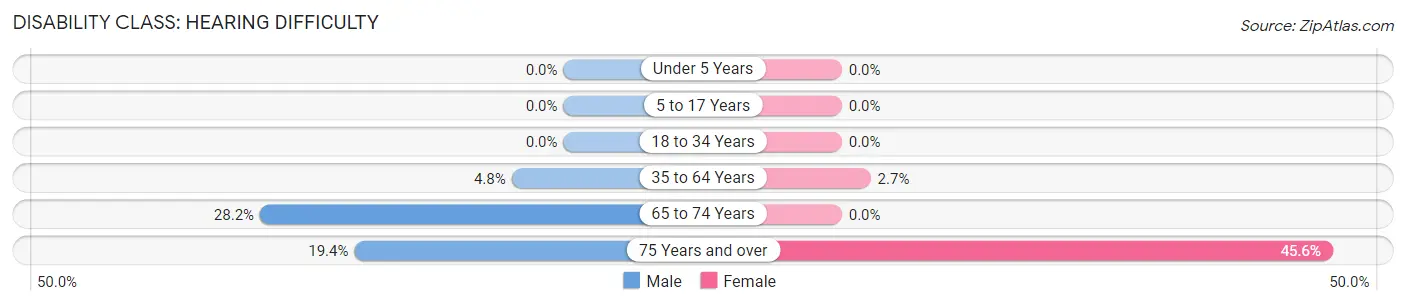
| Age Bracket | Male | Female |
| Under 5 Years | 0 (0.0%) | 0 (0.0%) |
| 5 to 17 Years | 0 (0.0%) | 0 (0.0%) |
| 18 to 34 Years | 0 (0.0%) | 0 (0.0%) |
| 35 to 64 Years | 47 (4.8%) | 33 (2.7%) |
| 65 to 74 Years | 49 (28.2%) | 0 (0.0%) |
| 75 Years and over | 13 (19.4%) | 77 (45.6%) |
Disability Class: Vision Difficulty
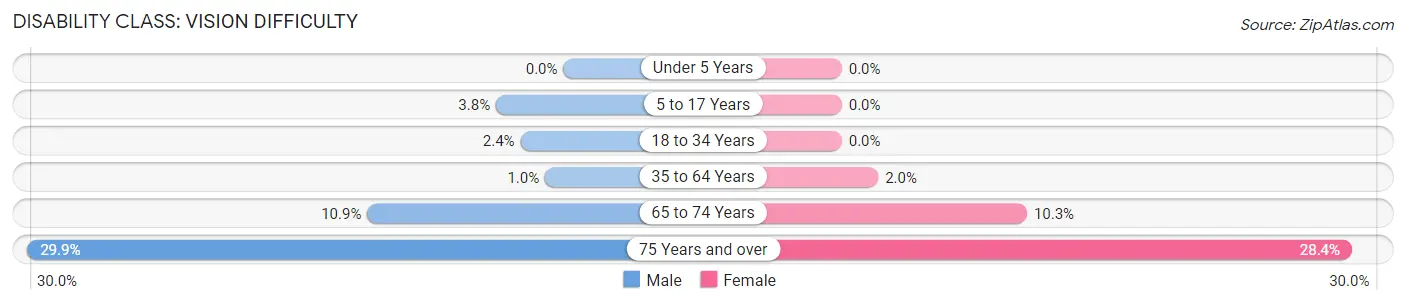
| Age Bracket | Male | Female |
| Under 5 Years | 0 (0.0%) | 0 (0.0%) |
| 5 to 17 Years | 33 (3.7%) | 0 (0.0%) |
| 18 to 34 Years | 21 (2.4%) | 0 (0.0%) |
| 35 to 64 Years | 10 (1.0%) | 25 (2.0%) |
| 65 to 74 Years | 19 (10.9%) | 20 (10.3%) |
| 75 Years and over | 20 (29.8%) | 48 (28.4%) |
Disability Class: Cognitive Difficulty
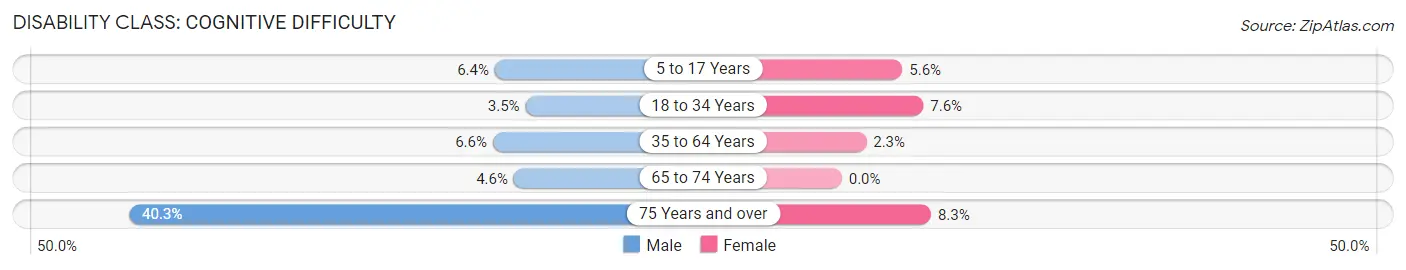
| Age Bracket | Male | Female |
| 5 to 17 Years | 56 (6.4%) | 43 (5.6%) |
| 18 to 34 Years | 31 (3.5%) | 39 (7.6%) |
| 35 to 64 Years | 64 (6.6%) | 28 (2.3%) |
| 65 to 74 Years | 8 (4.6%) | 0 (0.0%) |
| 75 Years and over | 27 (40.3%) | 14 (8.3%) |
Disability Class: Ambulatory Difficulty
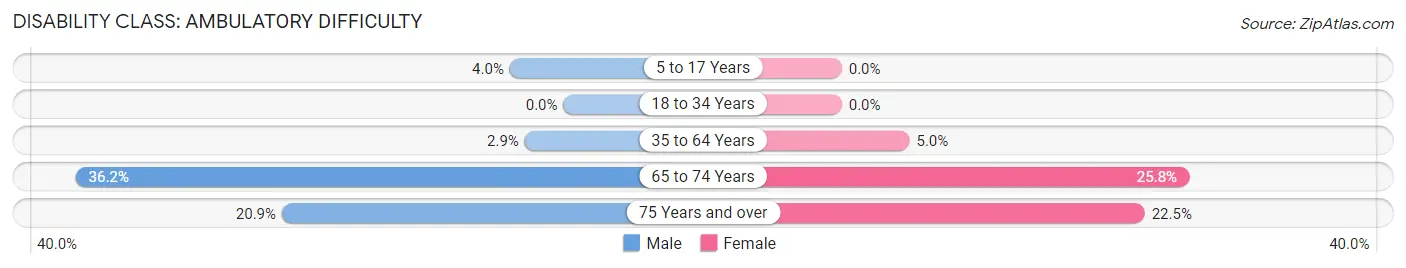
| Age Bracket | Male | Female |
| 5 to 17 Years | 35 (4.0%) | 0 (0.0%) |
| 18 to 34 Years | 0 (0.0%) | 0 (0.0%) |
| 35 to 64 Years | 28 (2.9%) | 62 (5.0%) |
| 65 to 74 Years | 63 (36.2%) | 50 (25.8%) |
| 75 Years and over | 14 (20.9%) | 38 (22.5%) |
Disability Class: Self-Care Difficulty
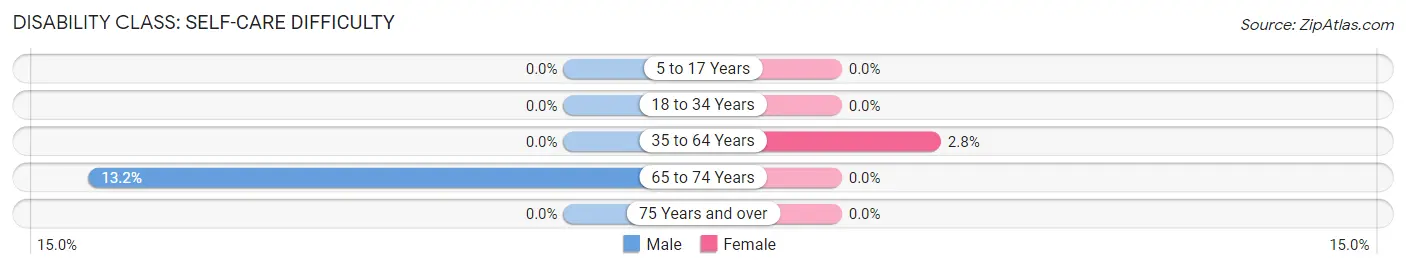
| Age Bracket | Male | Female |
| 5 to 17 Years | 0 (0.0%) | 0 (0.0%) |
| 18 to 34 Years | 0 (0.0%) | 0 (0.0%) |
| 35 to 64 Years | 0 (0.0%) | 34 (2.8%) |
| 65 to 74 Years | 23 (13.2%) | 0 (0.0%) |
| 75 Years and over | 0 (0.0%) | 0 (0.0%) |
Technology Access in Willard
Computing Device Access in Willard
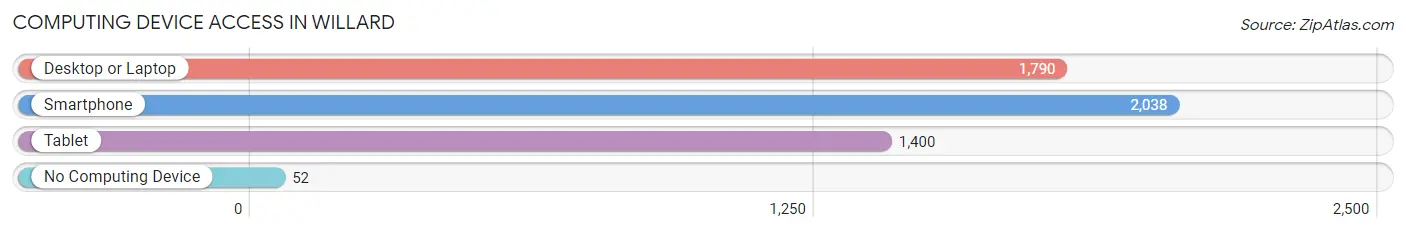
| Device Type | # Households | % Households |
| Desktop or Laptop | 1,790 | 82.4% |
| Smartphone | 2,038 | 93.8% |
| Tablet | 1,400 | 64.5% |
| No Computing Device | 52 | 2.4% |
| Total | 2,172 | 100.0% |
Internet Access in Willard
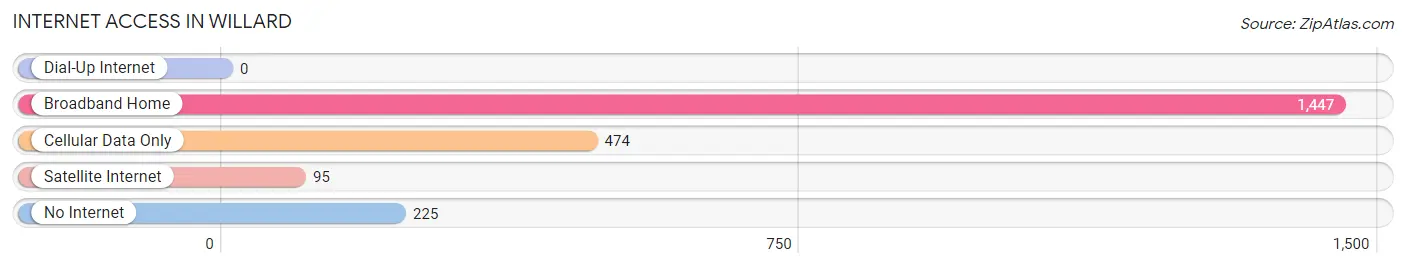
| Internet Type | # Households | % Households |
| Dial-Up Internet | 0 | 0.0% |
| Broadband Home | 1,447 | 66.6% |
| Cellular Data Only | 474 | 21.8% |
| Satellite Internet | 95 | 4.4% |
| No Internet | 225 | 10.4% |
| Total | 2,172 | 100.0% |
Willard Summary
Willard, Missouri is a small city located in Greene County, Missouri. It is situated in the southwestern part of the state, about 10 miles north of Springfield. The city has a population of approximately 5,000 people and is part of the Springfield Metropolitan Statistical Area.
History
Willard was founded in 1883 by the Willard family, who had moved to the area from Indiana. The city was named after the family’s patriarch, William Willard. The city was incorporated in 1887 and has remained a small, rural community ever since.
The city was originally a farming community, but in the early 1900s, the Willard family began to develop the area into a small industrial center. The Willard family opened a brick factory, a lumber mill, and a canning factory. These businesses provided employment for many of the local residents and helped to spur the growth of the city.
In the 1950s, the city began to experience a population boom as people moved to the area from other parts of the country. This growth was largely due to the city’s proximity to Springfield, which was experiencing a period of rapid growth at the time.
Geography
Willard is located in the southwestern part of Greene County, Missouri. It is situated about 10 miles north of Springfield and is part of the Springfield Metropolitan Statistical Area. The city is located in the Ozark Mountains and is surrounded by rolling hills and wooded areas. The city is situated along the James River, which provides a scenic backdrop for the city.
Economy
Willard’s economy is largely based on agriculture and manufacturing. The city is home to several large farms, which produce a variety of crops, including corn, soybeans, and wheat. The city is also home to several manufacturing companies, which produce a variety of products, including furniture, clothing, and automotive parts.
The city is also home to several small businesses, including restaurants, retail stores, and service providers. The city is also home to a number of educational institutions, including a community college and a technical school.
Demographics
As of the 2010 census, the population of Willard was 5,000. The racial makeup of the city was 95.3% White, 1.2% African American, 0.3% Native American, 0.7% Asian, 0.1% Pacific Islander, and 2.4% from other races. The median household income was $41,000 and the median family income was $50,000.
Willard is a small, rural community that has experienced slow but steady growth over the past few decades. The city is home to a diverse population and a strong economy that is based on agriculture and manufacturing. The city is also home to several educational institutions, which provide educational opportunities for the local population.
Common Questions
What is Per Capita Income in Willard?
Per Capita income in Willard is $28,836.
What is the Median Family Income in Willard?
Median Family Income in Willard is $90,168.
What is the Median Household income in Willard?
Median Household Income in Willard is $76,500.
What is Income or Wage Gap in Willard?
Income or Wage Gap in Willard is 11.7%.
Women in Willard earn 88.3 cents for every dollar earned by a man.
What is Inequality or Gini Index in Willard?
Inequality or Gini Index in Willard is 0.39.
What is the Total Population of Willard?
Total Population of Willard is 6,342.
What is the Total Male Population of Willard?
Total Male Population of Willard is 3,204.
What is the Total Female Population of Willard?
Total Female Population of Willard is 3,138.
What is the Ratio of Males per 100 Females in Willard?
There are 102.10 Males per 100 Females in Willard.
What is the Ratio of Females per 100 Males in Willard?
There are 97.94 Females per 100 Males in Willard.
What is the Median Population Age in Willard?
Median Population Age in Willard is 31.1 Years.
What is the Average Family Size in Willard
Average Family Size in Willard is 3.3 People.
What is the Average Household Size in Willard
Average Household Size in Willard is 2.9 People.
How Large is the Labor Force in Willard?
There are 2,997 People in the Labor Forcein in Willard.
What is the Percentage of People in the Labor Force in Willard?
68.2% of People are in the Labor Force in Willard.
What is the Unemployment Rate in Willard?
Unemployment Rate in Willard is 2.9%.