Wheaton, MO Map & Demographics
Wheaton Map
Wheaton Overview
$13,842
PER CAPITA INCOME
$45,833
AVG FAMILY INCOME
$22,917
AVG HOUSEHOLD INCOME
20.7%
WAGE / INCOME GAP [ % ]
79.3¢/ $1
WAGE / INCOME GAP [ $ ]
0.43
INEQUALITY / GINI INDEX
541
TOTAL POPULATION
259
MALE POPULATION
282
FEMALE POPULATION
91.84
MALES / 100 FEMALES
108.88
FEMALES / 100 MALES
30.9
MEDIAN AGE
3.5
AVG FAMILY SIZE
2.8
AVG HOUSEHOLD SIZE
205
LABOR FORCE [ PEOPLE ]
51.3%
PERCENT IN LABOR FORCE
5.4%
UNEMPLOYMENT RATE
Wheaton Zip Codes
Wheaton Area Codes
Income in Wheaton
Income Overview in Wheaton
Per Capita Income in Wheaton is $13,842, while median incomes of families and households are $45,833 and $22,917 respectively.
| Characteristic | Number | Measure |
| Per Capita Income | 541 | $13,842 |
| Median Family Income | 112 | $45,833 |
| Mean Family Income | 112 | $47,292 |
| Median Household Income | 193 | $22,917 |
| Mean Household Income | 193 | $35,731 |
| Income Deficit | 112 | $0 |
| Wage / Income Gap (%) | 541 | 20.69% |
| Wage / Income Gap ($) | 541 | 79.31¢ per $1 |
| Gini / Inequality Index | 541 | 0.43 |
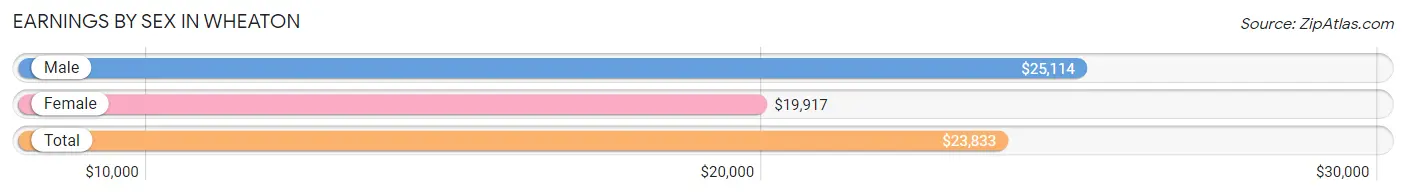
Earnings by Sex in Wheaton
Average Earnings in Wheaton are $23,833, $25,114 for men and $19,917 for women, a difference of 20.7%.
| Sex | Number | Average Earnings |
| Male | 111 (49.5%) | $25,114 |
| Female | 113 (50.4%) | $19,917 |
| Total | 224 (100.0%) | $23,833 |
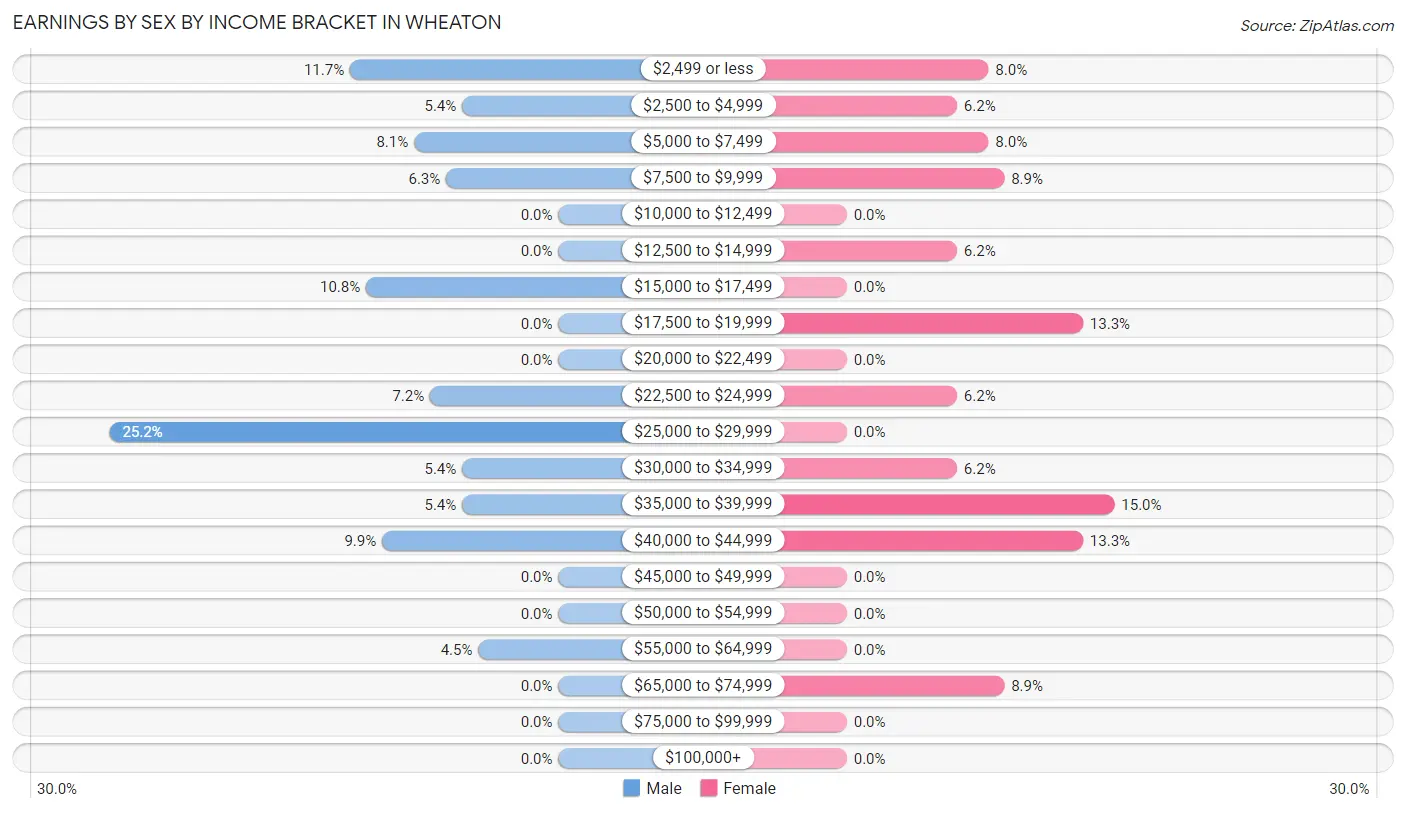
Earnings by Sex by Income Bracket in Wheaton
The most common earnings brackets in Wheaton are $25,000 to $29,999 for men (28 | 25.2%) and $35,000 to $39,999 for women (17 | 15.0%).
| Income | Male | Female |
| $2,499 or less | 13 (11.7%) | 9 (8.0%) |
| $2,500 to $4,999 | 6 (5.4%) | 7 (6.2%) |
| $5,000 to $7,499 | 9 (8.1%) | 9 (8.0%) |
| $7,500 to $9,999 | 7 (6.3%) | 10 (8.8%) |
| $10,000 to $12,499 | 0 (0.0%) | 0 (0.0%) |
| $12,500 to $14,999 | 0 (0.0%) | 7 (6.2%) |
| $15,000 to $17,499 | 12 (10.8%) | 0 (0.0%) |
| $17,500 to $19,999 | 0 (0.0%) | 15 (13.3%) |
| $20,000 to $22,499 | 0 (0.0%) | 0 (0.0%) |
| $22,500 to $24,999 | 8 (7.2%) | 7 (6.2%) |
| $25,000 to $29,999 | 28 (25.2%) | 0 (0.0%) |
| $30,000 to $34,999 | 6 (5.4%) | 7 (6.2%) |
| $35,000 to $39,999 | 6 (5.4%) | 17 (15.0%) |
| $40,000 to $44,999 | 11 (9.9%) | 15 (13.3%) |
| $45,000 to $49,999 | 0 (0.0%) | 0 (0.0%) |
| $50,000 to $54,999 | 0 (0.0%) | 0 (0.0%) |
| $55,000 to $64,999 | 5 (4.5%) | 0 (0.0%) |
| $65,000 to $74,999 | 0 (0.0%) | 10 (8.8%) |
| $75,000 to $99,999 | 0 (0.0%) | 0 (0.0%) |
| $100,000+ | 0 (0.0%) | 0 (0.0%) |
| Total | 111 (100.0%) | 113 (100.0%) |
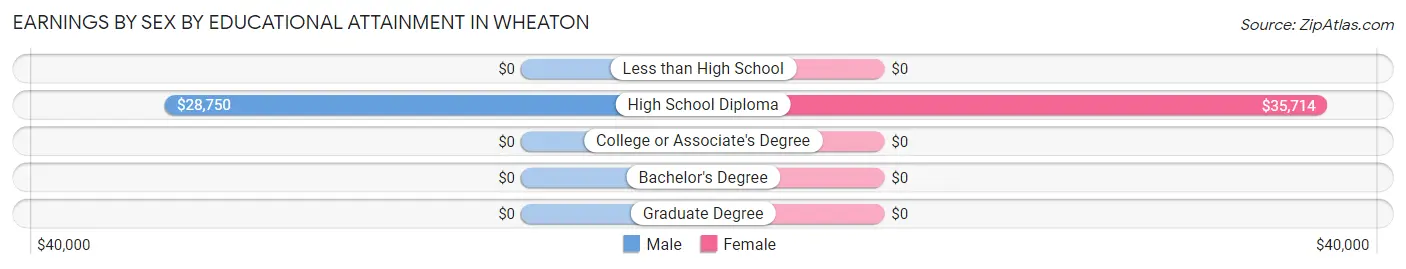
Earnings by Sex by Educational Attainment in Wheaton
Average earnings in Wheaton are $26,705 for men and $33,036 for women, a difference of 19.2%. Men with an educational attainment of high school diploma enjoy the highest average annual earnings of $28,750, while those with high school diploma education earn the least with $28,750. Women with an educational attainment of high school diploma earn the most with the average annual earnings of $35,714, while those with high school diploma education have the smallest earnings of $35,714.
| Educational Attainment | Male Income | Female Income |
| Less than High School | - | - |
| High School Diploma | $28,750 | $35,714 |
| College or Associate's Degree | - | - |
| Bachelor's Degree | - | - |
| Graduate Degree | - | - |
| Total | $26,705 | $33,036 |
Family Income in Wheaton
Family Income Brackets in Wheaton
According to the Wheaton family income data, there are 32 families falling into the $35,000 to $49,999 income range, which is the most common income bracket and makes up 28.6% of all families.
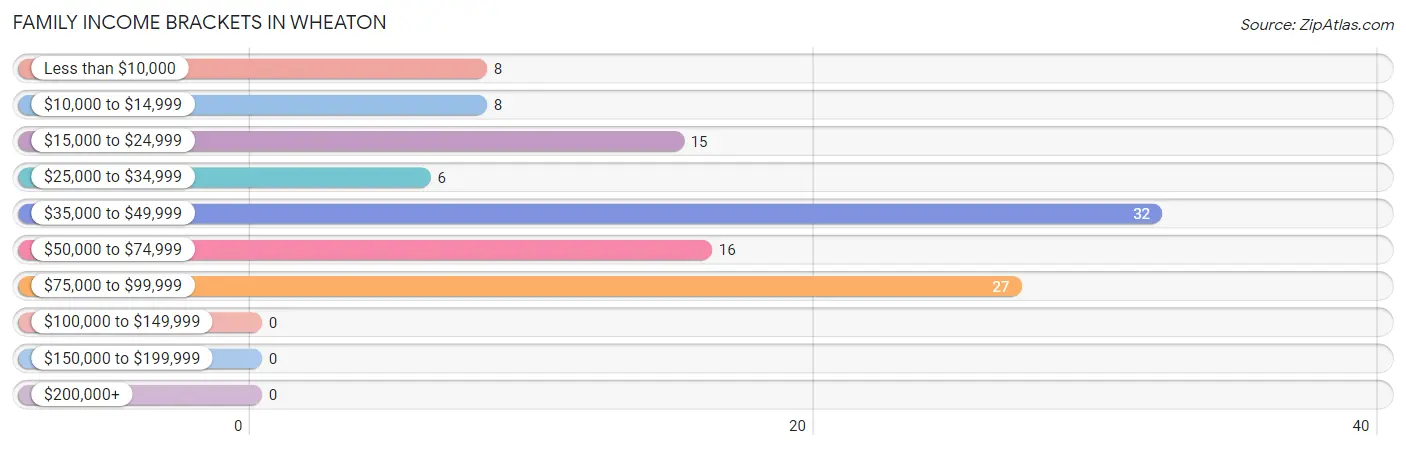
| Income Bracket | # Families | % Families |
| Less than $10,000 | 8 | 7.1% |
| $10,000 to $14,999 | 8 | 7.1% |
| $15,000 to $24,999 | 15 | 13.4% |
| $25,000 to $34,999 | 6 | 5.4% |
| $35,000 to $49,999 | 32 | 28.6% |
| $50,000 to $74,999 | 16 | 14.3% |
| $75,000 to $99,999 | 27 | 24.1% |
| $100,000 to $149,999 | 0 | 0.0% |
| $150,000 to $199,999 | 0 | 0.0% |
| $200,000+ | 0 | 0.0% |
Family Income by Famaliy Size in Wheaton
5-person families (21 | 18.8%) account for the highest median family income in Wheaton with $78,281 per family, while 2-person families (46 | 41.1%) have the highest median income of $28,750 per family member.
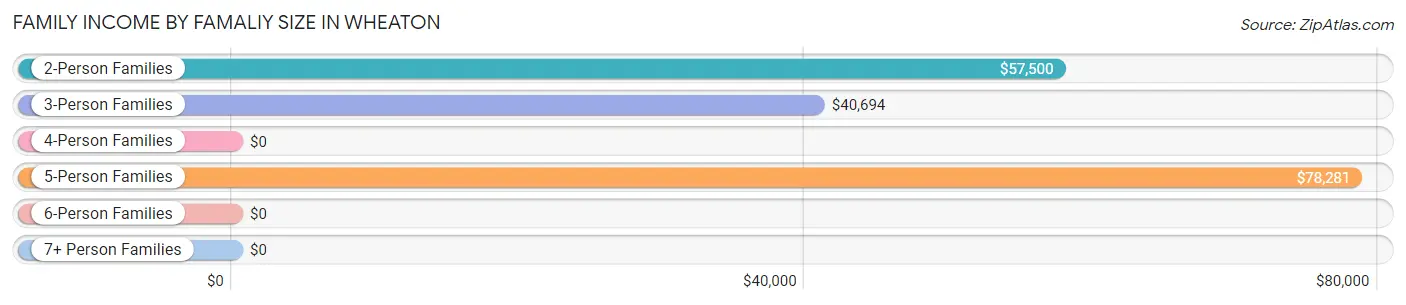
| Income Bracket | # Families | Median Income |
| 2-Person Families | 46 (41.1%) | $57,500 |
| 3-Person Families | 27 (24.1%) | $40,694 |
| 4-Person Families | 18 (16.1%) | $0 |
| 5-Person Families | 21 (18.8%) | $78,281 |
| 6-Person Families | 0 (0.0%) | $0 |
| 7+ Person Families | 0 (0.0%) | $0 |
| Total | 112 (100.0%) | $45,833 |
Family Income by Number of Earners in Wheaton
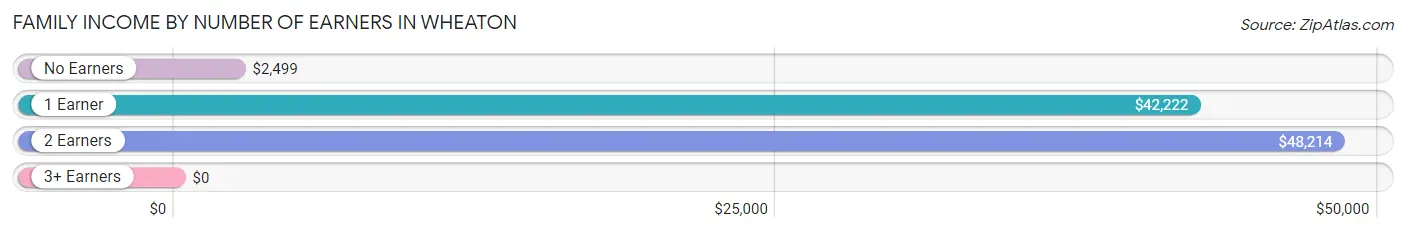
| Number of Earners | # Families | Median Income |
| No Earners | 14 (12.5%) | $2,499 |
| 1 Earner | 34 (30.4%) | $42,222 |
| 2 Earners | 64 (57.1%) | $48,214 |
| 3+ Earners | 0 (0.0%) | $0 |
| Total | 112 (100.0%) | $45,833 |
Household Income in Wheaton
Household Income Brackets in Wheaton
With 50 households falling in the category, the $10,000 to $14,999 income range is the most frequent in Wheaton, accounting for 25.9% of all households.
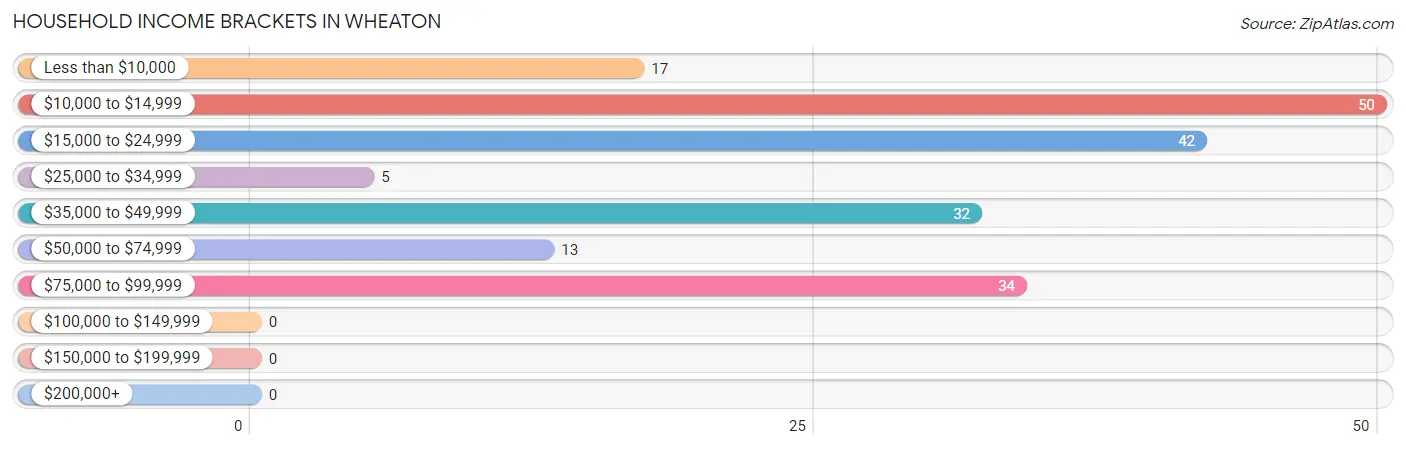
| Income Bracket | # Households | % Households |
| Less than $10,000 | 17 | 8.8% |
| $10,000 to $14,999 | 50 | 25.9% |
| $15,000 to $24,999 | 42 | 21.8% |
| $25,000 to $34,999 | 5 | 2.6% |
| $35,000 to $49,999 | 32 | 16.6% |
| $50,000 to $74,999 | 13 | 6.7% |
| $75,000 to $99,999 | 34 | 17.6% |
| $100,000 to $149,999 | 0 | 0.0% |
| $150,000 to $199,999 | 0 | 0.0% |
| $200,000+ | 0 | 0.0% |
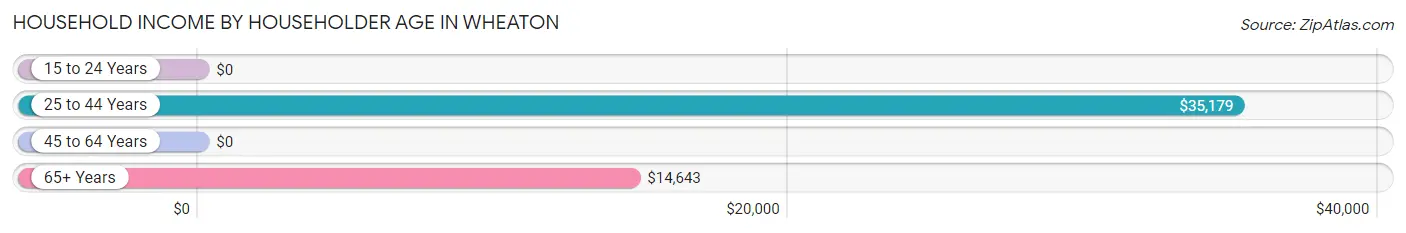
Household Income by Householder Age in Wheaton
The median household income in Wheaton is $22,917, with the highest median household income of $35,179 found in the 25 to 44 years age bracket for the primary householder. A total of 69 households (35.7%) fall into this category. Meanwhile, the 15 to 24 years age bracket for the primary householder has the lowest median household income of $0, with 15 households (7.8%) in this group.
| Income Bracket | # Households | Median Income |
| 15 to 24 Years | 15 (7.8%) | $0 |
| 25 to 44 Years | 69 (35.7%) | $35,179 |
| 45 to 64 Years | 29 (15.0%) | $0 |
| 65+ Years | 80 (41.4%) | $14,643 |
| Total | 193 (100.0%) | $22,917 |
Poverty in Wheaton
Income Below Poverty by Sex and Age in Wheaton
With 32.5% poverty level for males and 36.9% for females among the residents of Wheaton, 5 year old males and 18 to 24 year old females are the most vulnerable to poverty, with 2 males (100.0%) and 17 females (100.0%) in their respective age groups living below the poverty level.
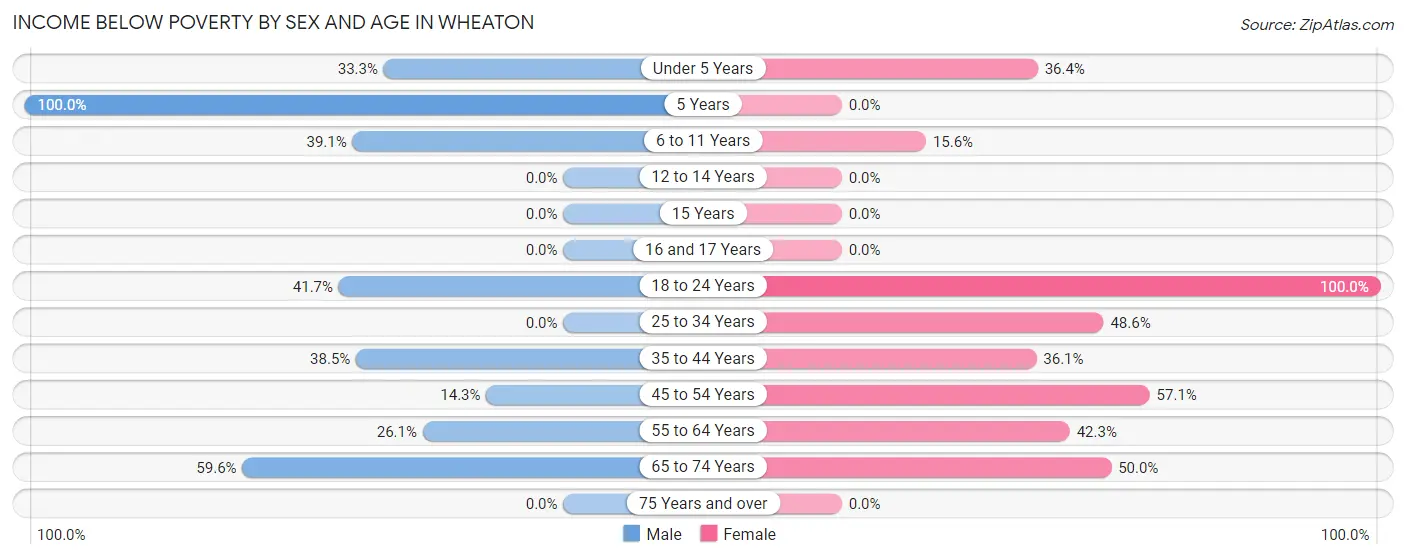
| Age Bracket | Male | Female |
| Under 5 Years | 8 (33.3%) | 4 (36.4%) |
| 5 Years | 2 (100.0%) | 0 (0.0%) |
| 6 to 11 Years | 9 (39.1%) | 5 (15.6%) |
| 12 to 14 Years | 0 (0.0%) | 0 (0.0%) |
| 15 Years | 0 (0.0%) | 0 (0.0%) |
| 16 and 17 Years | 0 (0.0%) | 0 (0.0%) |
| 18 to 24 Years | 10 (41.7%) | 17 (100.0%) |
| 25 to 34 Years | 0 (0.0%) | 34 (48.6%) |
| 35 to 44 Years | 15 (38.5%) | 13 (36.1%) |
| 45 to 54 Years | 1 (14.3%) | 8 (57.1%) |
| 55 to 64 Years | 6 (26.1%) | 11 (42.3%) |
| 65 to 74 Years | 28 (59.6%) | 9 (50.0%) |
| 75 Years and over | 0 (0.0%) | 0 (0.0%) |
| Total | 79 (32.5%) | 101 (36.9%) |
Income Above Poverty by Sex and Age in Wheaton
According to the poverty statistics in Wheaton, males aged 12 to 14 years and females aged 5 years are the age groups that are most secure financially, with 100.0% of males and 100.0% of females in these age groups living above the poverty line.
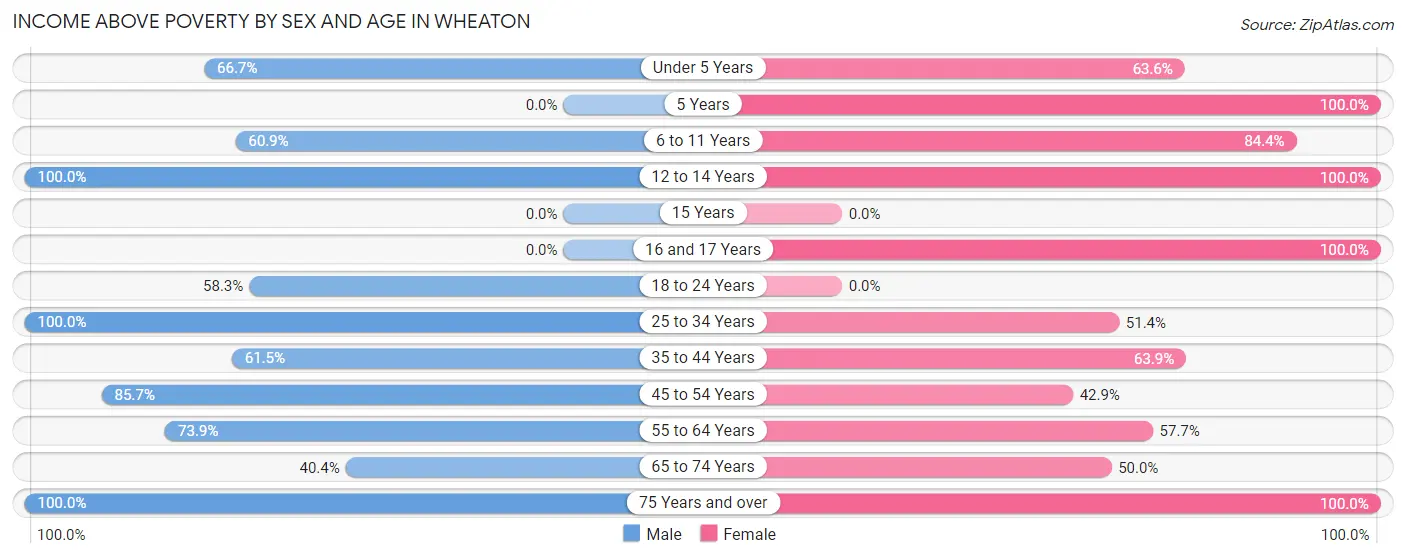
| Age Bracket | Male | Female |
| Under 5 Years | 16 (66.7%) | 7 (63.6%) |
| 5 Years | 0 (0.0%) | 7 (100.0%) |
| 6 to 11 Years | 14 (60.9%) | 27 (84.4%) |
| 12 to 14 Years | 6 (100.0%) | 12 (100.0%) |
| 15 Years | 0 (0.0%) | 0 (0.0%) |
| 16 and 17 Years | 0 (0.0%) | 7 (100.0%) |
| 18 to 24 Years | 14 (58.3%) | 0 (0.0%) |
| 25 to 34 Years | 40 (100.0%) | 36 (51.4%) |
| 35 to 44 Years | 24 (61.5%) | 23 (63.9%) |
| 45 to 54 Years | 6 (85.7%) | 6 (42.9%) |
| 55 to 64 Years | 17 (73.9%) | 15 (57.7%) |
| 65 to 74 Years | 19 (40.4%) | 9 (50.0%) |
| 75 Years and over | 8 (100.0%) | 24 (100.0%) |
| Total | 164 (67.5%) | 173 (63.1%) |
Income Below Poverty Among Married-Couple Families in Wheaton
The poverty statistics for married-couple families in Wheaton show that 23.2% or 22 of the total 95 families live below the poverty line. Families with 1 or 2 children have the highest poverty rate of 55.0%, comprising of 11 families. On the other hand, families with 3 or 4 children have the lowest poverty rate of 0.0%, which includes 0 families.
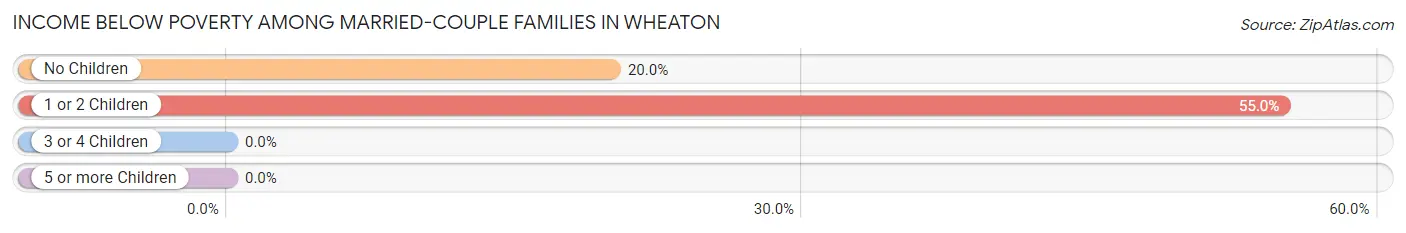
| Children | Above Poverty | Below Poverty |
| No Children | 44 (80.0%) | 11 (20.0%) |
| 1 or 2 Children | 9 (45.0%) | 11 (55.0%) |
| 3 or 4 Children | 20 (100.0%) | 0 (0.0%) |
| 5 or more Children | 0 (0.0%) | 0 (0.0%) |
| Total | 73 (76.8%) | 22 (23.2%) |
Income Below Poverty Among Single-Parent Households in Wheaton
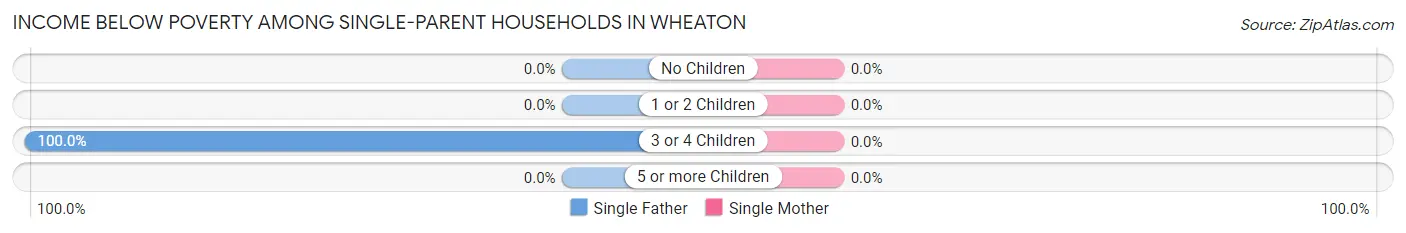
| Children | Single Father | Single Mother |
| No Children | 0 (0.0%) | 0 (0.0%) |
| 1 or 2 Children | 0 (0.0%) | 0 (0.0%) |
| 3 or 4 Children | 1 (100.0%) | 0 (0.0%) |
| 5 or more Children | 0 (0.0%) | 0 (0.0%) |
| Total | 1 (100.0%) | 0 (0.0%) |
Income Below Poverty Among Married-Couple vs Single-Parent Households in Wheaton
The poverty data for Wheaton shows that 22 of the married-couple family households (23.2%) and 1 of the single-parent households (5.9%) are living below the poverty level. Within the married-couple family households, those with 1 or 2 children have the highest poverty rate, with 11 households (55.0%) falling below the poverty line. Among the single-parent households, those with 3 or 4 children have the highest poverty rate, with 1 household (12.5%) living below poverty.
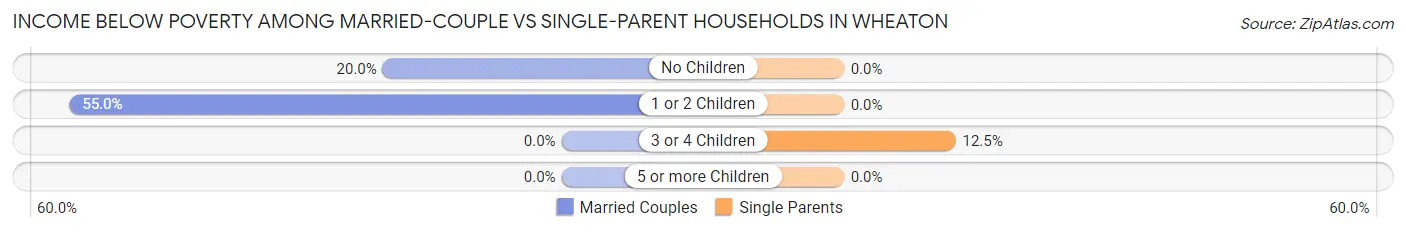
| Children | Married-Couple Families | Single-Parent Households |
| No Children | 11 (20.0%) | 0 (0.0%) |
| 1 or 2 Children | 11 (55.0%) | 0 (0.0%) |
| 3 or 4 Children | 0 (0.0%) | 1 (12.5%) |
| 5 or more Children | 0 (0.0%) | 0 (0.0%) |
| Total | 22 (23.2%) | 1 (5.9%) |
Race in Wheaton
The most populous races in Wheaton are White / Caucasian (491 | 90.8%), Two or more Races (47 | 8.7%), and Native / Alaskan (3 | 0.5%).
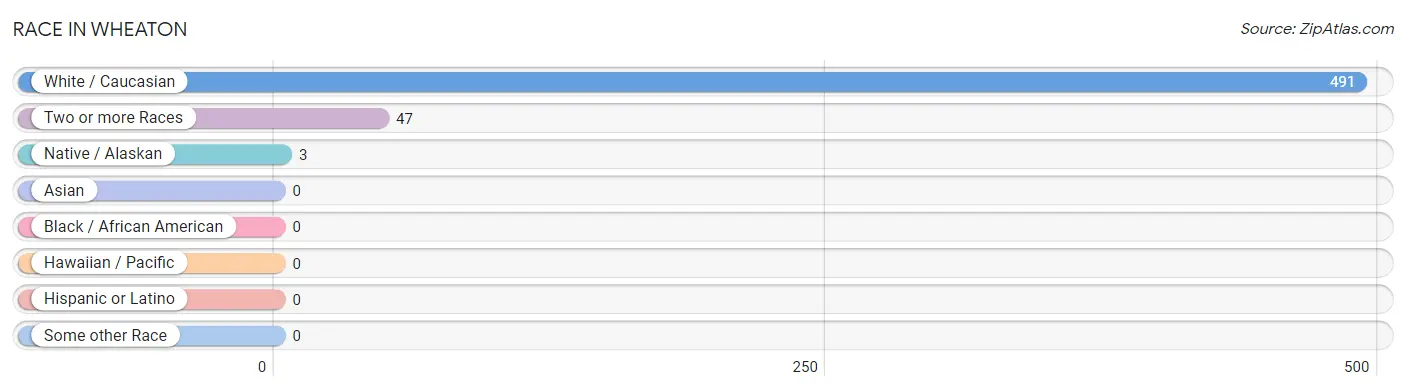
| Race | # Population | % Population |
| Asian | 0 | 0.0% |
| Black / African American | 0 | 0.0% |
| Hawaiian / Pacific | 0 | 0.0% |
| Hispanic or Latino | 0 | 0.0% |
| Native / Alaskan | 3 | 0.5% |
| White / Caucasian | 491 | 90.8% |
| Two or more Races | 47 | 8.7% |
| Some other Race | 0 | 0.0% |
| Total | 541 | 100.0% |
Ancestry in Wheaton
The most populous ancestries reported in Wheaton are German (75 | 13.9%), English (60 | 11.1%), Irish (37 | 6.8%), American (18 | 3.3%), and Scottish (15 | 2.8%), together accounting for 37.9% of all Wheaton residents.
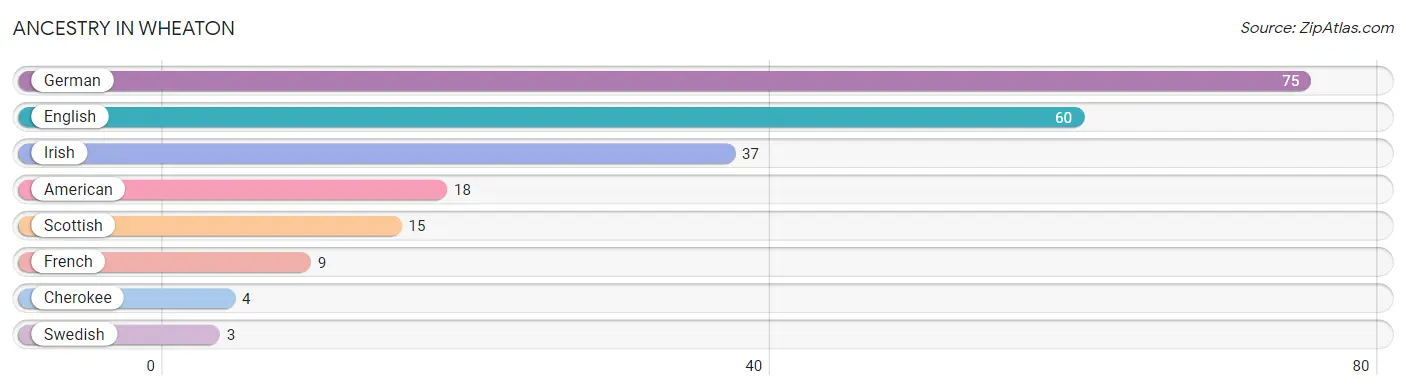
| Ancestry | # Population | % Population |
| American | 18 | 3.3% |
| Cherokee | 4 | 0.7% |
| English | 60 | 11.1% |
| French | 9 | 1.7% |
| German | 75 | 13.9% |
| Irish | 37 | 6.8% |
| Scottish | 15 | 2.8% |
| Swedish | 3 | 0.5% | View All 8 Rows |
Immigrants in Wheaton

| Immigration Origin | # Population | % Population | View All 0 Rows |
Sex and Age in Wheaton
Sex and Age in Wheaton
The most populous age groups in Wheaton are 70 to 74 Years (41 | 15.8%) for men and 30 to 34 Years (36 | 12.8%) for women.
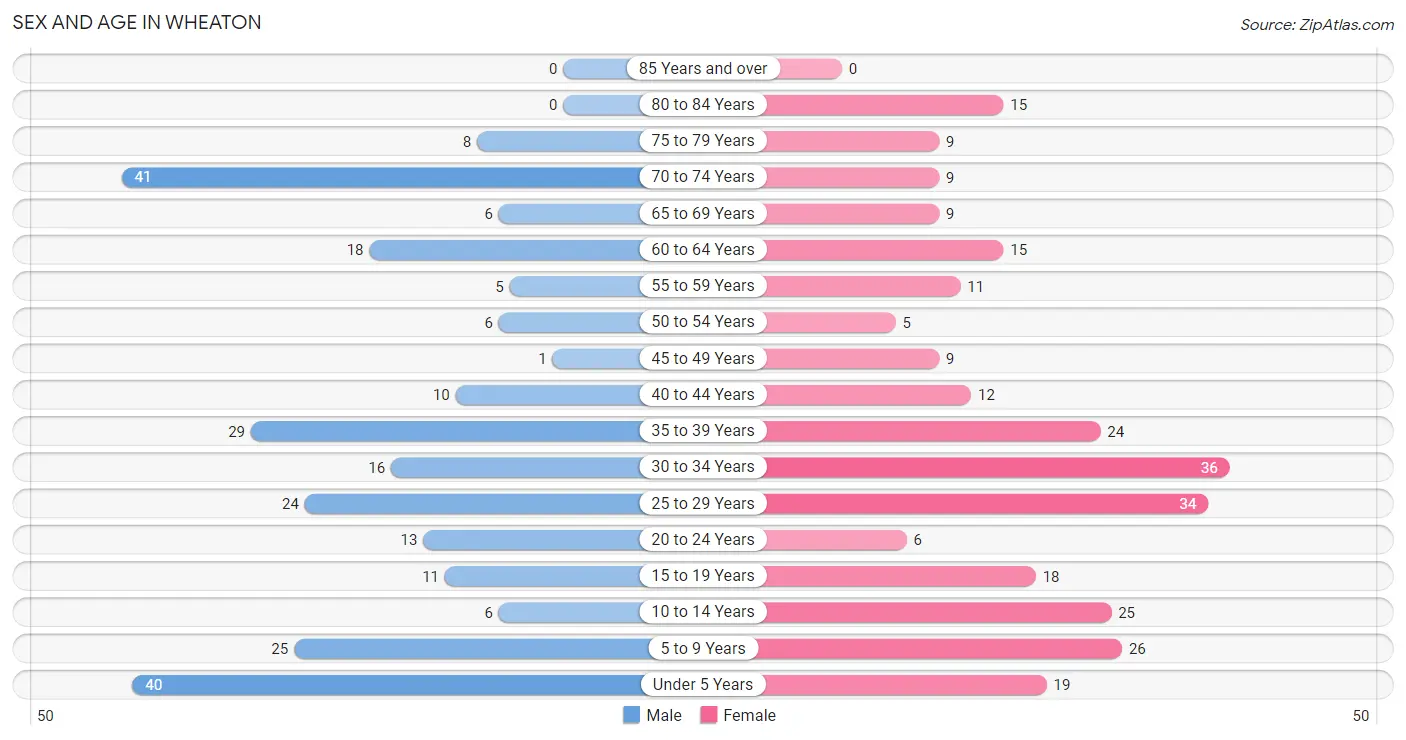
| Age Bracket | Male | Female |
| Under 5 Years | 40 (15.4%) | 19 (6.7%) |
| 5 to 9 Years | 25 (9.7%) | 26 (9.2%) |
| 10 to 14 Years | 6 (2.3%) | 25 (8.9%) |
| 15 to 19 Years | 11 (4.3%) | 18 (6.4%) |
| 20 to 24 Years | 13 (5.0%) | 6 (2.1%) |
| 25 to 29 Years | 24 (9.3%) | 34 (12.1%) |
| 30 to 34 Years | 16 (6.2%) | 36 (12.8%) |
| 35 to 39 Years | 29 (11.2%) | 24 (8.5%) |
| 40 to 44 Years | 10 (3.9%) | 12 (4.3%) |
| 45 to 49 Years | 1 (0.4%) | 9 (3.2%) |
| 50 to 54 Years | 6 (2.3%) | 5 (1.8%) |
| 55 to 59 Years | 5 (1.9%) | 11 (3.9%) |
| 60 to 64 Years | 18 (7.0%) | 15 (5.3%) |
| 65 to 69 Years | 6 (2.3%) | 9 (3.2%) |
| 70 to 74 Years | 41 (15.8%) | 9 (3.2%) |
| 75 to 79 Years | 8 (3.1%) | 9 (3.2%) |
| 80 to 84 Years | 0 (0.0%) | 15 (5.3%) |
| 85 Years and over | 0 (0.0%) | 0 (0.0%) |
| Total | 259 (100.0%) | 282 (100.0%) |
Families and Households in Wheaton
Median Family Size in Wheaton
The median family size in Wheaton is 3.47 persons per family, with single male/father families (1 | 0.9%) accounting for the largest median family size of 33 persons per family. On the other hand, single female/mother families (16 | 14.3%) represent the smallest median family size with 2.63 persons per family.
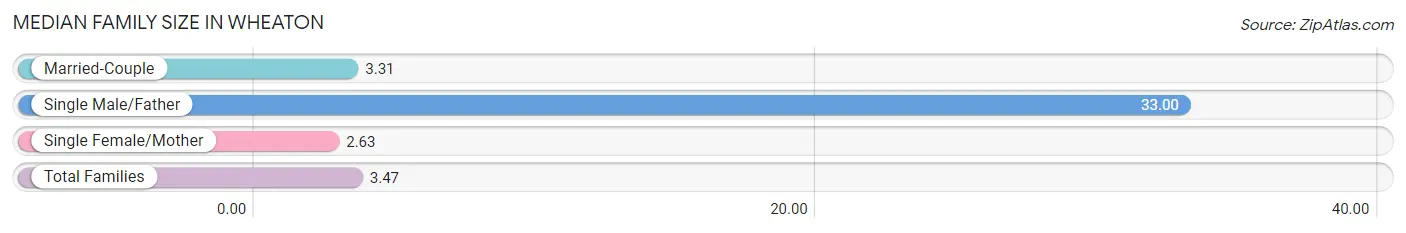
| Family Type | # Families | Family Size |
| Married-Couple | 95 (84.8%) | 3.31 |
| Single Male/Father | 1 (0.9%) | 33.00 |
| Single Female/Mother | 16 (14.3%) | 2.63 |
| Total Families | 112 (100.0%) | 3.47 |
Median Household Size in Wheaton
The median household size in Wheaton is 2.80 persons per household, with single male/father households (1 | 0.5%) accounting for the largest median household size of 55 persons per household. non-family households (81 | 42.0%) represent the smallest median household size with 1.42 persons per household.
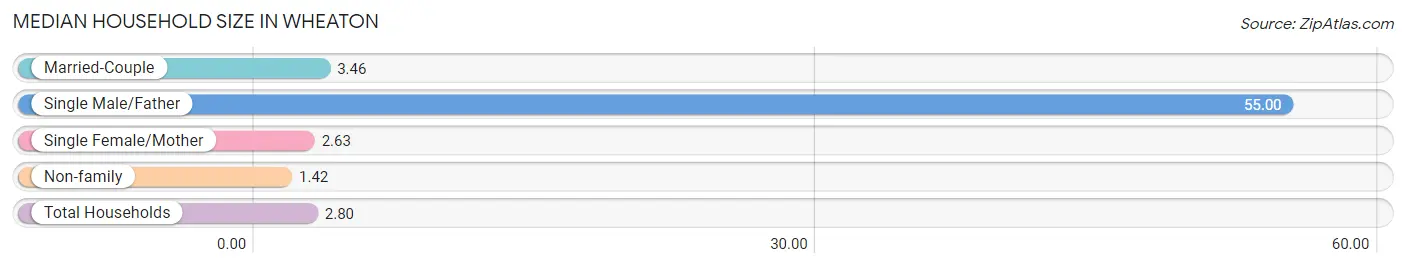
| Household Type | # Households | Household Size |
| Married-Couple | 95 (49.2%) | 3.46 |
| Single Male/Father | 1 (0.5%) | 55.00 |
| Single Female/Mother | 16 (8.3%) | 2.63 |
| Non-family | 81 (42.0%) | 1.42 |
| Total Households | 193 (100.0%) | 2.80 |
Household Size by Marriage Status in Wheaton
Out of a total of 193 households in Wheaton, 112 (58.0%) are family households, while 81 (42.0%) are nonfamily households. The most numerous type of family households are 2-person households, comprising 46, and the most common type of nonfamily households are 1-person households, comprising 69.
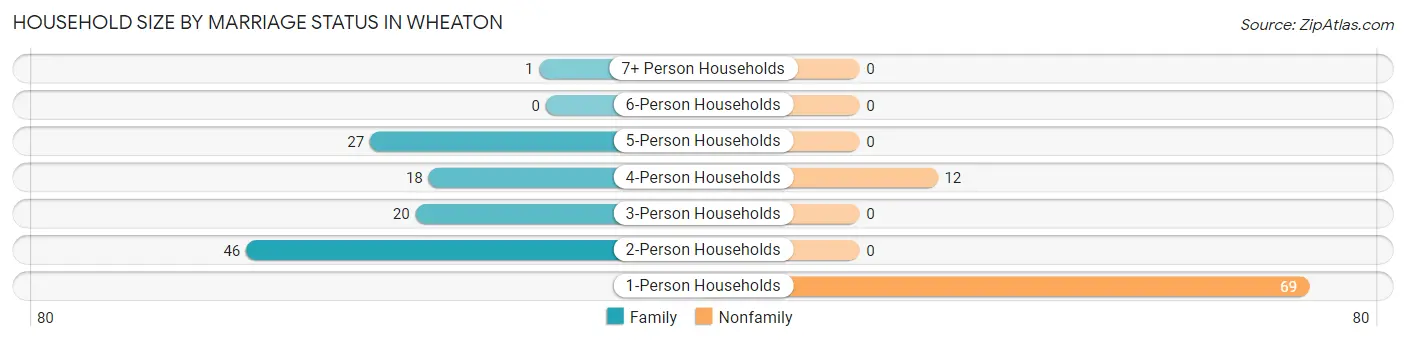
| Household Size | Family Households | Nonfamily Households |
| 1-Person Households | - | 69 (35.7%) |
| 2-Person Households | 46 (23.8%) | 0 (0.0%) |
| 3-Person Households | 20 (10.4%) | 0 (0.0%) |
| 4-Person Households | 18 (9.3%) | 12 (6.2%) |
| 5-Person Households | 27 (14.0%) | 0 (0.0%) |
| 6-Person Households | 0 (0.0%) | 0 (0.0%) |
| 7+ Person Households | 1 (0.5%) | 0 (0.0%) |
| Total | 112 (58.0%) | 81 (42.0%) |
Female Fertility in Wheaton
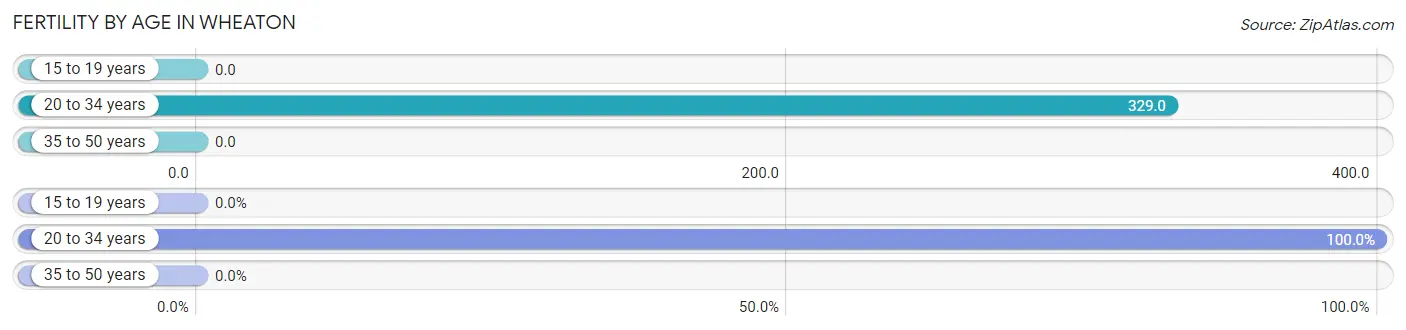
Fertility by Age in Wheaton
Average fertility rate in Wheaton is 180.0 births per 1,000 women. Women in the age bracket of 20 to 34 years have the highest fertility rate with 329.0 births per 1,000 women. Women in the age bracket of 20 to 34 years acount for 100.0% of all women with births.
| Age Bracket | Women with Births | Births / 1,000 Women |
| 15 to 19 years | 0 (0.0%) | 0.0 |
| 20 to 34 years | 25 (100.0%) | 329.0 |
| 35 to 50 years | 0 (0.0%) | 0.0 |
| Total | 25 (100.0%) | 180.0 |
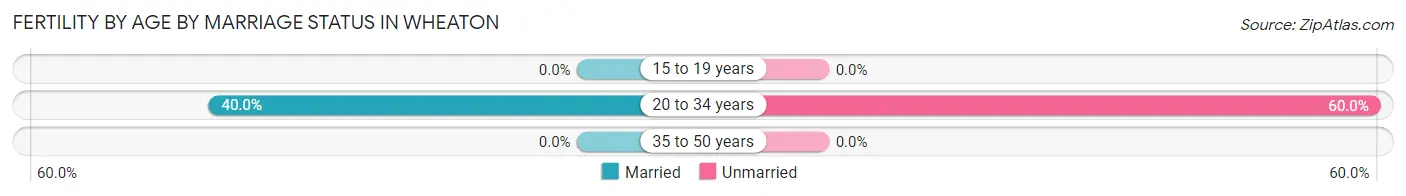
Fertility by Age by Marriage Status in Wheaton
40.0% of women with births (25) in Wheaton are married. The highest percentage of unmarried women with births falls into 20 to 34 years age bracket with 60.0% of them unmarried at the time of birth, while the lowest percentage of unmarried women with births belong to 20 to 34 years age bracket with 60.0% of them unmarried.
| Age Bracket | Married | Unmarried |
| 15 to 19 years | 0 (0.0%) | 0 (0.0%) |
| 20 to 34 years | 10 (40.0%) | 15 (60.0%) |
| 35 to 50 years | 0 (0.0%) | 0 (0.0%) |
| Total | 10 (40.0%) | 15 (60.0%) |
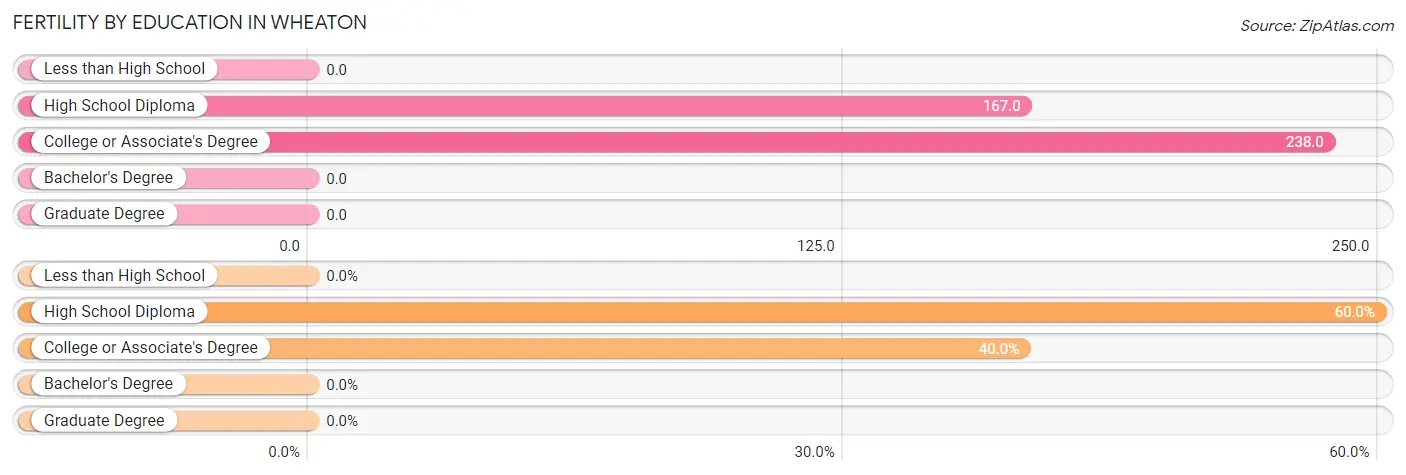
Fertility by Education in Wheaton
| Educational Attainment | Women with Births | Births / 1,000 Women |
| Less than High School | 0 (0.0%) | 0.0 |
| High School Diploma | 15 (60.0%) | 167.0 |
| College or Associate's Degree | 10 (40.0%) | 238.0 |
| Bachelor's Degree | 0 (0.0%) | 0.0 |
| Graduate Degree | 0 (0.0%) | 0.0 |
| Total | 25 (100.0%) | 180.0 |
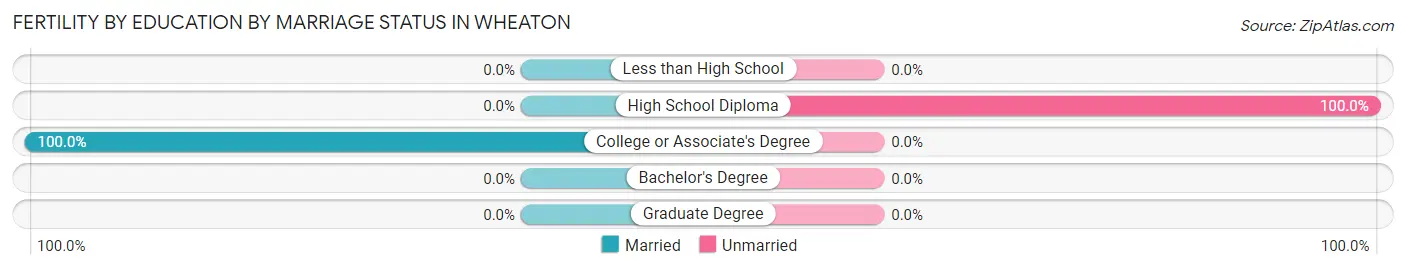
Fertility by Education by Marriage Status in Wheaton
60.0% of women with births in Wheaton are unmarried. Women with the educational attainment of college or associate's degree are most likely to be married with 100.0% of them married at childbirth, while women with the educational attainment of high school diploma are least likely to be married with 100.0% of them unmarried at childbirth.
| Educational Attainment | Married | Unmarried |
| Less than High School | 0 (0.0%) | 0 (0.0%) |
| High School Diploma | 0 (0.0%) | 15 (100.0%) |
| College or Associate's Degree | 10 (100.0%) | 0 (0.0%) |
| Bachelor's Degree | 0 (0.0%) | 0 (0.0%) |
| Graduate Degree | 0 (0.0%) | 0 (0.0%) |
| Total | 10 (40.0%) | 15 (60.0%) |
Employment Characteristics in Wheaton
Employment by Class of Employer in Wheaton
Among the 194 employed individuals in Wheaton, private company employees (129 | 66.5%), local government employees (23 | 11.9%), and self-employed (not incorporated) (18 | 9.3%) make up the most common classes of employment.
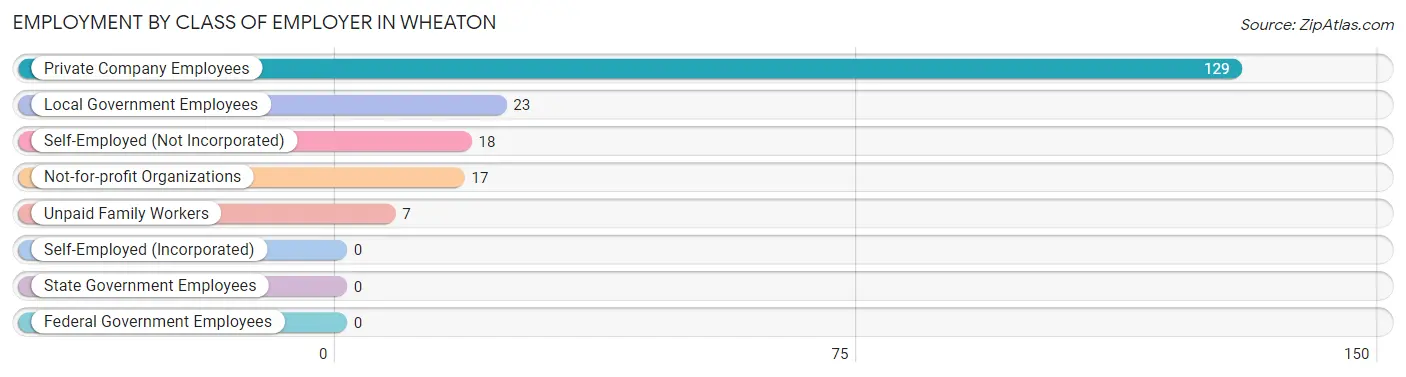
| Employer Class | # Employees | % Employees |
| Private Company Employees | 129 | 66.5% |
| Self-Employed (Incorporated) | 0 | 0.0% |
| Self-Employed (Not Incorporated) | 18 | 9.3% |
| Not-for-profit Organizations | 17 | 8.8% |
| Local Government Employees | 23 | 11.9% |
| State Government Employees | 0 | 0.0% |
| Federal Government Employees | 0 | 0.0% |
| Unpaid Family Workers | 7 | 3.6% |
| Total | 194 | 100.0% |
Employment Status by Age in Wheaton
According to the labor force statistics for Wheaton, out of the total population over 16 years of age (400), 51.3% or 205 individuals are in the labor force, with 5.4% or 11 of them unemployed. The age group with the highest labor force participation rate is 30 to 34 years, with 82.7% or 43 individuals in the labor force. Within the labor force, the 16 to 19 years age range has the highest percentage of unemployed individuals, with 46.2% or 6 of them being unemployed.
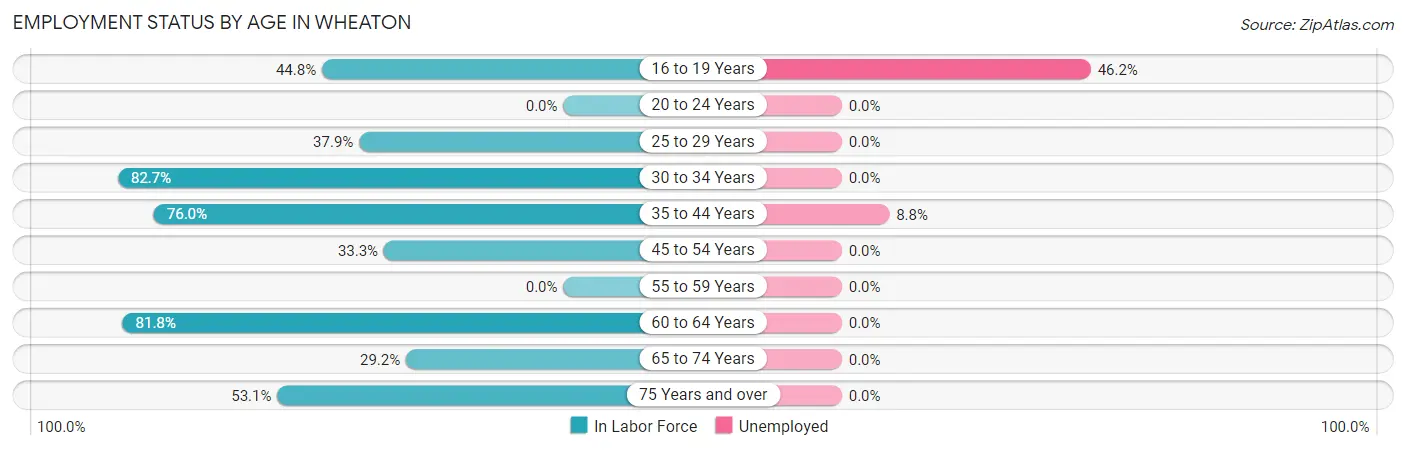
| Age Bracket | In Labor Force | Unemployed |
| 16 to 19 Years | 13 (44.8%) | 6 (46.2%) |
| 20 to 24 Years | 0 (0.0%) | 0 (0.0%) |
| 25 to 29 Years | 22 (37.9%) | 0 (0.0%) |
| 30 to 34 Years | 43 (82.7%) | 0 (0.0%) |
| 35 to 44 Years | 57 (76.0%) | 5 (8.8%) |
| 45 to 54 Years | 7 (33.3%) | 0 (0.0%) |
| 55 to 59 Years | 0 (0.0%) | 0 (0.0%) |
| 60 to 64 Years | 27 (81.8%) | 0 (0.0%) |
| 65 to 74 Years | 19 (29.2%) | 0 (0.0%) |
| 75 Years and over | 17 (53.1%) | 0 (0.0%) |
| Total | 205 (51.3%) | 11 (5.4%) |
Employment Status by Educational Attainment in Wheaton
According to labor force statistics for Wheaton, 61.2% of individuals (156) out of the total population between 25 and 64 years of age (255) are in the labor force, with 3.2% or 5 of them being unemployed. The group with the highest labor force participation rate are those with the educational attainment of college / associate degree, with 73.8% or 31 individuals in the labor force. Within the labor force, individuals with less than high school education have the highest percentage of unemployment, with 22.7% or 5 of them being unemployed.
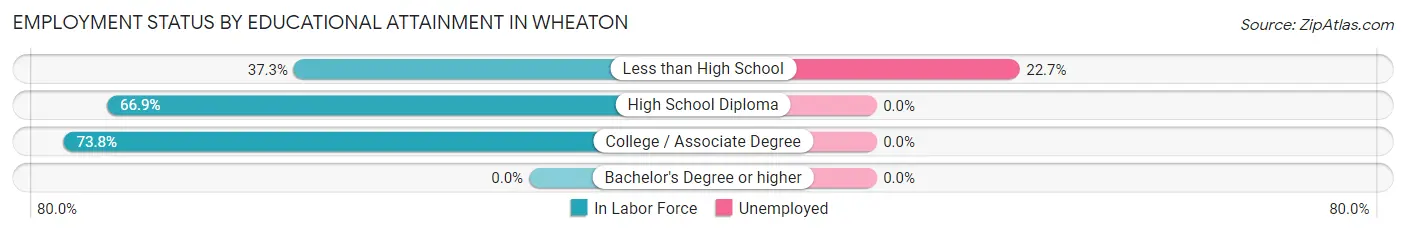
| Educational Attainment | In Labor Force | Unemployed |
| Less than High School | 22 (37.3%) | 13 (22.7%) |
| High School Diploma | 103 (66.9%) | 0 (0.0%) |
| College / Associate Degree | 31 (73.8%) | 0 (0.0%) |
| Bachelor's Degree or higher | 0 (0.0%) | 0 (0.0%) |
| Total | 156 (61.2%) | 8 (3.2%) |
Employment Occupations by Sex in Wheaton
Management, Business, Science and Arts Occupations
The most common Management, Business, Science and Arts occupations in Wheaton are Community & Social Service (10 | 5.1%), and Education, Arts & Media (10 | 5.1%).
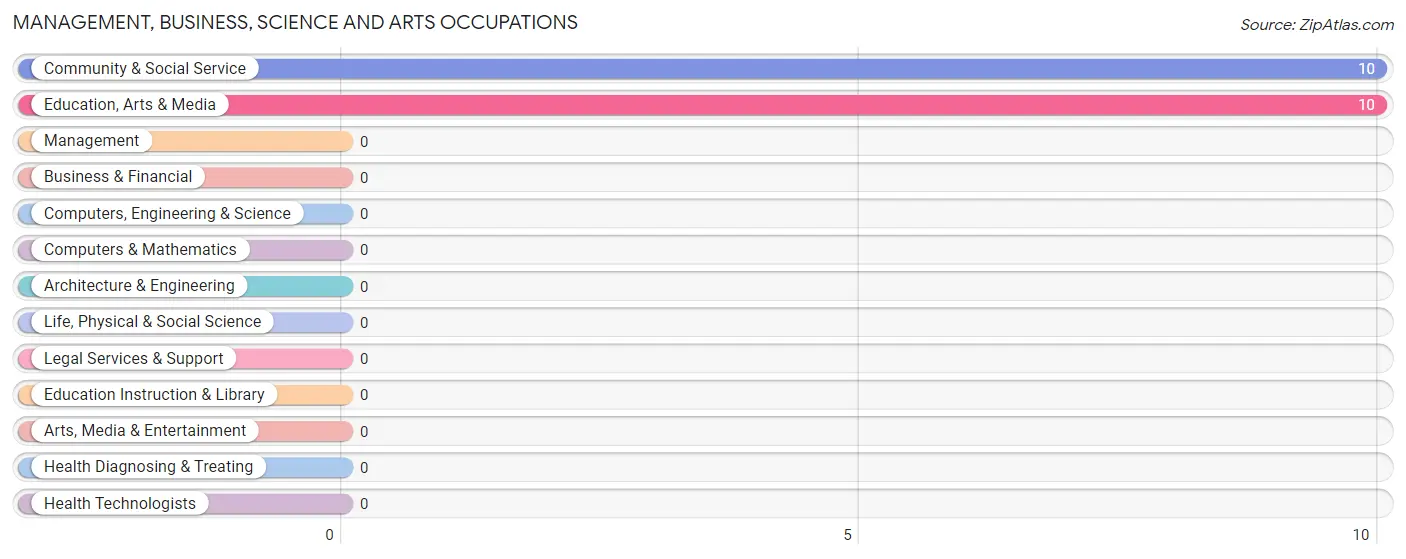
Management, Business, Science and Arts Occupations by Sex
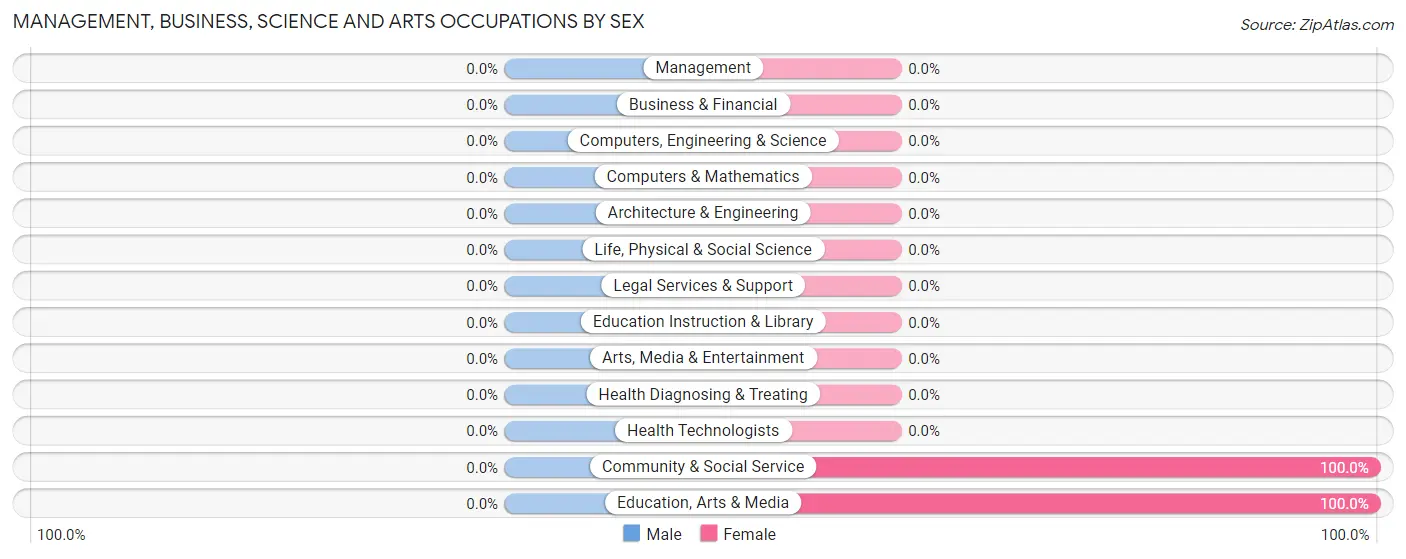
| Occupation | Male | Female |
| Management | 0 (0.0%) | 0 (0.0%) |
| Business & Financial | 0 (0.0%) | 0 (0.0%) |
| Computers, Engineering & Science | 0 (0.0%) | 0 (0.0%) |
| Computers & Mathematics | 0 (0.0%) | 0 (0.0%) |
| Architecture & Engineering | 0 (0.0%) | 0 (0.0%) |
| Life, Physical & Social Science | 0 (0.0%) | 0 (0.0%) |
| Community & Social Service | 0 (0.0%) | 10 (100.0%) |
| Education, Arts & Media | 0 (0.0%) | 10 (100.0%) |
| Legal Services & Support | 0 (0.0%) | 0 (0.0%) |
| Education Instruction & Library | 0 (0.0%) | 0 (0.0%) |
| Arts, Media & Entertainment | 0 (0.0%) | 0 (0.0%) |
| Health Diagnosing & Treating | 0 (0.0%) | 0 (0.0%) |
| Health Technologists | 0 (0.0%) | 0 (0.0%) |
| Total (Category) | 0 (0.0%) | 10 (100.0%) |
| Total (Overall) | 92 (47.4%) | 102 (52.6%) |
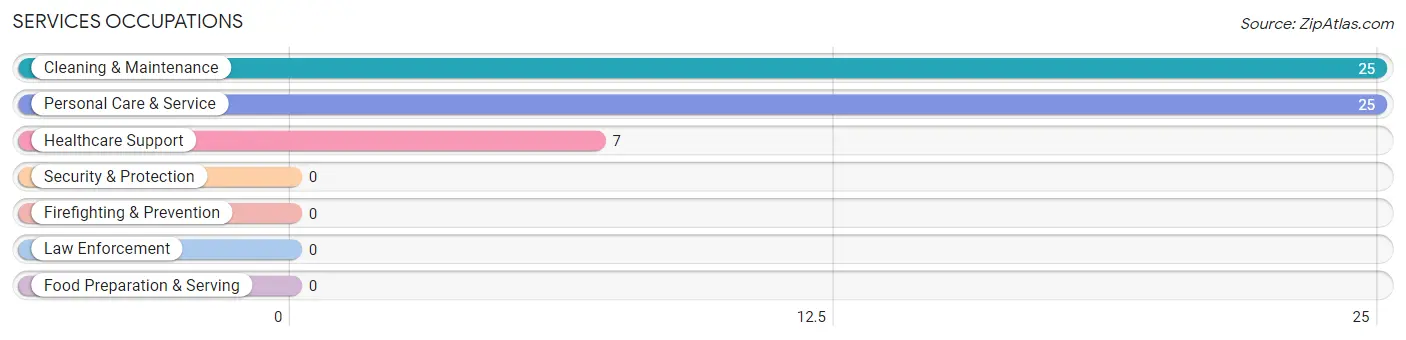
Services Occupations
The most common Services occupations in Wheaton are Cleaning & Maintenance (25 | 12.9%), Personal Care & Service (25 | 12.9%), and Healthcare Support (7 | 3.6%).
Services Occupations by Sex
Within the Services occupations in Wheaton, the most male-oriented occupations are Cleaning & Maintenance (100.0%), and Personal Care & Service (36.0%), while the most female-oriented occupations are Healthcare Support (100.0%), and Personal Care & Service (64.0%).
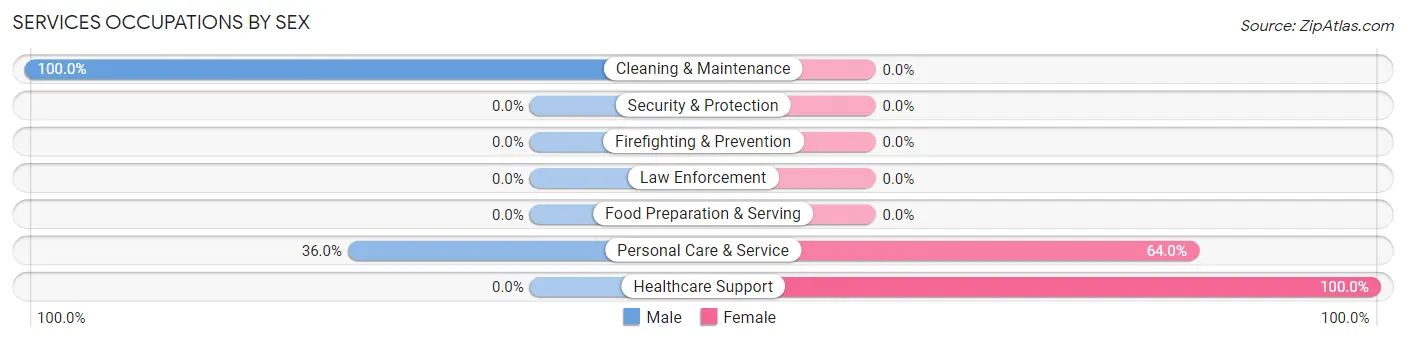
| Occupation | Male | Female |
| Healthcare Support | 0 (0.0%) | 7 (100.0%) |
| Security & Protection | 0 (0.0%) | 0 (0.0%) |
| Firefighting & Prevention | 0 (0.0%) | 0 (0.0%) |
| Law Enforcement | 0 (0.0%) | 0 (0.0%) |
| Food Preparation & Serving | 0 (0.0%) | 0 (0.0%) |
| Cleaning & Maintenance | 25 (100.0%) | 0 (0.0%) |
| Personal Care & Service | 9 (36.0%) | 16 (64.0%) |
| Total (Category) | 34 (59.7%) | 23 (40.4%) |
| Total (Overall) | 92 (47.4%) | 102 (52.6%) |
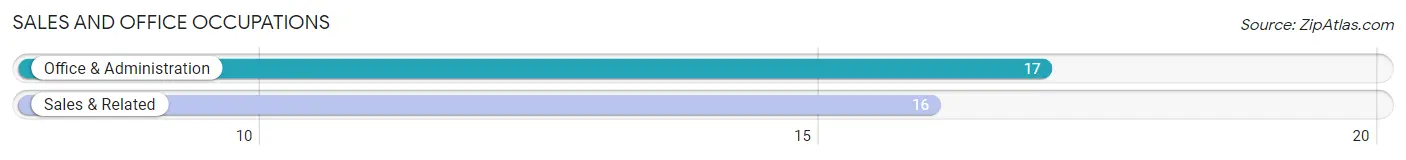
Sales and Office Occupations
The most common Sales and Office occupations in Wheaton are Office & Administration (17 | 8.8%), and Sales & Related (16 | 8.3%).
Sales and Office Occupations by Sex
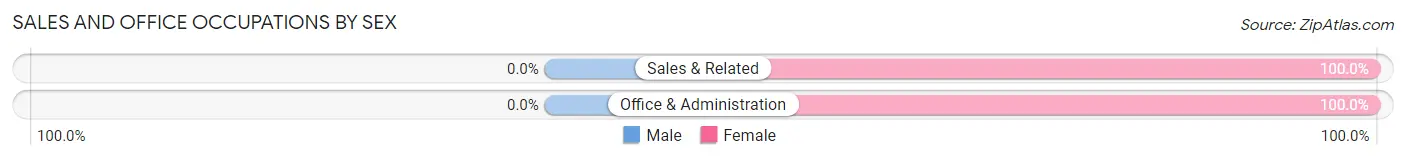
| Occupation | Male | Female |
| Sales & Related | 0 (0.0%) | 16 (100.0%) |
| Office & Administration | 0 (0.0%) | 17 (100.0%) |
| Total (Category) | 0 (0.0%) | 33 (100.0%) |
| Total (Overall) | 92 (47.4%) | 102 (52.6%) |
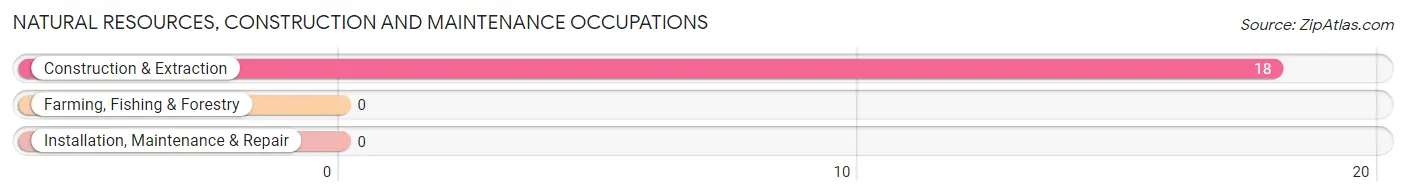
Natural Resources, Construction and Maintenance Occupations
The most common Natural Resources, Construction and Maintenance occupations in Wheaton are , and Construction & Extraction (18 | 9.3%).
Natural Resources, Construction and Maintenance Occupations by Sex
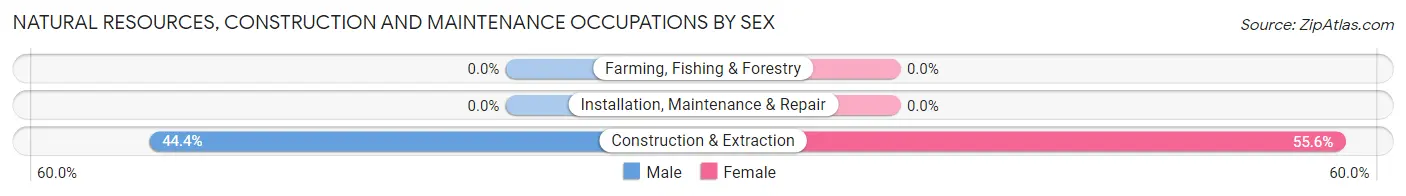
| Occupation | Male | Female |
| Farming, Fishing & Forestry | 0 (0.0%) | 0 (0.0%) |
| Construction & Extraction | 8 (44.4%) | 10 (55.6%) |
| Installation, Maintenance & Repair | 0 (0.0%) | 0 (0.0%) |
| Total (Category) | 8 (44.4%) | 10 (55.6%) |
| Total (Overall) | 92 (47.4%) | 102 (52.6%) |
Production, Transportation and Moving Occupations
The most common Production, Transportation and Moving occupations in Wheaton are Production (47 | 24.2%), Transportation (17 | 8.8%), and Material Moving (12 | 6.2%).
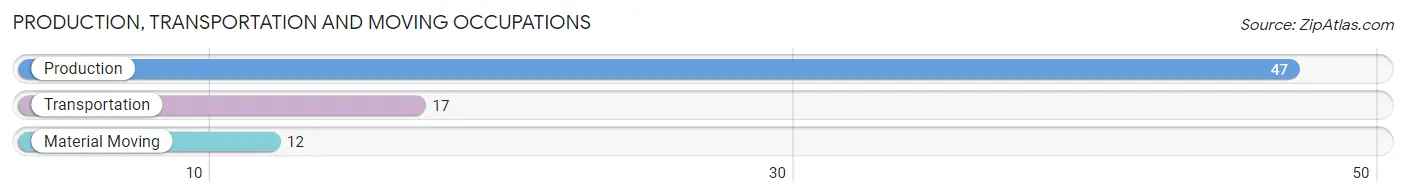
Production, Transportation and Moving Occupations by Sex
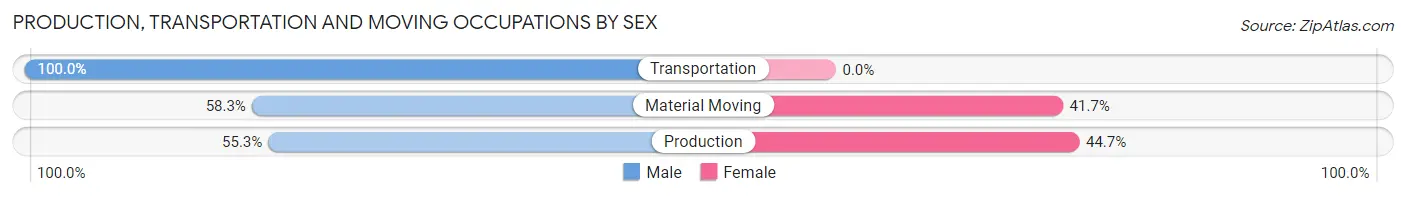
| Occupation | Male | Female |
| Production | 26 (55.3%) | 21 (44.7%) |
| Transportation | 17 (100.0%) | 0 (0.0%) |
| Material Moving | 7 (58.3%) | 5 (41.7%) |
| Total (Category) | 50 (65.8%) | 26 (34.2%) |
| Total (Overall) | 92 (47.4%) | 102 (52.6%) |
Employment Industries by Sex in Wheaton
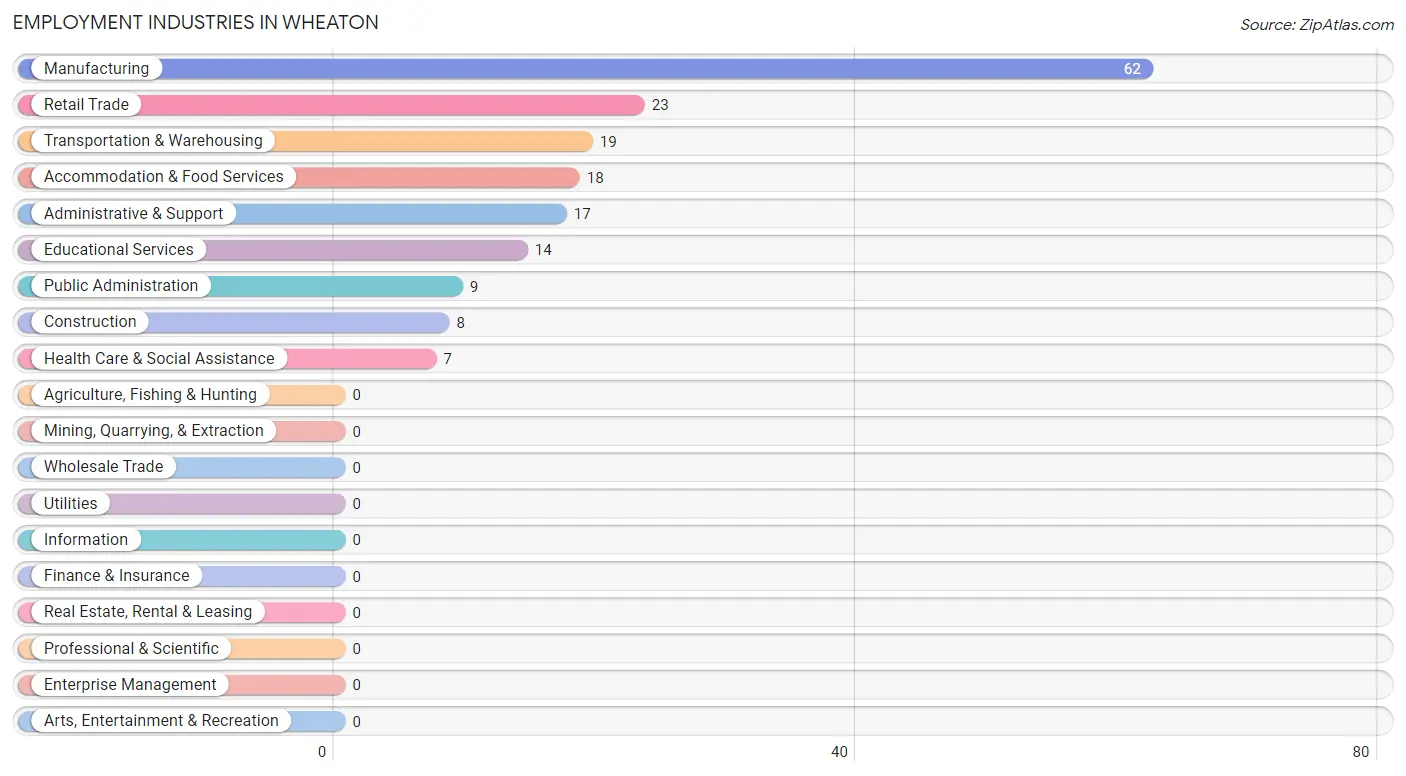
Employment Industries in Wheaton
The major employment industries in Wheaton include Manufacturing (62 | 32.0%), Retail Trade (23 | 11.9%), Transportation & Warehousing (19 | 9.8%), Accommodation & Food Services (18 | 9.3%), and Administrative & Support (17 | 8.8%).
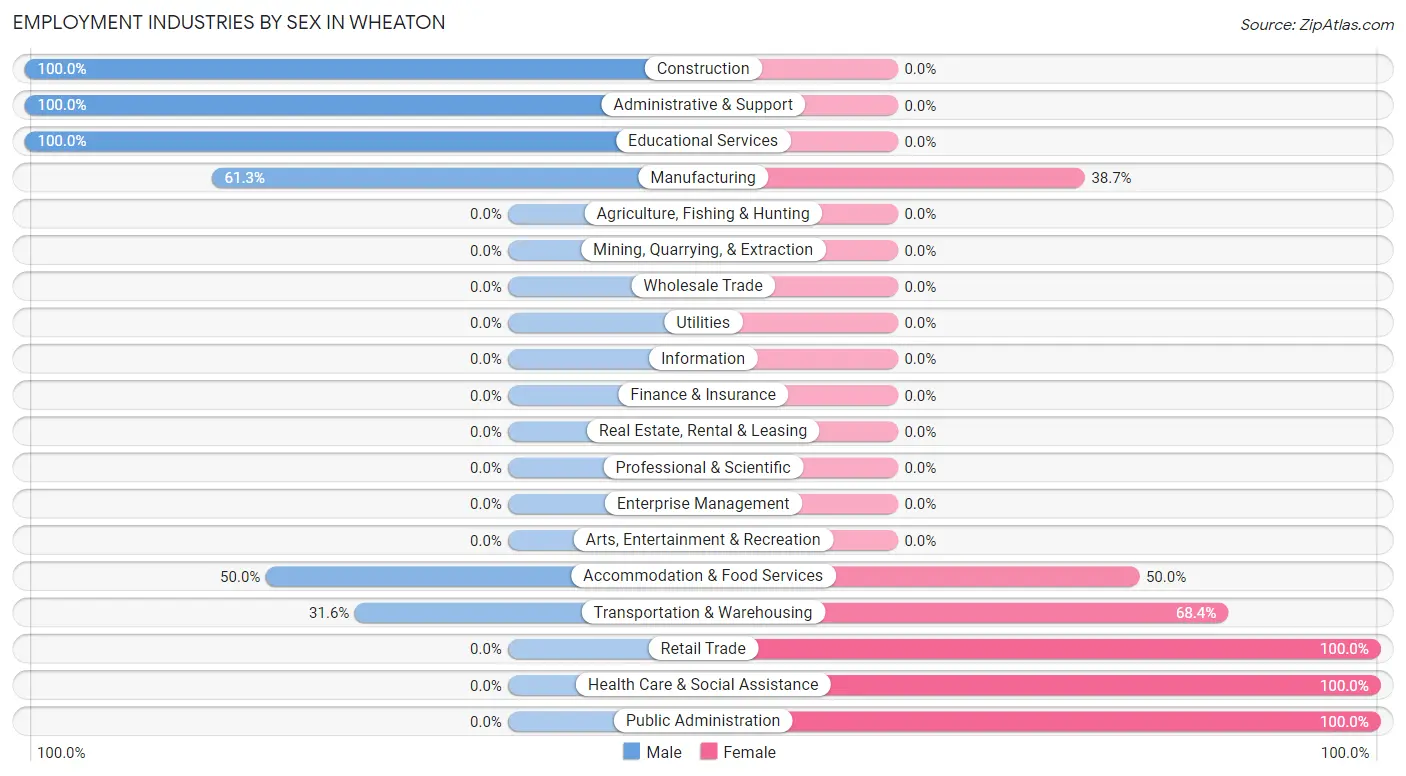
Employment Industries by Sex in Wheaton
The Wheaton industries that see more men than women are Construction (100.0%), Administrative & Support (100.0%), and Educational Services (100.0%), whereas the industries that tend to have a higher number of women are Retail Trade (100.0%), Health Care & Social Assistance (100.0%), and Public Administration (100.0%).
| Industry | Male | Female |
| Agriculture, Fishing & Hunting | 0 (0.0%) | 0 (0.0%) |
| Mining, Quarrying, & Extraction | 0 (0.0%) | 0 (0.0%) |
| Construction | 8 (100.0%) | 0 (0.0%) |
| Manufacturing | 38 (61.3%) | 24 (38.7%) |
| Wholesale Trade | 0 (0.0%) | 0 (0.0%) |
| Retail Trade | 0 (0.0%) | 23 (100.0%) |
| Transportation & Warehousing | 6 (31.6%) | 13 (68.4%) |
| Utilities | 0 (0.0%) | 0 (0.0%) |
| Information | 0 (0.0%) | 0 (0.0%) |
| Finance & Insurance | 0 (0.0%) | 0 (0.0%) |
| Real Estate, Rental & Leasing | 0 (0.0%) | 0 (0.0%) |
| Professional & Scientific | 0 (0.0%) | 0 (0.0%) |
| Enterprise Management | 0 (0.0%) | 0 (0.0%) |
| Administrative & Support | 17 (100.0%) | 0 (0.0%) |
| Educational Services | 14 (100.0%) | 0 (0.0%) |
| Health Care & Social Assistance | 0 (0.0%) | 7 (100.0%) |
| Arts, Entertainment & Recreation | 0 (0.0%) | 0 (0.0%) |
| Accommodation & Food Services | 9 (50.0%) | 9 (50.0%) |
| Public Administration | 0 (0.0%) | 9 (100.0%) |
| Total | 92 (47.4%) | 102 (52.6%) |
Education in Wheaton
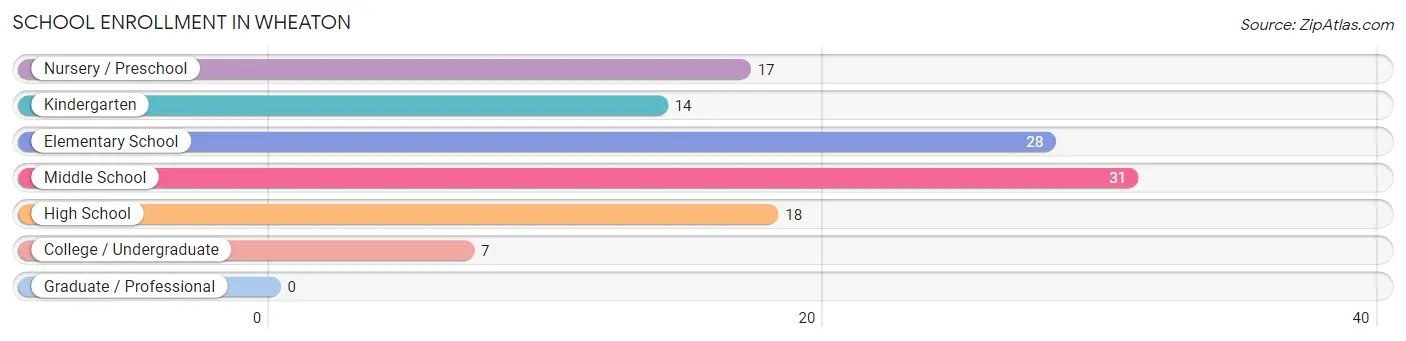
School Enrollment in Wheaton
The most common levels of schooling among the 115 students in Wheaton are middle school (31 | 27.0%), elementary school (28 | 24.3%), and high school (18 | 15.7%).
| School Level | # Students | % Students |
| Nursery / Preschool | 17 | 14.8% |
| Kindergarten | 14 | 12.2% |
| Elementary School | 28 | 24.3% |
| Middle School | 31 | 27.0% |
| High School | 18 | 15.7% |
| College / Undergraduate | 7 | 6.1% |
| Graduate / Professional | 0 | 0.0% |
| Total | 115 | 100.0% |
School Enrollment by Age by Funding Source in Wheaton
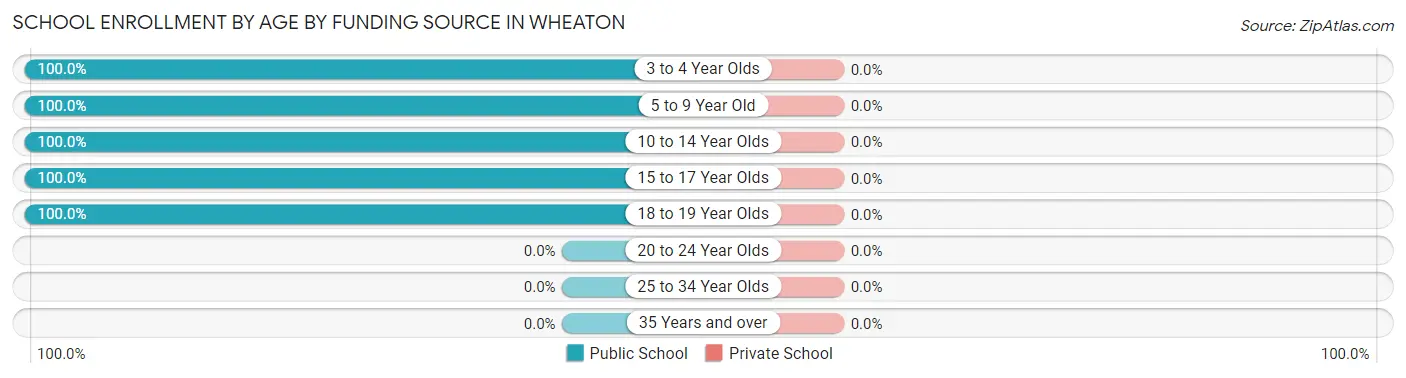
| Age Bracket | Public School | Private School |
| 3 to 4 Year Olds | 8 (100.0%) | 0 (0.0%) |
| 5 to 9 Year Old | 51 (100.0%) | 0 (0.0%) |
| 10 to 14 Year Olds | 31 (100.0%) | 0 (0.0%) |
| 15 to 17 Year Olds | 7 (100.0%) | 0 (0.0%) |
| 18 to 19 Year Olds | 18 (100.0%) | 0 (0.0%) |
| 20 to 24 Year Olds | 0 (0.0%) | 0 (0.0%) |
| 25 to 34 Year Olds | 0 (0.0%) | 0 (0.0%) |
| 35 Years and over | 0 (0.0%) | 0 (0.0%) |
| Total | 115 (100.0%) | 0 (0.0%) |
Educational Attainment by Field of Study in Wheaton
, and bio, nature & agricultural (18 | 100.0%) are the most common fields of study among 18 individuals in Wheaton who have obtained a bachelor's degree or higher.
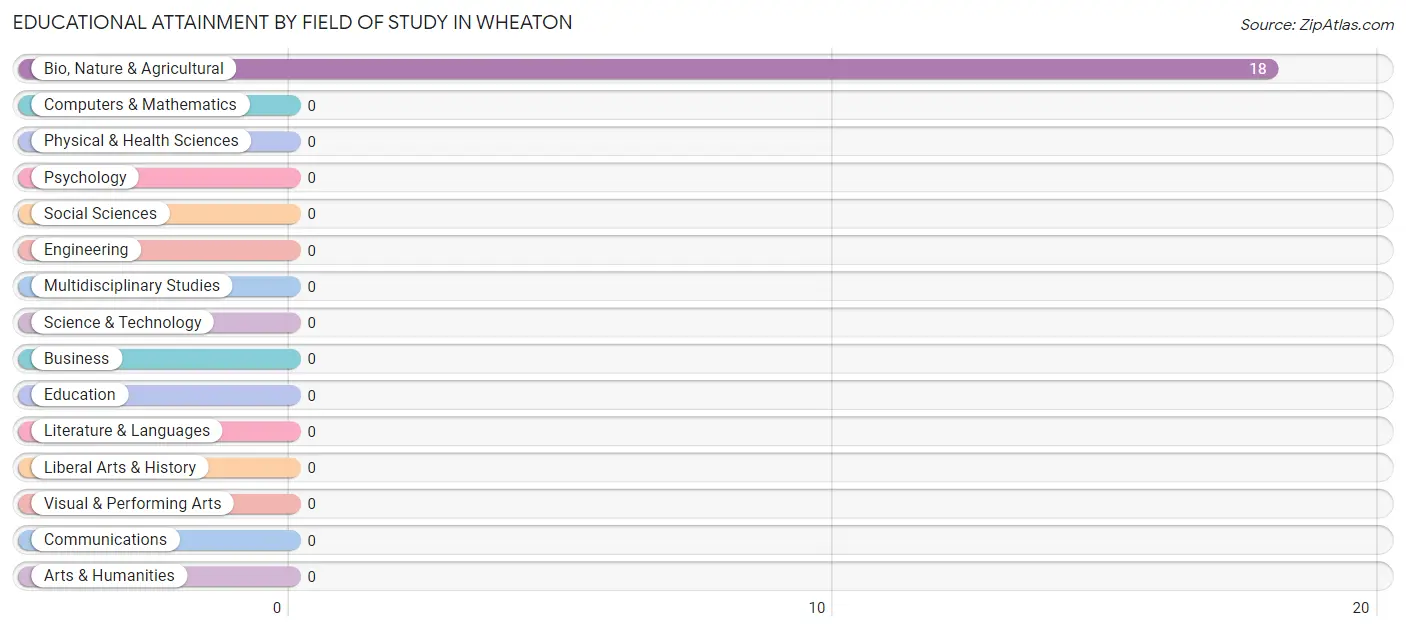
| Field of Study | # Graduates | % Graduates |
| Computers & Mathematics | 0 | 0.0% |
| Bio, Nature & Agricultural | 18 | 100.0% |
| Physical & Health Sciences | 0 | 0.0% |
| Psychology | 0 | 0.0% |
| Social Sciences | 0 | 0.0% |
| Engineering | 0 | 0.0% |
| Multidisciplinary Studies | 0 | 0.0% |
| Science & Technology | 0 | 0.0% |
| Business | 0 | 0.0% |
| Education | 0 | 0.0% |
| Literature & Languages | 0 | 0.0% |
| Liberal Arts & History | 0 | 0.0% |
| Visual & Performing Arts | 0 | 0.0% |
| Communications | 0 | 0.0% |
| Arts & Humanities | 0 | 0.0% |
| Total | 18 | 100.0% |
Transportation & Commute in Wheaton
Vehicle Availability by Sex in Wheaton
The most prevalent vehicle ownership categories in Wheaton are males with 2 vehicles (56, accounting for 60.9%) and females with 2 vehicles (82, making up 54.9%).
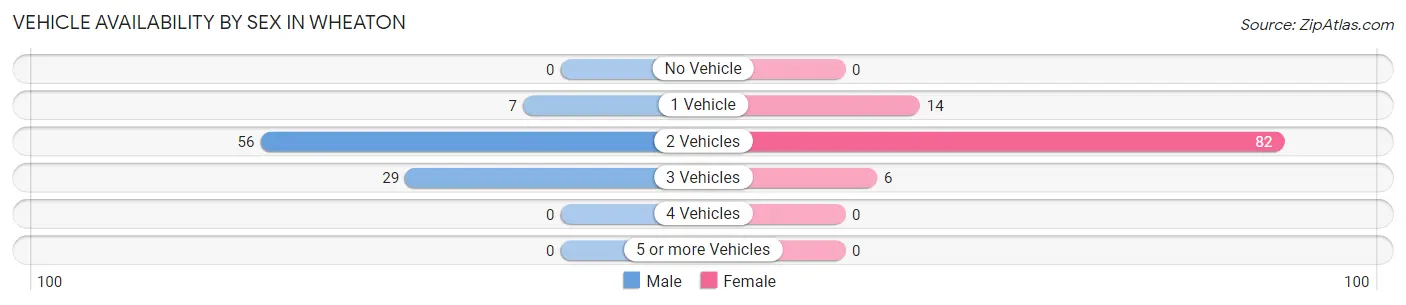
| Vehicles Available | Male | Female |
| No Vehicle | 0 (0.0%) | 0 (0.0%) |
| 1 Vehicle | 7 (7.6%) | 14 (13.7%) |
| 2 Vehicles | 56 (60.9%) | 82 (80.4%) |
| 3 Vehicles | 29 (31.5%) | 6 (5.9%) |
| 4 Vehicles | 0 (0.0%) | 0 (0.0%) |
| 5 or more Vehicles | 0 (0.0%) | 0 (0.0%) |
| Total | 92 (100.0%) | 102 (100.0%) |
Commute Time in Wheaton
The most frequently occuring commute durations in Wheaton are 20 to 24 minutes (69 commuters, 35.6%), 5 to 9 minutes (43 commuters, 22.2%), and 25 to 29 minutes (38 commuters, 19.6%).
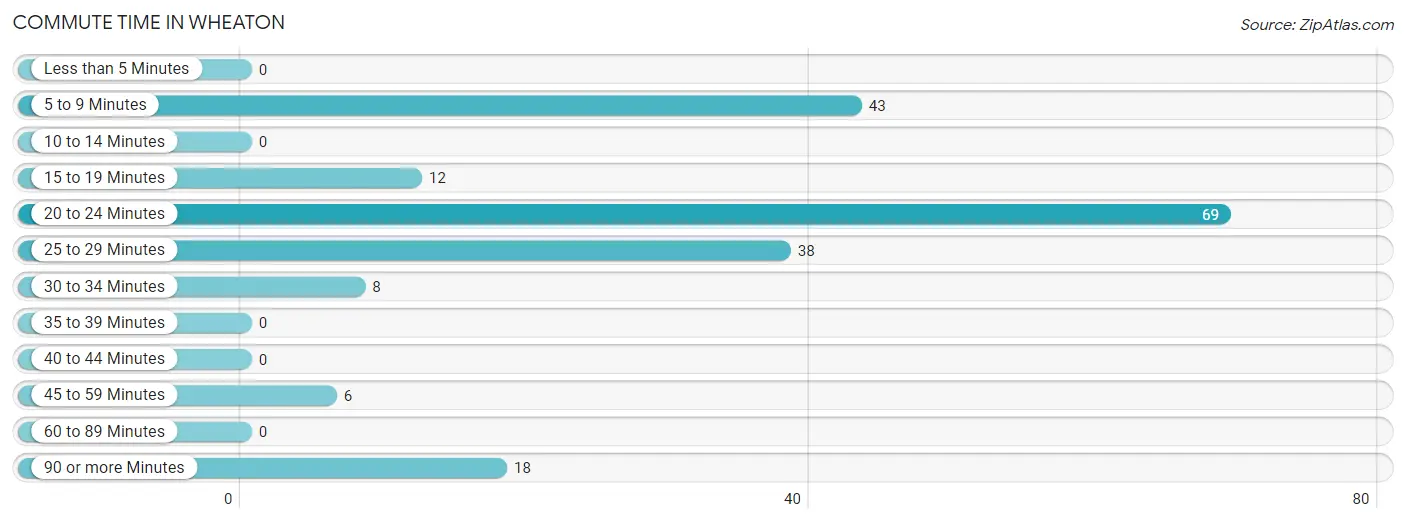
| Commute Time | # Commuters | % Commuters |
| Less than 5 Minutes | 0 | 0.0% |
| 5 to 9 Minutes | 43 | 22.2% |
| 10 to 14 Minutes | 0 | 0.0% |
| 15 to 19 Minutes | 12 | 6.2% |
| 20 to 24 Minutes | 69 | 35.6% |
| 25 to 29 Minutes | 38 | 19.6% |
| 30 to 34 Minutes | 8 | 4.1% |
| 35 to 39 Minutes | 0 | 0.0% |
| 40 to 44 Minutes | 0 | 0.0% |
| 45 to 59 Minutes | 6 | 3.1% |
| 60 to 89 Minutes | 0 | 0.0% |
| 90 or more Minutes | 18 | 9.3% |
Commute Time by Sex in Wheaton
The most common commute times in Wheaton are 20 to 24 minutes (52 commuters, 56.5%) for males and 25 to 29 minutes (33 commuters, 32.4%) for females.
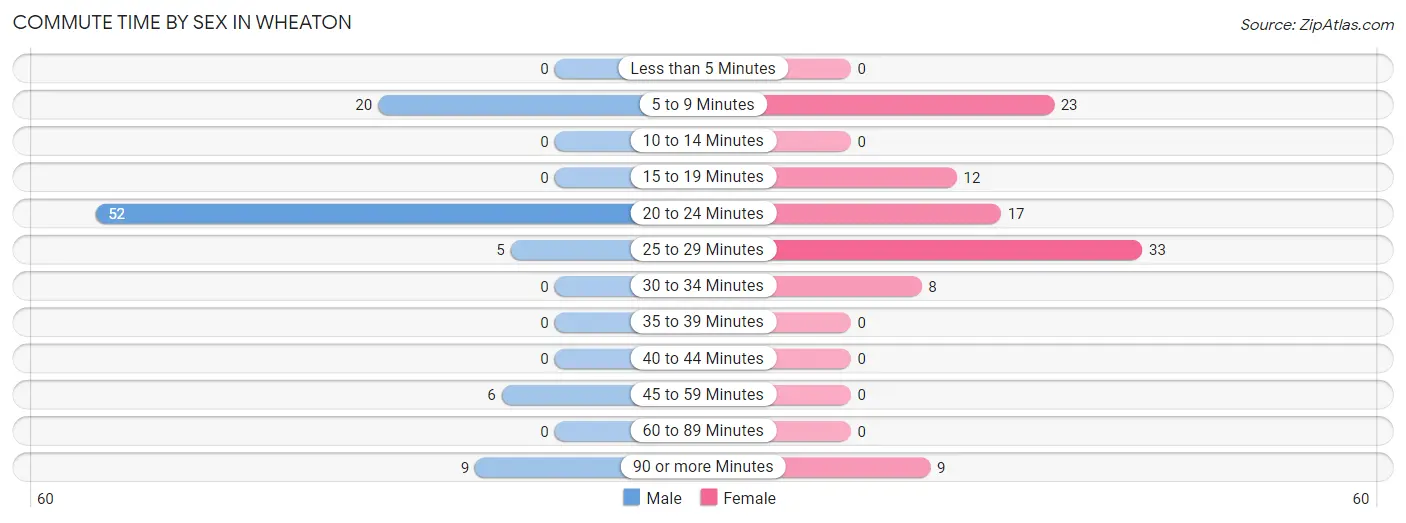
| Commute Time | Male | Female |
| Less than 5 Minutes | 0 (0.0%) | 0 (0.0%) |
| 5 to 9 Minutes | 20 (21.7%) | 23 (22.6%) |
| 10 to 14 Minutes | 0 (0.0%) | 0 (0.0%) |
| 15 to 19 Minutes | 0 (0.0%) | 12 (11.8%) |
| 20 to 24 Minutes | 52 (56.5%) | 17 (16.7%) |
| 25 to 29 Minutes | 5 (5.4%) | 33 (32.4%) |
| 30 to 34 Minutes | 0 (0.0%) | 8 (7.8%) |
| 35 to 39 Minutes | 0 (0.0%) | 0 (0.0%) |
| 40 to 44 Minutes | 0 (0.0%) | 0 (0.0%) |
| 45 to 59 Minutes | 6 (6.5%) | 0 (0.0%) |
| 60 to 89 Minutes | 0 (0.0%) | 0 (0.0%) |
| 90 or more Minutes | 9 (9.8%) | 9 (8.8%) |
Time of Departure to Work by Sex in Wheaton
The most frequent times of departure to work in Wheaton are 12:00 PM to 3:59 PM (26, 28.3%) for males and 12:00 PM to 3:59 PM (23, 22.6%) for females.
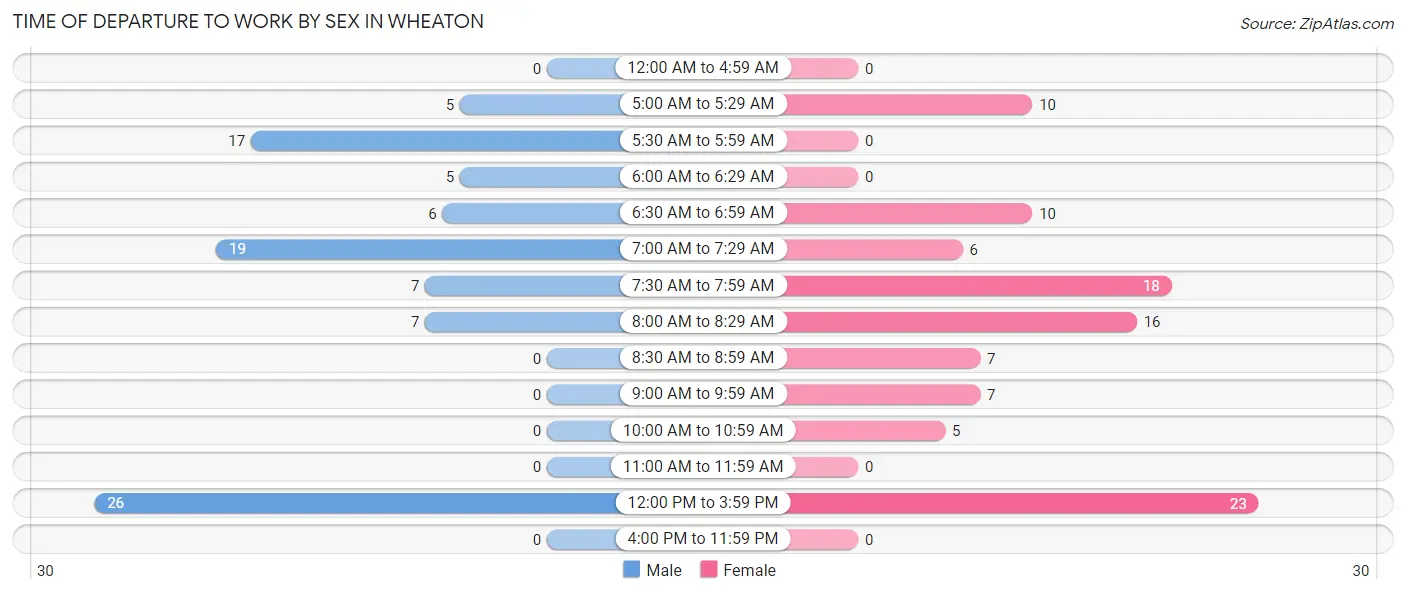
| Time of Departure | Male | Female |
| 12:00 AM to 4:59 AM | 0 (0.0%) | 0 (0.0%) |
| 5:00 AM to 5:29 AM | 5 (5.4%) | 10 (9.8%) |
| 5:30 AM to 5:59 AM | 17 (18.5%) | 0 (0.0%) |
| 6:00 AM to 6:29 AM | 5 (5.4%) | 0 (0.0%) |
| 6:30 AM to 6:59 AM | 6 (6.5%) | 10 (9.8%) |
| 7:00 AM to 7:29 AM | 19 (20.6%) | 6 (5.9%) |
| 7:30 AM to 7:59 AM | 7 (7.6%) | 18 (17.6%) |
| 8:00 AM to 8:29 AM | 7 (7.6%) | 16 (15.7%) |
| 8:30 AM to 8:59 AM | 0 (0.0%) | 7 (6.9%) |
| 9:00 AM to 9:59 AM | 0 (0.0%) | 7 (6.9%) |
| 10:00 AM to 10:59 AM | 0 (0.0%) | 5 (4.9%) |
| 11:00 AM to 11:59 AM | 0 (0.0%) | 0 (0.0%) |
| 12:00 PM to 3:59 PM | 26 (28.3%) | 23 (22.6%) |
| 4:00 PM to 11:59 PM | 0 (0.0%) | 0 (0.0%) |
| Total | 92 (100.0%) | 102 (100.0%) |
Housing Occupancy in Wheaton
Occupancy by Ownership in Wheaton
Of the total 193 dwellings in Wheaton, owner-occupied units account for 92 (47.7%), while renter-occupied units make up 101 (52.3%).
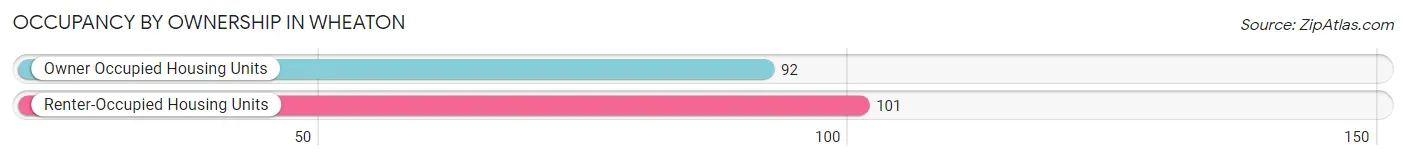
| Occupancy | # Housing Units | % Housing Units |
| Owner Occupied Housing Units | 92 | 47.7% |
| Renter-Occupied Housing Units | 101 | 52.3% |
| Total Occupied Housing Units | 193 | 100.0% |
Occupancy by Household Size in Wheaton
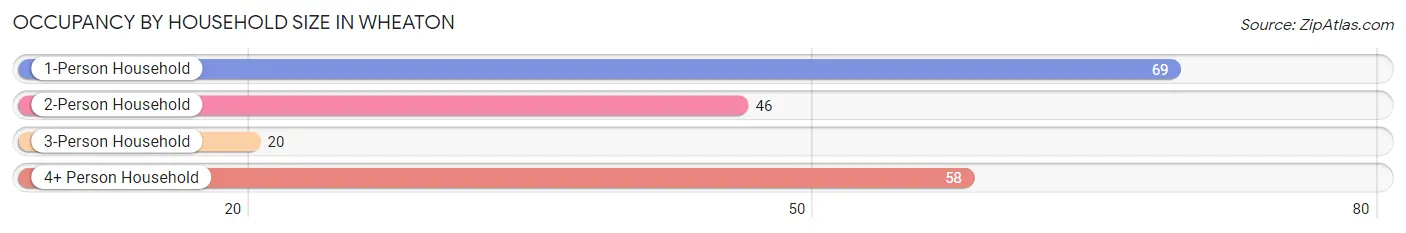
| Household Size | # Housing Units | % Housing Units |
| 1-Person Household | 69 | 35.7% |
| 2-Person Household | 46 | 23.8% |
| 3-Person Household | 20 | 10.4% |
| 4+ Person Household | 58 | 30.0% |
| Total Housing Units | 193 | 100.0% |
Occupancy by Ownership by Household Size in Wheaton
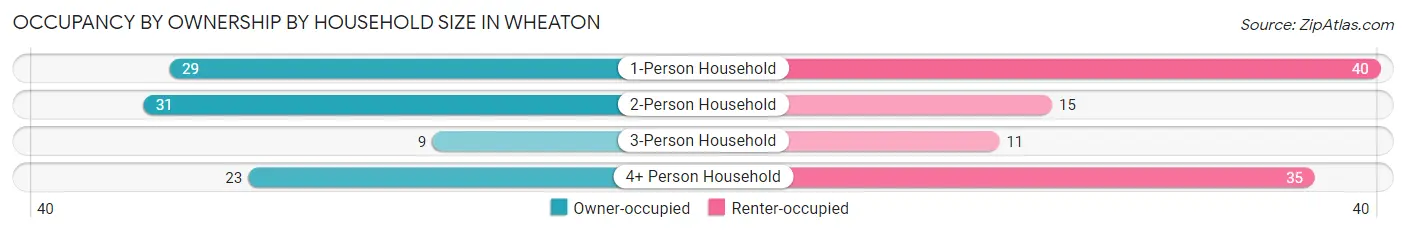
| Household Size | Owner-occupied | Renter-occupied |
| 1-Person Household | 29 (42.0%) | 40 (58.0%) |
| 2-Person Household | 31 (67.4%) | 15 (32.6%) |
| 3-Person Household | 9 (45.0%) | 11 (55.0%) |
| 4+ Person Household | 23 (39.7%) | 35 (60.3%) |
| Total Housing Units | 92 (47.7%) | 101 (52.3%) |
Occupancy by Educational Attainment in Wheaton
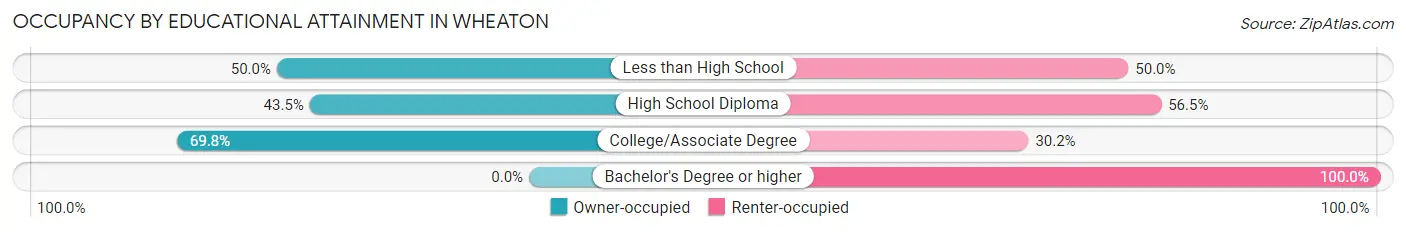
| Household Size | Owner-occupied | Renter-occupied |
| Less than High School | 15 (50.0%) | 15 (50.0%) |
| High School Diploma | 40 (43.5%) | 52 (56.5%) |
| College/Associate Degree | 37 (69.8%) | 16 (30.2%) |
| Bachelor's Degree or higher | 0 (0.0%) | 18 (100.0%) |
Occupancy by Age of Householder in Wheaton
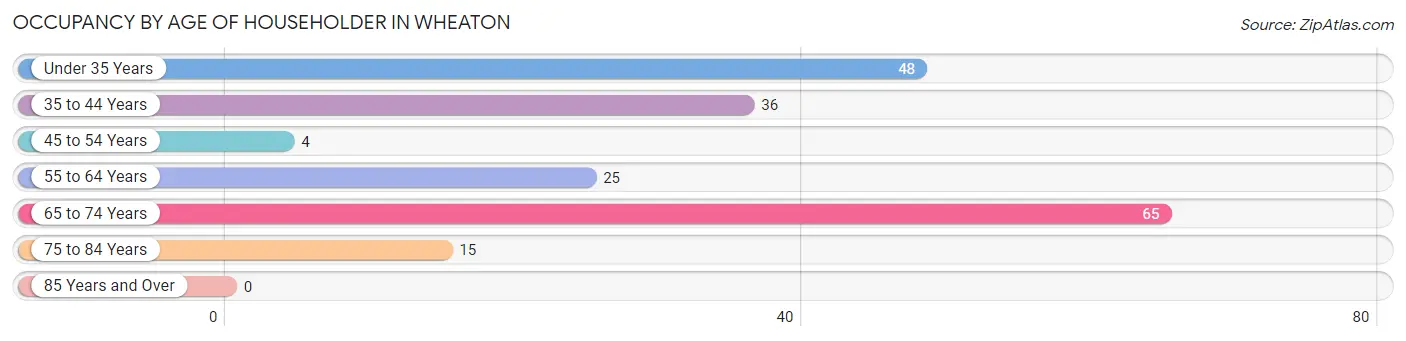
| Age Bracket | # Households | % Households |
| Under 35 Years | 48 | 24.9% |
| 35 to 44 Years | 36 | 18.6% |
| 45 to 54 Years | 4 | 2.1% |
| 55 to 64 Years | 25 | 13.0% |
| 65 to 74 Years | 65 | 33.7% |
| 75 to 84 Years | 15 | 7.8% |
| 85 Years and Over | 0 | 0.0% |
| Total | 193 | 100.0% |
Housing Finances in Wheaton
Median Income by Occupancy in Wheaton
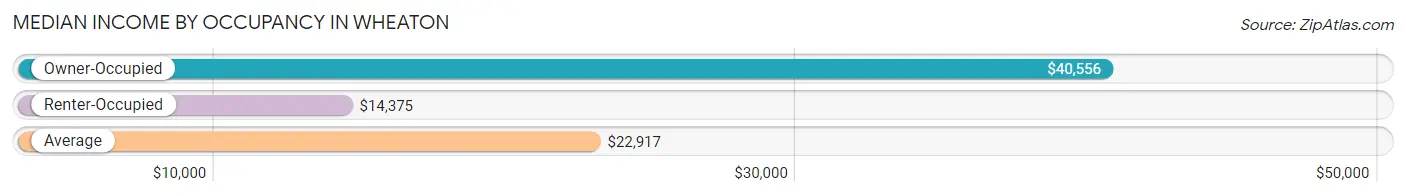
| Occupancy Type | # Households | Median Income |
| Owner-Occupied | 92 (47.7%) | $40,556 |
| Renter-Occupied | 101 (52.3%) | $14,375 |
| Average | 193 (100.0%) | $22,917 |
Occupancy by Householder Income Bracket in Wheaton
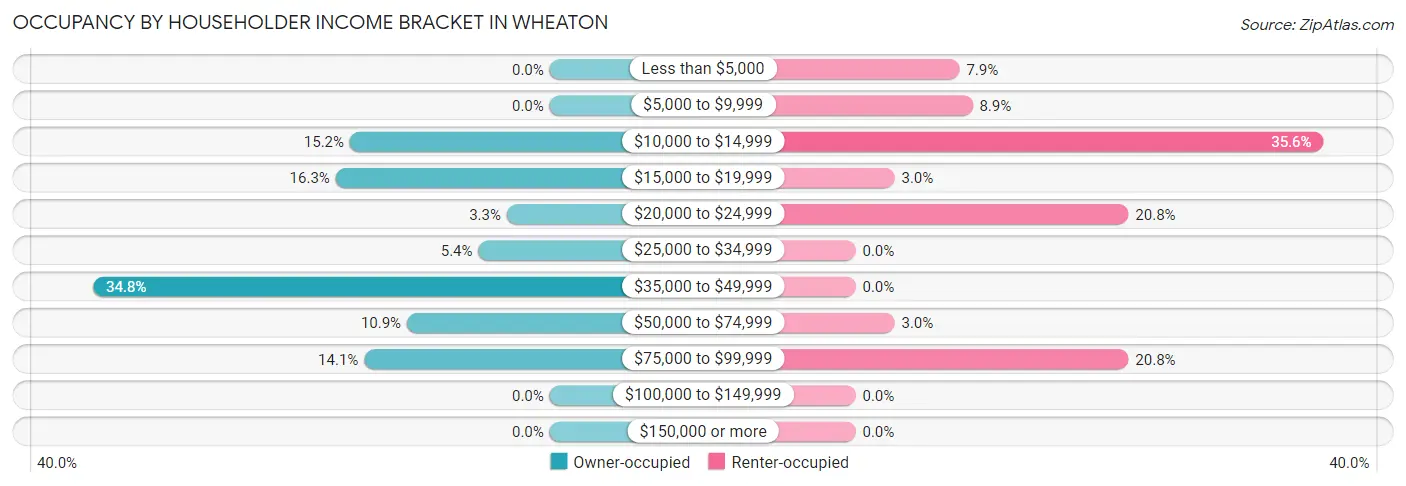
| Income Bracket | Owner-occupied | Renter-occupied |
| Less than $5,000 | 0 (0.0%) | 8 (7.9%) |
| $5,000 to $9,999 | 0 (0.0%) | 9 (8.9%) |
| $10,000 to $14,999 | 14 (15.2%) | 36 (35.6%) |
| $15,000 to $19,999 | 15 (16.3%) | 3 (3.0%) |
| $20,000 to $24,999 | 3 (3.3%) | 21 (20.8%) |
| $25,000 to $34,999 | 5 (5.4%) | 0 (0.0%) |
| $35,000 to $49,999 | 32 (34.8%) | 0 (0.0%) |
| $50,000 to $74,999 | 10 (10.9%) | 3 (3.0%) |
| $75,000 to $99,999 | 13 (14.1%) | 21 (20.8%) |
| $100,000 to $149,999 | 0 (0.0%) | 0 (0.0%) |
| $150,000 or more | 0 (0.0%) | 0 (0.0%) |
| Total | 92 (100.0%) | 101 (100.0%) |
Monthly Housing Cost Tiers in Wheaton
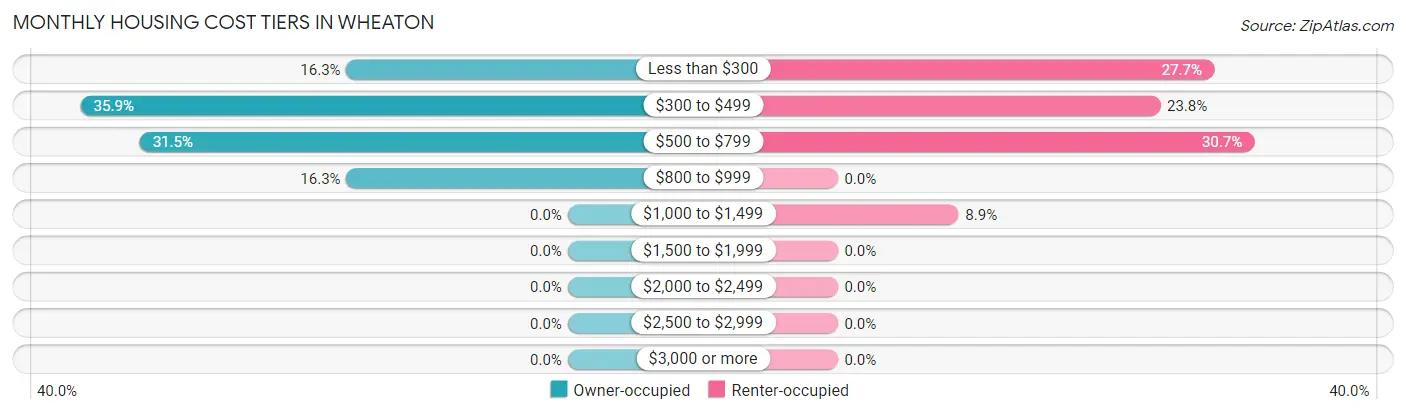
| Monthly Cost | Owner-occupied | Renter-occupied |
| Less than $300 | 15 (16.3%) | 28 (27.7%) |
| $300 to $499 | 33 (35.9%) | 24 (23.8%) |
| $500 to $799 | 29 (31.5%) | 31 (30.7%) |
| $800 to $999 | 15 (16.3%) | 0 (0.0%) |
| $1,000 to $1,499 | 0 (0.0%) | 9 (8.9%) |
| $1,500 to $1,999 | 0 (0.0%) | 0 (0.0%) |
| $2,000 to $2,499 | 0 (0.0%) | 0 (0.0%) |
| $2,500 to $2,999 | 0 (0.0%) | 0 (0.0%) |
| $3,000 or more | 0 (0.0%) | 0 (0.0%) |
| Total | 92 (100.0%) | 101 (100.0%) |
Physical Housing Characteristics in Wheaton
Housing Structures in Wheaton
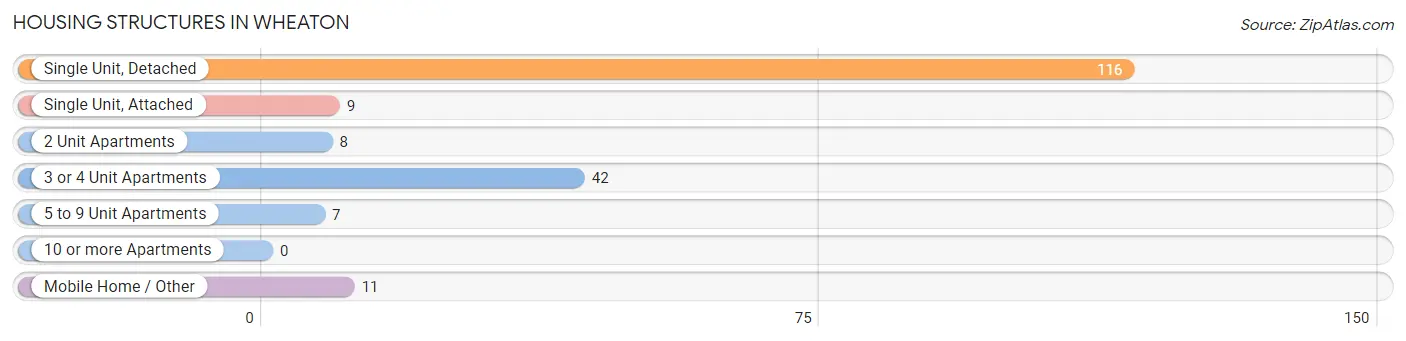
| Structure Type | # Housing Units | % Housing Units |
| Single Unit, Detached | 116 | 60.1% |
| Single Unit, Attached | 9 | 4.7% |
| 2 Unit Apartments | 8 | 4.2% |
| 3 or 4 Unit Apartments | 42 | 21.8% |
| 5 to 9 Unit Apartments | 7 | 3.6% |
| 10 or more Apartments | 0 | 0.0% |
| Mobile Home / Other | 11 | 5.7% |
| Total | 193 | 100.0% |
Housing Structures by Occupancy in Wheaton
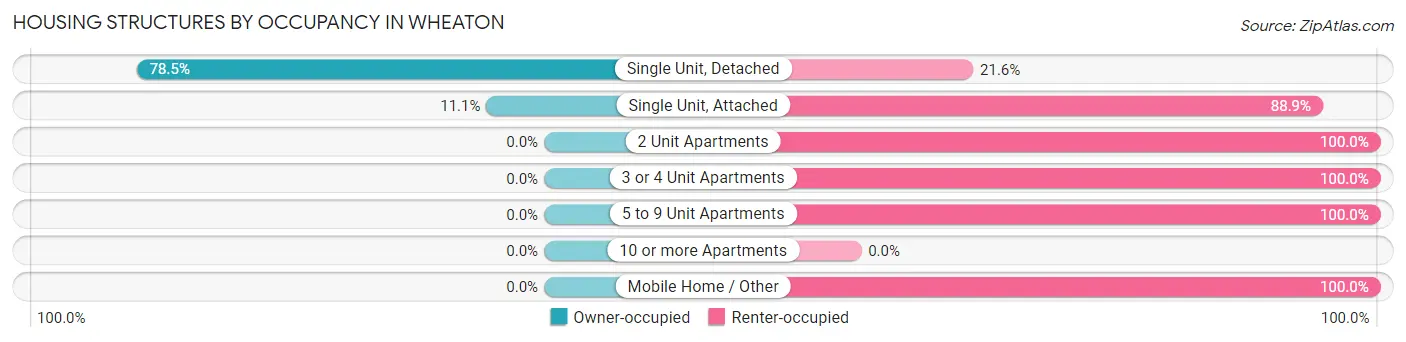
| Structure Type | Owner-occupied | Renter-occupied |
| Single Unit, Detached | 91 (78.4%) | 25 (21.5%) |
| Single Unit, Attached | 1 (11.1%) | 8 (88.9%) |
| 2 Unit Apartments | 0 (0.0%) | 8 (100.0%) |
| 3 or 4 Unit Apartments | 0 (0.0%) | 42 (100.0%) |
| 5 to 9 Unit Apartments | 0 (0.0%) | 7 (100.0%) |
| 10 or more Apartments | 0 (0.0%) | 0 (0.0%) |
| Mobile Home / Other | 0 (0.0%) | 11 (100.0%) |
| Total | 92 (47.7%) | 101 (52.3%) |
Housing Structures by Number of Rooms in Wheaton
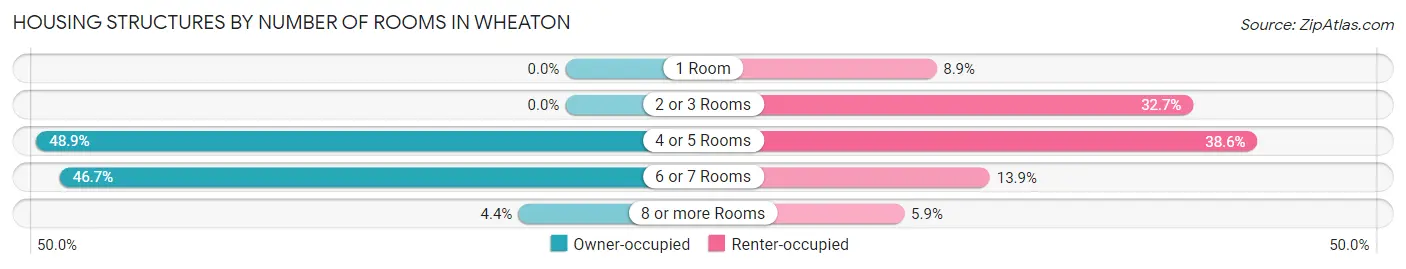
| Number of Rooms | Owner-occupied | Renter-occupied |
| 1 Room | 0 (0.0%) | 9 (8.9%) |
| 2 or 3 Rooms | 0 (0.0%) | 33 (32.7%) |
| 4 or 5 Rooms | 45 (48.9%) | 39 (38.6%) |
| 6 or 7 Rooms | 43 (46.7%) | 14 (13.9%) |
| 8 or more Rooms | 4 (4.3%) | 6 (5.9%) |
| Total | 92 (100.0%) | 101 (100.0%) |
Housing Structure by Heating Type in Wheaton
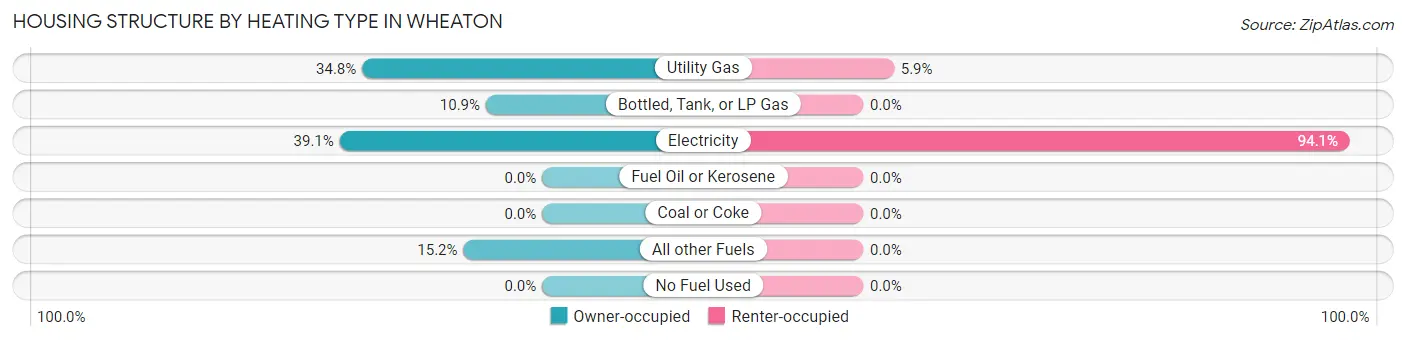
| Heating Type | Owner-occupied | Renter-occupied |
| Utility Gas | 32 (34.8%) | 6 (5.9%) |
| Bottled, Tank, or LP Gas | 10 (10.9%) | 0 (0.0%) |
| Electricity | 36 (39.1%) | 95 (94.1%) |
| Fuel Oil or Kerosene | 0 (0.0%) | 0 (0.0%) |
| Coal or Coke | 0 (0.0%) | 0 (0.0%) |
| All other Fuels | 14 (15.2%) | 0 (0.0%) |
| No Fuel Used | 0 (0.0%) | 0 (0.0%) |
| Total | 92 (100.0%) | 101 (100.0%) |
Household Vehicle Usage in Wheaton
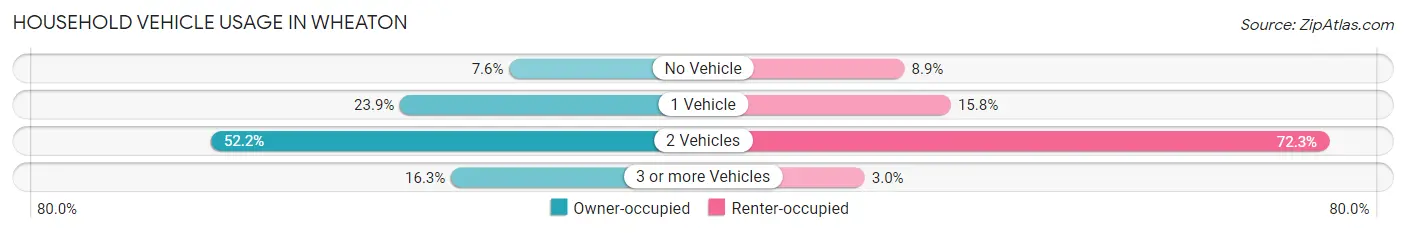
| Vehicles per Household | Owner-occupied | Renter-occupied |
| No Vehicle | 7 (7.6%) | 9 (8.9%) |
| 1 Vehicle | 22 (23.9%) | 16 (15.8%) |
| 2 Vehicles | 48 (52.2%) | 73 (72.3%) |
| 3 or more Vehicles | 15 (16.3%) | 3 (3.0%) |
| Total | 92 (100.0%) | 101 (100.0%) |
Real Estate & Mortgages in Wheaton
Real Estate and Mortgage Overview in Wheaton
| Characteristic | Without Mortgage | With Mortgage |
| Housing Units | 42 | 50 |
| Median Property Value | - | - |
| Median Household Income | $18,667 | $0 |
| Monthly Housing Costs | $321 | $0 |
| Real Estate Taxes | $555 | $0 |
Property Value by Mortgage Status in Wheaton
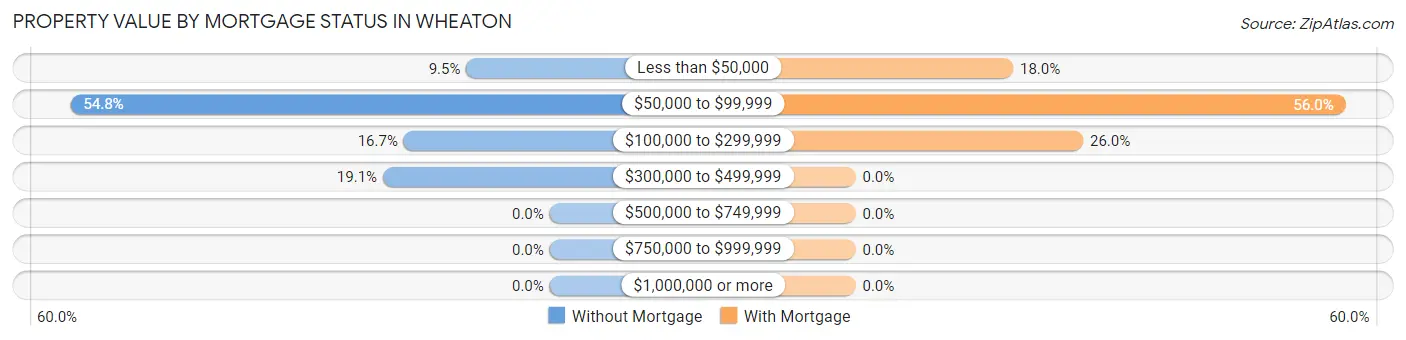
| Property Value | Without Mortgage | With Mortgage |
| Less than $50,000 | 4 (9.5%) | 9 (18.0%) |
| $50,000 to $99,999 | 23 (54.8%) | 28 (56.0%) |
| $100,000 to $299,999 | 7 (16.7%) | 13 (26.0%) |
| $300,000 to $499,999 | 8 (19.1%) | 0 (0.0%) |
| $500,000 to $749,999 | 0 (0.0%) | 0 (0.0%) |
| $750,000 to $999,999 | 0 (0.0%) | 0 (0.0%) |
| $1,000,000 or more | 0 (0.0%) | 0 (0.0%) |
| Total | 42 (100.0%) | 50 (100.0%) |
Household Income by Mortgage Status in Wheaton
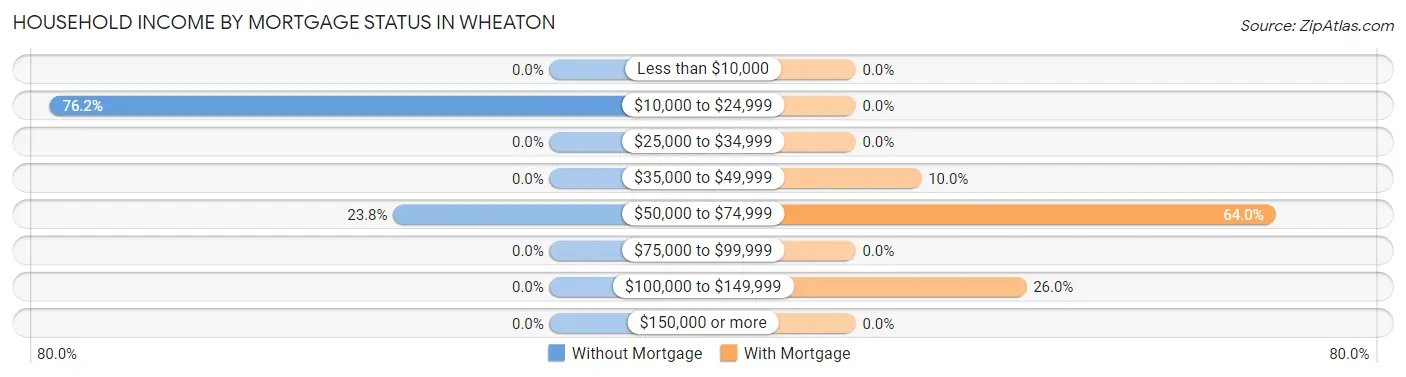
| Household Income | Without Mortgage | With Mortgage |
| Less than $10,000 | 0 (0.0%) | 0 (0.0%) |
| $10,000 to $24,999 | 32 (76.2%) | 0 (0.0%) |
| $25,000 to $34,999 | 0 (0.0%) | 0 (0.0%) |
| $35,000 to $49,999 | 0 (0.0%) | 5 (10.0%) |
| $50,000 to $74,999 | 10 (23.8%) | 32 (64.0%) |
| $75,000 to $99,999 | 0 (0.0%) | 0 (0.0%) |
| $100,000 to $149,999 | 0 (0.0%) | 13 (26.0%) |
| $150,000 or more | 0 (0.0%) | 0 (0.0%) |
| Total | 42 (100.0%) | 50 (100.0%) |
Property Value to Household Income Ratio in Wheaton
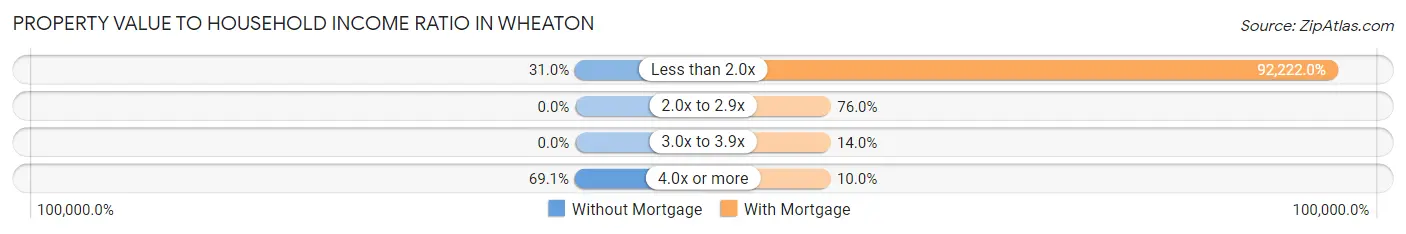
| Value-to-Income Ratio | Without Mortgage | With Mortgage |
| Less than 2.0x | 13 (30.9%) | 46,111 (92,222.0%) |
| 2.0x to 2.9x | 0 (0.0%) | 38 (76.0%) |
| 3.0x to 3.9x | 0 (0.0%) | 7 (14.0%) |
| 4.0x or more | 29 (69.1%) | 5 (10.0%) |
| Total | 42 (100.0%) | 50 (100.0%) |
Real Estate Taxes by Mortgage Status in Wheaton
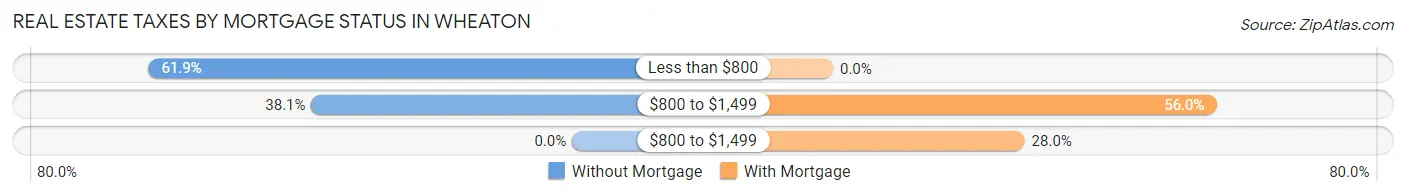
| Property Taxes | Without Mortgage | With Mortgage |
| Less than $800 | 26 (61.9%) | 0 (0.0%) |
| $800 to $1,499 | 16 (38.1%) | 28 (56.0%) |
| $800 to $1,499 | 0 (0.0%) | 14 (28.0%) |
| Total | 42 (100.0%) | 50 (100.0%) |
Health & Disability in Wheaton
Health Insurance Coverage by Age in Wheaton
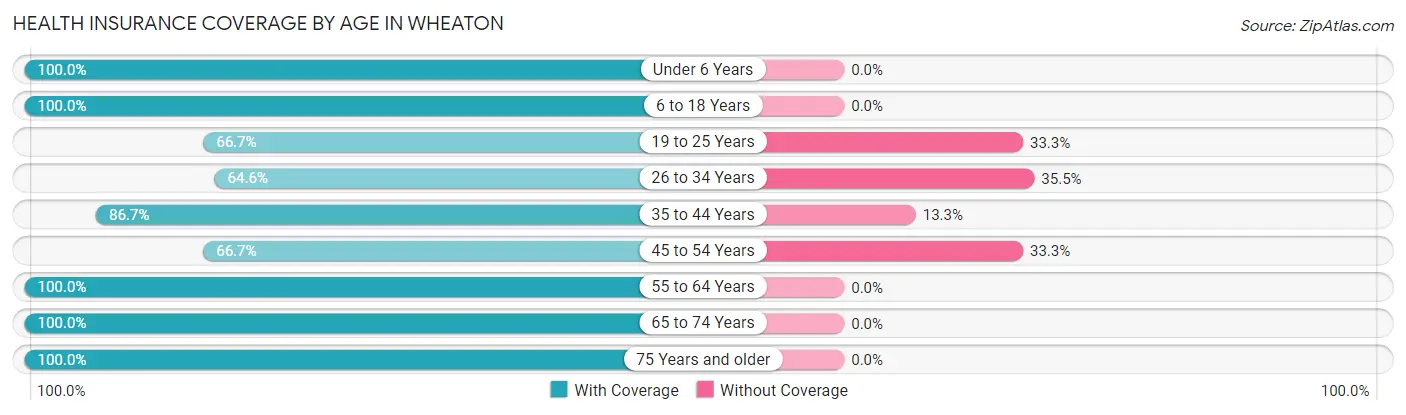
| Age Bracket | With Coverage | Without Coverage |
| Under 6 Years | 68 (100.0%) | 0 (0.0%) |
| 6 to 18 Years | 91 (100.0%) | 0 (0.0%) |
| 19 to 25 Years | 20 (66.7%) | 10 (33.3%) |
| 26 to 34 Years | 71 (64.5%) | 39 (35.4%) |
| 35 to 44 Years | 65 (86.7%) | 10 (13.3%) |
| 45 to 54 Years | 14 (66.7%) | 7 (33.3%) |
| 55 to 64 Years | 49 (100.0%) | 0 (0.0%) |
| 65 to 74 Years | 65 (100.0%) | 0 (0.0%) |
| 75 Years and older | 32 (100.0%) | 0 (0.0%) |
| Total | 475 (87.8%) | 66 (12.2%) |
Health Insurance Coverage by Citizenship Status in Wheaton
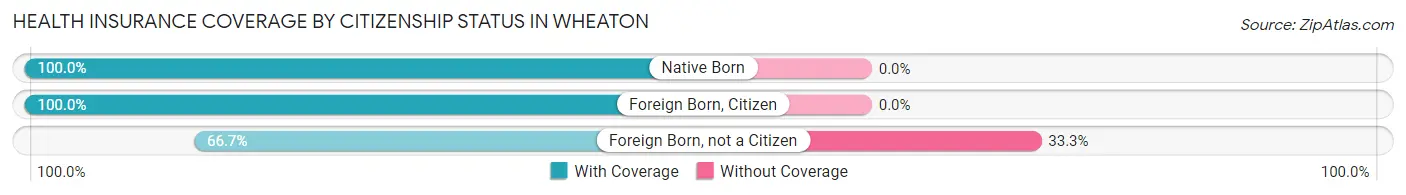
| Citizenship Status | With Coverage | Without Coverage |
| Native Born | 68 (100.0%) | 0 (0.0%) |
| Foreign Born, Citizen | 91 (100.0%) | 0 (0.0%) |
| Foreign Born, not a Citizen | 20 (66.7%) | 10 (33.3%) |
Health Insurance Coverage by Household Income in Wheaton
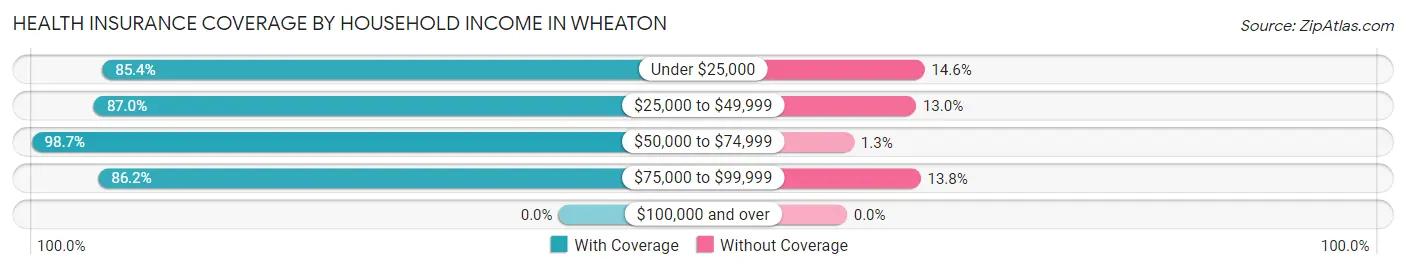
| Household Income | With Coverage | Without Coverage |
| Under $25,000 | 176 (85.4%) | 30 (14.6%) |
| $25,000 to $49,999 | 94 (87.0%) | 14 (13.0%) |
| $50,000 to $74,999 | 74 (98.7%) | 1 (1.3%) |
| $75,000 to $99,999 | 131 (86.2%) | 21 (13.8%) |
| $100,000 and over | 0 (0.0%) | 0 (0.0%) |
Public vs Private Health Insurance Coverage by Age in Wheaton
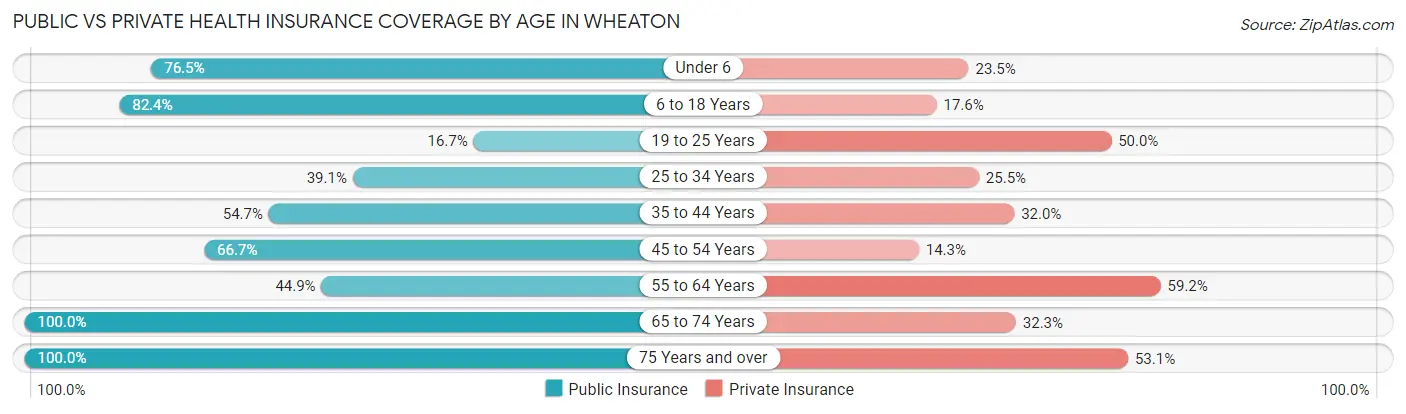
| Age Bracket | Public Insurance | Private Insurance |
| Under 6 | 52 (76.5%) | 16 (23.5%) |
| 6 to 18 Years | 75 (82.4%) | 16 (17.6%) |
| 19 to 25 Years | 5 (16.7%) | 15 (50.0%) |
| 25 to 34 Years | 43 (39.1%) | 28 (25.5%) |
| 35 to 44 Years | 41 (54.7%) | 24 (32.0%) |
| 45 to 54 Years | 14 (66.7%) | 3 (14.3%) |
| 55 to 64 Years | 22 (44.9%) | 29 (59.2%) |
| 65 to 74 Years | 65 (100.0%) | 21 (32.3%) |
| 75 Years and over | 32 (100.0%) | 17 (53.1%) |
| Total | 349 (64.5%) | 169 (31.2%) |
Disability Status by Sex by Age in Wheaton
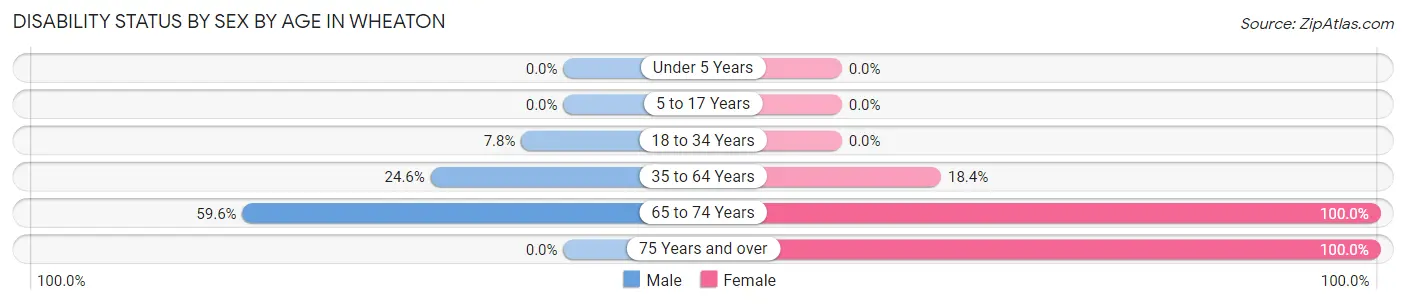
| Age Bracket | Male | Female |
| Under 5 Years | 0 (0.0%) | 0 (0.0%) |
| 5 to 17 Years | 0 (0.0%) | 0 (0.0%) |
| 18 to 34 Years | 5 (7.8%) | 0 (0.0%) |
| 35 to 64 Years | 17 (24.6%) | 14 (18.4%) |
| 65 to 74 Years | 28 (59.6%) | 18 (100.0%) |
| 75 Years and over | 0 (0.0%) | 24 (100.0%) |
Disability Class by Sex by Age in Wheaton
Disability Class: Hearing Difficulty
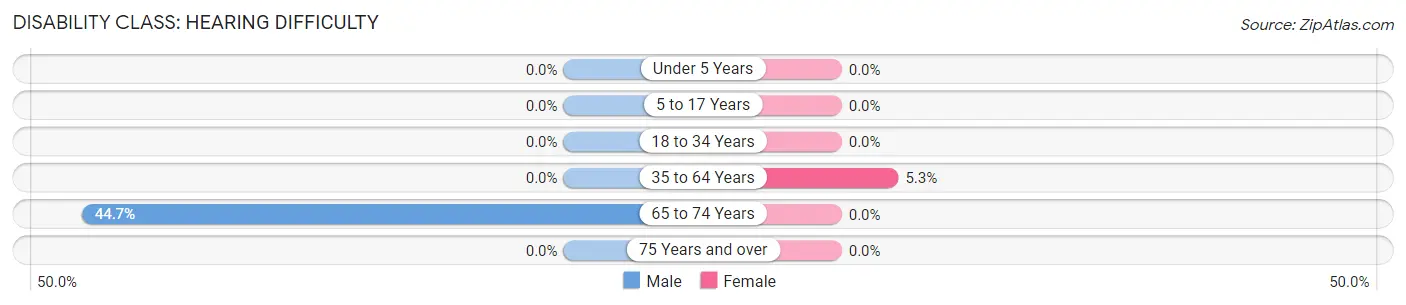
| Age Bracket | Male | Female |
| Under 5 Years | 0 (0.0%) | 0 (0.0%) |
| 5 to 17 Years | 0 (0.0%) | 0 (0.0%) |
| 18 to 34 Years | 0 (0.0%) | 0 (0.0%) |
| 35 to 64 Years | 0 (0.0%) | 4 (5.3%) |
| 65 to 74 Years | 21 (44.7%) | 0 (0.0%) |
| 75 Years and over | 0 (0.0%) | 0 (0.0%) |
Disability Class: Vision Difficulty
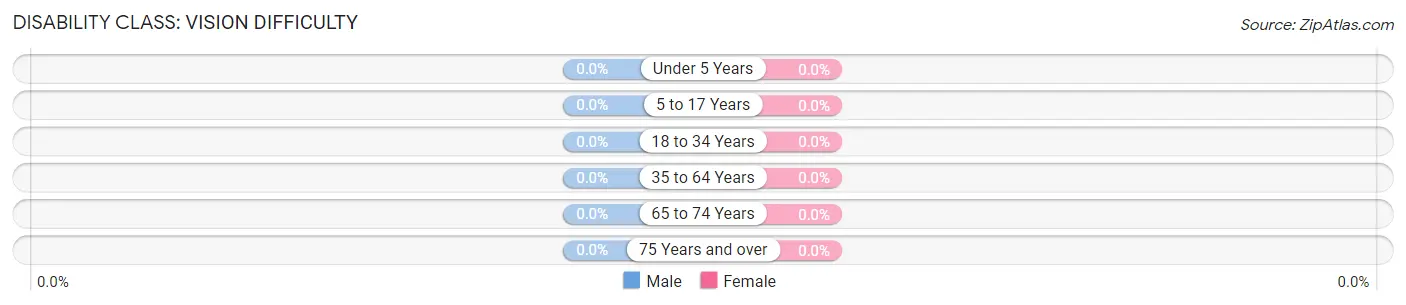
| Age Bracket | Male | Female |
| Under 5 Years | 0 (0.0%) | 0 (0.0%) |
| 5 to 17 Years | 0 (0.0%) | 0 (0.0%) |
| 18 to 34 Years | 0 (0.0%) | 0 (0.0%) |
| 35 to 64 Years | 0 (0.0%) | 0 (0.0%) |
| 65 to 74 Years | 0 (0.0%) | 0 (0.0%) |
| 75 Years and over | 0 (0.0%) | 0 (0.0%) |
Disability Class: Cognitive Difficulty
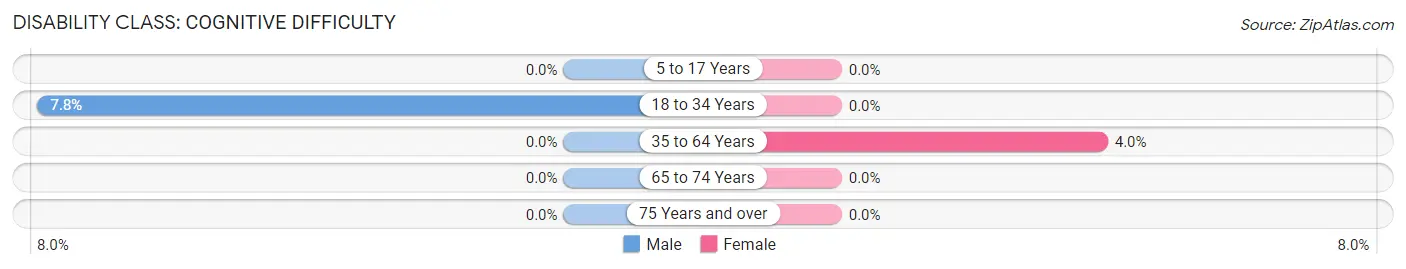
| Age Bracket | Male | Female |
| 5 to 17 Years | 0 (0.0%) | 0 (0.0%) |
| 18 to 34 Years | 5 (7.8%) | 0 (0.0%) |
| 35 to 64 Years | 0 (0.0%) | 3 (4.0%) |
| 65 to 74 Years | 0 (0.0%) | 0 (0.0%) |
| 75 Years and over | 0 (0.0%) | 0 (0.0%) |
Disability Class: Ambulatory Difficulty
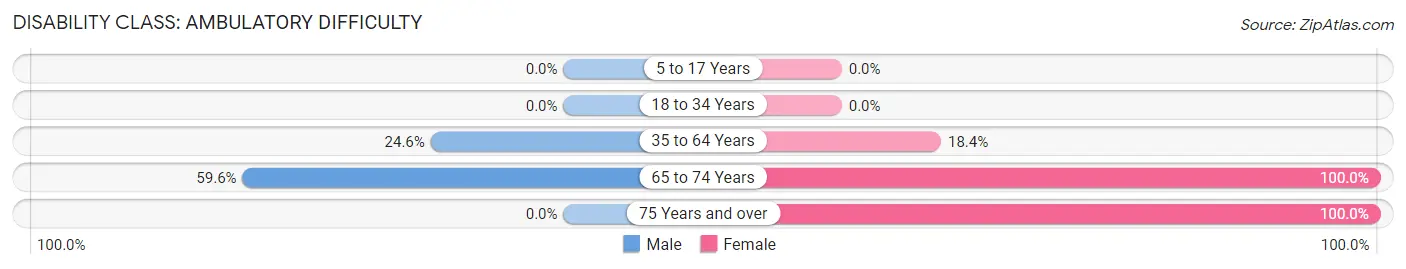
| Age Bracket | Male | Female |
| 5 to 17 Years | 0 (0.0%) | 0 (0.0%) |
| 18 to 34 Years | 0 (0.0%) | 0 (0.0%) |
| 35 to 64 Years | 17 (24.6%) | 14 (18.4%) |
| 65 to 74 Years | 28 (59.6%) | 18 (100.0%) |
| 75 Years and over | 0 (0.0%) | 24 (100.0%) |
Disability Class: Self-Care Difficulty
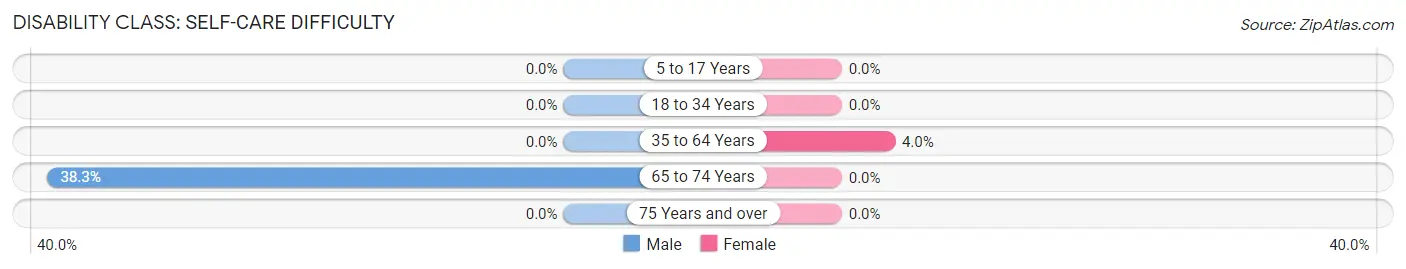
| Age Bracket | Male | Female |
| 5 to 17 Years | 0 (0.0%) | 0 (0.0%) |
| 18 to 34 Years | 0 (0.0%) | 0 (0.0%) |
| 35 to 64 Years | 0 (0.0%) | 3 (4.0%) |
| 65 to 74 Years | 18 (38.3%) | 0 (0.0%) |
| 75 Years and over | 0 (0.0%) | 0 (0.0%) |
Technology Access in Wheaton
Computing Device Access in Wheaton
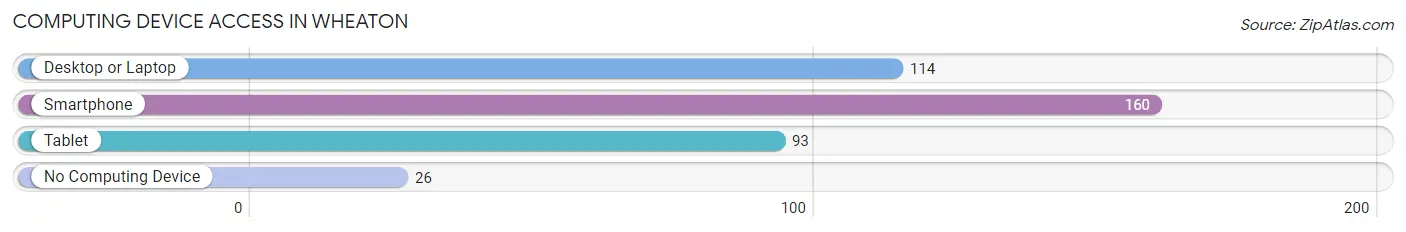
| Device Type | # Households | % Households |
| Desktop or Laptop | 114 | 59.1% |
| Smartphone | 160 | 82.9% |
| Tablet | 93 | 48.2% |
| No Computing Device | 26 | 13.5% |
| Total | 193 | 100.0% |
Internet Access in Wheaton
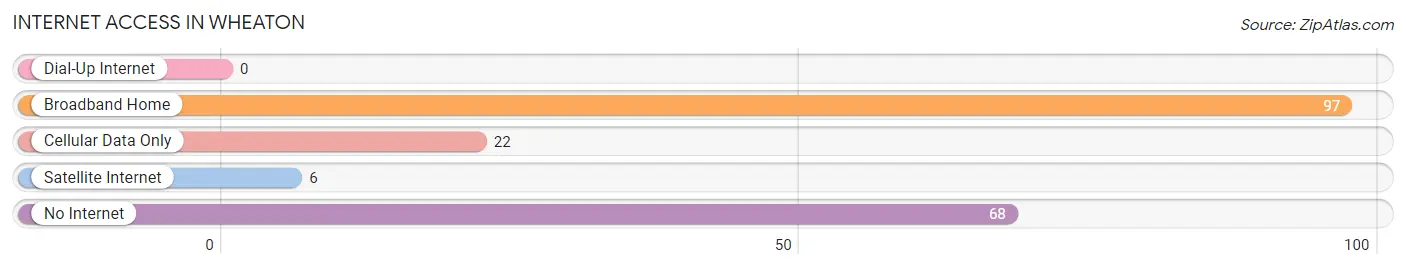
| Internet Type | # Households | % Households |
| Dial-Up Internet | 0 | 0.0% |
| Broadband Home | 97 | 50.3% |
| Cellular Data Only | 22 | 11.4% |
| Satellite Internet | 6 | 3.1% |
| No Internet | 68 | 35.2% |
| Total | 193 | 100.0% |
Wheaton Summary
History
Wheaton, Missouri is a small town located in the southwestern corner of the state, near the Arkansas border. It was founded in 1881 by a group of settlers from the nearby town of Neosho. The town was named after the first postmaster, William Wheaton. The town was originally a farming community, but it soon became a hub for the timber industry. The town was also home to a number of small businesses, including a general store, a blacksmith shop, and a sawmill.
In the early 1900s, the town began to grow and develop. The railroad came to town in 1906, and the town was incorporated in 1909. The town was home to a number of churches, schools, and businesses. The town also had a number of hotels, restaurants, and other businesses.
In the 1950s, the town began to decline. The timber industry had moved away, and the railroad had stopped running. The town was no longer a hub for commerce, and many of the businesses had closed. The population of the town had dropped to just over 500 people.
In the late 1970s, the town began to experience a resurgence. The timber industry had returned, and the town was once again a hub for commerce. The population of the town had grown to over 1,000 people.
Geography
Wheaton is located in the southwestern corner of Missouri, near the Arkansas border. The town is situated in the Ozark Mountains, and is surrounded by rolling hills and forests. The town is located on the banks of the Elk River, which flows through the town. The town is located about 30 miles from the nearest major city, Springfield.
The town has a total area of 1.2 square miles, all of which is land. The town has a humid subtropical climate, with hot, humid summers and mild winters. The average temperature in the summer is around 80 degrees Fahrenheit, and the average temperature in the winter is around 40 degrees Fahrenheit.
Economy
Wheaton’s economy is largely based on the timber industry. The town is home to a number of sawmills and lumber companies, which provide jobs for many of the town’s residents. The town is also home to a number of small businesses, including restaurants, stores, and other services.
The town is also home to a number of tourist attractions, including the Ozark National Scenic Riverways, which is a popular destination for canoeing and fishing. The town is also home to a number of historic sites, including the Wheaton Historic District, which is listed on the National Register of Historic Places.
Demographics
As of the 2010 census, the population of Wheaton was 1,093. The population is largely white, with a small percentage of African Americans and Hispanics. The median household income is $31,250, and the median age is 41. The town has a high rate of poverty, with over 25% of the population living below the poverty line.
Common Questions
What is Per Capita Income in Wheaton?
Per Capita income in Wheaton is $13,842.
What is the Median Family Income in Wheaton?
Median Family Income in Wheaton is $45,833.
What is the Median Household income in Wheaton?
Median Household Income in Wheaton is $22,917.
What is Income or Wage Gap in Wheaton?
Income or Wage Gap in Wheaton is 20.7%.
Women in Wheaton earn 79.3 cents for every dollar earned by a man.
What is Inequality or Gini Index in Wheaton?
Inequality or Gini Index in Wheaton is 0.43.
What is the Total Population of Wheaton?
Total Population of Wheaton is 541.
What is the Total Male Population of Wheaton?
Total Male Population of Wheaton is 259.
What is the Total Female Population of Wheaton?
Total Female Population of Wheaton is 282.
What is the Ratio of Males per 100 Females in Wheaton?
There are 91.84 Males per 100 Females in Wheaton.
What is the Ratio of Females per 100 Males in Wheaton?
There are 108.88 Females per 100 Males in Wheaton.
What is the Median Population Age in Wheaton?
Median Population Age in Wheaton is 30.9 Years.
What is the Average Family Size in Wheaton
Average Family Size in Wheaton is 3.5 People.
What is the Average Household Size in Wheaton
Average Household Size in Wheaton is 2.8 People.
How Large is the Labor Force in Wheaton?
There are 205 People in the Labor Forcein in Wheaton.
What is the Percentage of People in the Labor Force in Wheaton?
51.3% of People are in the Labor Force in Wheaton.
What is the Unemployment Rate in Wheaton?
Unemployment Rate in Wheaton is 5.4%.