Wellington, MO Map & Demographics
Wellington Map
Wellington Overview
$33,243
PER CAPITA INCOME
$63,750
AVG FAMILY INCOME
$64,125
AVG HOUSEHOLD INCOME
0.33
INEQUALITY / GINI INDEX
501
TOTAL POPULATION
236
MALE POPULATION
265
FEMALE POPULATION
89.06
MALES / 100 FEMALES
112.29
FEMALES / 100 MALES
44.6
MEDIAN AGE
2.8
AVG FAMILY SIZE
2.2
AVG HOUSEHOLD SIZE
219
LABOR FORCE [ PEOPLE ]
55.7%
PERCENT IN LABOR FORCE
10.5%
UNEMPLOYMENT RATE
Wellington Zip Codes
Wellington Area Codes
Income in Wellington
Income Overview in Wellington
Per Capita Income in Wellington is $33,243, while median incomes of families and households are $63,750 and $64,125 respectively.
| Characteristic | Number | Measure |
| Per Capita Income | 501 | $33,243 |
| Median Family Income | 132 | $63,750 |
| Mean Family Income | 132 | $77,736 |
| Median Household Income | 223 | $64,125 |
| Mean Household Income | 223 | $78,739 |
| Income Deficit | 132 | $0 |
| Wage / Income Gap (%) | 501 | 0.00% |
| Wage / Income Gap ($) | 501 | 100.00¢ per $1 |
| Gini / Inequality Index | 501 | 0.33 |
Earnings by Sex in Wellington
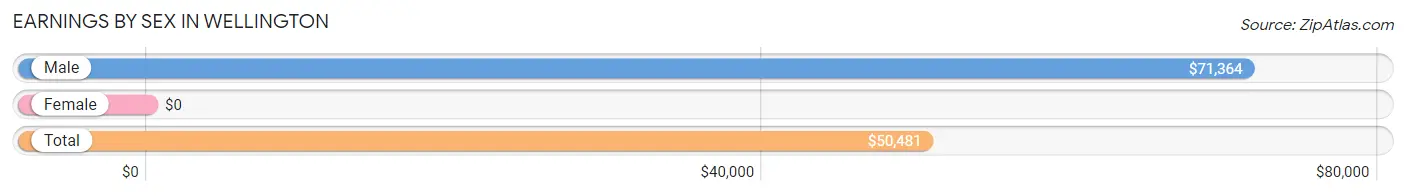
| Sex | Number | Average Earnings |
| Male | 118 (51.1%) | $71,364 |
| Female | 113 (48.9%) | $0 |
| Total | 231 (100.0%) | $50,481 |
Earnings by Sex by Income Bracket in Wellington
The most common earnings brackets in Wellington are $100,000+ for men (34 | 28.8%) and $2,499 or less for women (31 | 27.4%).
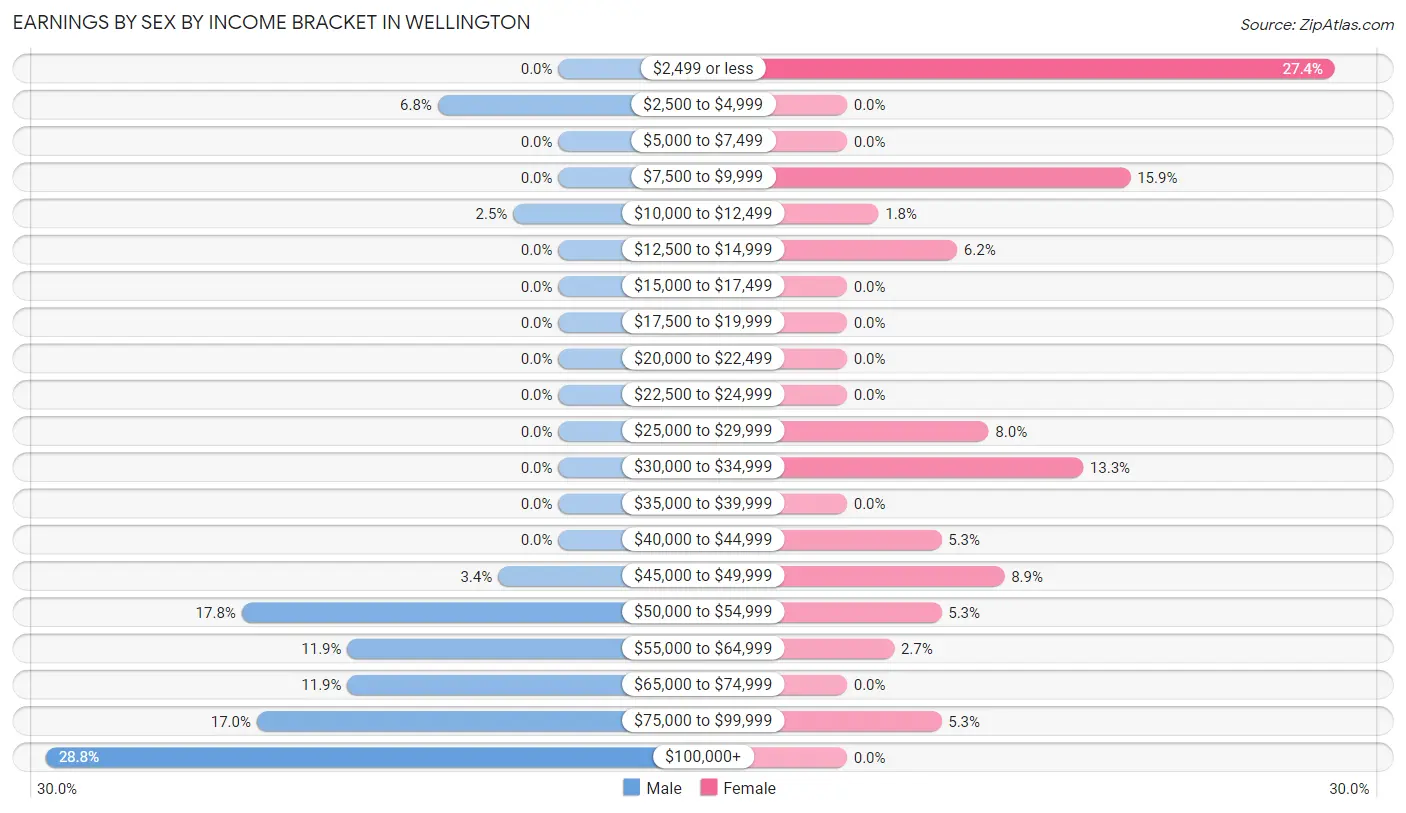
| Income | Male | Female |
| $2,499 or less | 0 (0.0%) | 31 (27.4%) |
| $2,500 to $4,999 | 8 (6.8%) | 0 (0.0%) |
| $5,000 to $7,499 | 0 (0.0%) | 0 (0.0%) |
| $7,500 to $9,999 | 0 (0.0%) | 18 (15.9%) |
| $10,000 to $12,499 | 3 (2.5%) | 2 (1.8%) |
| $12,500 to $14,999 | 0 (0.0%) | 7 (6.2%) |
| $15,000 to $17,499 | 0 (0.0%) | 0 (0.0%) |
| $17,500 to $19,999 | 0 (0.0%) | 0 (0.0%) |
| $20,000 to $22,499 | 0 (0.0%) | 0 (0.0%) |
| $22,500 to $24,999 | 0 (0.0%) | 0 (0.0%) |
| $25,000 to $29,999 | 0 (0.0%) | 9 (8.0%) |
| $30,000 to $34,999 | 0 (0.0%) | 15 (13.3%) |
| $35,000 to $39,999 | 0 (0.0%) | 0 (0.0%) |
| $40,000 to $44,999 | 0 (0.0%) | 6 (5.3%) |
| $45,000 to $49,999 | 4 (3.4%) | 10 (8.8%) |
| $50,000 to $54,999 | 21 (17.8%) | 6 (5.3%) |
| $55,000 to $64,999 | 14 (11.9%) | 3 (2.6%) |
| $65,000 to $74,999 | 14 (11.9%) | 0 (0.0%) |
| $75,000 to $99,999 | 20 (17.0%) | 6 (5.3%) |
| $100,000+ | 34 (28.8%) | 0 (0.0%) |
| Total | 118 (100.0%) | 113 (100.0%) |
Earnings by Sex by Educational Attainment in Wellington
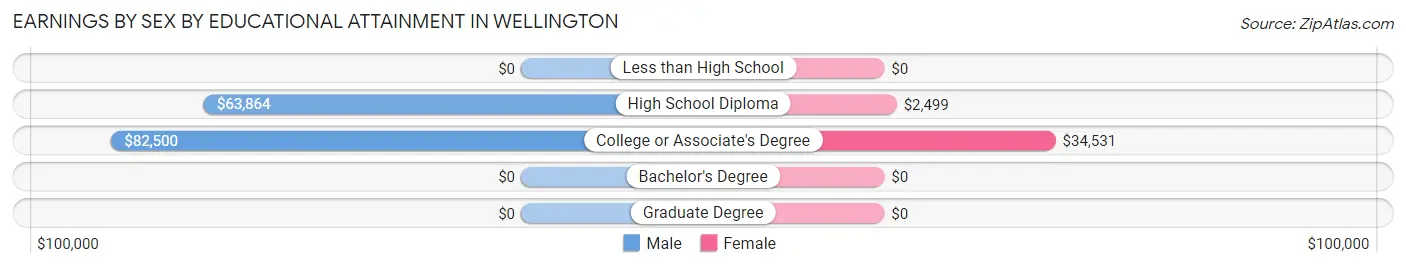
| Educational Attainment | Male Income | Female Income |
| Less than High School | - | - |
| High School Diploma | $63,864 | $2,499 |
| College or Associate's Degree | $82,500 | $34,531 |
| Bachelor's Degree | - | - |
| Graduate Degree | - | - |
| Total | $72,159 | $0 |
Family Income in Wellington
Family Income Brackets in Wellington
According to the Wellington family income data, there are 54 families falling into the $50,000 to $74,999 income range, which is the most common income bracket and makes up 40.9% of all families.
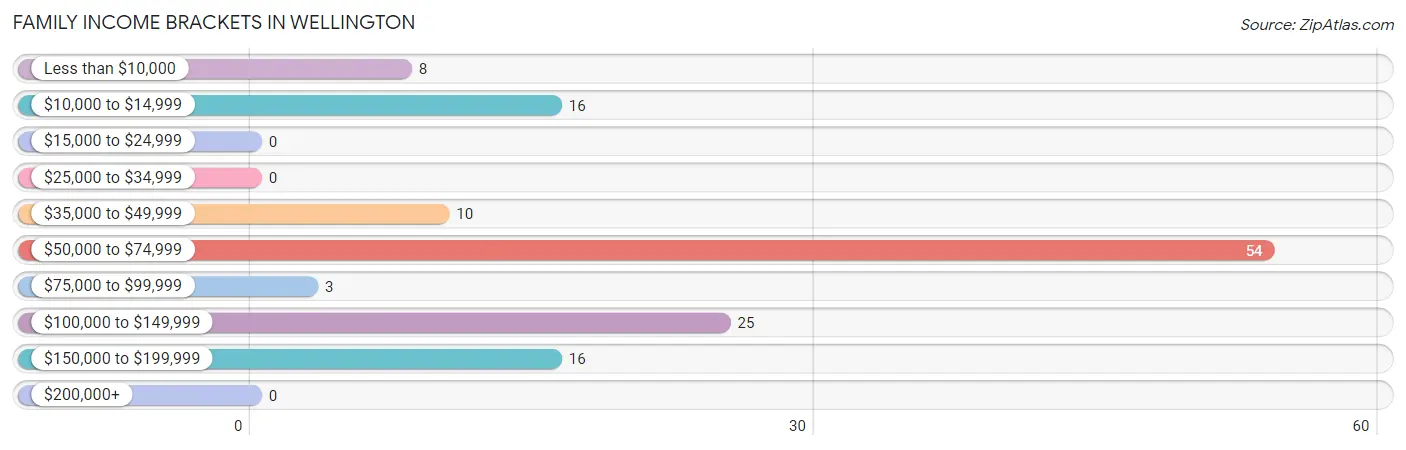
| Income Bracket | # Families | % Families |
| Less than $10,000 | 8 | 6.1% |
| $10,000 to $14,999 | 16 | 12.1% |
| $15,000 to $24,999 | 0 | 0.0% |
| $25,000 to $34,999 | 0 | 0.0% |
| $35,000 to $49,999 | 10 | 7.6% |
| $50,000 to $74,999 | 54 | 40.9% |
| $75,000 to $99,999 | 3 | 2.3% |
| $100,000 to $149,999 | 25 | 18.9% |
| $150,000 to $199,999 | 16 | 12.1% |
| $200,000+ | 0 | 0.0% |
Family Income by Famaliy Size in Wellington
2-person families (78 | 59.1%) account for the highest median family income in Wellington with $62,386 per family, while 2-person families (78 | 59.1%) have the highest median income of $31,193 per family member.
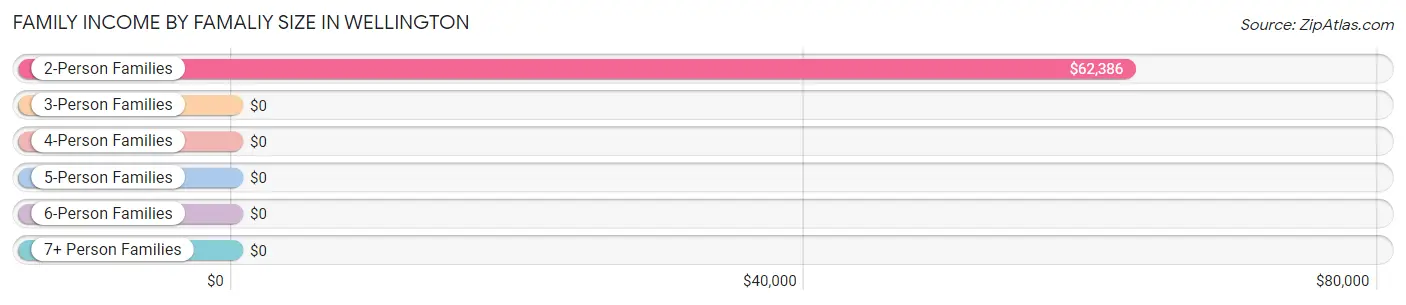
| Income Bracket | # Families | Median Income |
| 2-Person Families | 78 (59.1%) | $62,386 |
| 3-Person Families | 29 (22.0%) | $0 |
| 4-Person Families | 11 (8.3%) | $0 |
| 5-Person Families | 6 (4.5%) | $0 |
| 6-Person Families | 8 (6.1%) | $0 |
| 7+ Person Families | 0 (0.0%) | $0 |
| Total | 132 (100.0%) | $63,750 |
Family Income by Number of Earners in Wellington
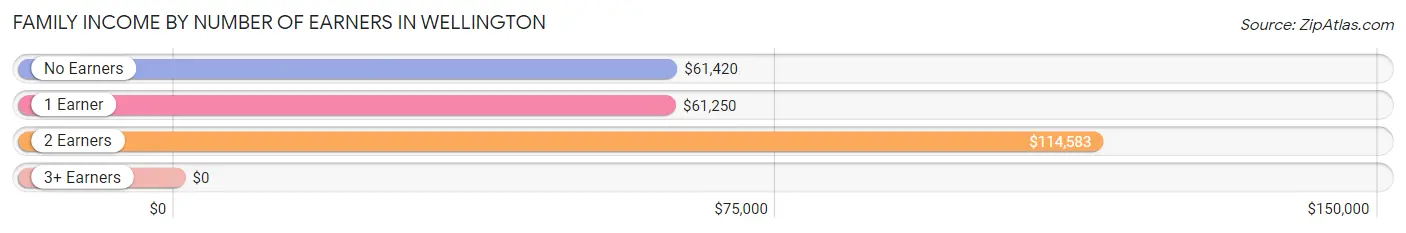
| Number of Earners | # Families | Median Income |
| No Earners | 45 (34.1%) | $61,420 |
| 1 Earner | 26 (19.7%) | $61,250 |
| 2 Earners | 61 (46.2%) | $114,583 |
| 3+ Earners | 0 (0.0%) | $0 |
| Total | 132 (100.0%) | $63,750 |
Household Income in Wellington
Household Income Brackets in Wellington
With 91 households falling in the category, the $50,000 to $74,999 income range is the most frequent in Wellington, accounting for 40.8% of all households.
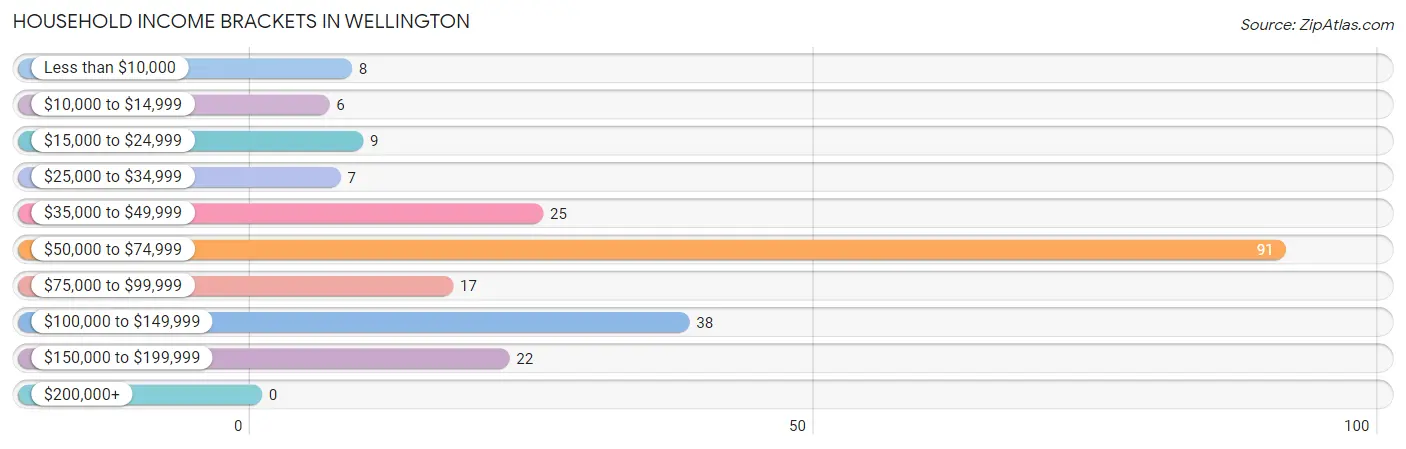
| Income Bracket | # Households | % Households |
| Less than $10,000 | 8 | 3.6% |
| $10,000 to $14,999 | 6 | 2.7% |
| $15,000 to $24,999 | 9 | 4.0% |
| $25,000 to $34,999 | 7 | 3.1% |
| $35,000 to $49,999 | 25 | 11.2% |
| $50,000 to $74,999 | 91 | 40.8% |
| $75,000 to $99,999 | 17 | 7.6% |
| $100,000 to $149,999 | 38 | 17.0% |
| $150,000 to $199,999 | 22 | 9.9% |
| $200,000+ | 0 | 0.0% |
Household Income by Householder Age in Wellington
The median household income in Wellington is $64,125, with the highest median household income of $66,111 found in the 45 to 64 years age bracket for the primary householder. A total of 116 households (52.0%) fall into this category.
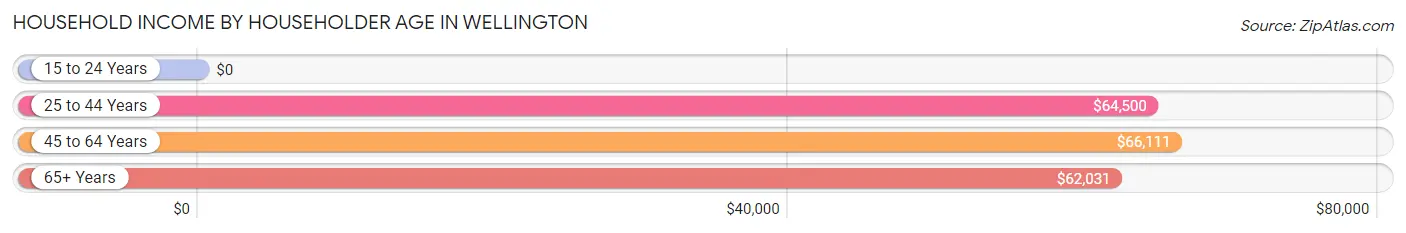
| Income Bracket | # Households | Median Income |
| 15 to 24 Years | 0 (0.0%) | $0 |
| 25 to 44 Years | 60 (26.9%) | $64,500 |
| 45 to 64 Years | 116 (52.0%) | $66,111 |
| 65+ Years | 47 (21.1%) | $62,031 |
| Total | 223 (100.0%) | $64,125 |
Poverty in Wellington
Income Below Poverty by Sex and Age in Wellington
With 10.2% poverty level for males and 19.1% for females among the residents of Wellington, 12 to 14 year old males and 25 to 34 year old females are the most vulnerable to poverty, with 15 males (53.6%) and 8 females (57.1%) in their respective age groups living below the poverty level.
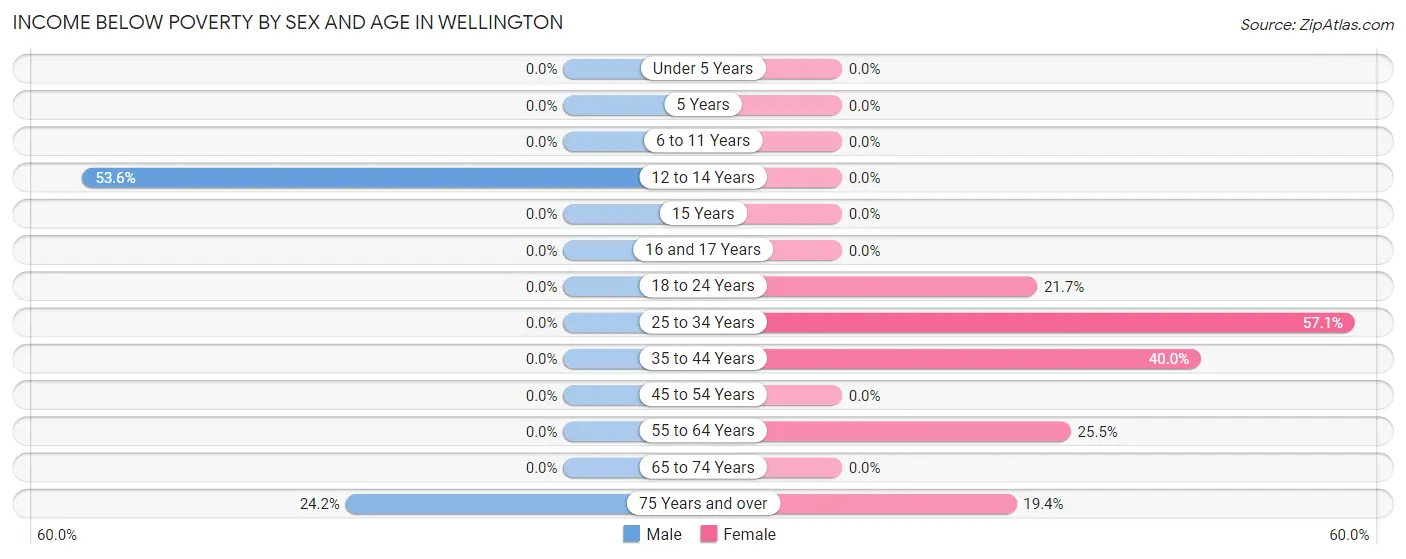
| Age Bracket | Male | Female |
| Under 5 Years | 0 (0.0%) | 0 (0.0%) |
| 5 Years | 0 (0.0%) | 0 (0.0%) |
| 6 to 11 Years | 0 (0.0%) | 0 (0.0%) |
| 12 to 14 Years | 15 (53.6%) | 0 (0.0%) |
| 15 Years | 0 (0.0%) | 0 (0.0%) |
| 16 and 17 Years | 0 (0.0%) | 0 (0.0%) |
| 18 to 24 Years | 0 (0.0%) | 5 (21.7%) |
| 25 to 34 Years | 0 (0.0%) | 8 (57.1%) |
| 35 to 44 Years | 0 (0.0%) | 16 (40.0%) |
| 45 to 54 Years | 0 (0.0%) | 0 (0.0%) |
| 55 to 64 Years | 0 (0.0%) | 13 (25.5%) |
| 65 to 74 Years | 0 (0.0%) | 0 (0.0%) |
| 75 Years and over | 8 (24.2%) | 7 (19.4%) |
| Total | 23 (10.2%) | 49 (19.1%) |
Income Above Poverty by Sex and Age in Wellington
According to the poverty statistics in Wellington, males aged under 5 years and females aged under 5 years are the age groups that are most secure financially, with 100.0% of males and 100.0% of females in these age groups living above the poverty line.
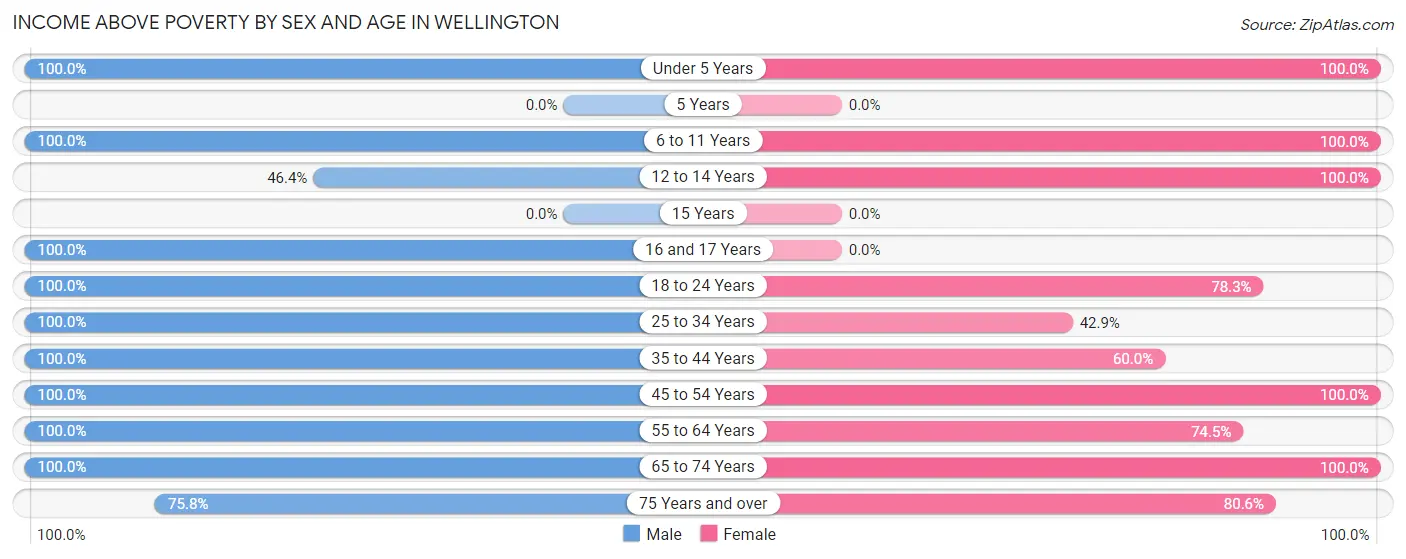
| Age Bracket | Male | Female |
| Under 5 Years | 7 (100.0%) | 23 (100.0%) |
| 5 Years | 0 (0.0%) | 0 (0.0%) |
| 6 to 11 Years | 10 (100.0%) | 4 (100.0%) |
| 12 to 14 Years | 13 (46.4%) | 17 (100.0%) |
| 15 Years | 0 (0.0%) | 0 (0.0%) |
| 16 and 17 Years | 6 (100.0%) | 0 (0.0%) |
| 18 to 24 Years | 7 (100.0%) | 18 (78.3%) |
| 25 to 34 Years | 10 (100.0%) | 6 (42.9%) |
| 35 to 44 Years | 45 (100.0%) | 24 (60.0%) |
| 45 to 54 Years | 4 (100.0%) | 33 (100.0%) |
| 55 to 64 Years | 67 (100.0%) | 38 (74.5%) |
| 65 to 74 Years | 8 (100.0%) | 16 (100.0%) |
| 75 Years and over | 25 (75.8%) | 29 (80.6%) |
| Total | 202 (89.8%) | 208 (80.9%) |
Income Below Poverty Among Married-Couple Families in Wellington
The poverty statistics for married-couple families in Wellington show that 8.7% or 8 of the total 92 families live below the poverty line. Families with no children have the highest poverty rate of 11.9%, comprising of 8 families. On the other hand, families with 1 or 2 children have the lowest poverty rate of 0.0%, which includes 0 families.
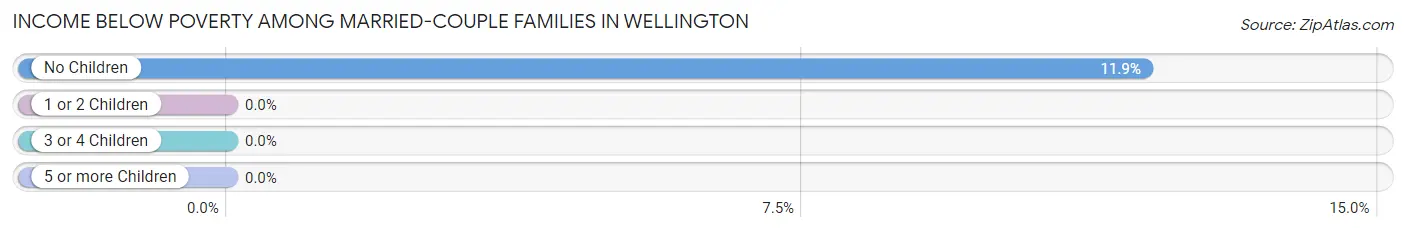
| Children | Above Poverty | Below Poverty |
| No Children | 59 (88.1%) | 8 (11.9%) |
| 1 or 2 Children | 19 (100.0%) | 0 (0.0%) |
| 3 or 4 Children | 6 (100.0%) | 0 (0.0%) |
| 5 or more Children | 0 (0.0%) | 0 (0.0%) |
| Total | 84 (91.3%) | 8 (8.7%) |
Income Below Poverty Among Single-Parent Households in Wellington
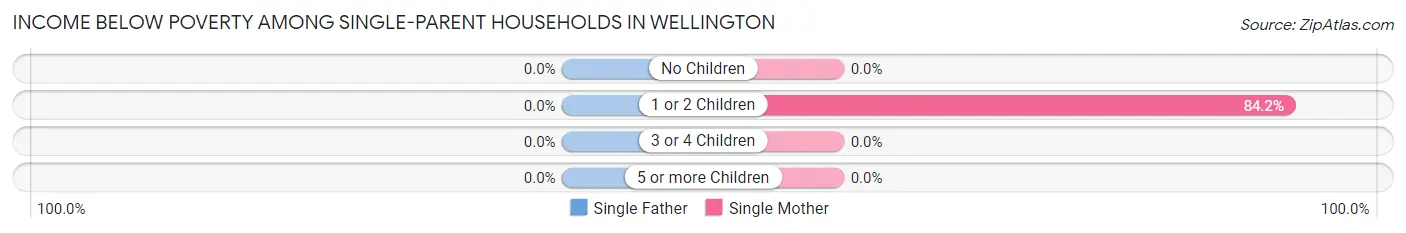
| Children | Single Father | Single Mother |
| No Children | 0 (0.0%) | 0 (0.0%) |
| 1 or 2 Children | 0 (0.0%) | 16 (84.2%) |
| 3 or 4 Children | 0 (0.0%) | 0 (0.0%) |
| 5 or more Children | 0 (0.0%) | 0 (0.0%) |
| Total | 0 (0.0%) | 16 (57.1%) |
Income Below Poverty Among Married-Couple vs Single-Parent Households in Wellington
The poverty data for Wellington shows that 8 of the married-couple family households (8.7%) and 16 of the single-parent households (40.0%) are living below the poverty level. Within the married-couple family households, those with no children have the highest poverty rate, with 8 households (11.9%) falling below the poverty line. Among the single-parent households, those with 1 or 2 children have the highest poverty rate, with 16 household (61.5%) living below poverty.
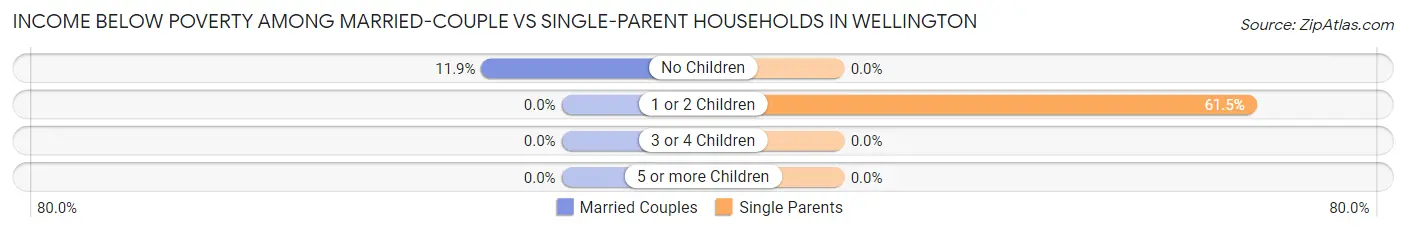
| Children | Married-Couple Families | Single-Parent Households |
| No Children | 8 (11.9%) | 0 (0.0%) |
| 1 or 2 Children | 0 (0.0%) | 16 (61.5%) |
| 3 or 4 Children | 0 (0.0%) | 0 (0.0%) |
| 5 or more Children | 0 (0.0%) | 0 (0.0%) |
| Total | 8 (8.7%) | 16 (40.0%) |
Race in Wellington
The most populous races in Wellington are White / Caucasian (468 | 93.4%), Two or more Races (22 | 4.4%), and Black / African American (11 | 2.2%).
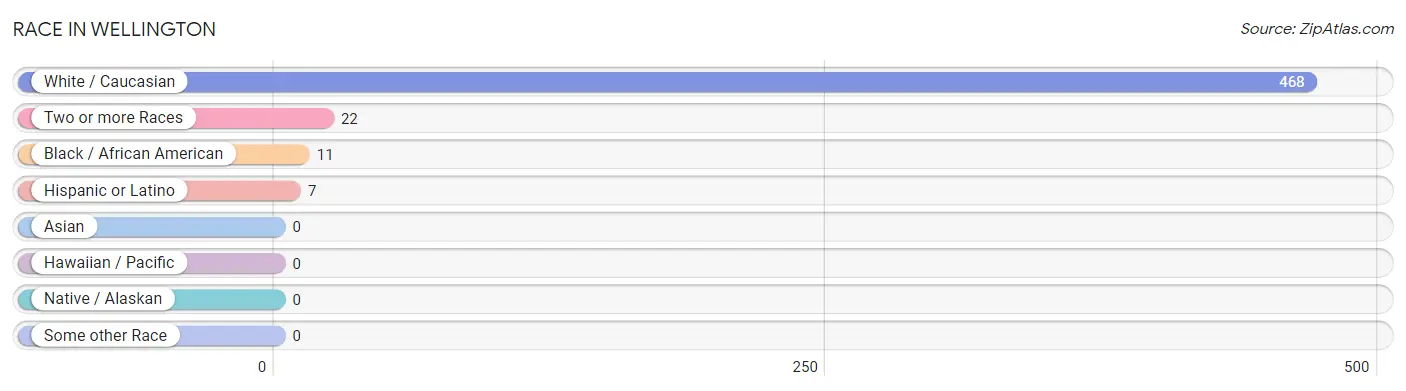
| Race | # Population | % Population |
| Asian | 0 | 0.0% |
| Black / African American | 11 | 2.2% |
| Hawaiian / Pacific | 0 | 0.0% |
| Hispanic or Latino | 7 | 1.4% |
| Native / Alaskan | 0 | 0.0% |
| White / Caucasian | 468 | 93.4% |
| Two or more Races | 22 | 4.4% |
| Some other Race | 0 | 0.0% |
| Total | 501 | 100.0% |
Ancestry in Wellington
The most populous ancestries reported in Wellington are German (99 | 19.8%), Irish (93 | 18.6%), English (39 | 7.8%), American (15 | 3.0%), and Dutch (11 | 2.2%), together accounting for 51.3% of all Wellington residents.
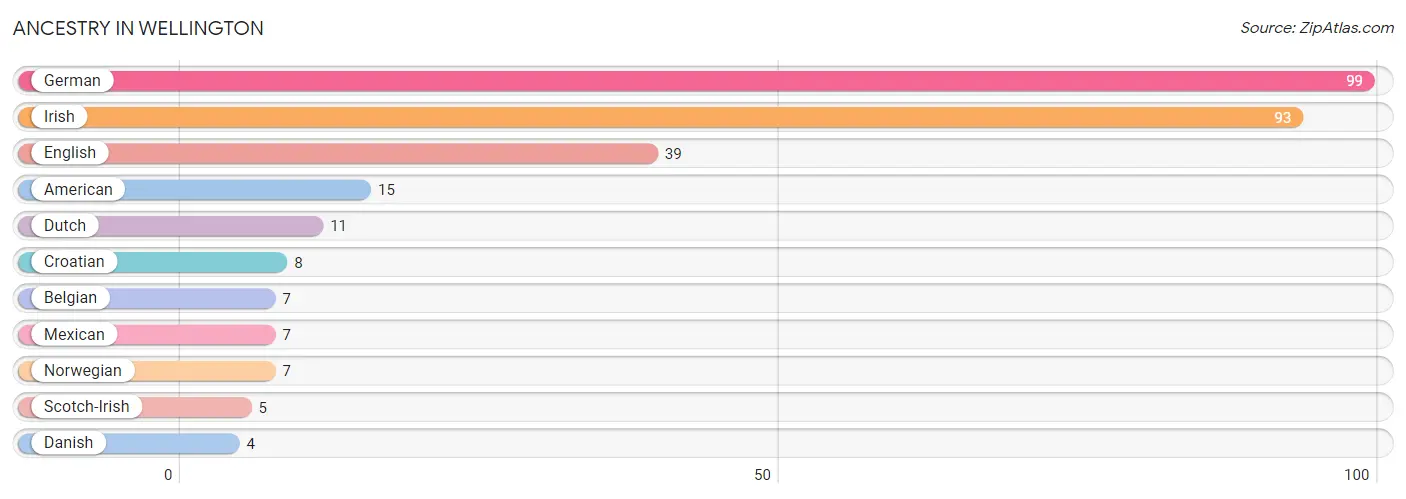
| Ancestry | # Population | % Population |
| American | 15 | 3.0% |
| Belgian | 7 | 1.4% |
| Croatian | 8 | 1.6% |
| Danish | 4 | 0.8% |
| Dutch | 11 | 2.2% |
| English | 39 | 7.8% |
| German | 99 | 19.8% |
| Irish | 93 | 18.6% |
| Mexican | 7 | 1.4% |
| Norwegian | 7 | 1.4% |
| Scotch-Irish | 5 | 1.0% | View All 11 Rows |
Immigrants in Wellington
The most numerous immigrant groups reported in Wellington came from Europe (4 | 0.8%), Netherlands (4 | 0.8%), and Western Europe (4 | 0.8%), together accounting for 2.4% of all Wellington residents.
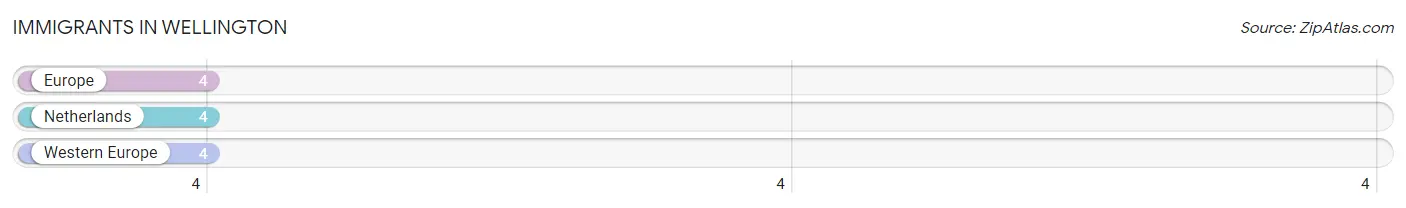
| Immigration Origin | # Population | % Population |
| Europe | 4 | 0.8% |
| Netherlands | 4 | 0.8% |
| Western Europe | 4 | 0.8% | View All 3 Rows |
Sex and Age in Wellington
Sex and Age in Wellington
The most populous age groups in Wellington are 60 to 64 Years (56 | 23.7%) for men and 60 to 64 Years (41 | 15.5%) for women.
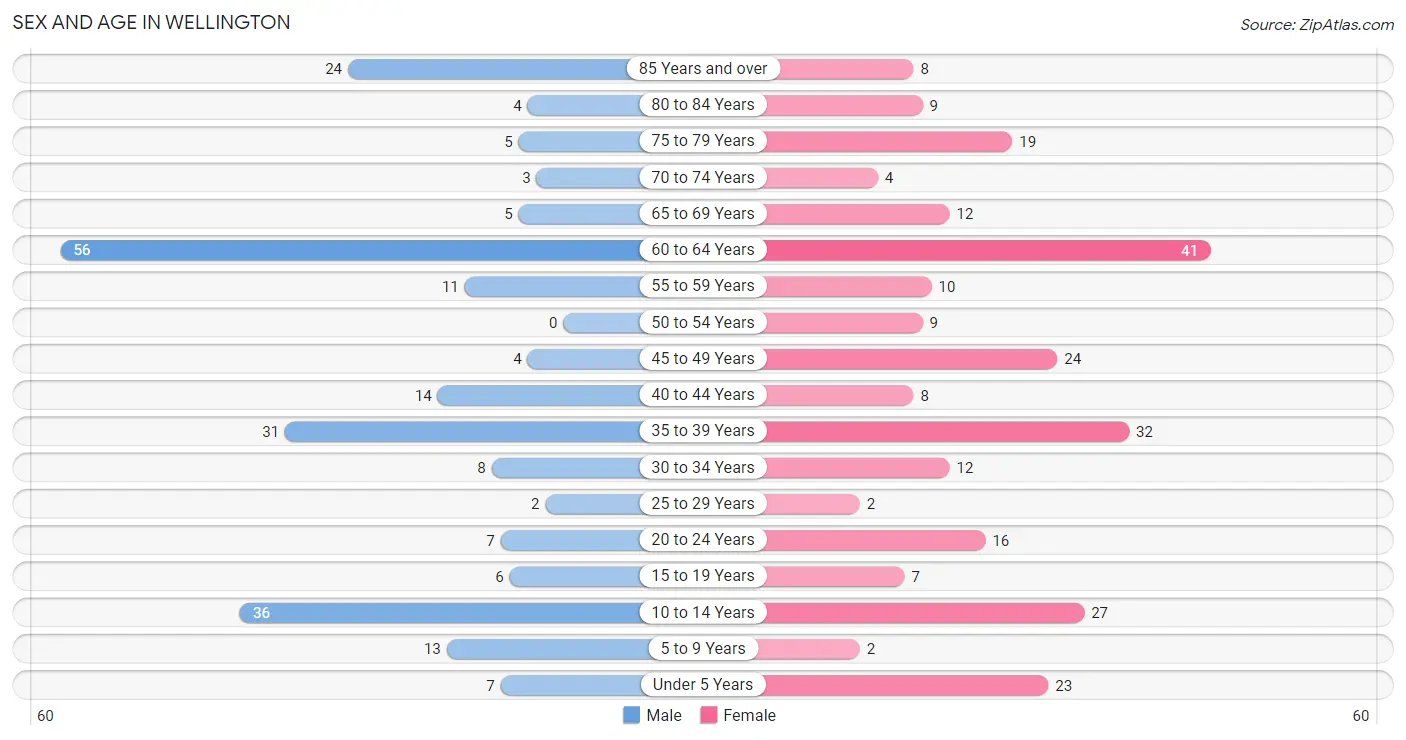
| Age Bracket | Male | Female |
| Under 5 Years | 7 (3.0%) | 23 (8.7%) |
| 5 to 9 Years | 13 (5.5%) | 2 (0.7%) |
| 10 to 14 Years | 36 (15.2%) | 27 (10.2%) |
| 15 to 19 Years | 6 (2.5%) | 7 (2.6%) |
| 20 to 24 Years | 7 (3.0%) | 16 (6.0%) |
| 25 to 29 Years | 2 (0.9%) | 2 (0.7%) |
| 30 to 34 Years | 8 (3.4%) | 12 (4.5%) |
| 35 to 39 Years | 31 (13.1%) | 32 (12.1%) |
| 40 to 44 Years | 14 (5.9%) | 8 (3.0%) |
| 45 to 49 Years | 4 (1.7%) | 24 (9.1%) |
| 50 to 54 Years | 0 (0.0%) | 9 (3.4%) |
| 55 to 59 Years | 11 (4.7%) | 10 (3.8%) |
| 60 to 64 Years | 56 (23.7%) | 41 (15.5%) |
| 65 to 69 Years | 5 (2.1%) | 12 (4.5%) |
| 70 to 74 Years | 3 (1.3%) | 4 (1.5%) |
| 75 to 79 Years | 5 (2.1%) | 19 (7.2%) |
| 80 to 84 Years | 4 (1.7%) | 9 (3.4%) |
| 85 Years and over | 24 (10.2%) | 8 (3.0%) |
| Total | 236 (100.0%) | 265 (100.0%) |
Families and Households in Wellington
Median Family Size in Wellington
The median family size in Wellington is 2.83 persons per family, with single male/father families (12 | 9.1%) accounting for the largest median family size of 3.33 persons per family. On the other hand, single female/mother families (28 | 21.2%) represent the smallest median family size with 2.54 persons per family.
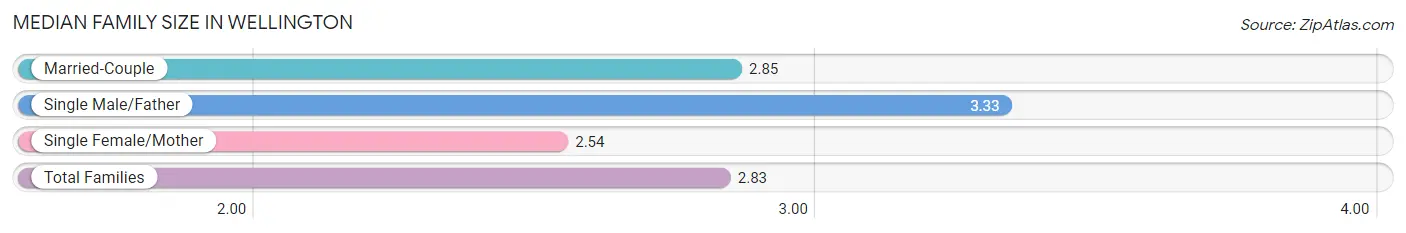
| Family Type | # Families | Family Size |
| Married-Couple | 92 (69.7%) | 2.85 |
| Single Male/Father | 12 (9.1%) | 3.33 |
| Single Female/Mother | 28 (21.2%) | 2.54 |
| Total Families | 132 (100.0%) | 2.83 |
Median Household Size in Wellington
The median household size in Wellington is 2.24 persons per household, with single male/father households (12 | 5.4%) accounting for the largest median household size of 4 persons per household. non-family households (91 | 40.8%) represent the smallest median household size with 1.26 persons per household.
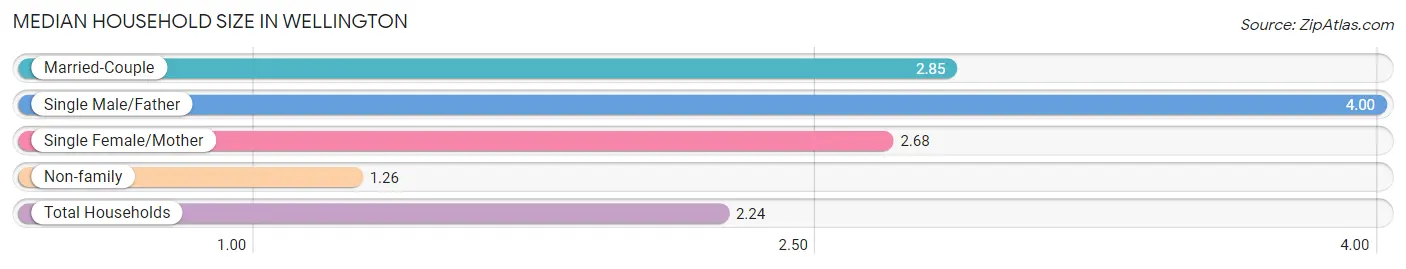
| Household Type | # Households | Household Size |
| Married-Couple | 92 (41.3%) | 2.85 |
| Single Male/Father | 12 (5.4%) | 4.00 |
| Single Female/Mother | 28 (12.6%) | 2.68 |
| Non-family | 91 (40.8%) | 1.26 |
| Total Households | 223 (100.0%) | 2.24 |
Household Size by Marriage Status in Wellington
Out of a total of 223 households in Wellington, 132 (59.2%) are family households, while 91 (40.8%) are nonfamily households. The most numerous type of family households are 2-person households, comprising 78, and the most common type of nonfamily households are 1-person households, comprising 78.
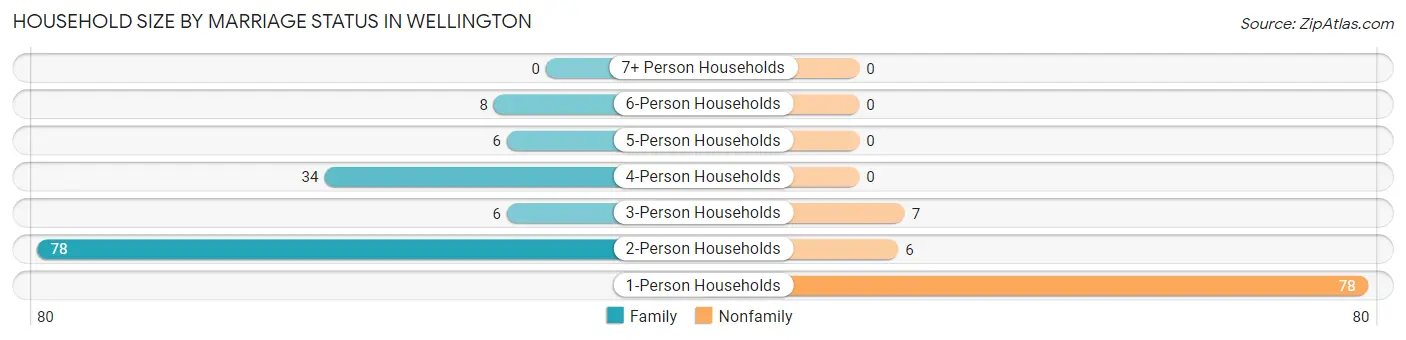
| Household Size | Family Households | Nonfamily Households |
| 1-Person Households | - | 78 (35.0%) |
| 2-Person Households | 78 (35.0%) | 6 (2.7%) |
| 3-Person Households | 6 (2.7%) | 7 (3.1%) |
| 4-Person Households | 34 (15.2%) | 0 (0.0%) |
| 5-Person Households | 6 (2.7%) | 0 (0.0%) |
| 6-Person Households | 8 (3.6%) | 0 (0.0%) |
| 7+ Person Households | 0 (0.0%) | 0 (0.0%) |
| Total | 132 (59.2%) | 91 (40.8%) |
Female Fertility in Wellington
Fertility by Age in Wellington
Average fertility rate in Wellington is 129.0 births per 1,000 women. Women in the age bracket of 35 to 50 years have the highest fertility rate with 203.0 births per 1,000 women. Women in the age bracket of 35 to 50 years acount for 100.0% of all women with births.
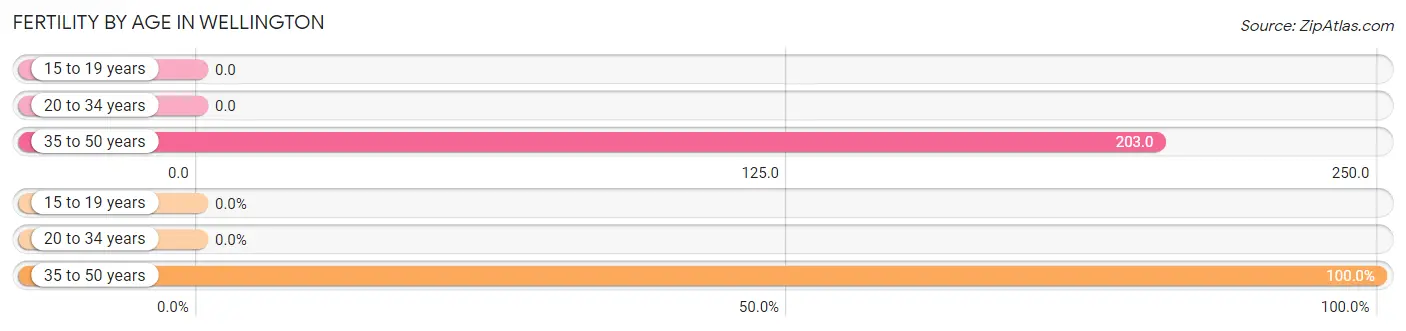
| Age Bracket | Women with Births | Births / 1,000 Women |
| 15 to 19 years | 0 (0.0%) | 0.0 |
| 20 to 34 years | 0 (0.0%) | 0.0 |
| 35 to 50 years | 13 (100.0%) | 203.0 |
| Total | 13 (100.0%) | 129.0 |
Fertility by Age by Marriage Status in Wellington
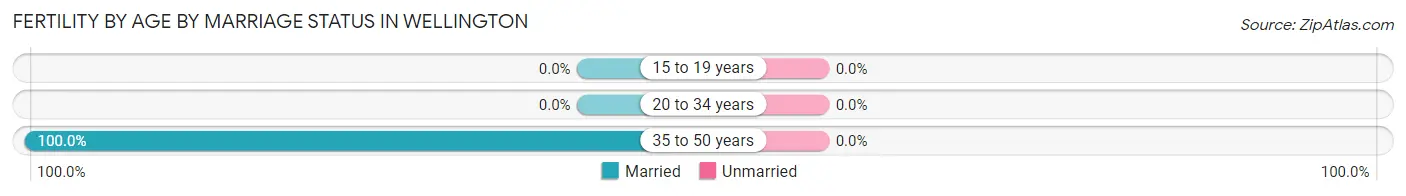
| Age Bracket | Married | Unmarried |
| 15 to 19 years | 0 (0.0%) | 0 (0.0%) |
| 20 to 34 years | 0 (0.0%) | 0 (0.0%) |
| 35 to 50 years | 13 (100.0%) | 0 (0.0%) |
| Total | 13 (100.0%) | 0 (0.0%) |
Fertility by Education in Wellington
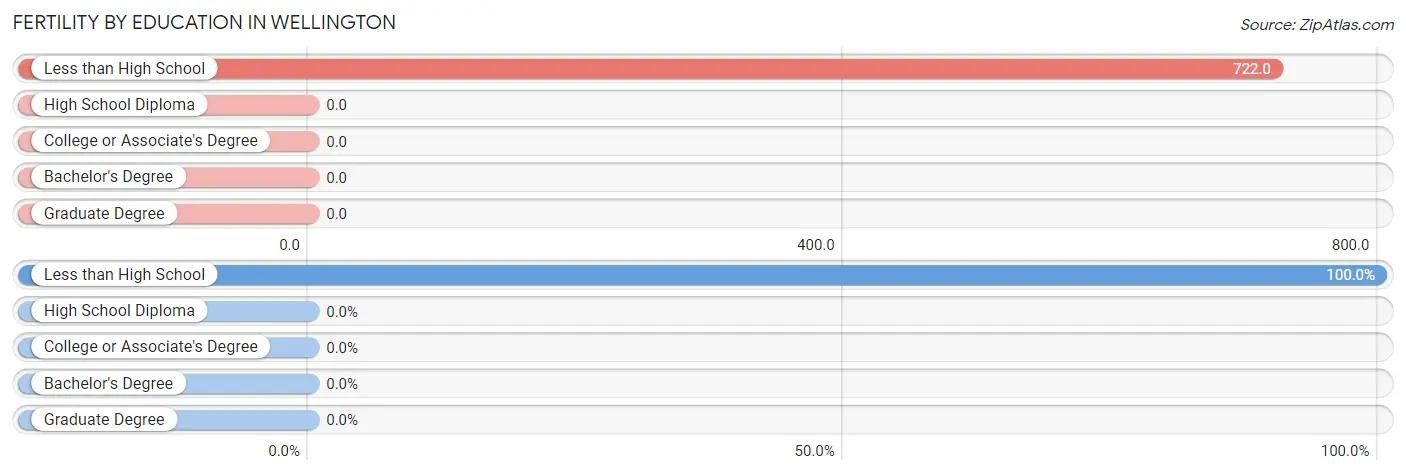
| Educational Attainment | Women with Births | Births / 1,000 Women |
| Less than High School | 13 (100.0%) | 722.0 |
| High School Diploma | 0 (0.0%) | 0.0 |
| College or Associate's Degree | 0 (0.0%) | 0.0 |
| Bachelor's Degree | 0 (0.0%) | 0.0 |
| Graduate Degree | 0 (0.0%) | 0.0 |
| Total | 13 (100.0%) | 129.0 |
Fertility by Education by Marriage Status in Wellington
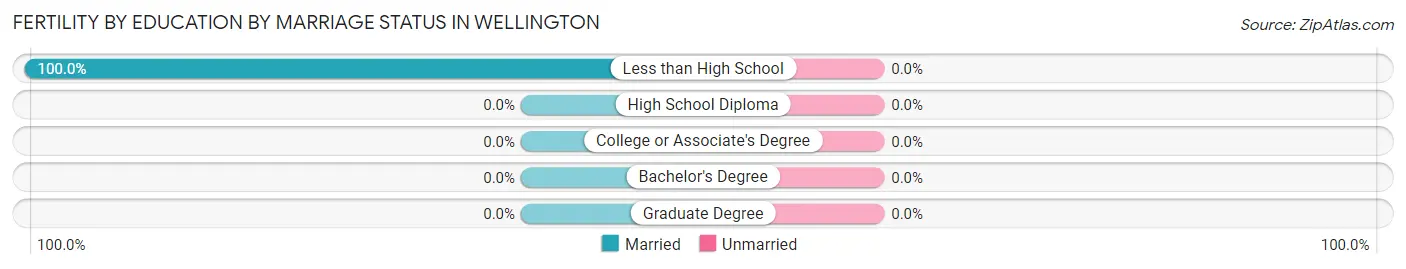
| Educational Attainment | Married | Unmarried |
| Less than High School | 13 (100.0%) | 0 (0.0%) |
| High School Diploma | 0 (0.0%) | 0 (0.0%) |
| College or Associate's Degree | 0 (0.0%) | 0 (0.0%) |
| Bachelor's Degree | 0 (0.0%) | 0 (0.0%) |
| Graduate Degree | 0 (0.0%) | 0 (0.0%) |
| Total | 13 (100.0%) | 0 (0.0%) |
Employment Characteristics in Wellington
Employment by Class of Employer in Wellington
Among the 189 employed individuals in Wellington, private company employees (123 | 65.1%), local government employees (27 | 14.3%), and state government employees (14 | 7.4%) make up the most common classes of employment.
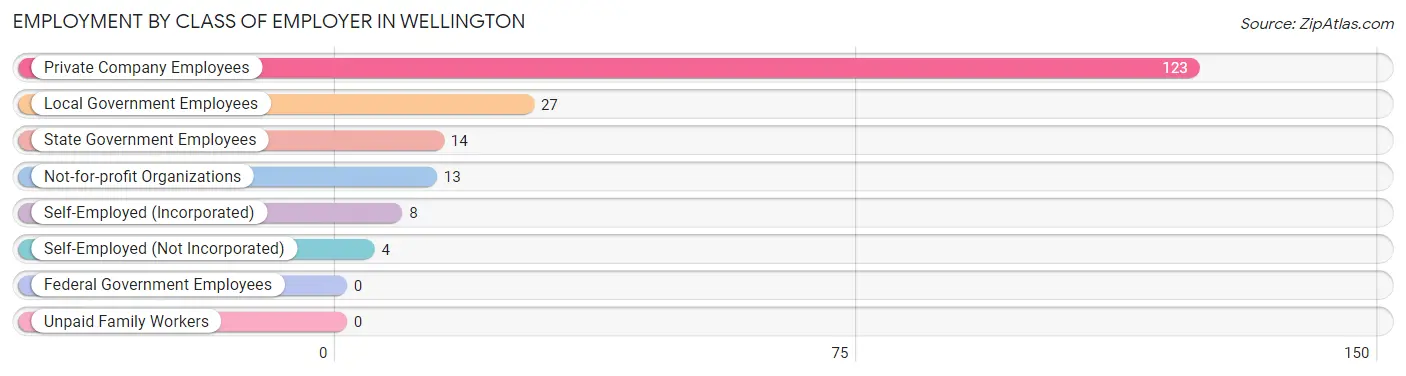
| Employer Class | # Employees | % Employees |
| Private Company Employees | 123 | 65.1% |
| Self-Employed (Incorporated) | 8 | 4.2% |
| Self-Employed (Not Incorporated) | 4 | 2.1% |
| Not-for-profit Organizations | 13 | 6.9% |
| Local Government Employees | 27 | 14.3% |
| State Government Employees | 14 | 7.4% |
| Federal Government Employees | 0 | 0.0% |
| Unpaid Family Workers | 0 | 0.0% |
| Total | 189 | 100.0% |
Employment Status by Age in Wellington
According to the labor force statistics for Wellington, out of the total population over 16 years of age (393), 55.7% or 219 individuals are in the labor force, with 10.5% or 23 of them unemployed. The age group with the highest labor force participation rate is 25 to 29 years, with 100.0% or 4 individuals in the labor force. Within the labor force, the 16 to 19 years age range has the highest percentage of unemployed individuals, with 100.0% or 7 of them being unemployed.
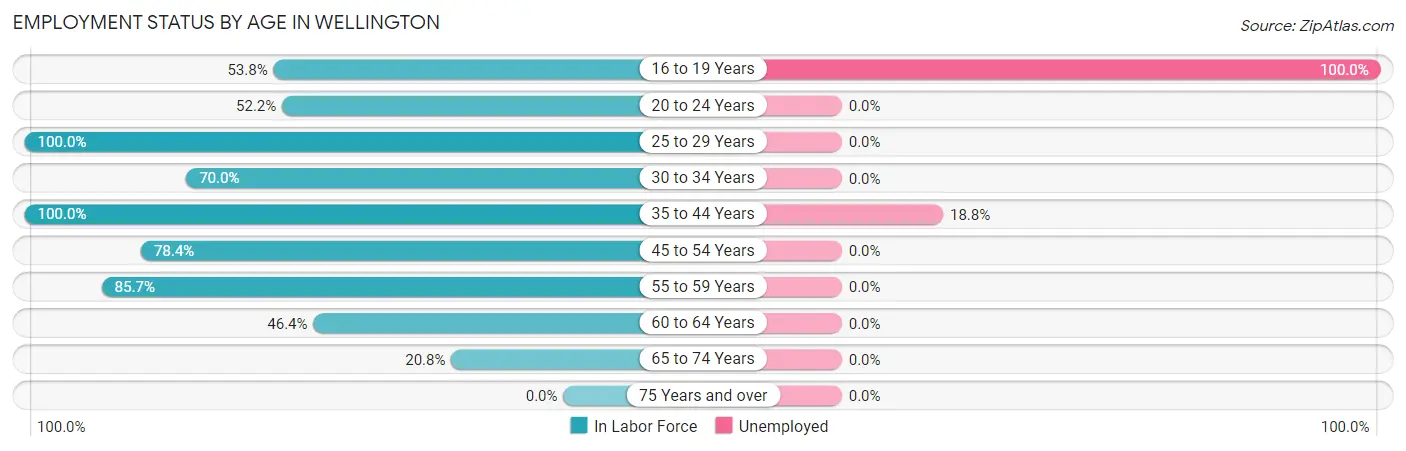
| Age Bracket | In Labor Force | Unemployed |
| 16 to 19 Years | 7 (53.8%) | 7 (100.0%) |
| 20 to 24 Years | 12 (52.2%) | 0 (0.0%) |
| 25 to 29 Years | 4 (100.0%) | 0 (0.0%) |
| 30 to 34 Years | 14 (70.0%) | 0 (0.0%) |
| 35 to 44 Years | 85 (100.0%) | 16 (18.8%) |
| 45 to 54 Years | 29 (78.4%) | 0 (0.0%) |
| 55 to 59 Years | 18 (85.7%) | 0 (0.0%) |
| 60 to 64 Years | 45 (46.4%) | 0 (0.0%) |
| 65 to 74 Years | 5 (20.8%) | 0 (0.0%) |
| 75 Years and over | 0 (0.0%) | 0 (0.0%) |
| Total | 219 (55.7%) | 23 (10.5%) |
Employment Status by Educational Attainment in Wellington
According to labor force statistics for Wellington, 73.9% of individuals (195) out of the total population between 25 and 64 years of age (264) are in the labor force, with 8.2% or 16 of them being unemployed. The group with the highest labor force participation rate are those with the educational attainment of less than high school, with 100.0% or 20 individuals in the labor force. Within the labor force, individuals with high school diploma education have the highest percentage of unemployment, with 20.8% or 16 of them being unemployed.
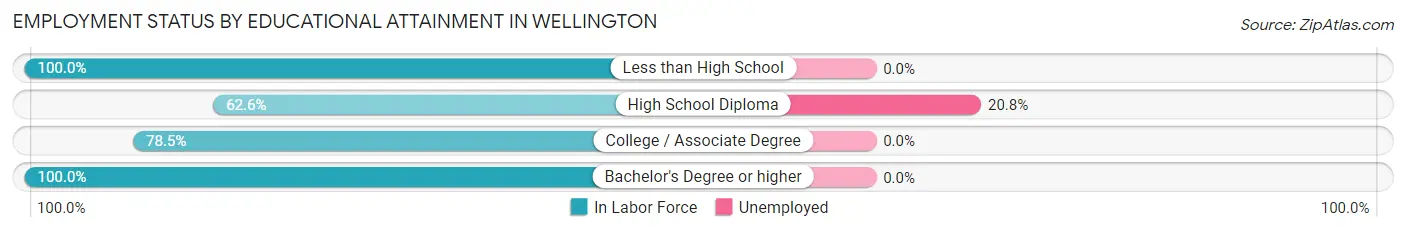
| Educational Attainment | In Labor Force | Unemployed |
| Less than High School | 20 (100.0%) | 0 (0.0%) |
| High School Diploma | 77 (62.6%) | 26 (20.8%) |
| College / Associate Degree | 84 (78.5%) | 0 (0.0%) |
| Bachelor's Degree or higher | 14 (100.0%) | 0 (0.0%) |
| Total | 195 (73.9%) | 22 (8.2%) |
Employment Occupations by Sex in Wellington
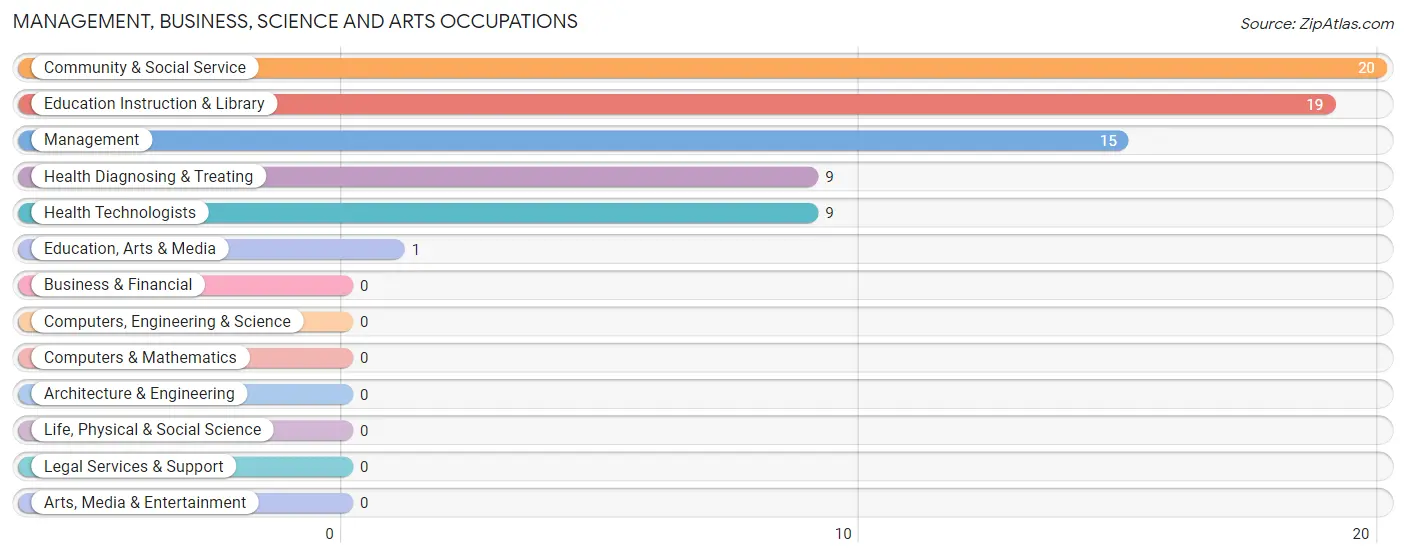
Management, Business, Science and Arts Occupations
The most common Management, Business, Science and Arts occupations in Wellington are Community & Social Service (20 | 10.2%), Education Instruction & Library (19 | 9.7%), Management (15 | 7.6%), Health Diagnosing & Treating (9 | 4.6%), and Health Technologists (9 | 4.6%).
Management, Business, Science and Arts Occupations by Sex
Within the Management, Business, Science and Arts occupations in Wellington, the most male-oriented occupations are Management (100.0%), Education, Arts & Media (100.0%), and Community & Social Service (5.0%), while the most female-oriented occupations are Education Instruction & Library (100.0%), Health Diagnosing & Treating (100.0%), and Health Technologists (100.0%).
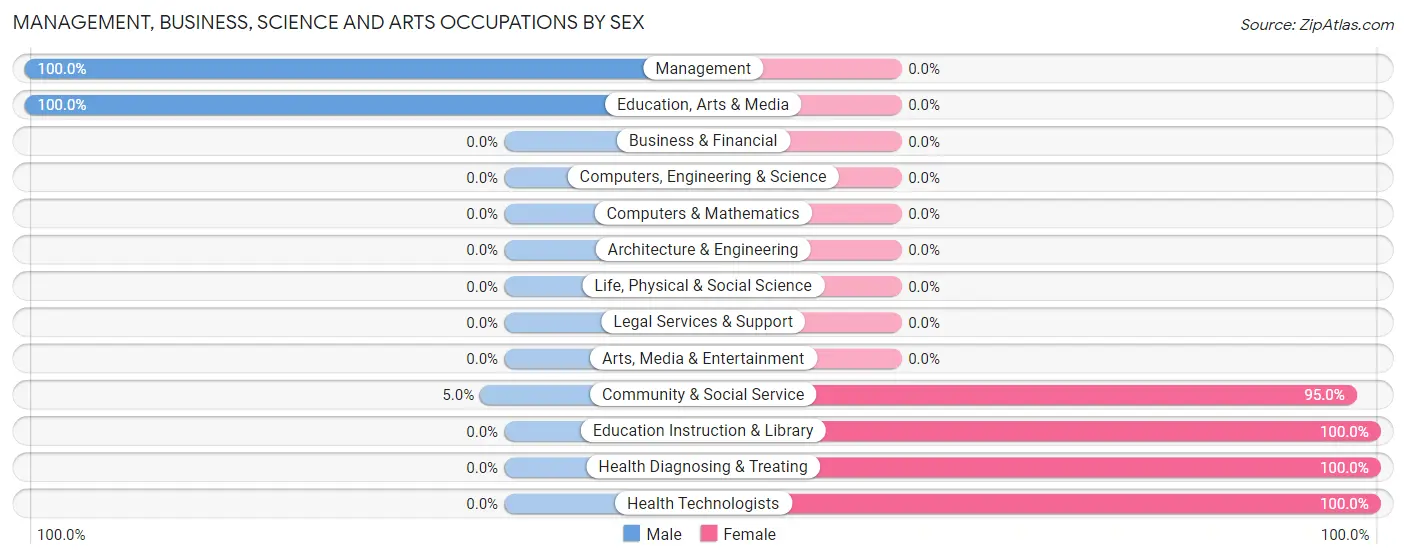
| Occupation | Male | Female |
| Management | 15 (100.0%) | 0 (0.0%) |
| Business & Financial | 0 (0.0%) | 0 (0.0%) |
| Computers, Engineering & Science | 0 (0.0%) | 0 (0.0%) |
| Computers & Mathematics | 0 (0.0%) | 0 (0.0%) |
| Architecture & Engineering | 0 (0.0%) | 0 (0.0%) |
| Life, Physical & Social Science | 0 (0.0%) | 0 (0.0%) |
| Community & Social Service | 1 (5.0%) | 19 (95.0%) |
| Education, Arts & Media | 1 (100.0%) | 0 (0.0%) |
| Legal Services & Support | 0 (0.0%) | 0 (0.0%) |
| Education Instruction & Library | 0 (0.0%) | 19 (100.0%) |
| Arts, Media & Entertainment | 0 (0.0%) | 0 (0.0%) |
| Health Diagnosing & Treating | 0 (0.0%) | 9 (100.0%) |
| Health Technologists | 0 (0.0%) | 9 (100.0%) |
| Total (Category) | 16 (36.4%) | 28 (63.6%) |
| Total (Overall) | 110 (56.1%) | 86 (43.9%) |
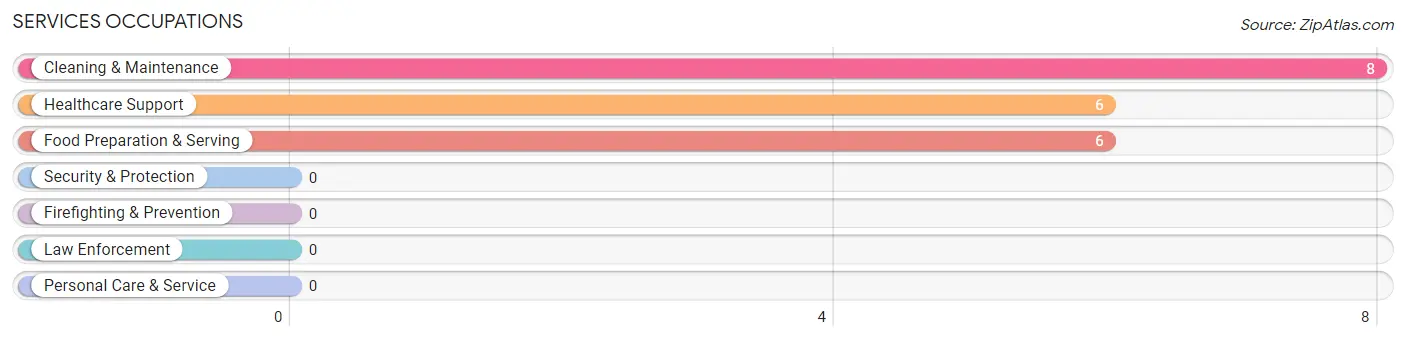
Services Occupations
The most common Services occupations in Wellington are Cleaning & Maintenance (8 | 4.1%), Healthcare Support (6 | 3.1%), and Food Preparation & Serving (6 | 3.1%).
Services Occupations by Sex
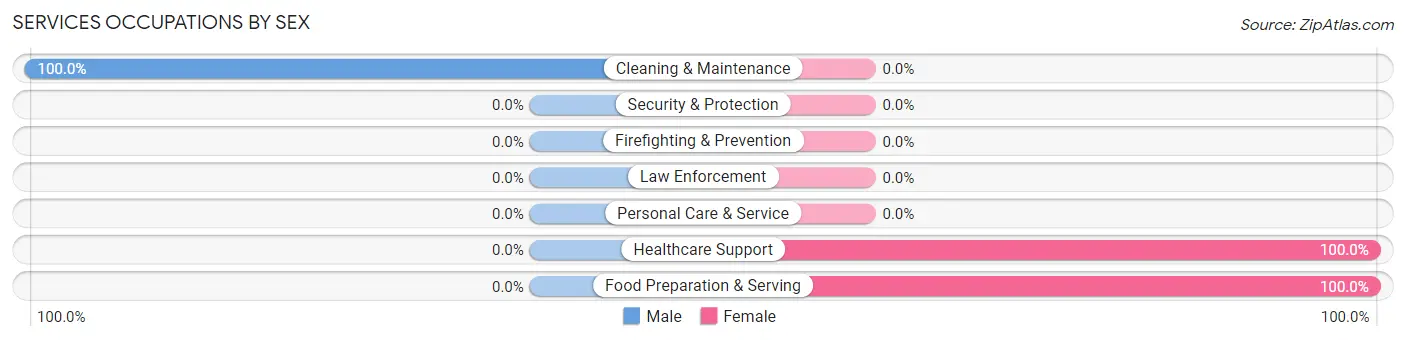
| Occupation | Male | Female |
| Healthcare Support | 0 (0.0%) | 6 (100.0%) |
| Security & Protection | 0 (0.0%) | 0 (0.0%) |
| Firefighting & Prevention | 0 (0.0%) | 0 (0.0%) |
| Law Enforcement | 0 (0.0%) | 0 (0.0%) |
| Food Preparation & Serving | 0 (0.0%) | 6 (100.0%) |
| Cleaning & Maintenance | 8 (100.0%) | 0 (0.0%) |
| Personal Care & Service | 0 (0.0%) | 0 (0.0%) |
| Total (Category) | 8 (40.0%) | 12 (60.0%) |
| Total (Overall) | 110 (56.1%) | 86 (43.9%) |
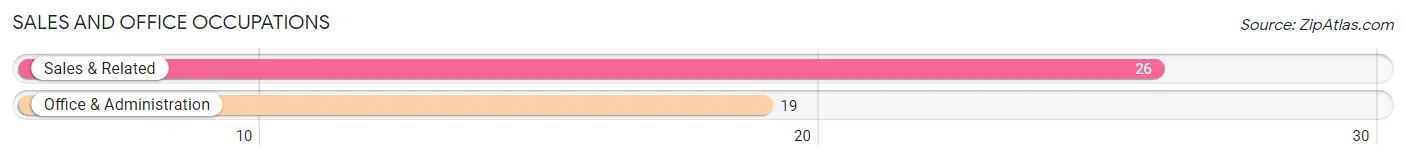
Sales and Office Occupations
The most common Sales and Office occupations in Wellington are Sales & Related (26 | 13.3%), and Office & Administration (19 | 9.7%).
Sales and Office Occupations by Sex
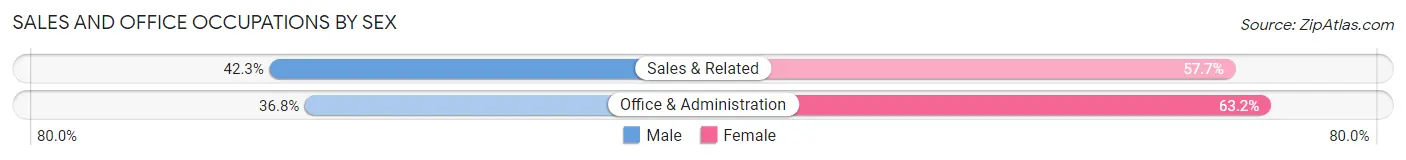
| Occupation | Male | Female |
| Sales & Related | 11 (42.3%) | 15 (57.7%) |
| Office & Administration | 7 (36.8%) | 12 (63.2%) |
| Total (Category) | 18 (40.0%) | 27 (60.0%) |
| Total (Overall) | 110 (56.1%) | 86 (43.9%) |
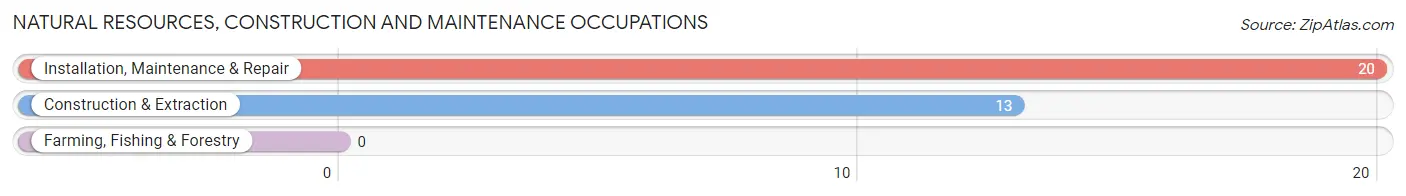
Natural Resources, Construction and Maintenance Occupations
The most common Natural Resources, Construction and Maintenance occupations in Wellington are Installation, Maintenance & Repair (20 | 10.2%), and Construction & Extraction (13 | 6.6%).
Natural Resources, Construction and Maintenance Occupations by Sex
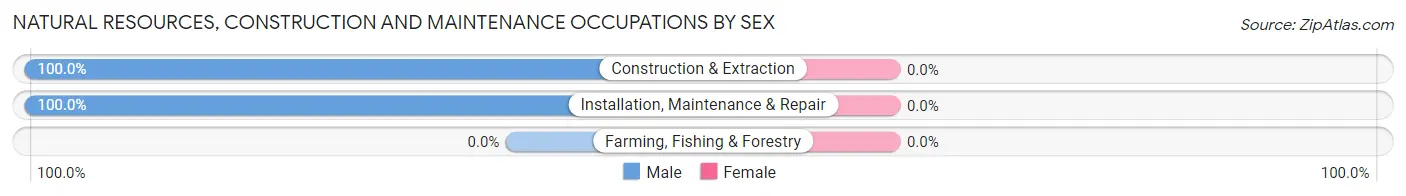
| Occupation | Male | Female |
| Farming, Fishing & Forestry | 0 (0.0%) | 0 (0.0%) |
| Construction & Extraction | 13 (100.0%) | 0 (0.0%) |
| Installation, Maintenance & Repair | 20 (100.0%) | 0 (0.0%) |
| Total (Category) | 33 (100.0%) | 0 (0.0%) |
| Total (Overall) | 110 (56.1%) | 86 (43.9%) |
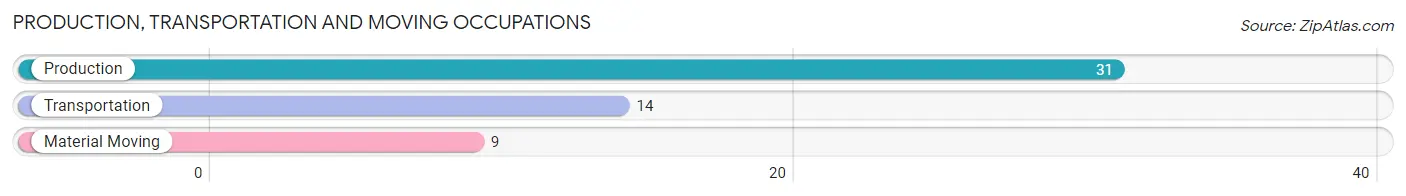
Production, Transportation and Moving Occupations
The most common Production, Transportation and Moving occupations in Wellington are Production (31 | 15.8%), Transportation (14 | 7.1%), and Material Moving (9 | 4.6%).
Production, Transportation and Moving Occupations by Sex
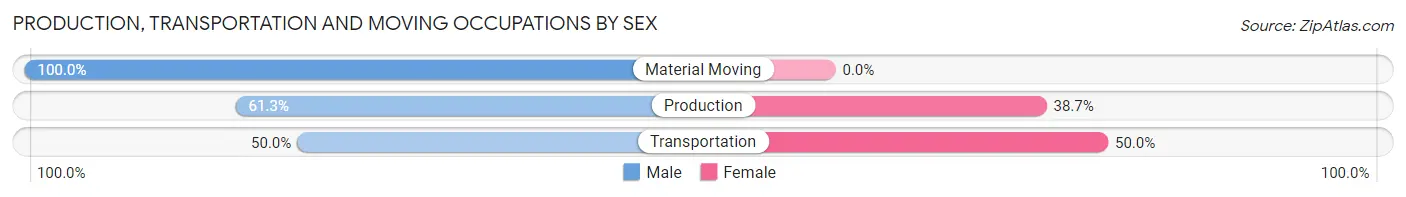
| Occupation | Male | Female |
| Production | 19 (61.3%) | 12 (38.7%) |
| Transportation | 7 (50.0%) | 7 (50.0%) |
| Material Moving | 9 (100.0%) | 0 (0.0%) |
| Total (Category) | 35 (64.8%) | 19 (35.2%) |
| Total (Overall) | 110 (56.1%) | 86 (43.9%) |
Employment Industries by Sex in Wellington
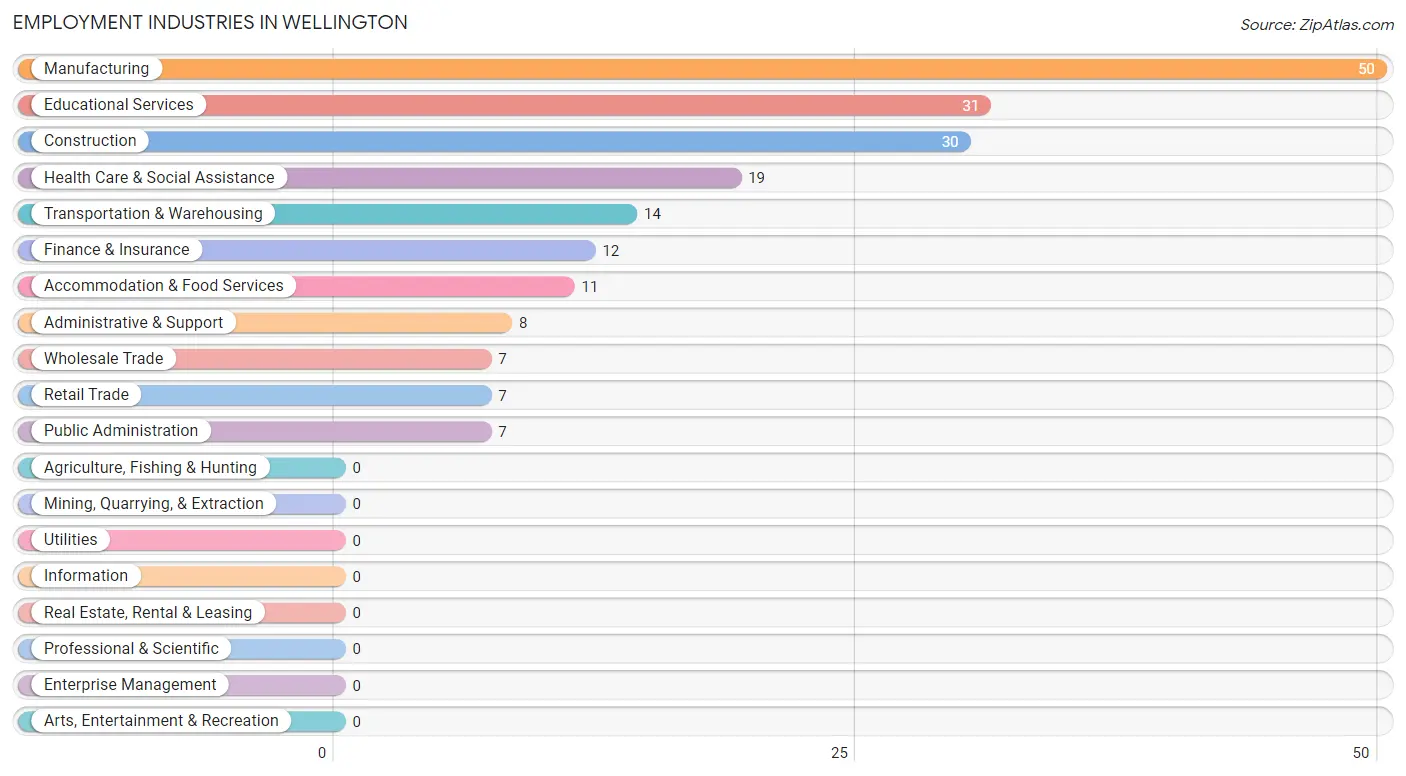
Employment Industries in Wellington
The major employment industries in Wellington include Manufacturing (50 | 25.5%), Educational Services (31 | 15.8%), Construction (30 | 15.3%), Health Care & Social Assistance (19 | 9.7%), and Transportation & Warehousing (14 | 7.1%).
Employment Industries by Sex in Wellington
The Wellington industries that see more men than women are Retail Trade (100.0%), Administrative & Support (100.0%), and Public Administration (100.0%), whereas the industries that tend to have a higher number of women are Accommodation & Food Services (100.0%), Health Care & Social Assistance (78.9%), and Educational Services (74.2%).
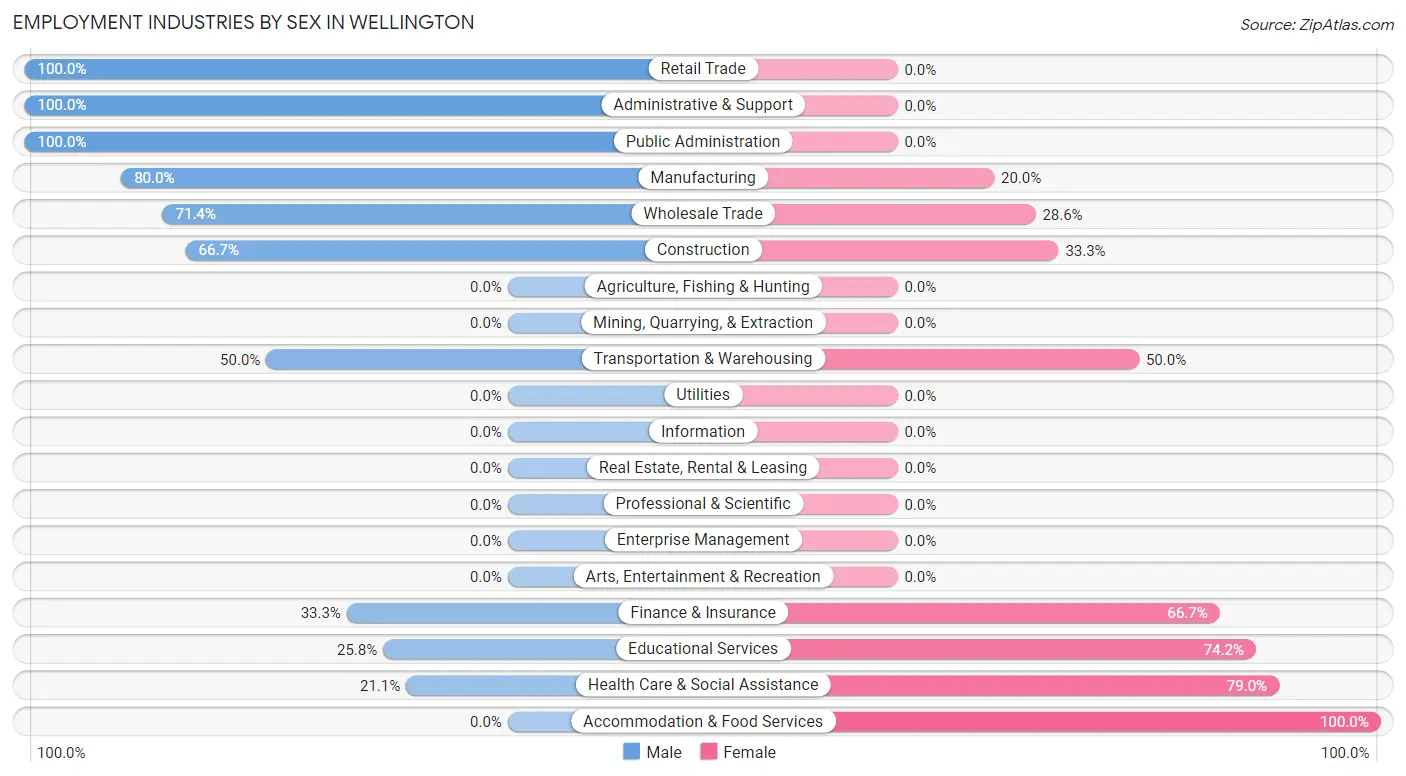
| Industry | Male | Female |
| Agriculture, Fishing & Hunting | 0 (0.0%) | 0 (0.0%) |
| Mining, Quarrying, & Extraction | 0 (0.0%) | 0 (0.0%) |
| Construction | 20 (66.7%) | 10 (33.3%) |
| Manufacturing | 40 (80.0%) | 10 (20.0%) |
| Wholesale Trade | 5 (71.4%) | 2 (28.6%) |
| Retail Trade | 7 (100.0%) | 0 (0.0%) |
| Transportation & Warehousing | 7 (50.0%) | 7 (50.0%) |
| Utilities | 0 (0.0%) | 0 (0.0%) |
| Information | 0 (0.0%) | 0 (0.0%) |
| Finance & Insurance | 4 (33.3%) | 8 (66.7%) |
| Real Estate, Rental & Leasing | 0 (0.0%) | 0 (0.0%) |
| Professional & Scientific | 0 (0.0%) | 0 (0.0%) |
| Enterprise Management | 0 (0.0%) | 0 (0.0%) |
| Administrative & Support | 8 (100.0%) | 0 (0.0%) |
| Educational Services | 8 (25.8%) | 23 (74.2%) |
| Health Care & Social Assistance | 4 (21.0%) | 15 (78.9%) |
| Arts, Entertainment & Recreation | 0 (0.0%) | 0 (0.0%) |
| Accommodation & Food Services | 0 (0.0%) | 11 (100.0%) |
| Public Administration | 7 (100.0%) | 0 (0.0%) |
| Total | 110 (56.1%) | 86 (43.9%) |
Education in Wellington
School Enrollment in Wellington
The most common levels of schooling among the 91 students in Wellington are middle school (52 | 57.1%), high school (24 | 26.4%), and kindergarten (13 | 14.3%).
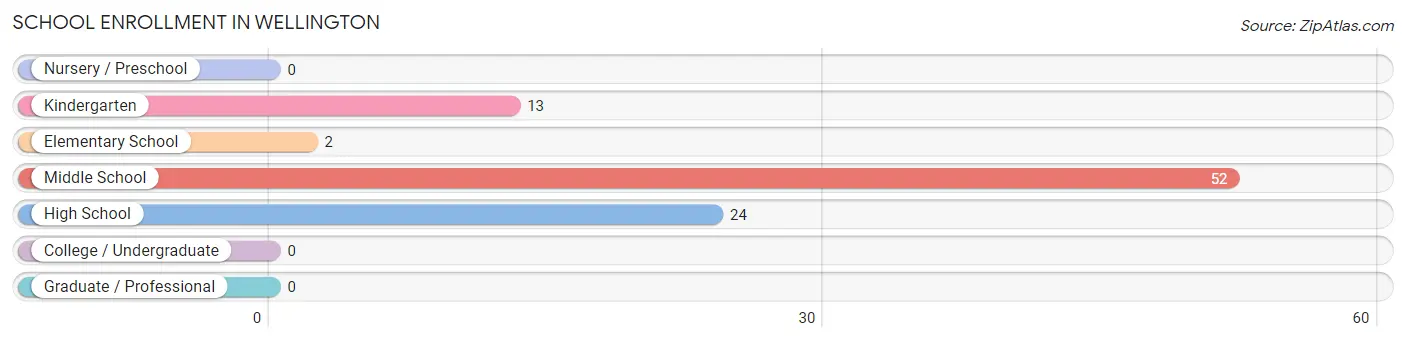
| School Level | # Students | % Students |
| Nursery / Preschool | 0 | 0.0% |
| Kindergarten | 13 | 14.3% |
| Elementary School | 2 | 2.2% |
| Middle School | 52 | 57.1% |
| High School | 24 | 26.4% |
| College / Undergraduate | 0 | 0.0% |
| Graduate / Professional | 0 | 0.0% |
| Total | 91 | 100.0% |
School Enrollment by Age by Funding Source in Wellington
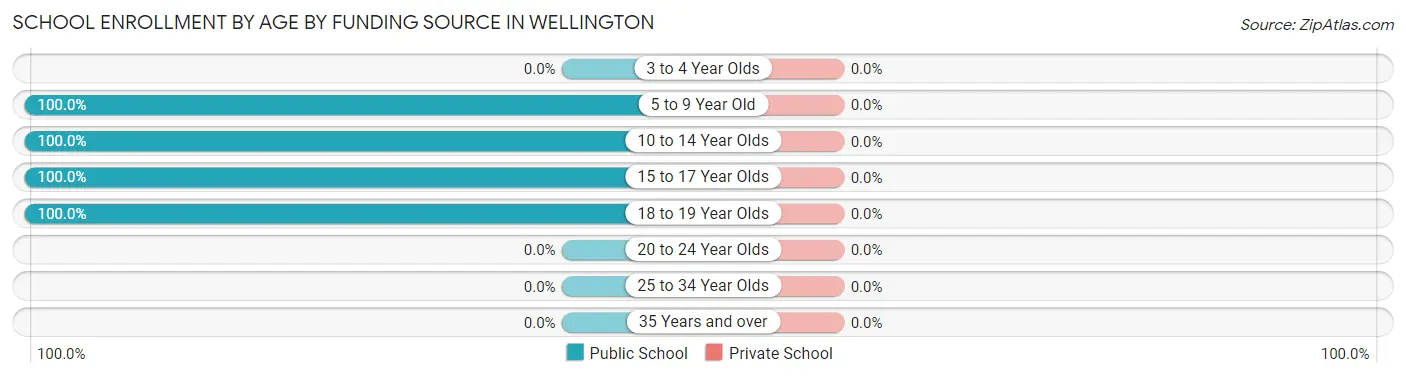
| Age Bracket | Public School | Private School |
| 3 to 4 Year Olds | 0 (0.0%) | 0 (0.0%) |
| 5 to 9 Year Old | 15 (100.0%) | 0 (0.0%) |
| 10 to 14 Year Olds | 63 (100.0%) | 0 (0.0%) |
| 15 to 17 Year Olds | 6 (100.0%) | 0 (0.0%) |
| 18 to 19 Year Olds | 7 (100.0%) | 0 (0.0%) |
| 20 to 24 Year Olds | 0 (0.0%) | 0 (0.0%) |
| 25 to 34 Year Olds | 0 (0.0%) | 0 (0.0%) |
| 35 Years and over | 0 (0.0%) | 0 (0.0%) |
| Total | 91 (100.0%) | 0 (0.0%) |
Educational Attainment by Field of Study in Wellington
Education (14 | 53.8%), science & technology (8 | 30.8%), and arts & humanities (4 | 15.4%) are the most common fields of study among 26 individuals in Wellington who have obtained a bachelor's degree or higher.
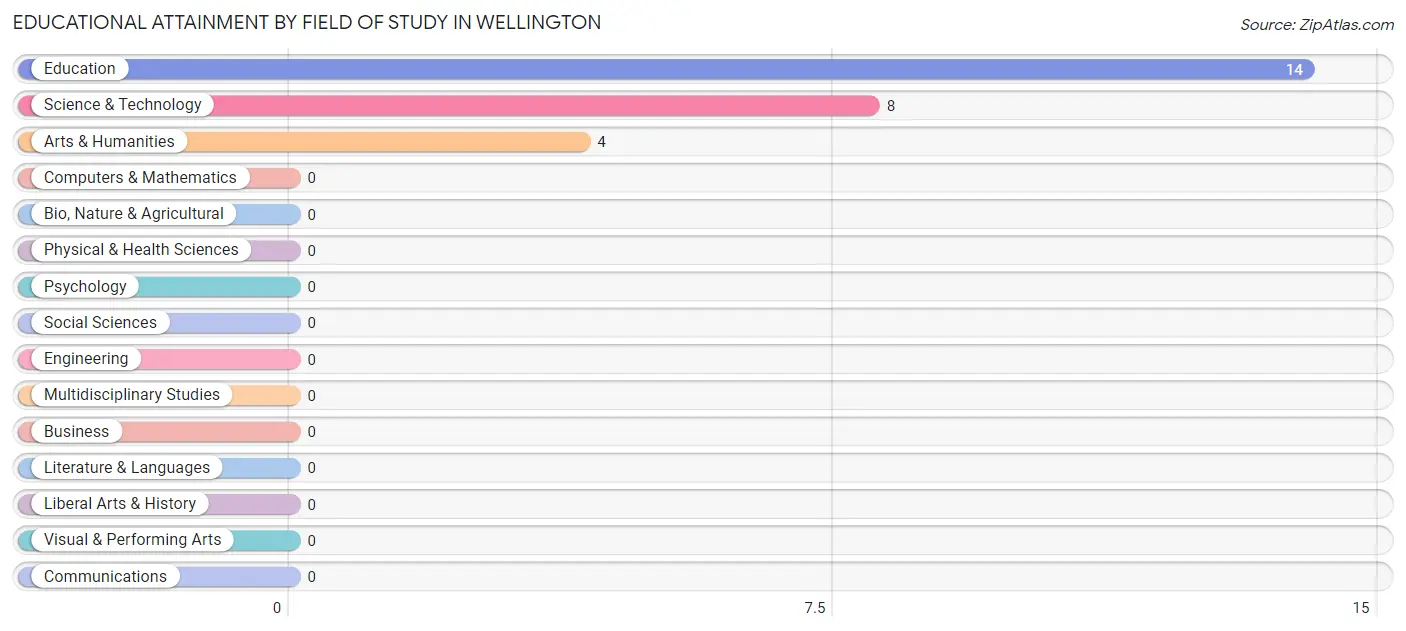
| Field of Study | # Graduates | % Graduates |
| Computers & Mathematics | 0 | 0.0% |
| Bio, Nature & Agricultural | 0 | 0.0% |
| Physical & Health Sciences | 0 | 0.0% |
| Psychology | 0 | 0.0% |
| Social Sciences | 0 | 0.0% |
| Engineering | 0 | 0.0% |
| Multidisciplinary Studies | 0 | 0.0% |
| Science & Technology | 8 | 30.8% |
| Business | 0 | 0.0% |
| Education | 14 | 53.8% |
| Literature & Languages | 0 | 0.0% |
| Liberal Arts & History | 0 | 0.0% |
| Visual & Performing Arts | 0 | 0.0% |
| Communications | 0 | 0.0% |
| Arts & Humanities | 4 | 15.4% |
| Total | 26 | 100.0% |
Transportation & Commute in Wellington
Vehicle Availability by Sex in Wellington
The most prevalent vehicle ownership categories in Wellington are males with 2 vehicles (47, accounting for 45.6%) and females with 2 vehicles (45, making up 54.6%).
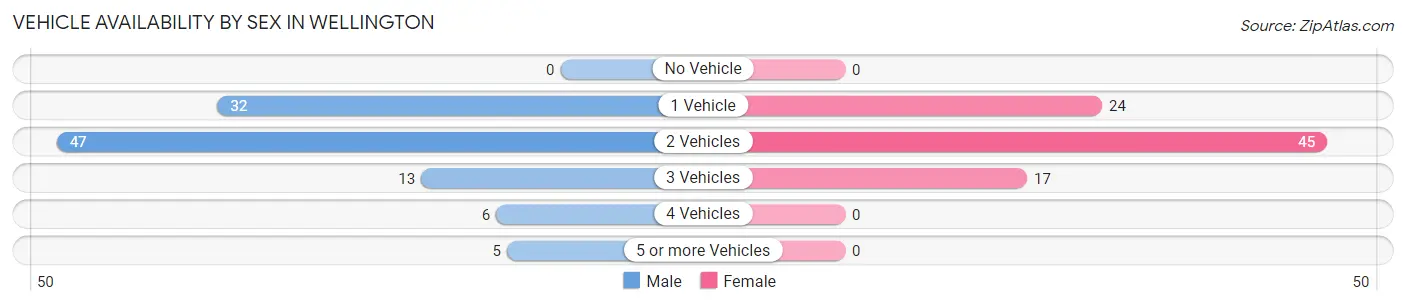
| Vehicles Available | Male | Female |
| No Vehicle | 0 (0.0%) | 0 (0.0%) |
| 1 Vehicle | 32 (31.1%) | 24 (27.9%) |
| 2 Vehicles | 47 (45.6%) | 45 (52.3%) |
| 3 Vehicles | 13 (12.6%) | 17 (19.8%) |
| 4 Vehicles | 6 (5.8%) | 0 (0.0%) |
| 5 or more Vehicles | 5 (4.9%) | 0 (0.0%) |
| Total | 103 (100.0%) | 86 (100.0%) |
Commute Time in Wellington
The most frequently occuring commute durations in Wellington are 45 to 59 minutes (42 commuters, 22.2%), 30 to 34 minutes (35 commuters, 18.5%), and 40 to 44 minutes (24 commuters, 12.7%).
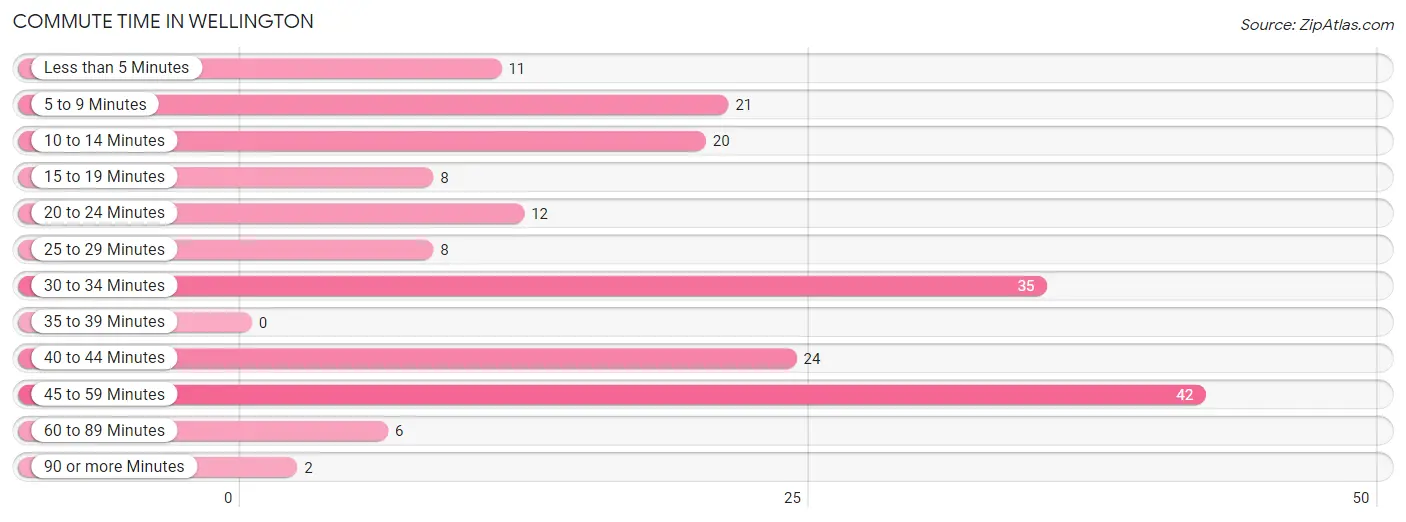
| Commute Time | # Commuters | % Commuters |
| Less than 5 Minutes | 11 | 5.8% |
| 5 to 9 Minutes | 21 | 11.1% |
| 10 to 14 Minutes | 20 | 10.6% |
| 15 to 19 Minutes | 8 | 4.2% |
| 20 to 24 Minutes | 12 | 6.4% |
| 25 to 29 Minutes | 8 | 4.2% |
| 30 to 34 Minutes | 35 | 18.5% |
| 35 to 39 Minutes | 0 | 0.0% |
| 40 to 44 Minutes | 24 | 12.7% |
| 45 to 59 Minutes | 42 | 22.2% |
| 60 to 89 Minutes | 6 | 3.2% |
| 90 or more Minutes | 2 | 1.1% |
Commute Time by Sex in Wellington
The most common commute times in Wellington are 30 to 34 minutes (28 commuters, 27.2%) for males and 45 to 59 minutes (25 commuters, 29.1%) for females.
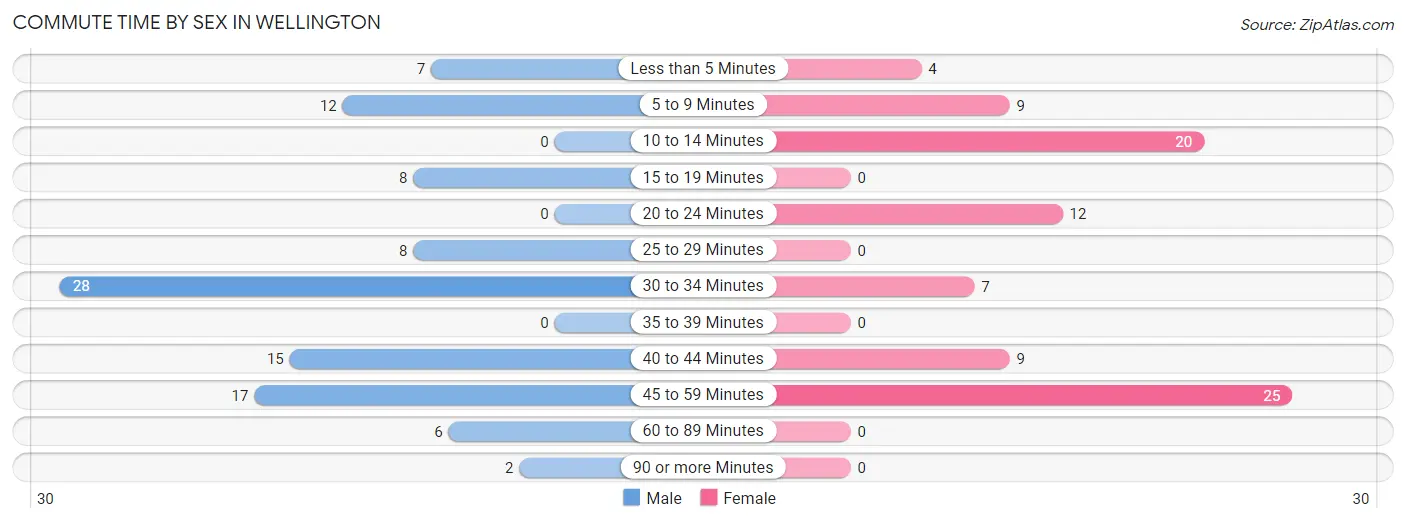
| Commute Time | Male | Female |
| Less than 5 Minutes | 7 (6.8%) | 4 (4.6%) |
| 5 to 9 Minutes | 12 (11.7%) | 9 (10.5%) |
| 10 to 14 Minutes | 0 (0.0%) | 20 (23.3%) |
| 15 to 19 Minutes | 8 (7.8%) | 0 (0.0%) |
| 20 to 24 Minutes | 0 (0.0%) | 12 (14.0%) |
| 25 to 29 Minutes | 8 (7.8%) | 0 (0.0%) |
| 30 to 34 Minutes | 28 (27.2%) | 7 (8.1%) |
| 35 to 39 Minutes | 0 (0.0%) | 0 (0.0%) |
| 40 to 44 Minutes | 15 (14.6%) | 9 (10.5%) |
| 45 to 59 Minutes | 17 (16.5%) | 25 (29.1%) |
| 60 to 89 Minutes | 6 (5.8%) | 0 (0.0%) |
| 90 or more Minutes | 2 (1.9%) | 0 (0.0%) |
Time of Departure to Work by Sex in Wellington
The most frequent times of departure to work in Wellington are 12:00 AM to 4:59 AM (24, 23.3%) for males and 4:00 PM to 11:59 PM (27, 31.4%) for females.
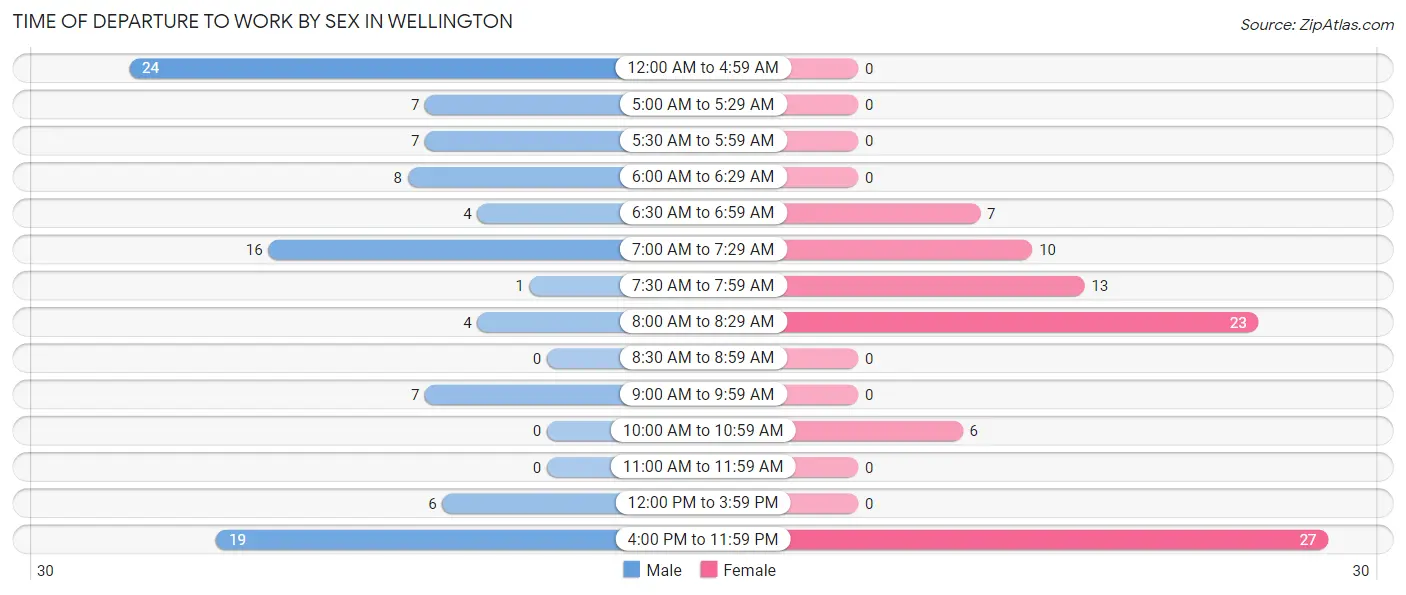
| Time of Departure | Male | Female |
| 12:00 AM to 4:59 AM | 24 (23.3%) | 0 (0.0%) |
| 5:00 AM to 5:29 AM | 7 (6.8%) | 0 (0.0%) |
| 5:30 AM to 5:59 AM | 7 (6.8%) | 0 (0.0%) |
| 6:00 AM to 6:29 AM | 8 (7.8%) | 0 (0.0%) |
| 6:30 AM to 6:59 AM | 4 (3.9%) | 7 (8.1%) |
| 7:00 AM to 7:29 AM | 16 (15.5%) | 10 (11.6%) |
| 7:30 AM to 7:59 AM | 1 (1.0%) | 13 (15.1%) |
| 8:00 AM to 8:29 AM | 4 (3.9%) | 23 (26.7%) |
| 8:30 AM to 8:59 AM | 0 (0.0%) | 0 (0.0%) |
| 9:00 AM to 9:59 AM | 7 (6.8%) | 0 (0.0%) |
| 10:00 AM to 10:59 AM | 0 (0.0%) | 6 (7.0%) |
| 11:00 AM to 11:59 AM | 0 (0.0%) | 0 (0.0%) |
| 12:00 PM to 3:59 PM | 6 (5.8%) | 0 (0.0%) |
| 4:00 PM to 11:59 PM | 19 (18.4%) | 27 (31.4%) |
| Total | 103 (100.0%) | 86 (100.0%) |
Housing Occupancy in Wellington
Occupancy by Ownership in Wellington
Of the total 223 dwellings in Wellington, owner-occupied units account for 175 (78.5%), while renter-occupied units make up 48 (21.5%).
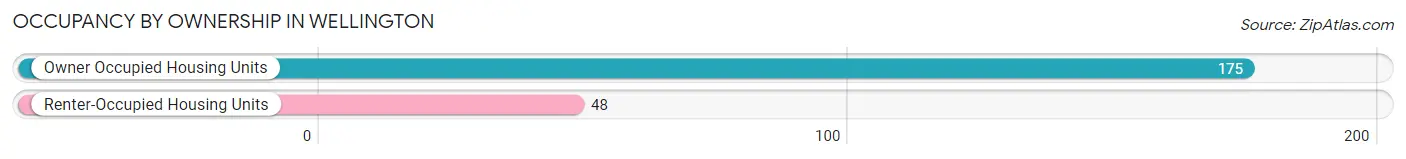
| Occupancy | # Housing Units | % Housing Units |
| Owner Occupied Housing Units | 175 | 78.5% |
| Renter-Occupied Housing Units | 48 | 21.5% |
| Total Occupied Housing Units | 223 | 100.0% |
Occupancy by Household Size in Wellington
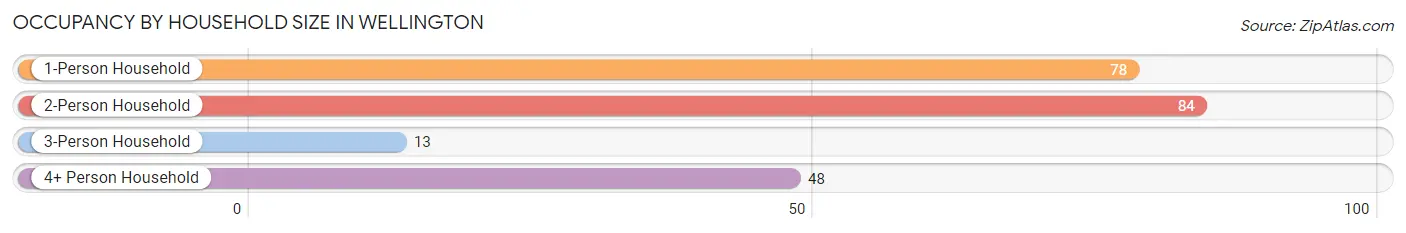
| Household Size | # Housing Units | % Housing Units |
| 1-Person Household | 78 | 35.0% |
| 2-Person Household | 84 | 37.7% |
| 3-Person Household | 13 | 5.8% |
| 4+ Person Household | 48 | 21.5% |
| Total Housing Units | 223 | 100.0% |
Occupancy by Ownership by Household Size in Wellington
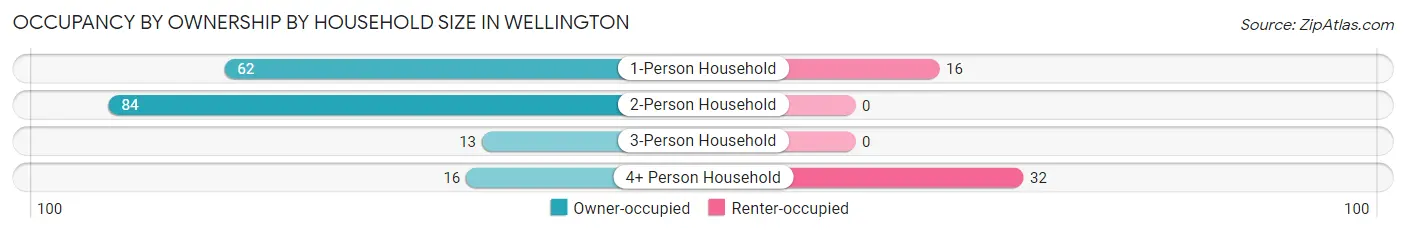
| Household Size | Owner-occupied | Renter-occupied |
| 1-Person Household | 62 (79.5%) | 16 (20.5%) |
| 2-Person Household | 84 (100.0%) | 0 (0.0%) |
| 3-Person Household | 13 (100.0%) | 0 (0.0%) |
| 4+ Person Household | 16 (33.3%) | 32 (66.7%) |
| Total Housing Units | 175 (78.5%) | 48 (21.5%) |
Occupancy by Educational Attainment in Wellington
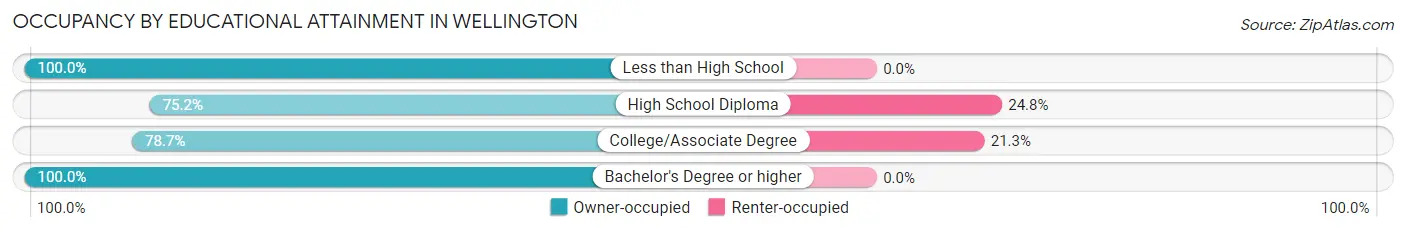
| Household Size | Owner-occupied | Renter-occupied |
| Less than High School | 7 (100.0%) | 0 (0.0%) |
| High School Diploma | 97 (75.2%) | 32 (24.8%) |
| College/Associate Degree | 59 (78.7%) | 16 (21.3%) |
| Bachelor's Degree or higher | 12 (100.0%) | 0 (0.0%) |
Occupancy by Age of Householder in Wellington
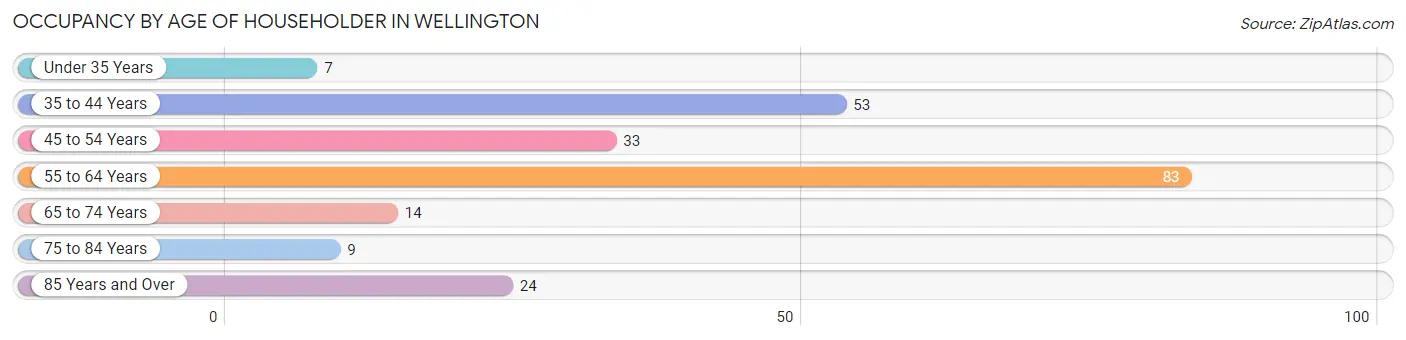
| Age Bracket | # Households | % Households |
| Under 35 Years | 7 | 3.1% |
| 35 to 44 Years | 53 | 23.8% |
| 45 to 54 Years | 33 | 14.8% |
| 55 to 64 Years | 83 | 37.2% |
| 65 to 74 Years | 14 | 6.3% |
| 75 to 84 Years | 9 | 4.0% |
| 85 Years and Over | 24 | 10.8% |
| Total | 223 | 100.0% |
Housing Finances in Wellington
Median Income by Occupancy in Wellington
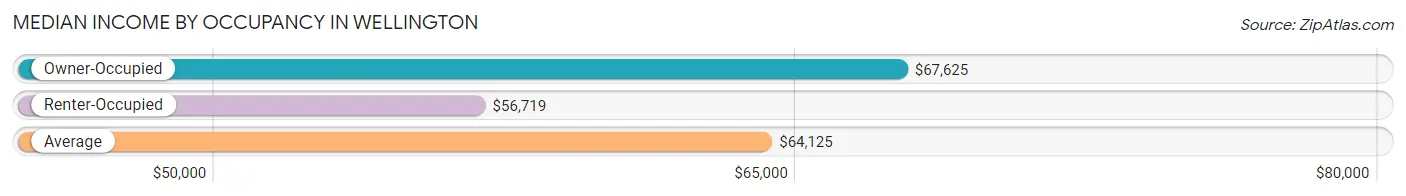
| Occupancy Type | # Households | Median Income |
| Owner-Occupied | 175 (78.5%) | $67,625 |
| Renter-Occupied | 48 (21.5%) | $56,719 |
| Average | 223 (100.0%) | $64,125 |
Occupancy by Householder Income Bracket in Wellington
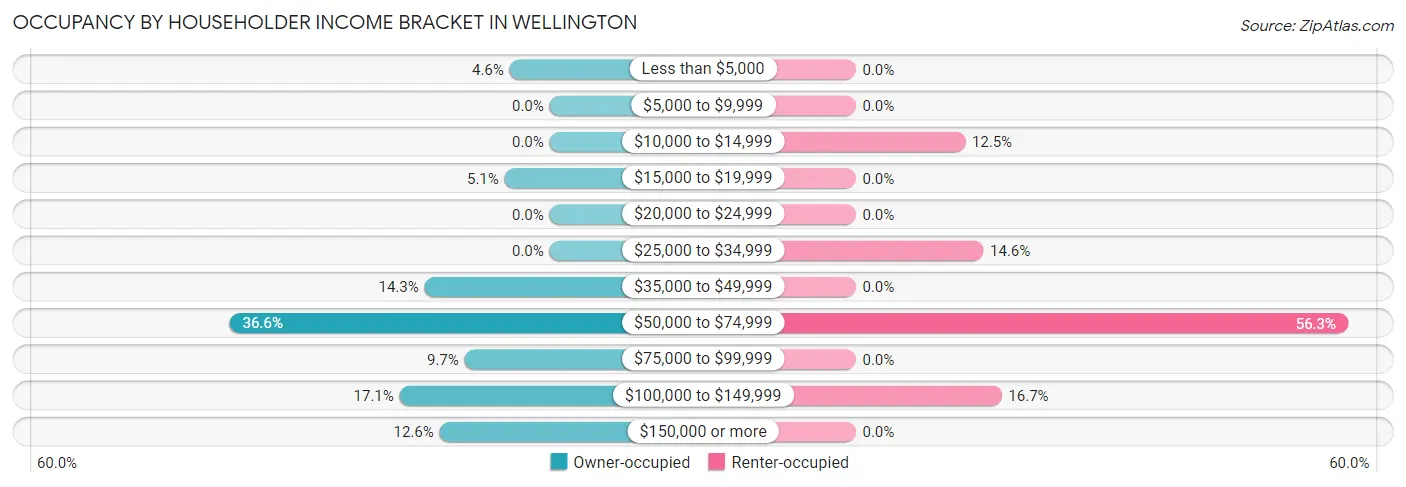
| Income Bracket | Owner-occupied | Renter-occupied |
| Less than $5,000 | 8 (4.6%) | 0 (0.0%) |
| $5,000 to $9,999 | 0 (0.0%) | 0 (0.0%) |
| $10,000 to $14,999 | 0 (0.0%) | 6 (12.5%) |
| $15,000 to $19,999 | 9 (5.1%) | 0 (0.0%) |
| $20,000 to $24,999 | 0 (0.0%) | 0 (0.0%) |
| $25,000 to $34,999 | 0 (0.0%) | 7 (14.6%) |
| $35,000 to $49,999 | 25 (14.3%) | 0 (0.0%) |
| $50,000 to $74,999 | 64 (36.6%) | 27 (56.2%) |
| $75,000 to $99,999 | 17 (9.7%) | 0 (0.0%) |
| $100,000 to $149,999 | 30 (17.1%) | 8 (16.7%) |
| $150,000 or more | 22 (12.6%) | 0 (0.0%) |
| Total | 175 (100.0%) | 48 (100.0%) |
Monthly Housing Cost Tiers in Wellington
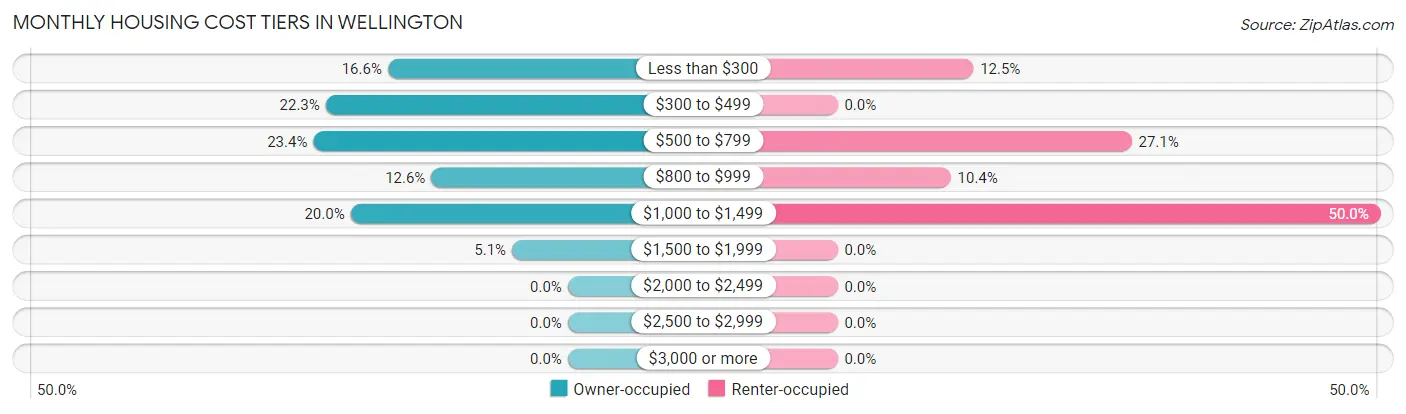
| Monthly Cost | Owner-occupied | Renter-occupied |
| Less than $300 | 29 (16.6%) | 6 (12.5%) |
| $300 to $499 | 39 (22.3%) | 0 (0.0%) |
| $500 to $799 | 41 (23.4%) | 13 (27.1%) |
| $800 to $999 | 22 (12.6%) | 5 (10.4%) |
| $1,000 to $1,499 | 35 (20.0%) | 24 (50.0%) |
| $1,500 to $1,999 | 9 (5.1%) | 0 (0.0%) |
| $2,000 to $2,499 | 0 (0.0%) | 0 (0.0%) |
| $2,500 to $2,999 | 0 (0.0%) | 0 (0.0%) |
| $3,000 or more | 0 (0.0%) | 0 (0.0%) |
| Total | 175 (100.0%) | 48 (100.0%) |
Physical Housing Characteristics in Wellington
Housing Structures in Wellington
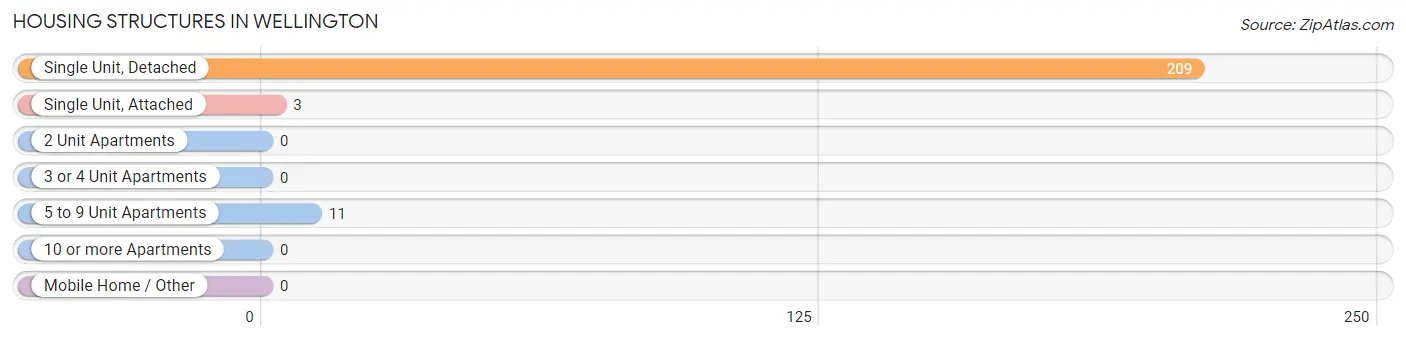
| Structure Type | # Housing Units | % Housing Units |
| Single Unit, Detached | 209 | 93.7% |
| Single Unit, Attached | 3 | 1.3% |
| 2 Unit Apartments | 0 | 0.0% |
| 3 or 4 Unit Apartments | 0 | 0.0% |
| 5 to 9 Unit Apartments | 11 | 4.9% |
| 10 or more Apartments | 0 | 0.0% |
| Mobile Home / Other | 0 | 0.0% |
| Total | 223 | 100.0% |
Housing Structures by Occupancy in Wellington
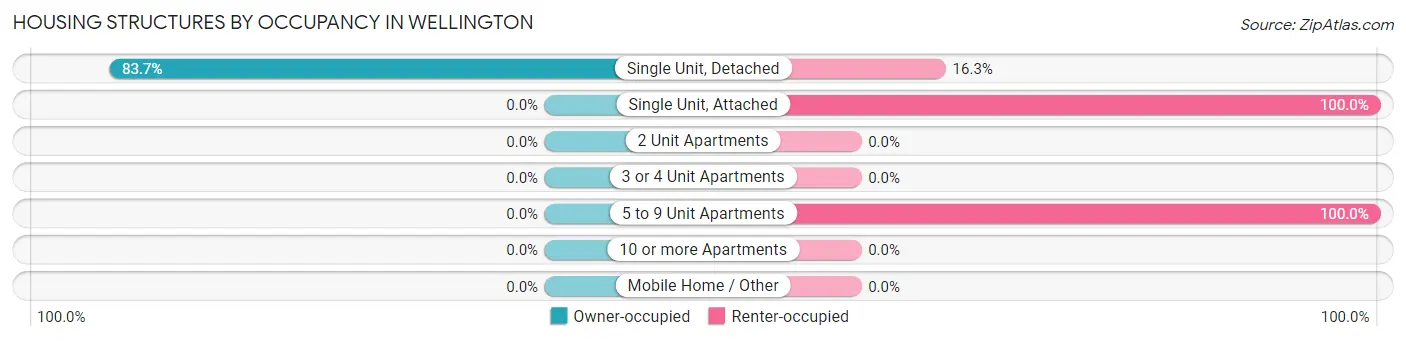
| Structure Type | Owner-occupied | Renter-occupied |
| Single Unit, Detached | 175 (83.7%) | 34 (16.3%) |
| Single Unit, Attached | 0 (0.0%) | 3 (100.0%) |
| 2 Unit Apartments | 0 (0.0%) | 0 (0.0%) |
| 3 or 4 Unit Apartments | 0 (0.0%) | 0 (0.0%) |
| 5 to 9 Unit Apartments | 0 (0.0%) | 11 (100.0%) |
| 10 or more Apartments | 0 (0.0%) | 0 (0.0%) |
| Mobile Home / Other | 0 (0.0%) | 0 (0.0%) |
| Total | 175 (78.5%) | 48 (21.5%) |
Housing Structures by Number of Rooms in Wellington
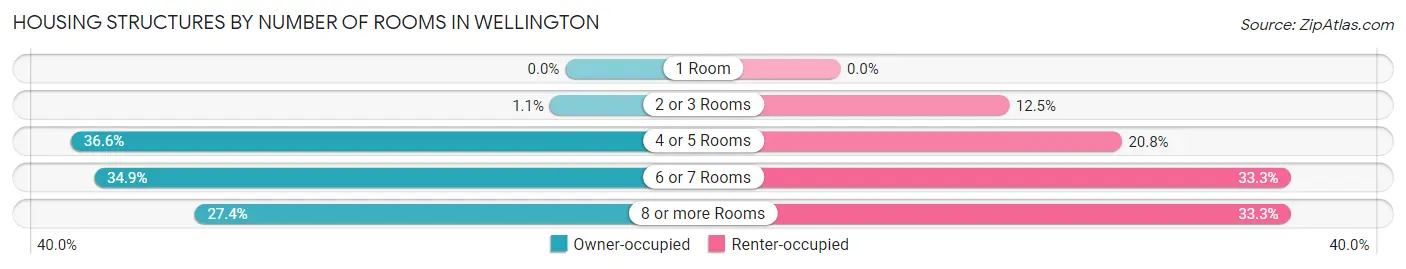
| Number of Rooms | Owner-occupied | Renter-occupied |
| 1 Room | 0 (0.0%) | 0 (0.0%) |
| 2 or 3 Rooms | 2 (1.1%) | 6 (12.5%) |
| 4 or 5 Rooms | 64 (36.6%) | 10 (20.8%) |
| 6 or 7 Rooms | 61 (34.9%) | 16 (33.3%) |
| 8 or more Rooms | 48 (27.4%) | 16 (33.3%) |
| Total | 175 (100.0%) | 48 (100.0%) |
Housing Structure by Heating Type in Wellington
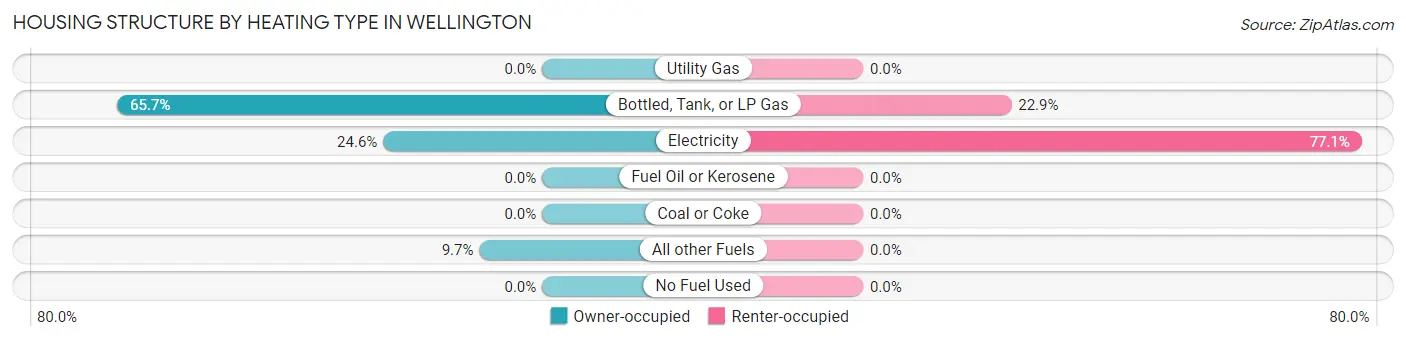
| Heating Type | Owner-occupied | Renter-occupied |
| Utility Gas | 0 (0.0%) | 0 (0.0%) |
| Bottled, Tank, or LP Gas | 115 (65.7%) | 11 (22.9%) |
| Electricity | 43 (24.6%) | 37 (77.1%) |
| Fuel Oil or Kerosene | 0 (0.0%) | 0 (0.0%) |
| Coal or Coke | 0 (0.0%) | 0 (0.0%) |
| All other Fuels | 17 (9.7%) | 0 (0.0%) |
| No Fuel Used | 0 (0.0%) | 0 (0.0%) |
| Total | 175 (100.0%) | 48 (100.0%) |
Household Vehicle Usage in Wellington
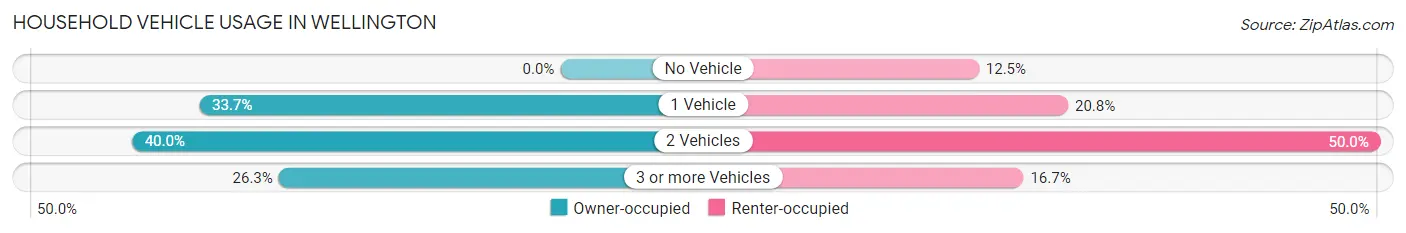
| Vehicles per Household | Owner-occupied | Renter-occupied |
| No Vehicle | 0 (0.0%) | 6 (12.5%) |
| 1 Vehicle | 59 (33.7%) | 10 (20.8%) |
| 2 Vehicles | 70 (40.0%) | 24 (50.0%) |
| 3 or more Vehicles | 46 (26.3%) | 8 (16.7%) |
| Total | 175 (100.0%) | 48 (100.0%) |
Real Estate & Mortgages in Wellington
Real Estate and Mortgage Overview in Wellington
| Characteristic | Without Mortgage | With Mortgage |
| Housing Units | 111 | 64 |
| Median Property Value | $134,400 | $113,200 |
| Median Household Income | $64,750 | $8 |
| Monthly Housing Costs | $458 | $0 |
| Real Estate Taxes | $1,152 | $7 |
Property Value by Mortgage Status in Wellington
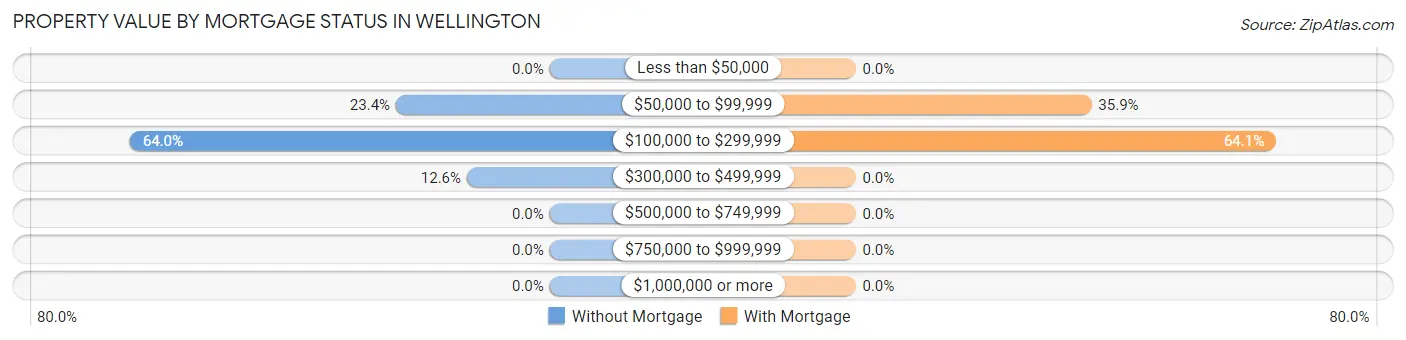
| Property Value | Without Mortgage | With Mortgage |
| Less than $50,000 | 0 (0.0%) | 0 (0.0%) |
| $50,000 to $99,999 | 26 (23.4%) | 23 (35.9%) |
| $100,000 to $299,999 | 71 (64.0%) | 41 (64.1%) |
| $300,000 to $499,999 | 14 (12.6%) | 0 (0.0%) |
| $500,000 to $749,999 | 0 (0.0%) | 0 (0.0%) |
| $750,000 to $999,999 | 0 (0.0%) | 0 (0.0%) |
| $1,000,000 or more | 0 (0.0%) | 0 (0.0%) |
| Total | 111 (100.0%) | 64 (100.0%) |
Household Income by Mortgage Status in Wellington
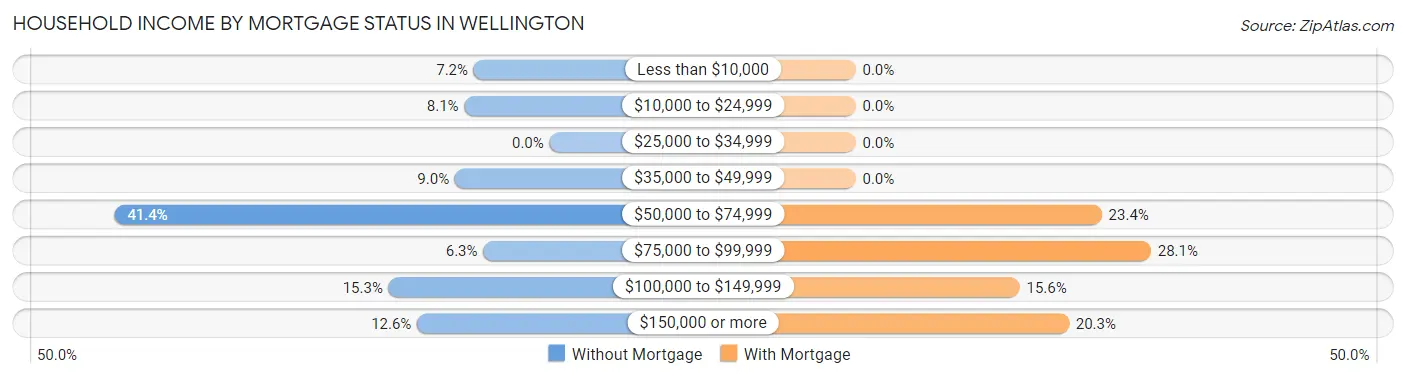
| Household Income | Without Mortgage | With Mortgage |
| Less than $10,000 | 8 (7.2%) | 0 (0.0%) |
| $10,000 to $24,999 | 9 (8.1%) | 0 (0.0%) |
| $25,000 to $34,999 | 0 (0.0%) | 0 (0.0%) |
| $35,000 to $49,999 | 10 (9.0%) | 0 (0.0%) |
| $50,000 to $74,999 | 46 (41.4%) | 15 (23.4%) |
| $75,000 to $99,999 | 7 (6.3%) | 18 (28.1%) |
| $100,000 to $149,999 | 17 (15.3%) | 10 (15.6%) |
| $150,000 or more | 14 (12.6%) | 13 (20.3%) |
| Total | 111 (100.0%) | 64 (100.0%) |
Property Value to Household Income Ratio in Wellington
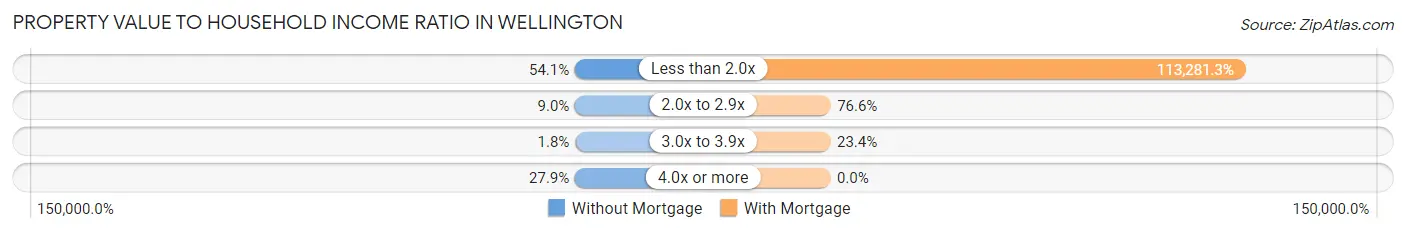
| Value-to-Income Ratio | Without Mortgage | With Mortgage |
| Less than 2.0x | 60 (54.0%) | 72,500 (113,281.2%) |
| 2.0x to 2.9x | 10 (9.0%) | 49 (76.6%) |
| 3.0x to 3.9x | 2 (1.8%) | 15 (23.4%) |
| 4.0x or more | 31 (27.9%) | 0 (0.0%) |
| Total | 111 (100.0%) | 64 (100.0%) |
Real Estate Taxes by Mortgage Status in Wellington
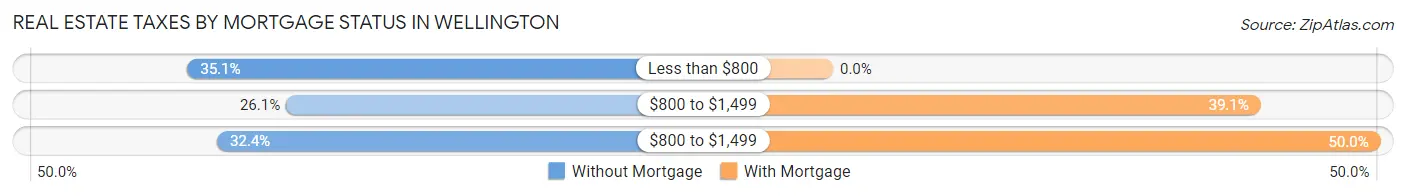
| Property Taxes | Without Mortgage | With Mortgage |
| Less than $800 | 39 (35.1%) | 0 (0.0%) |
| $800 to $1,499 | 29 (26.1%) | 25 (39.1%) |
| $800 to $1,499 | 36 (32.4%) | 32 (50.0%) |
| Total | 111 (100.0%) | 64 (100.0%) |
Health & Disability in Wellington
Health Insurance Coverage by Age in Wellington
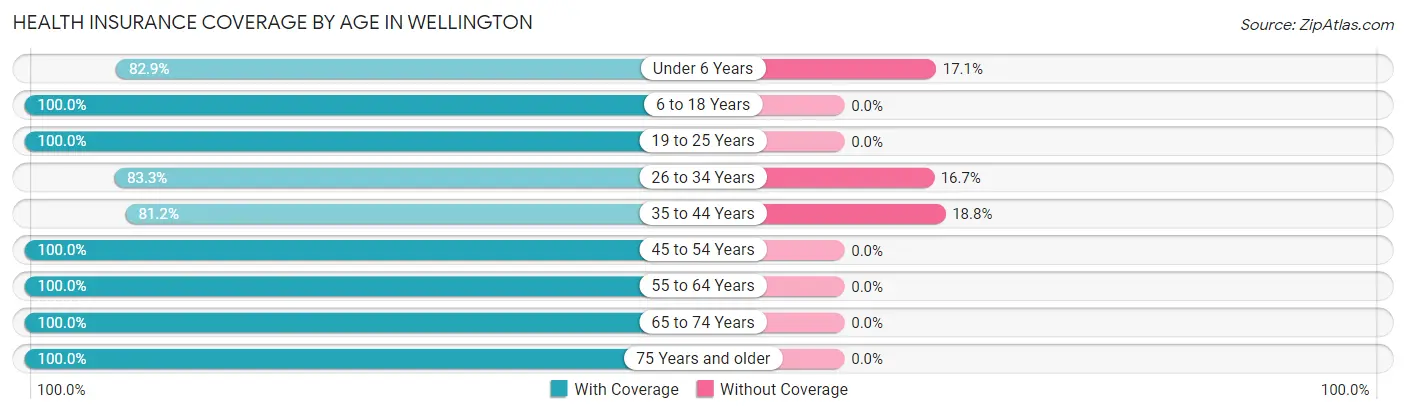
| Age Bracket | With Coverage | Without Coverage |
| Under 6 Years | 34 (82.9%) | 7 (17.1%) |
| 6 to 18 Years | 79 (100.0%) | 0 (0.0%) |
| 19 to 25 Years | 23 (100.0%) | 0 (0.0%) |
| 26 to 34 Years | 20 (83.3%) | 4 (16.7%) |
| 35 to 44 Years | 69 (81.2%) | 16 (18.8%) |
| 45 to 54 Years | 37 (100.0%) | 0 (0.0%) |
| 55 to 64 Years | 118 (100.0%) | 0 (0.0%) |
| 65 to 74 Years | 24 (100.0%) | 0 (0.0%) |
| 75 Years and older | 69 (100.0%) | 0 (0.0%) |
| Total | 473 (94.6%) | 27 (5.4%) |
Health Insurance Coverage by Citizenship Status in Wellington
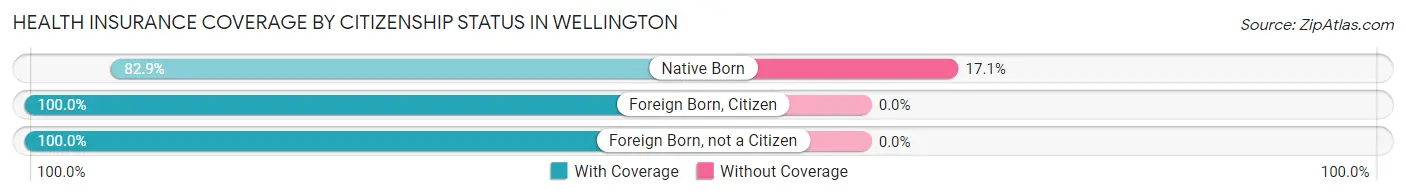
| Citizenship Status | With Coverage | Without Coverage |
| Native Born | 34 (82.9%) | 7 (17.1%) |
| Foreign Born, Citizen | 79 (100.0%) | 0 (0.0%) |
| Foreign Born, not a Citizen | 23 (100.0%) | 0 (0.0%) |
Health Insurance Coverage by Household Income in Wellington
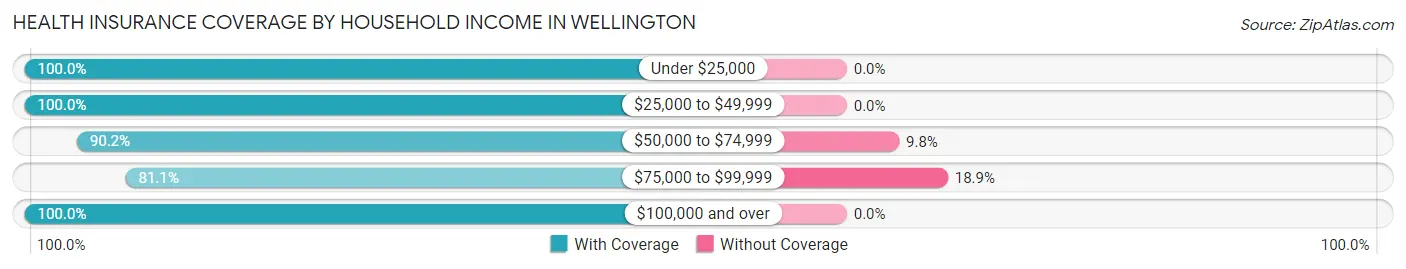
| Household Income | With Coverage | Without Coverage |
| Under $25,000 | 48 (100.0%) | 0 (0.0%) |
| $25,000 to $49,999 | 42 (100.0%) | 0 (0.0%) |
| $50,000 to $74,999 | 184 (90.2%) | 20 (9.8%) |
| $75,000 to $99,999 | 30 (81.1%) | 7 (18.9%) |
| $100,000 and over | 169 (100.0%) | 0 (0.0%) |
Public vs Private Health Insurance Coverage by Age in Wellington
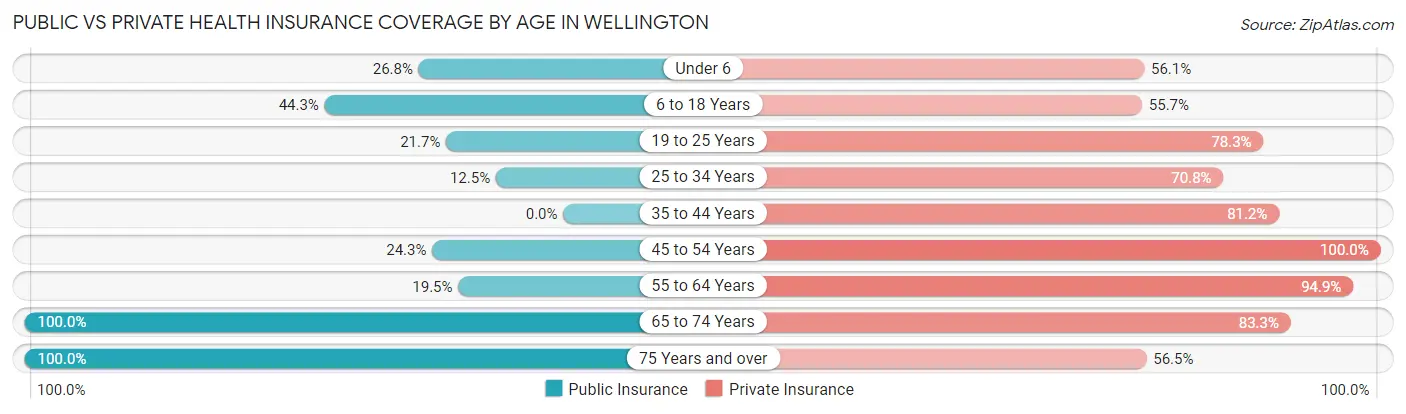
| Age Bracket | Public Insurance | Private Insurance |
| Under 6 | 11 (26.8%) | 23 (56.1%) |
| 6 to 18 Years | 35 (44.3%) | 44 (55.7%) |
| 19 to 25 Years | 5 (21.7%) | 18 (78.3%) |
| 25 to 34 Years | 3 (12.5%) | 17 (70.8%) |
| 35 to 44 Years | 0 (0.0%) | 69 (81.2%) |
| 45 to 54 Years | 9 (24.3%) | 37 (100.0%) |
| 55 to 64 Years | 23 (19.5%) | 112 (94.9%) |
| 65 to 74 Years | 24 (100.0%) | 20 (83.3%) |
| 75 Years and over | 69 (100.0%) | 39 (56.5%) |
| Total | 179 (35.8%) | 379 (75.8%) |
Disability Status by Sex by Age in Wellington
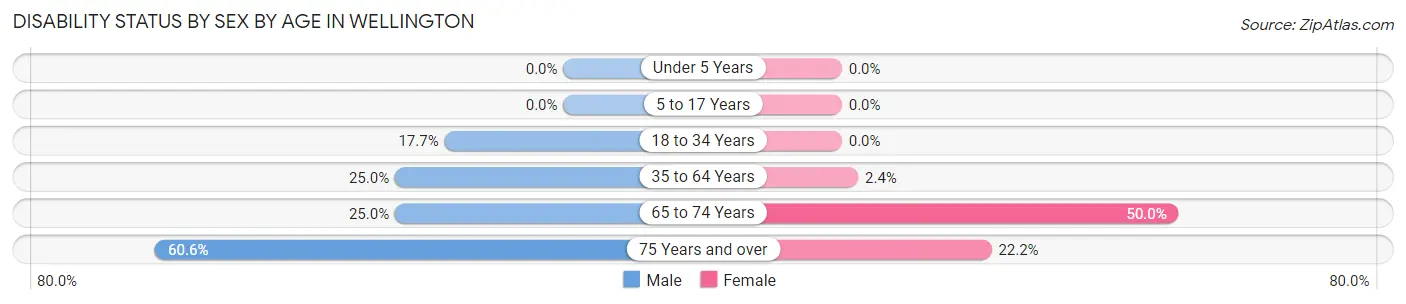
| Age Bracket | Male | Female |
| Under 5 Years | 0 (0.0%) | 0 (0.0%) |
| 5 to 17 Years | 0 (0.0%) | 0 (0.0%) |
| 18 to 34 Years | 3 (17.6%) | 0 (0.0%) |
| 35 to 64 Years | 29 (25.0%) | 3 (2.4%) |
| 65 to 74 Years | 2 (25.0%) | 8 (50.0%) |
| 75 Years and over | 20 (60.6%) | 8 (22.2%) |
Disability Class by Sex by Age in Wellington
Disability Class: Hearing Difficulty
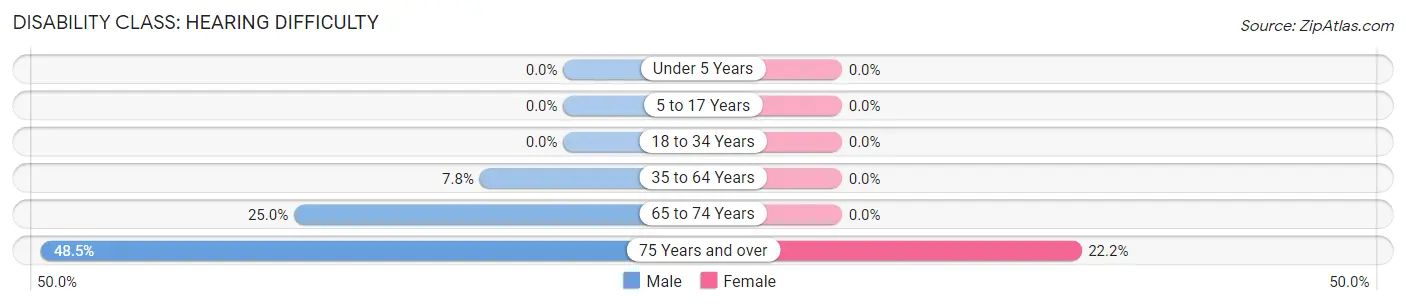
| Age Bracket | Male | Female |
| Under 5 Years | 0 (0.0%) | 0 (0.0%) |
| 5 to 17 Years | 0 (0.0%) | 0 (0.0%) |
| 18 to 34 Years | 0 (0.0%) | 0 (0.0%) |
| 35 to 64 Years | 9 (7.8%) | 0 (0.0%) |
| 65 to 74 Years | 2 (25.0%) | 0 (0.0%) |
| 75 Years and over | 16 (48.5%) | 8 (22.2%) |
Disability Class: Vision Difficulty
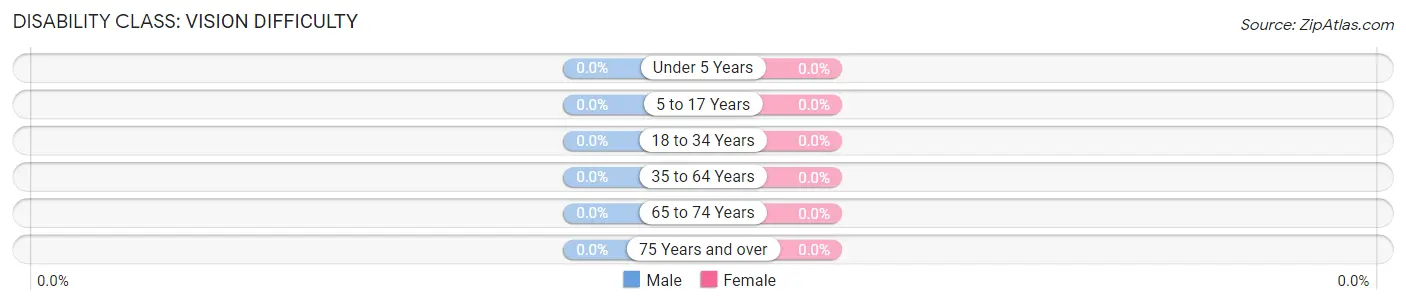
| Age Bracket | Male | Female |
| Under 5 Years | 0 (0.0%) | 0 (0.0%) |
| 5 to 17 Years | 0 (0.0%) | 0 (0.0%) |
| 18 to 34 Years | 0 (0.0%) | 0 (0.0%) |
| 35 to 64 Years | 0 (0.0%) | 0 (0.0%) |
| 65 to 74 Years | 0 (0.0%) | 0 (0.0%) |
| 75 Years and over | 0 (0.0%) | 0 (0.0%) |
Disability Class: Cognitive Difficulty
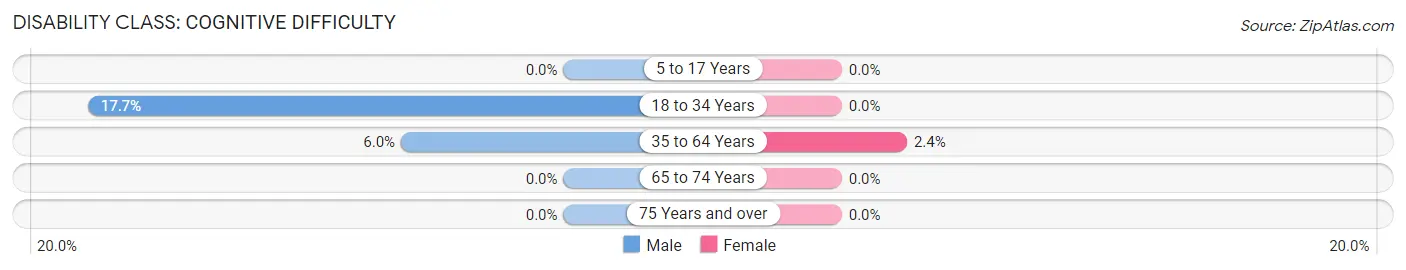
| Age Bracket | Male | Female |
| 5 to 17 Years | 0 (0.0%) | 0 (0.0%) |
| 18 to 34 Years | 3 (17.6%) | 0 (0.0%) |
| 35 to 64 Years | 7 (6.0%) | 3 (2.4%) |
| 65 to 74 Years | 0 (0.0%) | 0 (0.0%) |
| 75 Years and over | 0 (0.0%) | 0 (0.0%) |
Disability Class: Ambulatory Difficulty
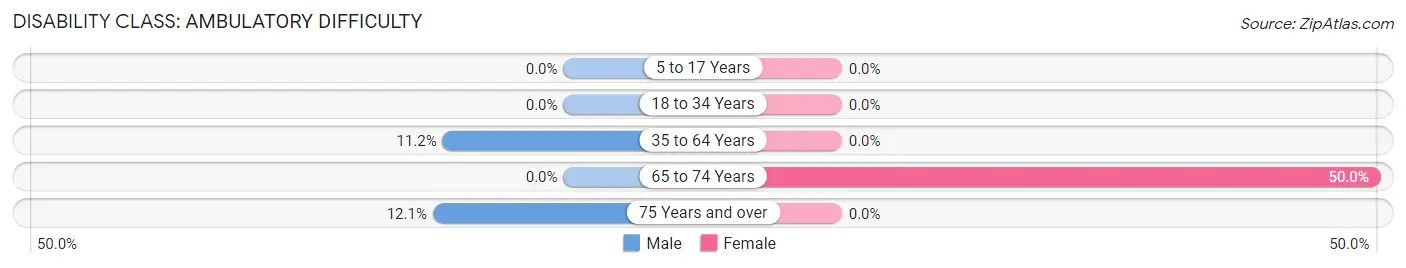
| Age Bracket | Male | Female |
| 5 to 17 Years | 0 (0.0%) | 0 (0.0%) |
| 18 to 34 Years | 0 (0.0%) | 0 (0.0%) |
| 35 to 64 Years | 13 (11.2%) | 0 (0.0%) |
| 65 to 74 Years | 0 (0.0%) | 8 (50.0%) |
| 75 Years and over | 4 (12.1%) | 0 (0.0%) |
Disability Class: Self-Care Difficulty
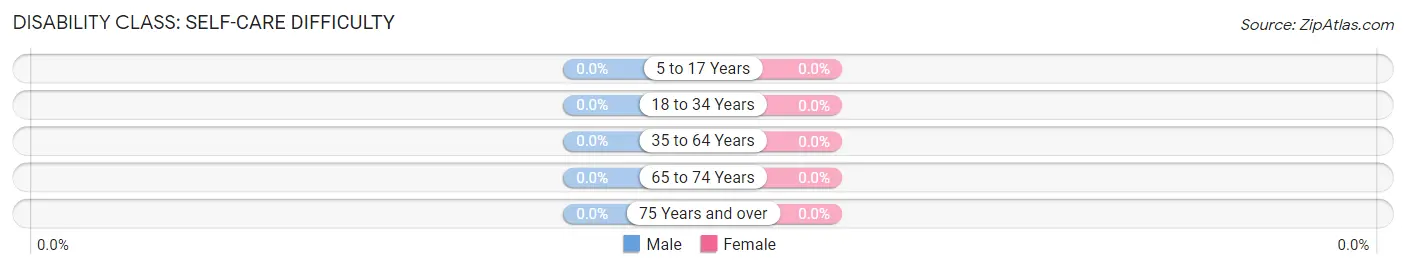
| Age Bracket | Male | Female |
| 5 to 17 Years | 0 (0.0%) | 0 (0.0%) |
| 18 to 34 Years | 0 (0.0%) | 0 (0.0%) |
| 35 to 64 Years | 0 (0.0%) | 0 (0.0%) |
| 65 to 74 Years | 0 (0.0%) | 0 (0.0%) |
| 75 Years and over | 0 (0.0%) | 0 (0.0%) |
Technology Access in Wellington
Computing Device Access in Wellington
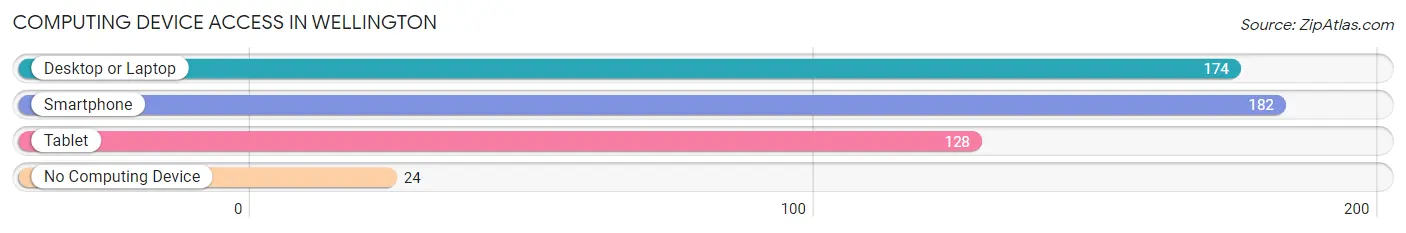
| Device Type | # Households | % Households |
| Desktop or Laptop | 174 | 78.0% |
| Smartphone | 182 | 81.6% |
| Tablet | 128 | 57.4% |
| No Computing Device | 24 | 10.8% |
| Total | 223 | 100.0% |
Internet Access in Wellington
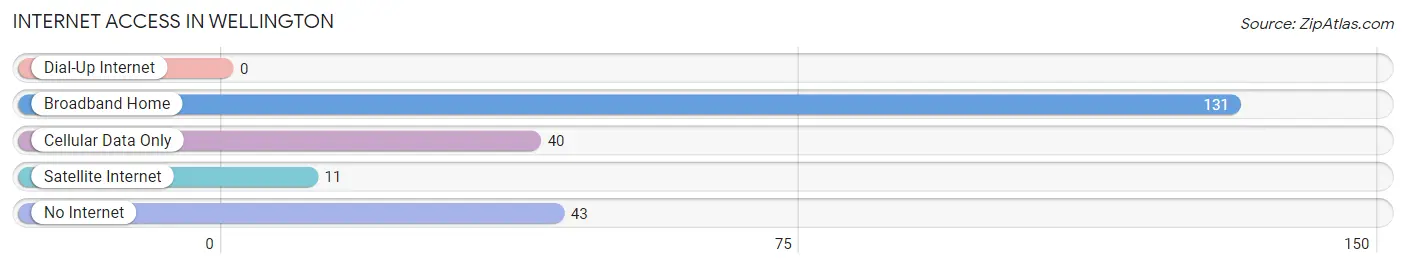
| Internet Type | # Households | % Households |
| Dial-Up Internet | 0 | 0.0% |
| Broadband Home | 131 | 58.7% |
| Cellular Data Only | 40 | 17.9% |
| Satellite Internet | 11 | 4.9% |
| No Internet | 43 | 19.3% |
| Total | 223 | 100.0% |
Wellington Summary
Wellington is a small city located in the northwest corner of Missouri, in Lafayette County. It is situated on the banks of the Missouri River, and is part of the Kansas City metropolitan area. The city has a population of approximately 1,400 people, and is known for its rural charm and small-town atmosphere.
History
The area that is now Wellington was first settled in the early 1800s by settlers from Kentucky and Tennessee. The town was originally known as “Wellington Station”, and was named after the Duke of Wellington, who had recently defeated Napoleon at the Battle of Waterloo. The town was officially incorporated in 1871, and the first post office was established in 1872.
In the late 1800s, Wellington was a thriving agricultural community, with a variety of crops being grown in the area. The town was also home to several businesses, including a flour mill, a sawmill, and a blacksmith shop.
In the early 1900s, the town began to experience a decline in population, as many of the residents moved away to larger cities in search of better job opportunities. However, the town was able to remain afloat due to its strong agricultural base.
Geography
Wellington is located in the northwest corner of Missouri, in Lafayette County. It is situated on the banks of the Missouri River, and is part of the Kansas City metropolitan area. The city has a total area of 1.2 square miles, all of which is land.
The city is located in a hilly region, with the highest point being the summit of Wellington Hill, which is located just south of the city. The city is also located near several lakes, including Lake of the Ozarks, Truman Lake, and Table Rock Lake.
Economy
The economy of Wellington is largely based on agriculture. The city is home to several farms, which produce a variety of crops, including corn, soybeans, wheat, and hay. The city is also home to several businesses, including a lumber yard, a feed store, and a hardware store.
In addition to agriculture, the city is also home to several manufacturing companies, including a plastics factory and a metal fabrication plant. The city is also home to several retail stores, including a grocery store, a pharmacy, and a hardware store.
Demographics
As of the 2010 census, the population of Wellington was 1,400 people. The racial makeup of the city was 97.3% White, 0.6% African American, 0.3% Native American, 0.3% Asian, 0.1% Pacific Islander, 0.3% from other races, and 1.3% from two or more races. Hispanic or Latino of any race were 1.3% of the population.
The median household income in Wellington was $37,500, and the median family income was $45,000. The per capita income for the city was $18,000. About 11.3% of families and 14.3% of the population were below the poverty line, including 18.2% of those under age 18 and 8.3% of those age 65 or over.
Common Questions
What is Per Capita Income in Wellington?
Per Capita income in Wellington is $33,243.
What is the Median Family Income in Wellington?
Median Family Income in Wellington is $63,750.
What is the Median Household income in Wellington?
Median Household Income in Wellington is $64,125.
What is Inequality or Gini Index in Wellington?
Inequality or Gini Index in Wellington is 0.33.
What is the Total Population of Wellington?
Total Population of Wellington is 501.
What is the Total Male Population of Wellington?
Total Male Population of Wellington is 236.
What is the Total Female Population of Wellington?
Total Female Population of Wellington is 265.
What is the Ratio of Males per 100 Females in Wellington?
There are 89.06 Males per 100 Females in Wellington.
What is the Ratio of Females per 100 Males in Wellington?
There are 112.29 Females per 100 Males in Wellington.
What is the Median Population Age in Wellington?
Median Population Age in Wellington is 44.6 Years.
What is the Average Family Size in Wellington
Average Family Size in Wellington is 2.8 People.
What is the Average Household Size in Wellington
Average Household Size in Wellington is 2.2 People.
How Large is the Labor Force in Wellington?
There are 219 People in the Labor Forcein in Wellington.
What is the Percentage of People in the Labor Force in Wellington?
55.7% of People are in the Labor Force in Wellington.
What is the Unemployment Rate in Wellington?
Unemployment Rate in Wellington is 10.5%.