Walker, MO Map & Demographics
Walker Map
Walker Overview
$14,479
PER CAPITA INCOME
$24,934
AVG FAMILY INCOME
$26,250
AVG HOUSEHOLD INCOME
35.8%
WAGE / INCOME GAP [ % ]
64.2¢/ $1
WAGE / INCOME GAP [ $ ]
0.33
INEQUALITY / GINI INDEX
343
TOTAL POPULATION
213
MALE POPULATION
130
FEMALE POPULATION
163.85
MALES / 100 FEMALES
61.03
FEMALES / 100 MALES
49.4
MEDIAN AGE
3.6
AVG FAMILY SIZE
2.9
AVG HOUSEHOLD SIZE
115
LABOR FORCE [ PEOPLE ]
38.2%
PERCENT IN LABOR FORCE
4.3%
UNEMPLOYMENT RATE
Walker Zip Codes
Walker Area Codes
Income in Walker
Income Overview in Walker
Per Capita Income in Walker is $14,479, while median incomes of families and households are $24,934 and $26,250 respectively.
| Characteristic | Number | Measure |
| Per Capita Income | 343 | $14,479 |
| Median Family Income | 82 | $24,934 |
| Mean Family Income | 82 | $41,001 |
| Median Household Income | 118 | $26,250 |
| Mean Household Income | 118 | $37,853 |
| Income Deficit | 82 | $0 |
| Wage / Income Gap (%) | 343 | 35.82% |
| Wage / Income Gap ($) | 343 | 64.18¢ per $1 |
| Gini / Inequality Index | 343 | 0.33 |
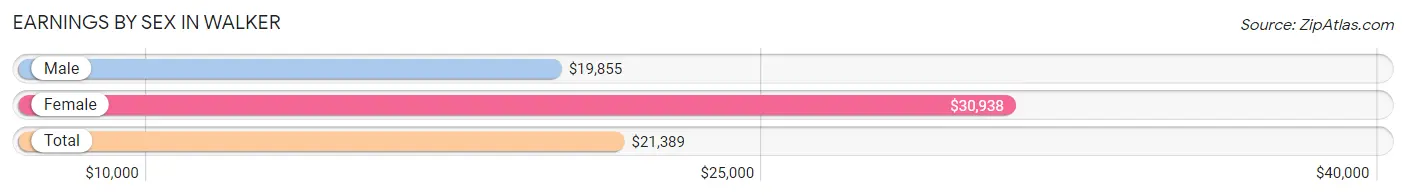
Earnings by Sex in Walker
Average Earnings in Walker are $21,389, $19,855 for men and $30,938 for women, a difference of 35.8%.
| Sex | Number | Average Earnings |
| Male | 87 (75.0%) | $19,855 |
| Female | 29 (25.0%) | $30,938 |
| Total | 116 (100.0%) | $21,389 |
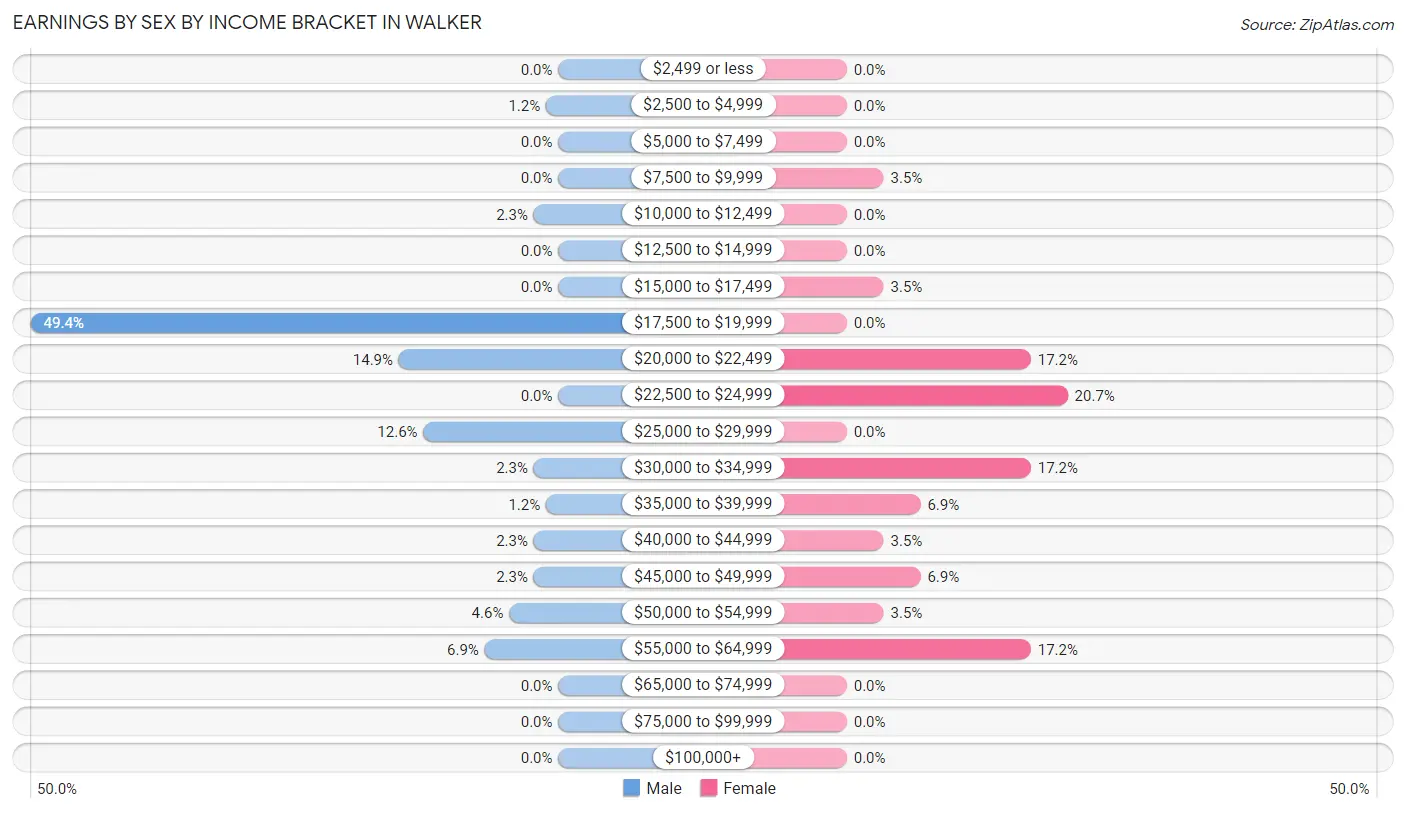
Earnings by Sex by Income Bracket in Walker
The most common earnings brackets in Walker are $17,500 to $19,999 for men (43 | 49.4%) and $22,500 to $24,999 for women (6 | 20.7%).
| Income | Male | Female |
| $2,499 or less | 0 (0.0%) | 0 (0.0%) |
| $2,500 to $4,999 | 1 (1.1%) | 0 (0.0%) |
| $5,000 to $7,499 | 0 (0.0%) | 0 (0.0%) |
| $7,500 to $9,999 | 0 (0.0%) | 1 (3.5%) |
| $10,000 to $12,499 | 2 (2.3%) | 0 (0.0%) |
| $12,500 to $14,999 | 0 (0.0%) | 0 (0.0%) |
| $15,000 to $17,499 | 0 (0.0%) | 1 (3.5%) |
| $17,500 to $19,999 | 43 (49.4%) | 0 (0.0%) |
| $20,000 to $22,499 | 13 (14.9%) | 5 (17.2%) |
| $22,500 to $24,999 | 0 (0.0%) | 6 (20.7%) |
| $25,000 to $29,999 | 11 (12.6%) | 0 (0.0%) |
| $30,000 to $34,999 | 2 (2.3%) | 5 (17.2%) |
| $35,000 to $39,999 | 1 (1.1%) | 2 (6.9%) |
| $40,000 to $44,999 | 2 (2.3%) | 1 (3.5%) |
| $45,000 to $49,999 | 2 (2.3%) | 2 (6.9%) |
| $50,000 to $54,999 | 4 (4.6%) | 1 (3.5%) |
| $55,000 to $64,999 | 6 (6.9%) | 5 (17.2%) |
| $65,000 to $74,999 | 0 (0.0%) | 0 (0.0%) |
| $75,000 to $99,999 | 0 (0.0%) | 0 (0.0%) |
| $100,000+ | 0 (0.0%) | 0 (0.0%) |
| Total | 87 (100.0%) | 29 (100.0%) |
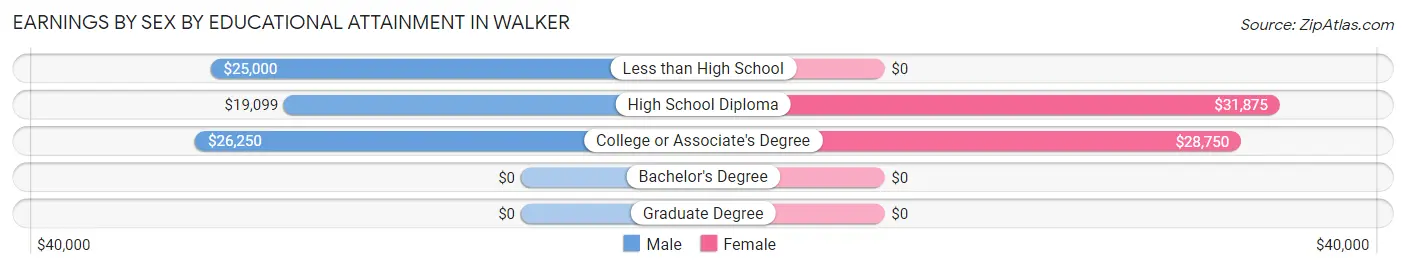
Earnings by Sex by Educational Attainment in Walker
Average earnings in Walker are $19,826 for men and $30,938 for women, a difference of 35.9%. Men with an educational attainment of college or associate's degree enjoy the highest average annual earnings of $26,250, while those with high school diploma education earn the least with $19,099. Women with an educational attainment of high school diploma earn the most with the average annual earnings of $31,875, while those with college or associate's degree education have the smallest earnings of $28,750.
| Educational Attainment | Male Income | Female Income |
| Less than High School | $25,000 | $0 |
| High School Diploma | $19,099 | $31,875 |
| College or Associate's Degree | $26,250 | $28,750 |
| Bachelor's Degree | - | - |
| Graduate Degree | - | - |
| Total | $19,826 | $30,938 |
Family Income in Walker
Family Income Brackets in Walker
According to the Walker family income data, there are 38 families falling into the $15,000 to $24,999 income range, which is the most common income bracket and makes up 46.3% of all families.
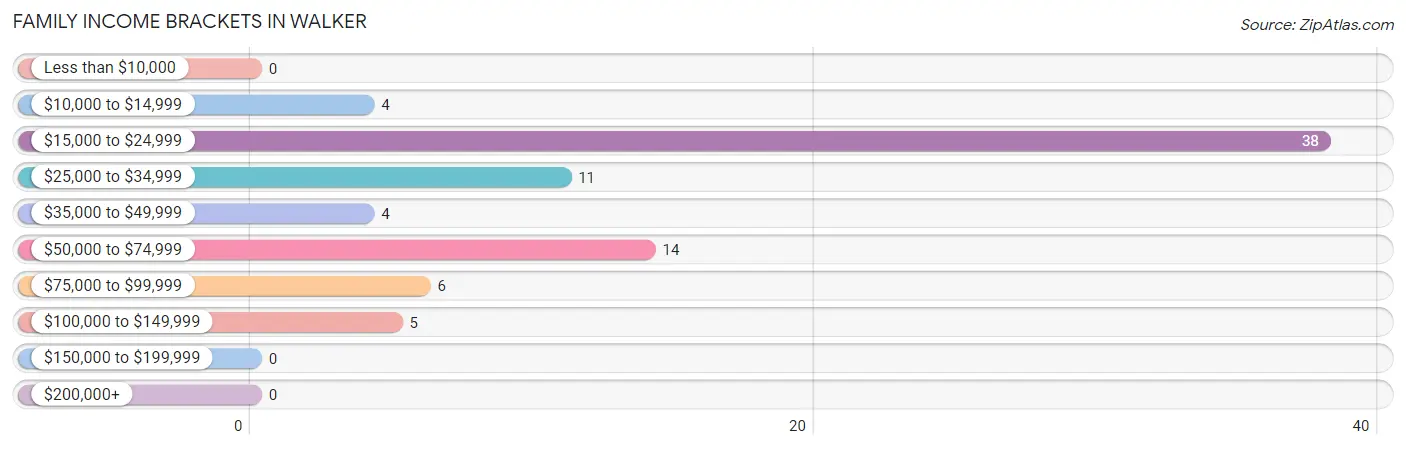
| Income Bracket | # Families | % Families |
| Less than $10,000 | 0 | 0.0% |
| $10,000 to $14,999 | 4 | 4.9% |
| $15,000 to $24,999 | 38 | 46.3% |
| $25,000 to $34,999 | 11 | 13.4% |
| $35,000 to $49,999 | 4 | 4.9% |
| $50,000 to $74,999 | 14 | 17.1% |
| $75,000 to $99,999 | 6 | 7.3% |
| $100,000 to $149,999 | 5 | 6.1% |
| $150,000 to $199,999 | 0 | 0.0% |
| $200,000+ | 0 | 0.0% |
Family Income by Famaliy Size in Walker
4-person families (3 | 3.7%) account for the highest median family income in Walker with $61,250 per family, while 2-person families (32 | 39.0%) have the highest median income of $26,607 per family member.
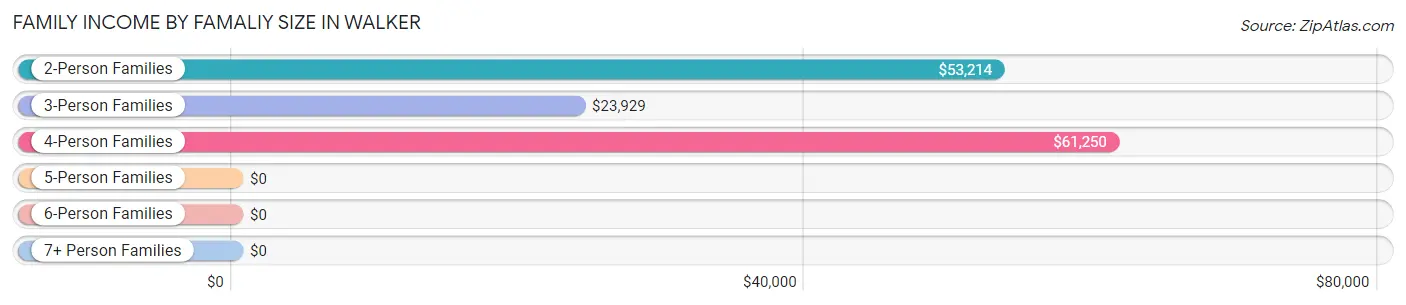
| Income Bracket | # Families | Median Income |
| 2-Person Families | 32 (39.0%) | $53,214 |
| 3-Person Families | 40 (48.8%) | $23,929 |
| 4-Person Families | 3 (3.7%) | $61,250 |
| 5-Person Families | 2 (2.4%) | $0 |
| 6-Person Families | 5 (6.1%) | $0 |
| 7+ Person Families | 0 (0.0%) | $0 |
| Total | 82 (100.0%) | $24,934 |
Family Income by Number of Earners in Walker
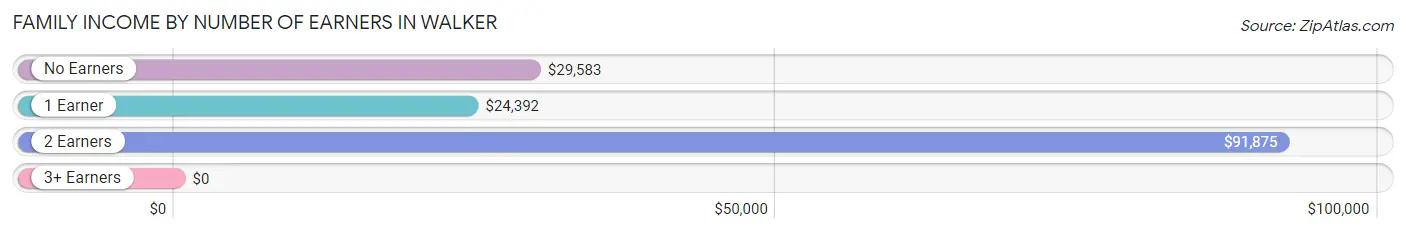
| Number of Earners | # Families | Median Income |
| No Earners | 11 (13.4%) | $29,583 |
| 1 Earner | 60 (73.2%) | $24,392 |
| 2 Earners | 11 (13.4%) | $91,875 |
| 3+ Earners | 0 (0.0%) | $0 |
| Total | 82 (100.0%) | $24,934 |
Household Income in Walker
Household Income Brackets in Walker
With 43 households falling in the category, the $15,000 to $24,999 income range is the most frequent in Walker, accounting for 36.4% of all households.
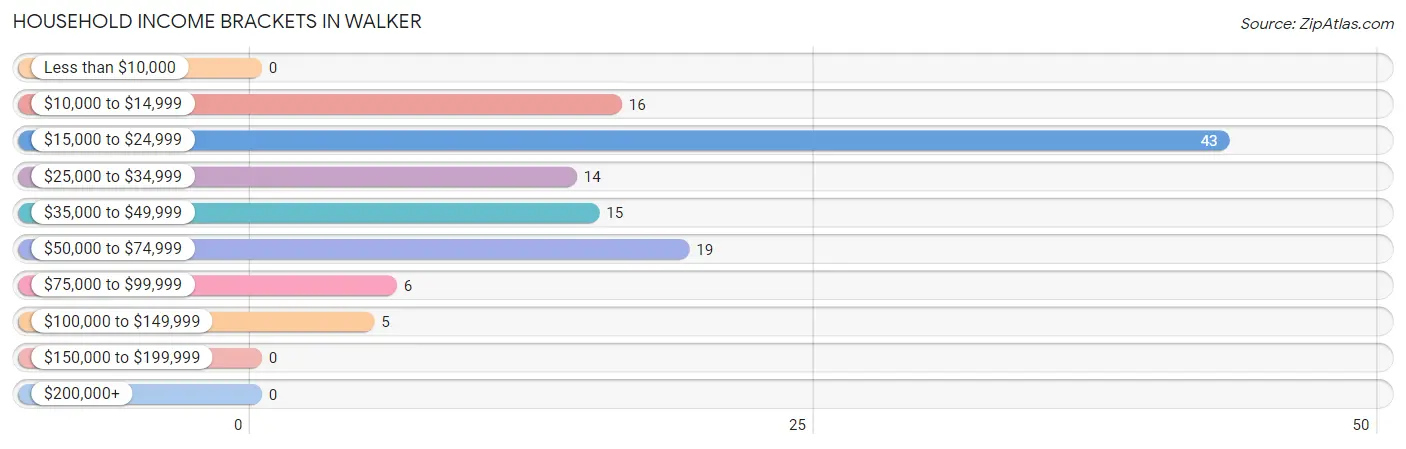
| Income Bracket | # Households | % Households |
| Less than $10,000 | 0 | 0.0% |
| $10,000 to $14,999 | 16 | 13.6% |
| $15,000 to $24,999 | 43 | 36.4% |
| $25,000 to $34,999 | 14 | 11.9% |
| $35,000 to $49,999 | 15 | 12.7% |
| $50,000 to $74,999 | 19 | 16.1% |
| $75,000 to $99,999 | 6 | 5.1% |
| $100,000 to $149,999 | 5 | 4.2% |
| $150,000 to $199,999 | 0 | 0.0% |
| $200,000+ | 0 | 0.0% |
Household Income by Householder Age in Walker
The median household income in Walker is $26,250, with the highest median household income of $31,000 found in the 25 to 44 years age bracket for the primary householder. A total of 14 households (11.9%) fall into this category.
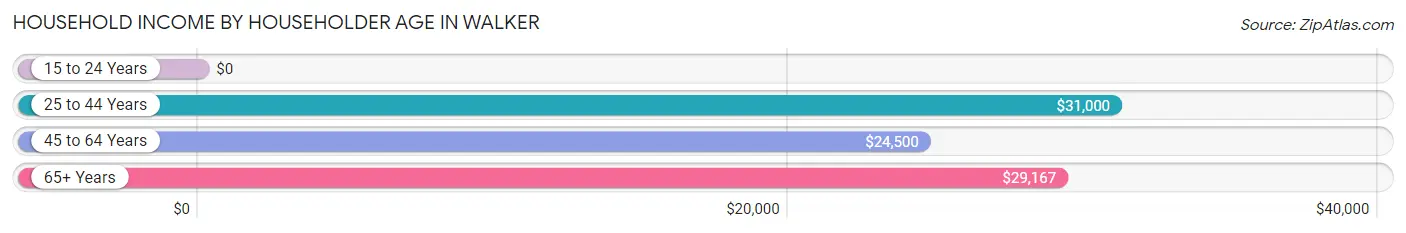
| Income Bracket | # Households | Median Income |
| 15 to 24 Years | 0 (0.0%) | $0 |
| 25 to 44 Years | 14 (11.9%) | $31,000 |
| 45 to 64 Years | 76 (64.4%) | $24,500 |
| 65+ Years | 28 (23.7%) | $29,167 |
| Total | 118 (100.0%) | $26,250 |
Poverty in Walker
Income Below Poverty by Sex and Age in Walker
With 19.5% poverty level for males and 32.3% for females among the residents of Walker, under 5 year old males and under 5 year old females are the most vulnerable to poverty, with 2 males (100.0%) and 1 females (100.0%) in their respective age groups living below the poverty level.
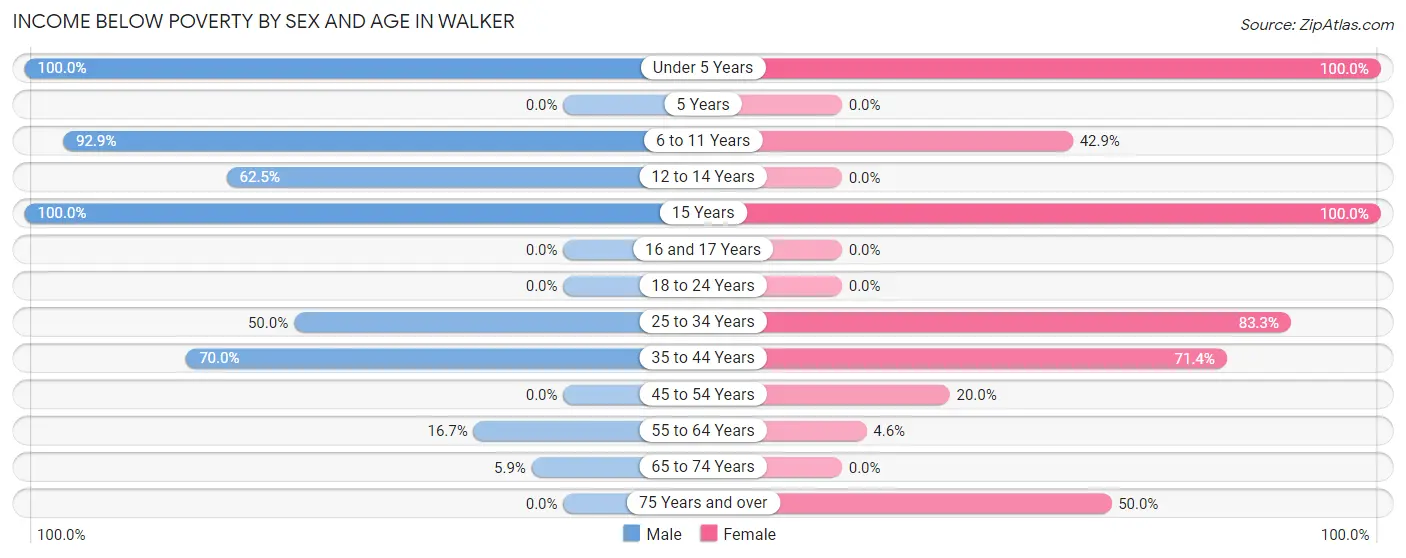
| Age Bracket | Male | Female |
| Under 5 Years | 2 (100.0%) | 1 (100.0%) |
| 5 Years | 0 (0.0%) | 0 (0.0%) |
| 6 to 11 Years | 13 (92.9%) | 3 (42.9%) |
| 12 to 14 Years | 5 (62.5%) | 0 (0.0%) |
| 15 Years | 1 (100.0%) | 6 (100.0%) |
| 16 and 17 Years | 0 (0.0%) | 0 (0.0%) |
| 18 to 24 Years | 0 (0.0%) | 0 (0.0%) |
| 25 to 34 Years | 2 (50.0%) | 10 (83.3%) |
| 35 to 44 Years | 14 (70.0%) | 5 (71.4%) |
| 45 to 54 Years | 0 (0.0%) | 10 (20.0%) |
| 55 to 64 Years | 3 (16.7%) | 1 (4.5%) |
| 65 to 74 Years | 1 (5.9%) | 0 (0.0%) |
| 75 Years and over | 0 (0.0%) | 6 (50.0%) |
| Total | 41 (19.5%) | 42 (32.3%) |
Income Above Poverty by Sex and Age in Walker
According to the poverty statistics in Walker, males aged 18 to 24 years and females aged 65 to 74 years are the age groups that are most secure financially, with 100.0% of males and 100.0% of females in these age groups living above the poverty line.
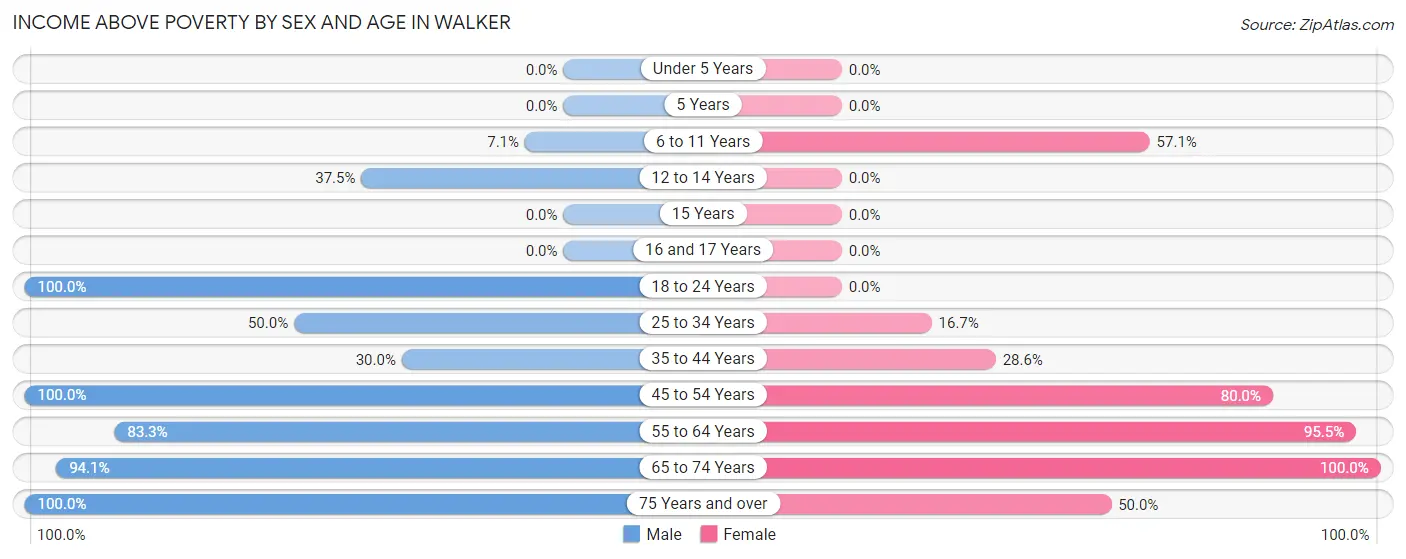
| Age Bracket | Male | Female |
| Under 5 Years | 0 (0.0%) | 0 (0.0%) |
| 5 Years | 0 (0.0%) | 0 (0.0%) |
| 6 to 11 Years | 1 (7.1%) | 4 (57.1%) |
| 12 to 14 Years | 3 (37.5%) | 0 (0.0%) |
| 15 Years | 0 (0.0%) | 0 (0.0%) |
| 16 and 17 Years | 0 (0.0%) | 0 (0.0%) |
| 18 to 24 Years | 62 (100.0%) | 0 (0.0%) |
| 25 to 34 Years | 2 (50.0%) | 2 (16.7%) |
| 35 to 44 Years | 6 (30.0%) | 2 (28.6%) |
| 45 to 54 Years | 57 (100.0%) | 40 (80.0%) |
| 55 to 64 Years | 15 (83.3%) | 21 (95.5%) |
| 65 to 74 Years | 16 (94.1%) | 13 (100.0%) |
| 75 Years and over | 7 (100.0%) | 6 (50.0%) |
| Total | 169 (80.5%) | 88 (67.7%) |
Income Below Poverty Among Married-Couple Families in Walker
The poverty statistics for married-couple families in Walker show that 9.2% or 7 of the total 76 families live below the poverty line. Families with 3 or 4 children have the highest poverty rate of 100.0%, comprising of 7 families. On the other hand, families with no children have the lowest poverty rate of 0.0%, which includes 0 families.
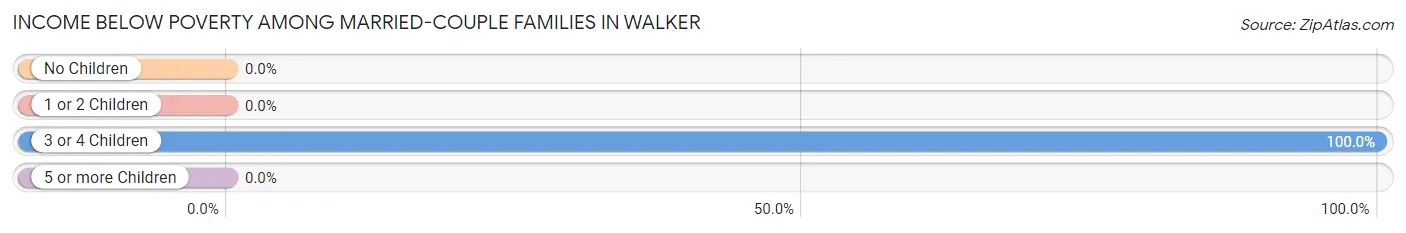
| Children | Above Poverty | Below Poverty |
| No Children | 66 (100.0%) | 0 (0.0%) |
| 1 or 2 Children | 3 (100.0%) | 0 (0.0%) |
| 3 or 4 Children | 0 (0.0%) | 7 (100.0%) |
| 5 or more Children | 0 (0.0%) | 0 (0.0%) |
| Total | 69 (90.8%) | 7 (9.2%) |
Income Below Poverty Among Single-Parent Households in Walker
According to the poverty data in Walker, 50.0% or 1 single-father households and 25.0% or 1 single-mother households are living below the poverty line. Among single-father households, those with 1 or 2 children have the highest poverty rate, with 1 households (100.0%) experiencing poverty. Likewise, among single-mother households, those with no children have the highest poverty rate, with 1 households (50.0%) falling below the poverty line.
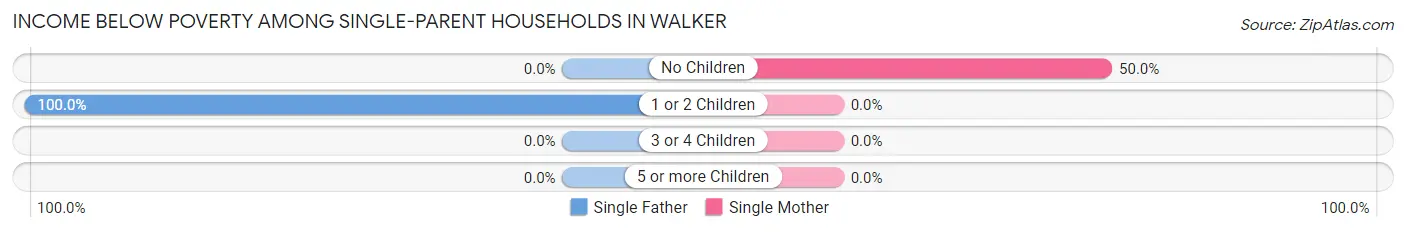
| Children | Single Father | Single Mother |
| No Children | 0 (0.0%) | 1 (50.0%) |
| 1 or 2 Children | 1 (100.0%) | 0 (0.0%) |
| 3 or 4 Children | 0 (0.0%) | 0 (0.0%) |
| 5 or more Children | 0 (0.0%) | 0 (0.0%) |
| Total | 1 (50.0%) | 1 (25.0%) |
Income Below Poverty Among Married-Couple vs Single-Parent Households in Walker
The poverty data for Walker shows that 7 of the married-couple family households (9.2%) and 2 of the single-parent households (33.3%) are living below the poverty level. Within the married-couple family households, those with 3 or 4 children have the highest poverty rate, with 7 households (100.0%) falling below the poverty line. Among the single-parent households, those with no children have the highest poverty rate, with 1 household (33.3%) living below poverty.
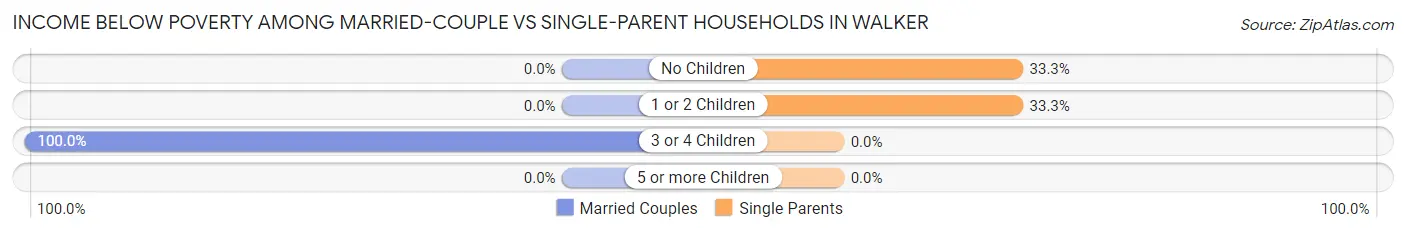
| Children | Married-Couple Families | Single-Parent Households |
| No Children | 0 (0.0%) | 1 (33.3%) |
| 1 or 2 Children | 0 (0.0%) | 1 (33.3%) |
| 3 or 4 Children | 7 (100.0%) | 0 (0.0%) |
| 5 or more Children | 0 (0.0%) | 0 (0.0%) |
| Total | 7 (9.2%) | 2 (33.3%) |
Race in Walker
The most populous races in Walker are White / Caucasian (321 | 93.6%), Two or more Races (22 | 6.4%), and Hispanic or Latino (20 | 5.8%).
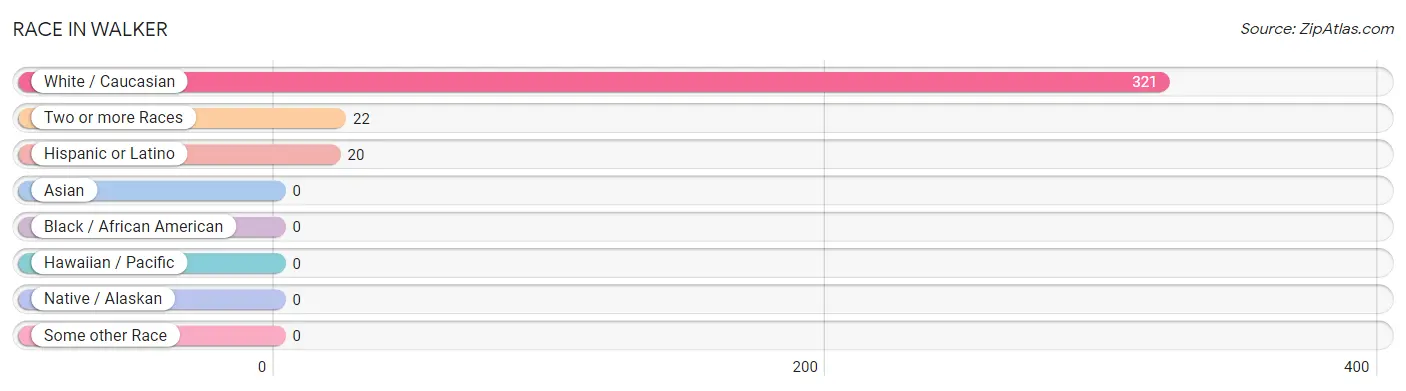
| Race | # Population | % Population |
| Asian | 0 | 0.0% |
| Black / African American | 0 | 0.0% |
| Hawaiian / Pacific | 0 | 0.0% |
| Hispanic or Latino | 20 | 5.8% |
| Native / Alaskan | 0 | 0.0% |
| White / Caucasian | 321 | 93.6% |
| Two or more Races | 22 | 6.4% |
| Some other Race | 0 | 0.0% |
| Total | 343 | 100.0% |
Ancestry in Walker
The most populous ancestries reported in Walker are Irish (186 | 54.2%), German (156 | 45.5%), English (37 | 10.8%), Korean (20 | 5.8%), and Mexican (20 | 5.8%), together accounting for 122.2% of all Walker residents.
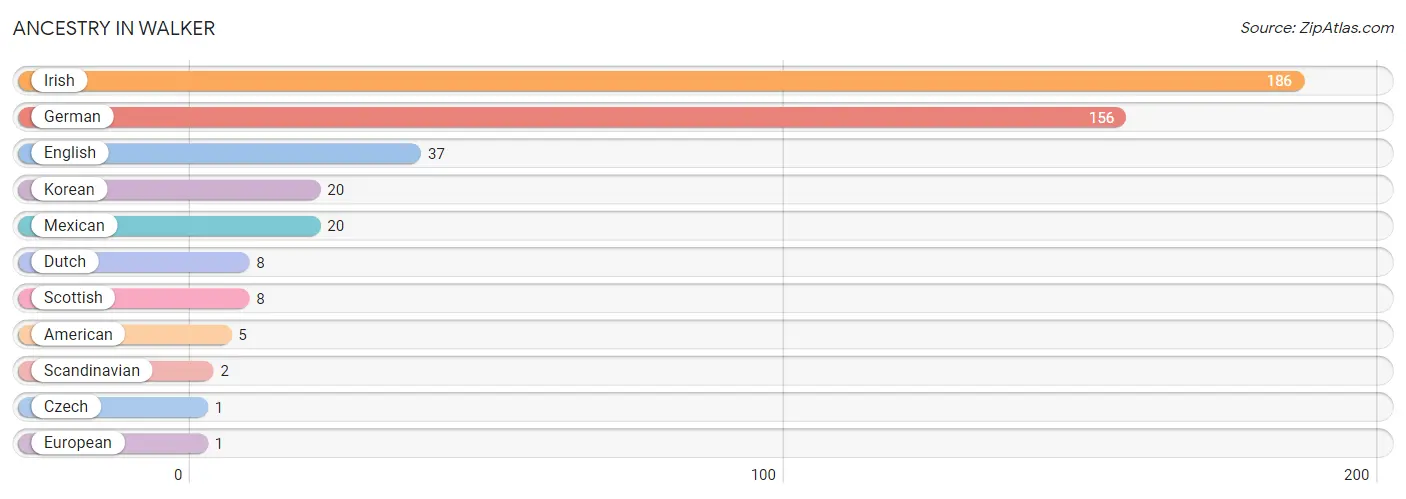
| Ancestry | # Population | % Population |
| American | 5 | 1.5% |
| Czech | 1 | 0.3% |
| Dutch | 8 | 2.3% |
| English | 37 | 10.8% |
| European | 1 | 0.3% |
| German | 156 | 45.5% |
| Irish | 186 | 54.2% |
| Korean | 20 | 5.8% |
| Mexican | 20 | 5.8% |
| Scandinavian | 2 | 0.6% |
| Scottish | 8 | 2.3% | View All 11 Rows |
Immigrants in Walker

| Immigration Origin | # Population | % Population | View All 0 Rows |
Sex and Age in Walker
Sex and Age in Walker
The most populous age groups in Walker are 20 to 24 Years (62 | 29.1%) for men and 50 to 54 Years (43 | 33.1%) for women.
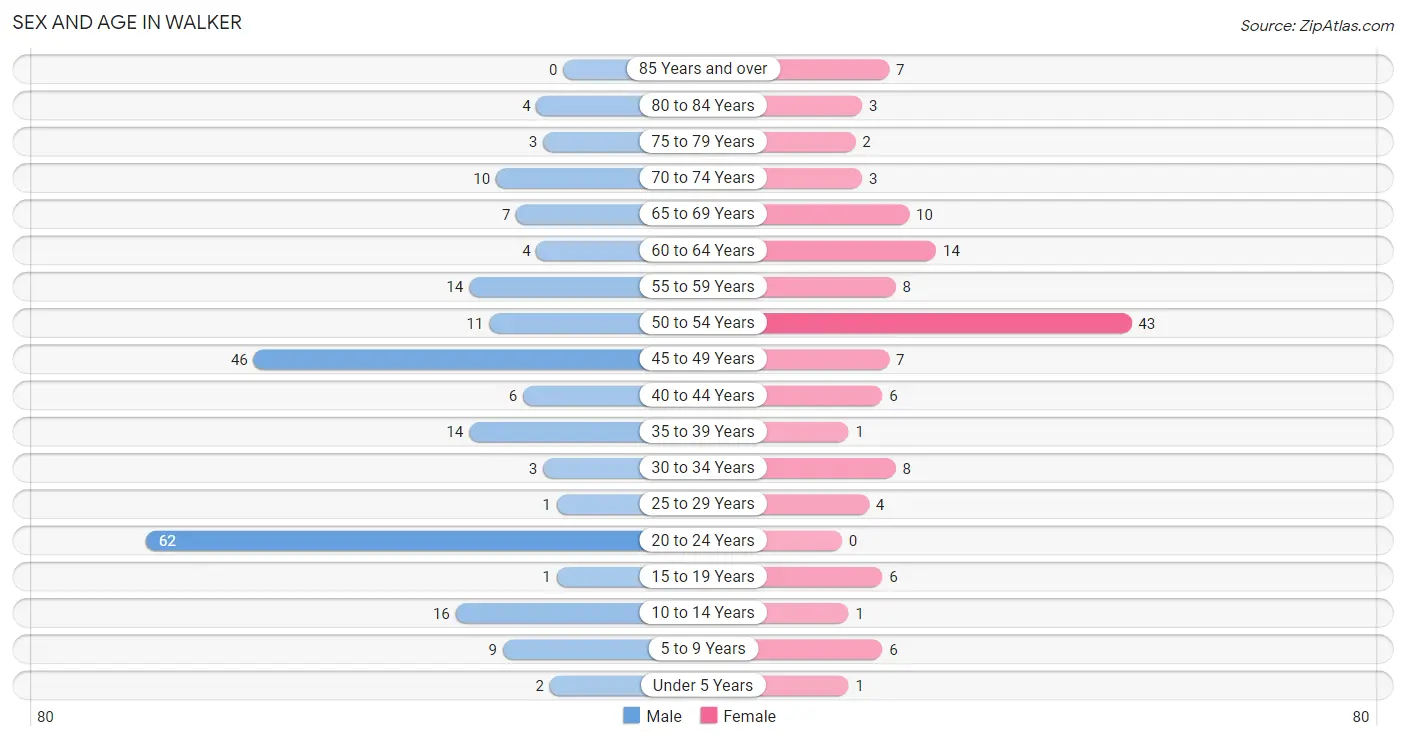
| Age Bracket | Male | Female |
| Under 5 Years | 2 (0.9%) | 1 (0.8%) |
| 5 to 9 Years | 9 (4.2%) | 6 (4.6%) |
| 10 to 14 Years | 16 (7.5%) | 1 (0.8%) |
| 15 to 19 Years | 1 (0.5%) | 6 (4.6%) |
| 20 to 24 Years | 62 (29.1%) | 0 (0.0%) |
| 25 to 29 Years | 1 (0.5%) | 4 (3.1%) |
| 30 to 34 Years | 3 (1.4%) | 8 (6.1%) |
| 35 to 39 Years | 14 (6.6%) | 1 (0.8%) |
| 40 to 44 Years | 6 (2.8%) | 6 (4.6%) |
| 45 to 49 Years | 46 (21.6%) | 7 (5.4%) |
| 50 to 54 Years | 11 (5.2%) | 43 (33.1%) |
| 55 to 59 Years | 14 (6.6%) | 8 (6.1%) |
| 60 to 64 Years | 4 (1.9%) | 14 (10.8%) |
| 65 to 69 Years | 7 (3.3%) | 10 (7.7%) |
| 70 to 74 Years | 10 (4.7%) | 3 (2.3%) |
| 75 to 79 Years | 3 (1.4%) | 2 (1.5%) |
| 80 to 84 Years | 4 (1.9%) | 3 (2.3%) |
| 85 Years and over | 0 (0.0%) | 7 (5.4%) |
| Total | 213 (100.0%) | 130 (100.0%) |
Families and Households in Walker
Median Family Size in Walker
The median family size in Walker is 3.56 persons per family, with single male/father families (2 | 2.4%) accounting for the largest median family size of 5 persons per family. On the other hand, single female/mother families (4 | 4.9%) represent the smallest median family size with 2.75 persons per family.
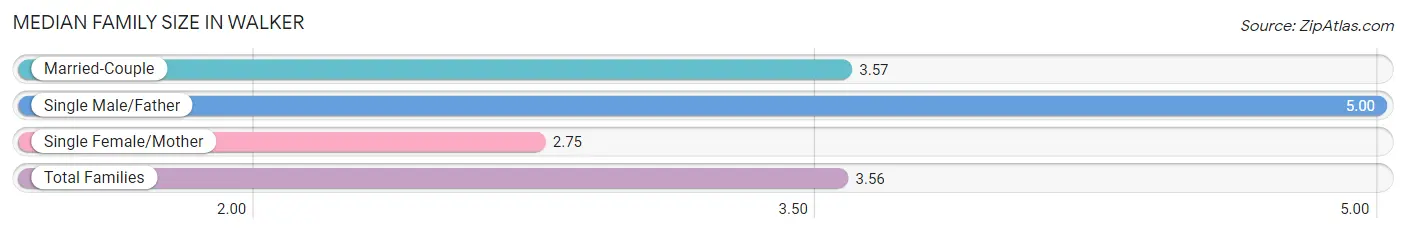
| Family Type | # Families | Family Size |
| Married-Couple | 76 (92.7%) | 3.57 |
| Single Male/Father | 2 (2.4%) | 5.00 |
| Single Female/Mother | 4 (4.9%) | 2.75 |
| Total Families | 82 (100.0%) | 3.56 |
Median Household Size in Walker
The median household size in Walker is 2.91 persons per household, with single female/mother households (4 | 3.4%) accounting for the largest median household size of 5.25 persons per household. non-family households (36 | 30.5%) represent the smallest median household size with 1.14 persons per household.
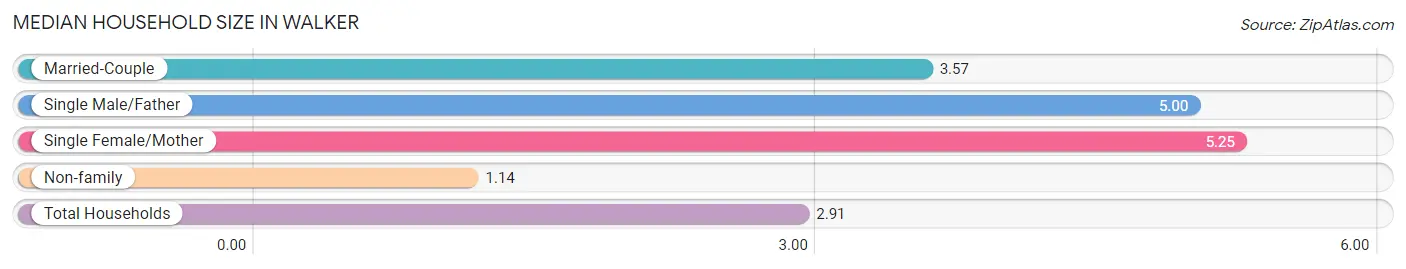
| Household Type | # Households | Household Size |
| Married-Couple | 76 (64.4%) | 3.57 |
| Single Male/Father | 2 (1.7%) | 5.00 |
| Single Female/Mother | 4 (3.4%) | 5.25 |
| Non-family | 36 (30.5%) | 1.14 |
| Total Households | 118 (100.0%) | 2.91 |
Household Size by Marriage Status in Walker
Out of a total of 118 households in Walker, 82 (69.5%) are family households, while 36 (30.5%) are nonfamily households. The most numerous type of family households are 3-person households, comprising 41, and the most common type of nonfamily households are 1-person households, comprising 30.
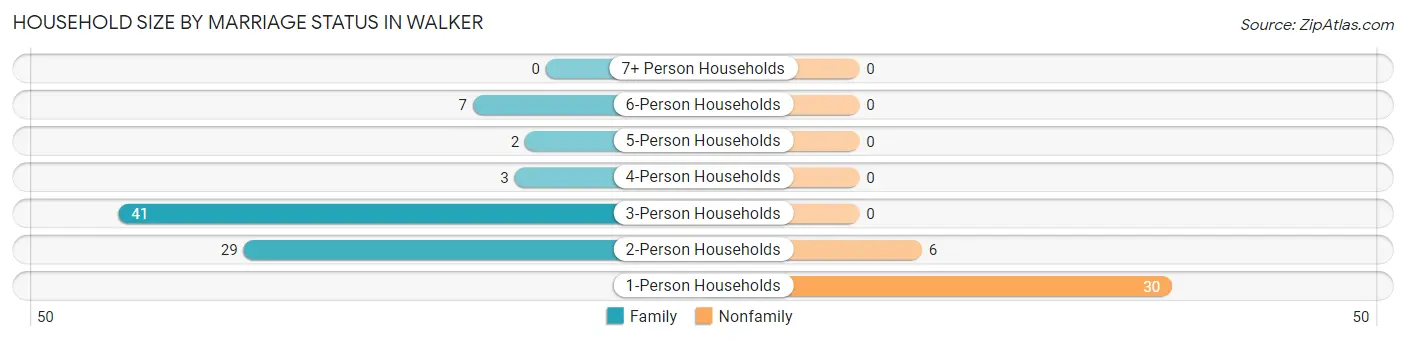
| Household Size | Family Households | Nonfamily Households |
| 1-Person Households | - | 30 (25.4%) |
| 2-Person Households | 29 (24.6%) | 6 (5.1%) |
| 3-Person Households | 41 (34.7%) | 0 (0.0%) |
| 4-Person Households | 3 (2.5%) | 0 (0.0%) |
| 5-Person Households | 2 (1.7%) | 0 (0.0%) |
| 6-Person Households | 7 (5.9%) | 0 (0.0%) |
| 7+ Person Households | 0 (0.0%) | 0 (0.0%) |
| Total | 82 (69.5%) | 36 (30.5%) |
Female Fertility in Walker
Fertility by Age in Walker
| Age Bracket | Women with Births | Births / 1,000 Women |
| 15 to 19 years | 0 (0.0%) | 0.0 |
| 20 to 34 years | 0 (0.0%) | 0.0 |
| 35 to 50 years | 0 (0.0%) | 0.0 |
| Total | 0 (0.0%) | 0.0 |
Fertility by Age by Marriage Status in Walker
| Age Bracket | Married | Unmarried |
| 15 to 19 years | 0 (0.0%) | 0 (0.0%) |
| 20 to 34 years | 0 (0.0%) | 0 (0.0%) |
| 35 to 50 years | 0 (0.0%) | 0 (0.0%) |
| Total | 0 (0.0%) | 0 (0.0%) |
Fertility by Education in Walker
| Educational Attainment | Women with Births | Births / 1,000 Women |
| Less than High School | 0 (0.0%) | 0.0 |
| High School Diploma | 0 (0.0%) | 0.0 |
| College or Associate's Degree | 0 (0.0%) | 0.0 |
| Bachelor's Degree | 0 (0.0%) | 0.0 |
| Graduate Degree | 0 (0.0%) | 0.0 |
| Total | 0 (0.0%) | 0.0 |
Fertility by Education by Marriage Status in Walker
| Educational Attainment | Married | Unmarried |
| Less than High School | 0 (0.0%) | 0 (0.0%) |
| High School Diploma | 0 (0.0%) | 0 (0.0%) |
| College or Associate's Degree | 0 (0.0%) | 0 (0.0%) |
| Bachelor's Degree | 0 (0.0%) | 0 (0.0%) |
| Graduate Degree | 0 (0.0%) | 0 (0.0%) |
| Total | 0 (0.0%) | 0 (0.0%) |
Employment Characteristics in Walker
Employment by Class of Employer in Walker
Among the 110 employed individuals in Walker, private company employees (90 | 81.8%), not-for-profit organizations (5 | 4.5%), and state government employees (5 | 4.5%) make up the most common classes of employment.
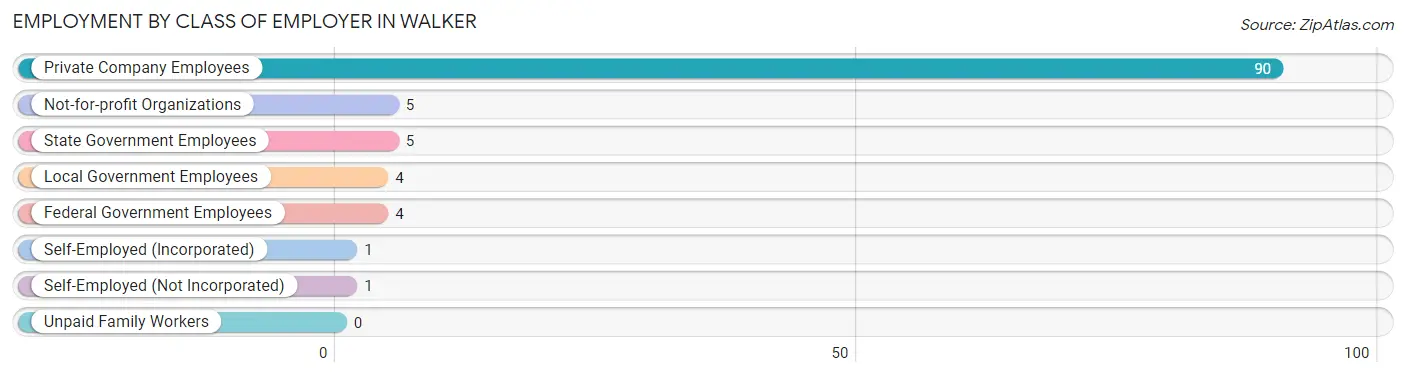
| Employer Class | # Employees | % Employees |
| Private Company Employees | 90 | 81.8% |
| Self-Employed (Incorporated) | 1 | 0.9% |
| Self-Employed (Not Incorporated) | 1 | 0.9% |
| Not-for-profit Organizations | 5 | 4.5% |
| Local Government Employees | 4 | 3.6% |
| State Government Employees | 5 | 4.5% |
| Federal Government Employees | 4 | 3.6% |
| Unpaid Family Workers | 0 | 0.0% |
| Total | 110 | 100.0% |
Employment Status by Age in Walker
According to the labor force statistics for Walker, out of the total population over 16 years of age (301), 38.2% or 115 individuals are in the labor force, with 4.3% or 5 of them unemployed. The age group with the highest labor force participation rate is 60 to 64 years, with 66.7% or 12 individuals in the labor force. Within the labor force, the 30 to 34 years age range has the highest percentage of unemployed individuals, with 50.0% or 3 of them being unemployed.
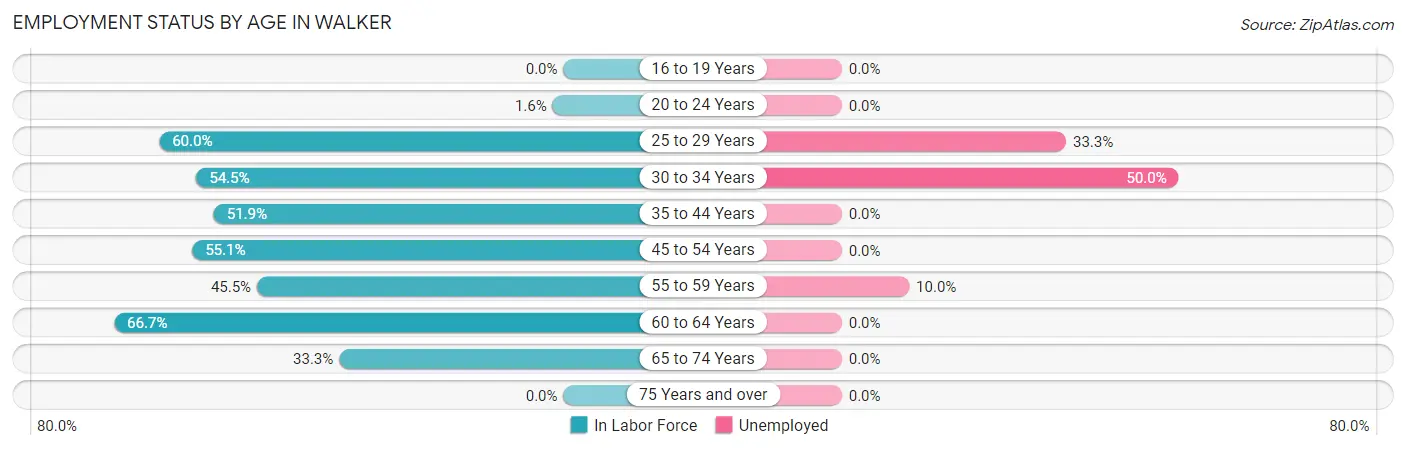
| Age Bracket | In Labor Force | Unemployed |
| 16 to 19 Years | 0 (0.0%) | 0 (0.0%) |
| 20 to 24 Years | 1 (1.6%) | 0 (0.0%) |
| 25 to 29 Years | 3 (60.0%) | 1 (33.3%) |
| 30 to 34 Years | 6 (54.5%) | 3 (50.0%) |
| 35 to 44 Years | 14 (51.9%) | 0 (0.0%) |
| 45 to 54 Years | 59 (55.1%) | 0 (0.0%) |
| 55 to 59 Years | 10 (45.5%) | 1 (10.0%) |
| 60 to 64 Years | 12 (66.7%) | 0 (0.0%) |
| 65 to 74 Years | 10 (33.3%) | 0 (0.0%) |
| 75 Years and over | 0 (0.0%) | 0 (0.0%) |
| Total | 115 (38.2%) | 5 (4.3%) |
Employment Status by Educational Attainment in Walker
According to labor force statistics for Walker, 54.7% of individuals (104) out of the total population between 25 and 64 years of age (190) are in the labor force, with 4.8% or 5 of them being unemployed. The group with the highest labor force participation rate are those with the educational attainment of college / associate degree, with 69.2% or 18 individuals in the labor force. Within the labor force, individuals with college / associate degree education have the highest percentage of unemployment, with 16.7% or 3 of them being unemployed.
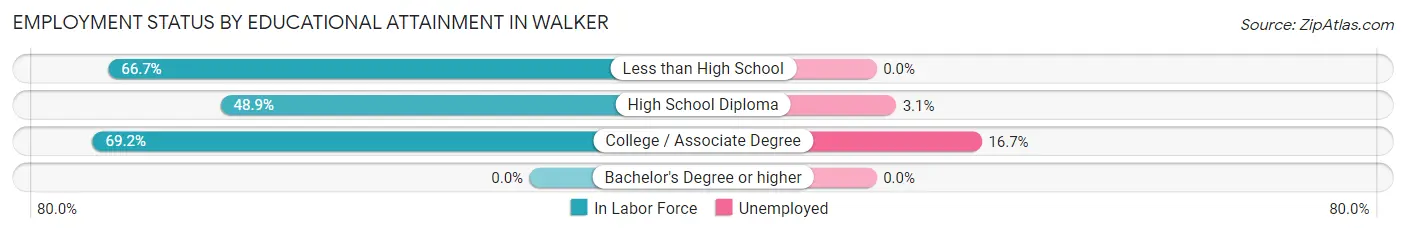
| Educational Attainment | In Labor Force | Unemployed |
| Less than High School | 22 (66.7%) | 0 (0.0%) |
| High School Diploma | 64 (48.9%) | 4 (3.1%) |
| College / Associate Degree | 18 (69.2%) | 4 (16.7%) |
| Bachelor's Degree or higher | 0 (0.0%) | 0 (0.0%) |
| Total | 104 (54.7%) | 9 (4.8%) |
Employment Occupations by Sex in Walker
Management, Business, Science and Arts Occupations
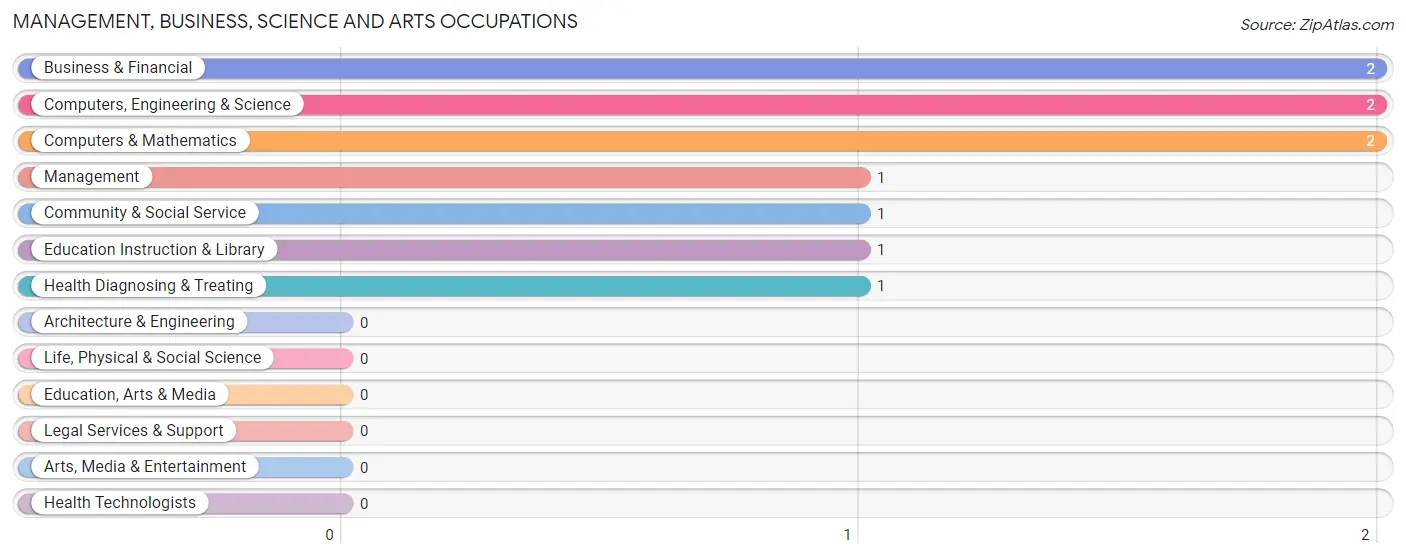
The most common Management, Business, Science and Arts occupations in Walker are Business & Financial (2 | 1.8%), Computers, Engineering & Science (2 | 1.8%), Computers & Mathematics (2 | 1.8%), Management (1 | 0.9%), and Community & Social Service (1 | 0.9%).
Management, Business, Science and Arts Occupations by Sex
Within the Management, Business, Science and Arts occupations in Walker, the most male-oriented occupations are Management (100.0%), Computers, Engineering & Science (100.0%), and Computers & Mathematics (100.0%), while the most female-oriented occupations are Business & Financial (100.0%), Community & Social Service (100.0%), and Education Instruction & Library (100.0%).
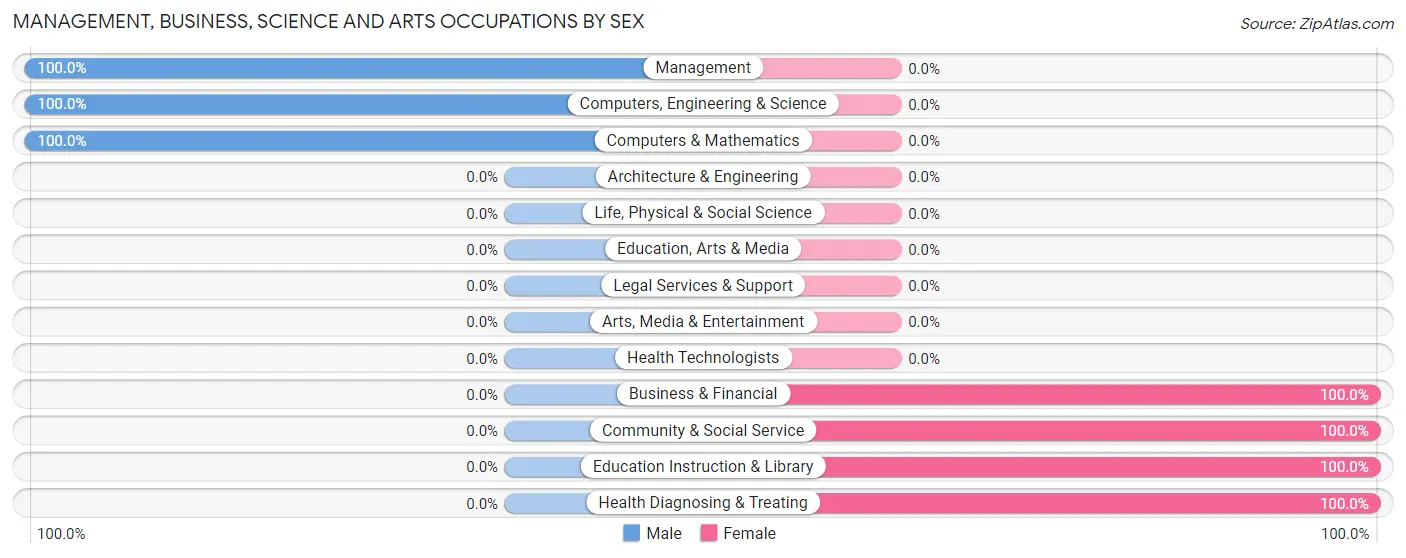
| Occupation | Male | Female |
| Management | 1 (100.0%) | 0 (0.0%) |
| Business & Financial | 0 (0.0%) | 2 (100.0%) |
| Computers, Engineering & Science | 2 (100.0%) | 0 (0.0%) |
| Computers & Mathematics | 2 (100.0%) | 0 (0.0%) |
| Architecture & Engineering | 0 (0.0%) | 0 (0.0%) |
| Life, Physical & Social Science | 0 (0.0%) | 0 (0.0%) |
| Community & Social Service | 0 (0.0%) | 1 (100.0%) |
| Education, Arts & Media | 0 (0.0%) | 0 (0.0%) |
| Legal Services & Support | 0 (0.0%) | 0 (0.0%) |
| Education Instruction & Library | 0 (0.0%) | 1 (100.0%) |
| Arts, Media & Entertainment | 0 (0.0%) | 0 (0.0%) |
| Health Diagnosing & Treating | 0 (0.0%) | 1 (100.0%) |
| Health Technologists | 0 (0.0%) | 0 (0.0%) |
| Total (Category) | 3 (42.9%) | 4 (57.1%) |
| Total (Overall) | 81 (73.6%) | 29 (26.4%) |
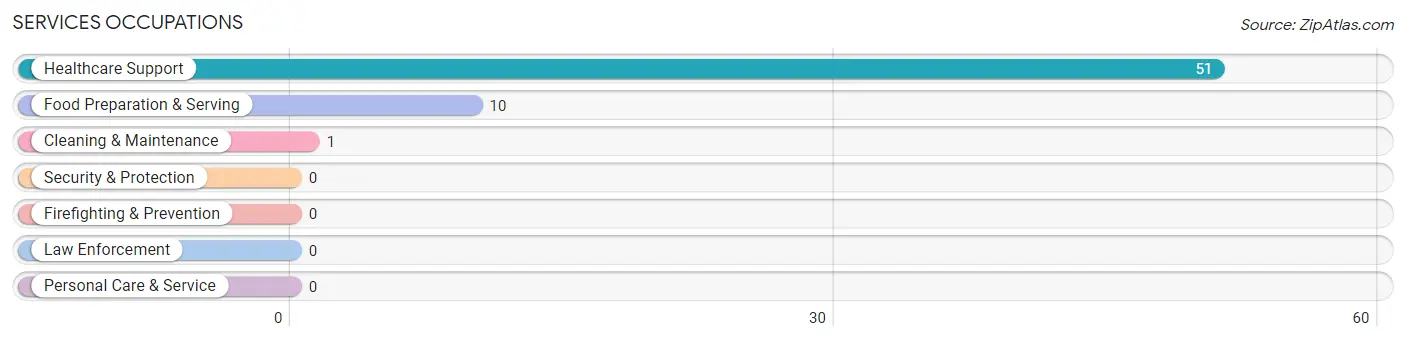
Services Occupations
The most common Services occupations in Walker are Healthcare Support (51 | 46.4%), Food Preparation & Serving (10 | 9.1%), and Cleaning & Maintenance (1 | 0.9%).
Services Occupations by Sex
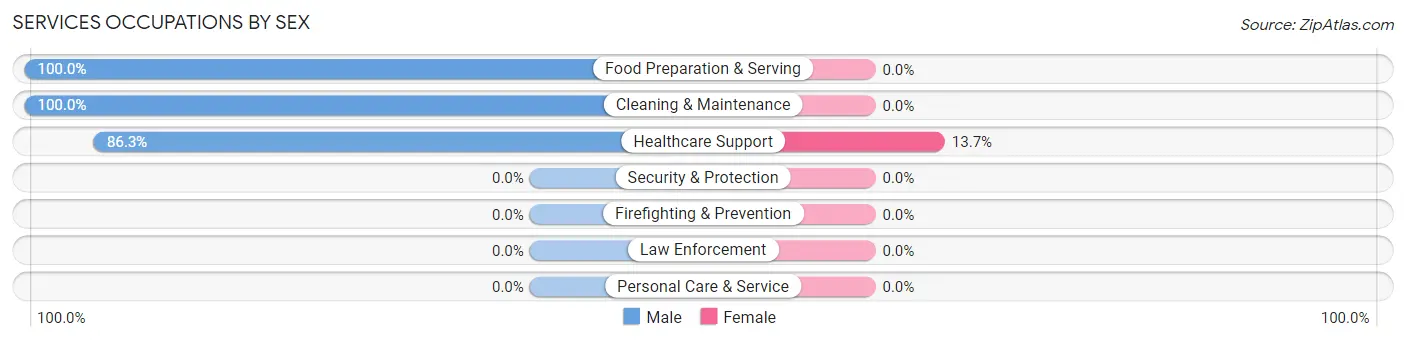
| Occupation | Male | Female |
| Healthcare Support | 44 (86.3%) | 7 (13.7%) |
| Security & Protection | 0 (0.0%) | 0 (0.0%) |
| Firefighting & Prevention | 0 (0.0%) | 0 (0.0%) |
| Law Enforcement | 0 (0.0%) | 0 (0.0%) |
| Food Preparation & Serving | 10 (100.0%) | 0 (0.0%) |
| Cleaning & Maintenance | 1 (100.0%) | 0 (0.0%) |
| Personal Care & Service | 0 (0.0%) | 0 (0.0%) |
| Total (Category) | 55 (88.7%) | 7 (11.3%) |
| Total (Overall) | 81 (73.6%) | 29 (26.4%) |
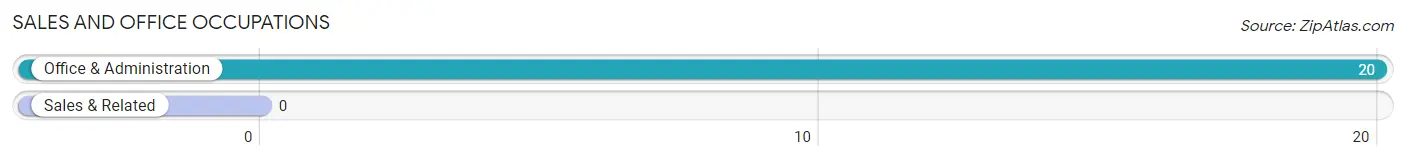
Sales and Office Occupations
The most common Sales and Office occupations in Walker are , and Office & Administration (20 | 18.2%).
Sales and Office Occupations by Sex
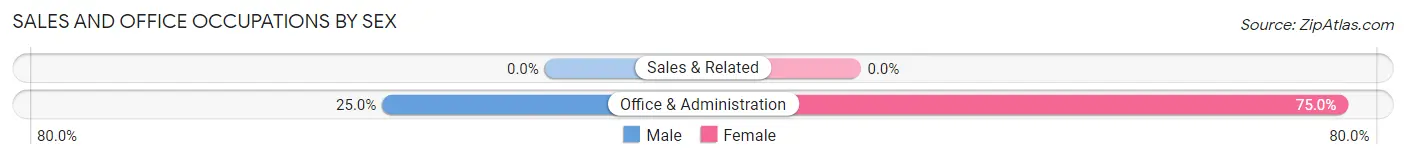
| Occupation | Male | Female |
| Sales & Related | 0 (0.0%) | 0 (0.0%) |
| Office & Administration | 5 (25.0%) | 15 (75.0%) |
| Total (Category) | 5 (25.0%) | 15 (75.0%) |
| Total (Overall) | 81 (73.6%) | 29 (26.4%) |
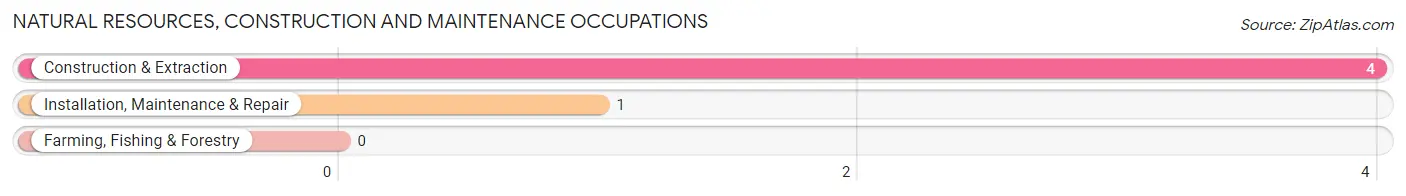
Natural Resources, Construction and Maintenance Occupations
The most common Natural Resources, Construction and Maintenance occupations in Walker are Construction & Extraction (4 | 3.6%), and Installation, Maintenance & Repair (1 | 0.9%).
Natural Resources, Construction and Maintenance Occupations by Sex
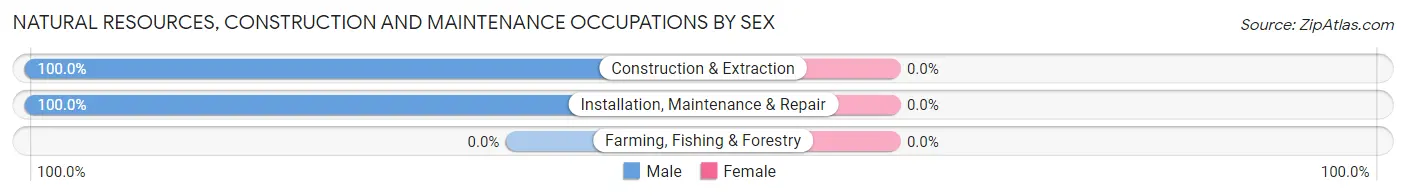
| Occupation | Male | Female |
| Farming, Fishing & Forestry | 0 (0.0%) | 0 (0.0%) |
| Construction & Extraction | 4 (100.0%) | 0 (0.0%) |
| Installation, Maintenance & Repair | 1 (100.0%) | 0 (0.0%) |
| Total (Category) | 5 (100.0%) | 0 (0.0%) |
| Total (Overall) | 81 (73.6%) | 29 (26.4%) |
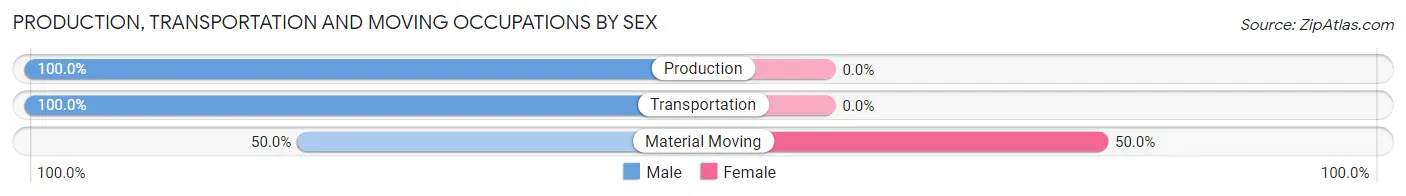
Production, Transportation and Moving Occupations
The most common Production, Transportation and Moving occupations in Walker are Transportation (7 | 6.4%), Material Moving (6 | 5.4%), and Production (3 | 2.7%).
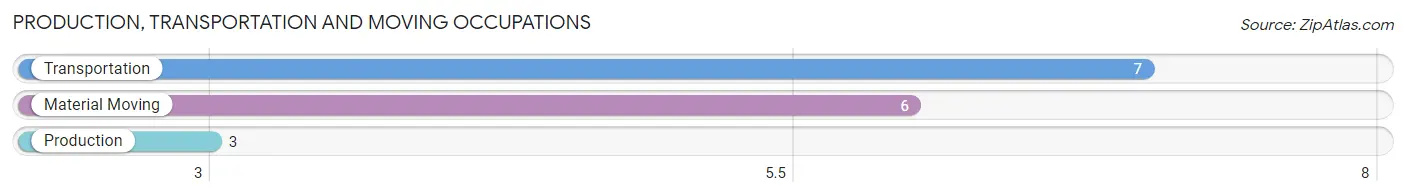
Production, Transportation and Moving Occupations by Sex
| Occupation | Male | Female |
| Production | 3 (100.0%) | 0 (0.0%) |
| Transportation | 7 (100.0%) | 0 (0.0%) |
| Material Moving | 3 (50.0%) | 3 (50.0%) |
| Total (Category) | 13 (81.2%) | 3 (18.8%) |
| Total (Overall) | 81 (73.6%) | 29 (26.4%) |
Employment Industries by Sex in Walker
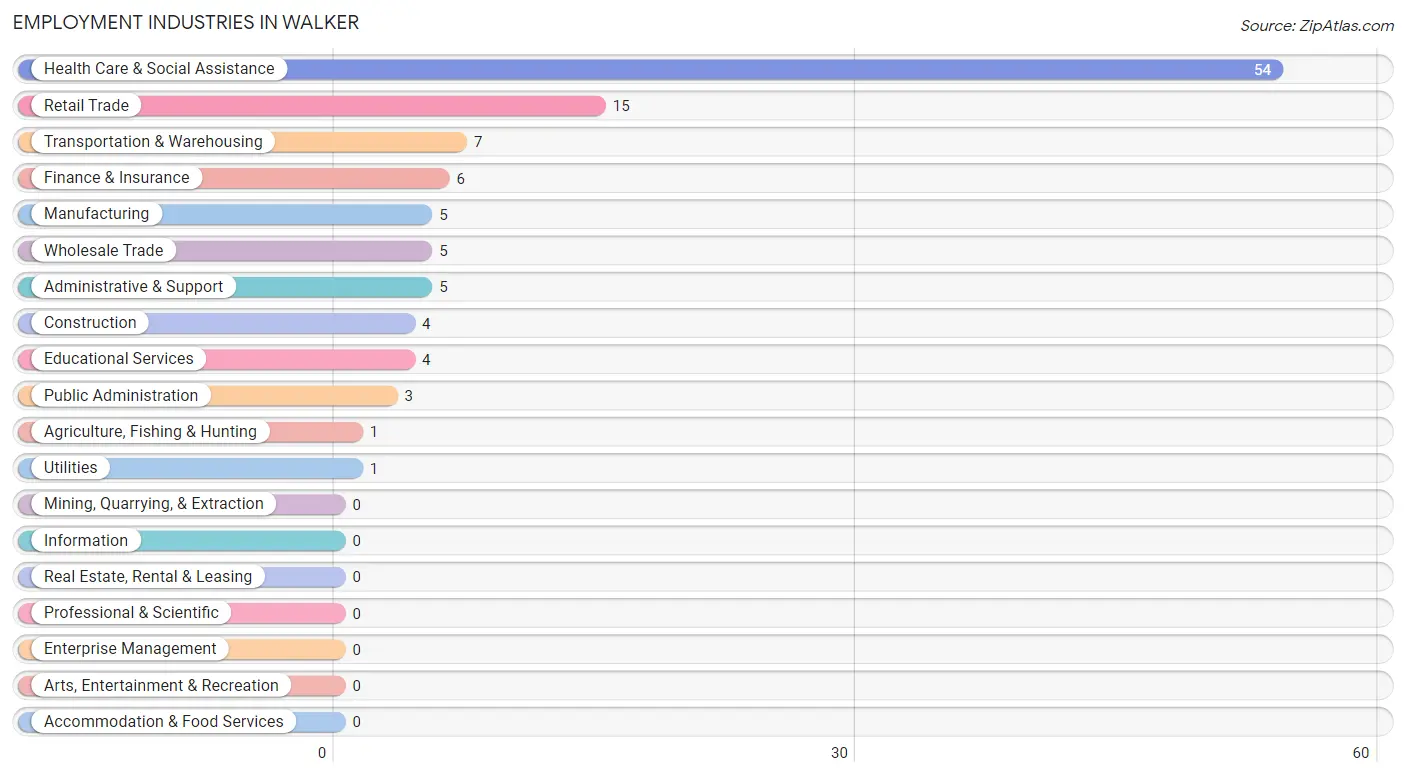
Employment Industries in Walker
The major employment industries in Walker include Health Care & Social Assistance (54 | 49.1%), Retail Trade (15 | 13.6%), Transportation & Warehousing (7 | 6.4%), Finance & Insurance (6 | 5.4%), and Manufacturing (5 | 4.5%).
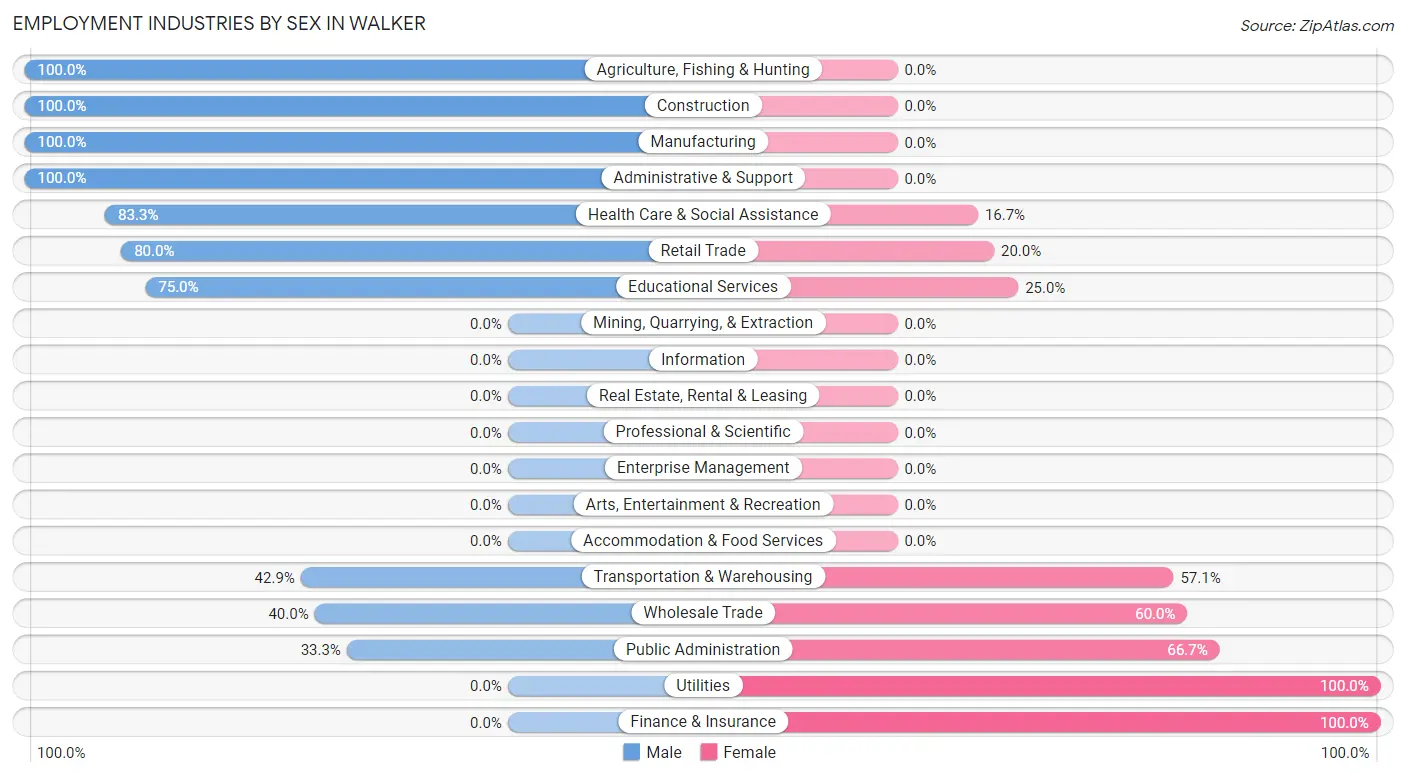
Employment Industries by Sex in Walker
The Walker industries that see more men than women are Agriculture, Fishing & Hunting (100.0%), Construction (100.0%), and Manufacturing (100.0%), whereas the industries that tend to have a higher number of women are Utilities (100.0%), Finance & Insurance (100.0%), and Public Administration (66.7%).
| Industry | Male | Female |
| Agriculture, Fishing & Hunting | 1 (100.0%) | 0 (0.0%) |
| Mining, Quarrying, & Extraction | 0 (0.0%) | 0 (0.0%) |
| Construction | 4 (100.0%) | 0 (0.0%) |
| Manufacturing | 5 (100.0%) | 0 (0.0%) |
| Wholesale Trade | 2 (40.0%) | 3 (60.0%) |
| Retail Trade | 12 (80.0%) | 3 (20.0%) |
| Transportation & Warehousing | 3 (42.9%) | 4 (57.1%) |
| Utilities | 0 (0.0%) | 1 (100.0%) |
| Information | 0 (0.0%) | 0 (0.0%) |
| Finance & Insurance | 0 (0.0%) | 6 (100.0%) |
| Real Estate, Rental & Leasing | 0 (0.0%) | 0 (0.0%) |
| Professional & Scientific | 0 (0.0%) | 0 (0.0%) |
| Enterprise Management | 0 (0.0%) | 0 (0.0%) |
| Administrative & Support | 5 (100.0%) | 0 (0.0%) |
| Educational Services | 3 (75.0%) | 1 (25.0%) |
| Health Care & Social Assistance | 45 (83.3%) | 9 (16.7%) |
| Arts, Entertainment & Recreation | 0 (0.0%) | 0 (0.0%) |
| Accommodation & Food Services | 0 (0.0%) | 0 (0.0%) |
| Public Administration | 1 (33.3%) | 2 (66.7%) |
| Total | 81 (73.6%) | 29 (26.4%) |
Education in Walker
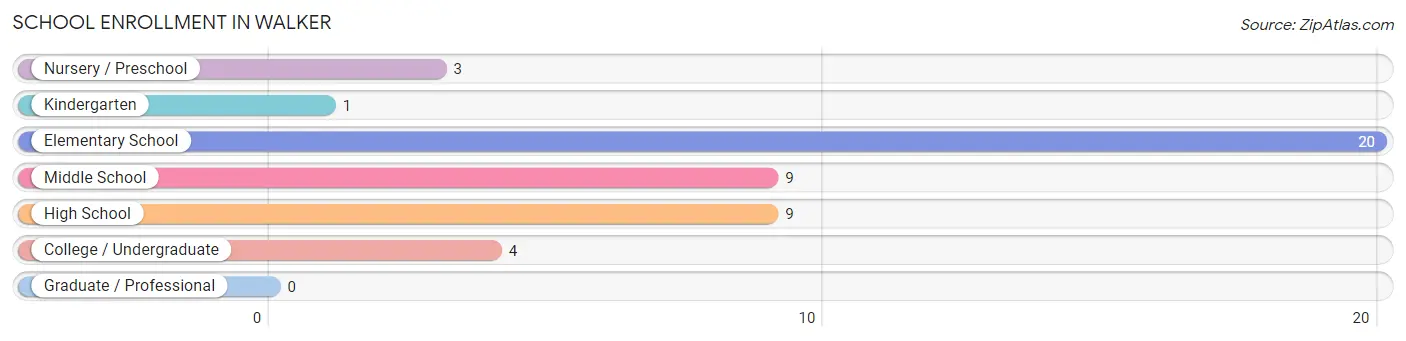
School Enrollment in Walker
The most common levels of schooling among the 46 students in Walker are elementary school (20 | 43.5%), middle school (9 | 19.6%), and high school (9 | 19.6%).
| School Level | # Students | % Students |
| Nursery / Preschool | 3 | 6.5% |
| Kindergarten | 1 | 2.2% |
| Elementary School | 20 | 43.5% |
| Middle School | 9 | 19.6% |
| High School | 9 | 19.6% |
| College / Undergraduate | 4 | 8.7% |
| Graduate / Professional | 0 | 0.0% |
| Total | 46 | 100.0% |
School Enrollment by Age by Funding Source in Walker
Out of a total of 46 students who are enrolled in schools in Walker, 4 (8.7%) attend a private institution, while the remaining 42 (91.3%) are enrolled in public schools. The age group of 25 to 34 year olds has the highest likelihood of being enrolled in private schools, with 2 (50.0% in the age bracket) enrolled. Conversely, the age group of 3 to 4 year olds has the lowest likelihood of being enrolled in a private school, with 3 (100.0% in the age bracket) attending a public institution.
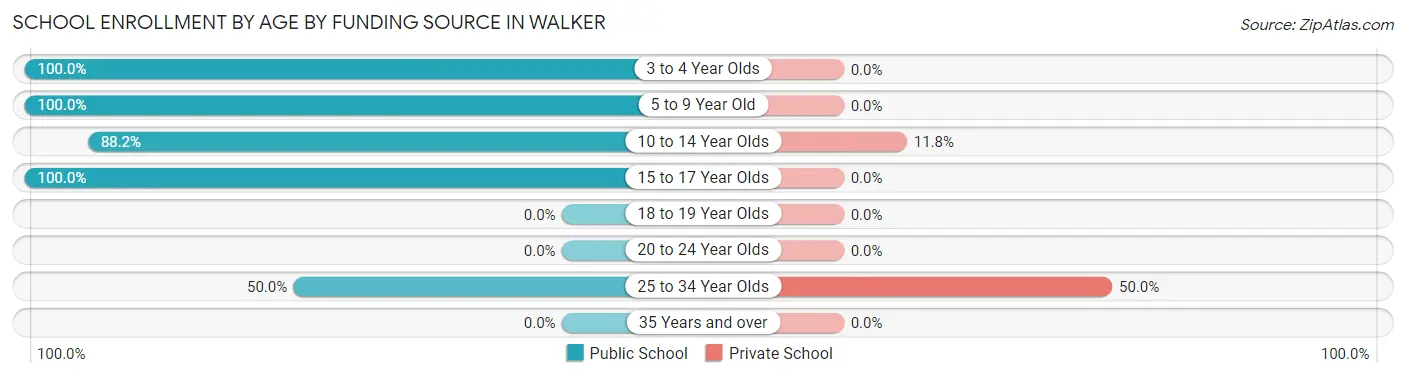
| Age Bracket | Public School | Private School |
| 3 to 4 Year Olds | 3 (100.0%) | 0 (0.0%) |
| 5 to 9 Year Old | 15 (100.0%) | 0 (0.0%) |
| 10 to 14 Year Olds | 15 (88.2%) | 2 (11.8%) |
| 15 to 17 Year Olds | 7 (100.0%) | 0 (0.0%) |
| 18 to 19 Year Olds | 0 (0.0%) | 0 (0.0%) |
| 20 to 24 Year Olds | 0 (0.0%) | 0 (0.0%) |
| 25 to 34 Year Olds | 2 (50.0%) | 2 (50.0%) |
| 35 Years and over | 0 (0.0%) | 0 (0.0%) |
| Total | 42 (91.3%) | 4 (8.7%) |
Educational Attainment by Field of Study in Walker
| Field of Study | # Graduates | % Graduates |
| Computers & Mathematics | 0 | 0.0% |
| Bio, Nature & Agricultural | 0 | 0.0% |
| Physical & Health Sciences | 0 | 0.0% |
| Psychology | 0 | 0.0% |
| Social Sciences | 0 | 0.0% |
| Engineering | 0 | 0.0% |
| Multidisciplinary Studies | 0 | 0.0% |
| Science & Technology | 0 | 0.0% |
| Business | 0 | 0.0% |
| Education | 0 | 0.0% |
| Literature & Languages | 0 | 0.0% |
| Liberal Arts & History | 0 | 0.0% |
| Visual & Performing Arts | 0 | 0.0% |
| Communications | 0 | 0.0% |
| Arts & Humanities | 0 | 0.0% |
| Total | 0 | 0.0% |
Transportation & Commute in Walker
Vehicle Availability by Sex in Walker
The most prevalent vehicle ownership categories in Walker are males with 1 vehicle (59, accounting for 72.8%) and females with 1 vehicle (6, making up 203.4%).
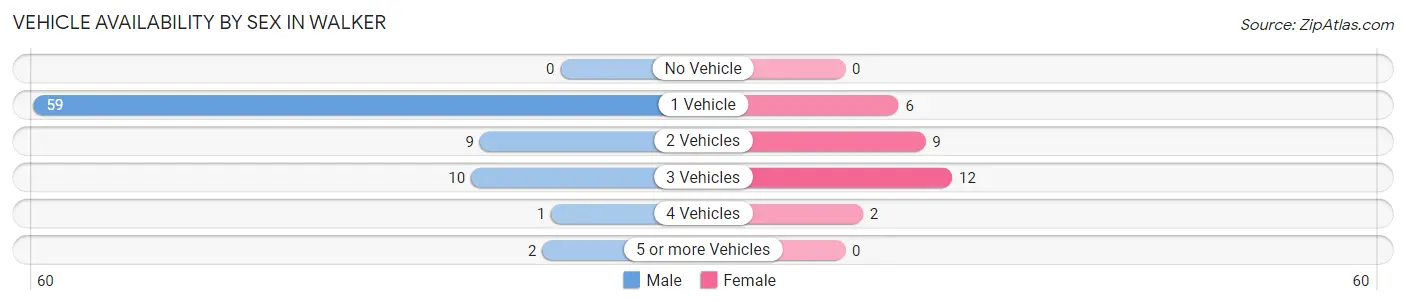
| Vehicles Available | Male | Female |
| No Vehicle | 0 (0.0%) | 0 (0.0%) |
| 1 Vehicle | 59 (72.8%) | 6 (20.7%) |
| 2 Vehicles | 9 (11.1%) | 9 (31.0%) |
| 3 Vehicles | 10 (12.3%) | 12 (41.4%) |
| 4 Vehicles | 1 (1.2%) | 2 (6.9%) |
| 5 or more Vehicles | 2 (2.5%) | 0 (0.0%) |
| Total | 81 (100.0%) | 29 (100.0%) |
Commute Time in Walker
The most frequently occuring commute durations in Walker are 30 to 34 minutes (49 commuters, 49.0%), 15 to 19 minutes (27 commuters, 27.0%), and 60 to 89 minutes (8 commuters, 8.0%).
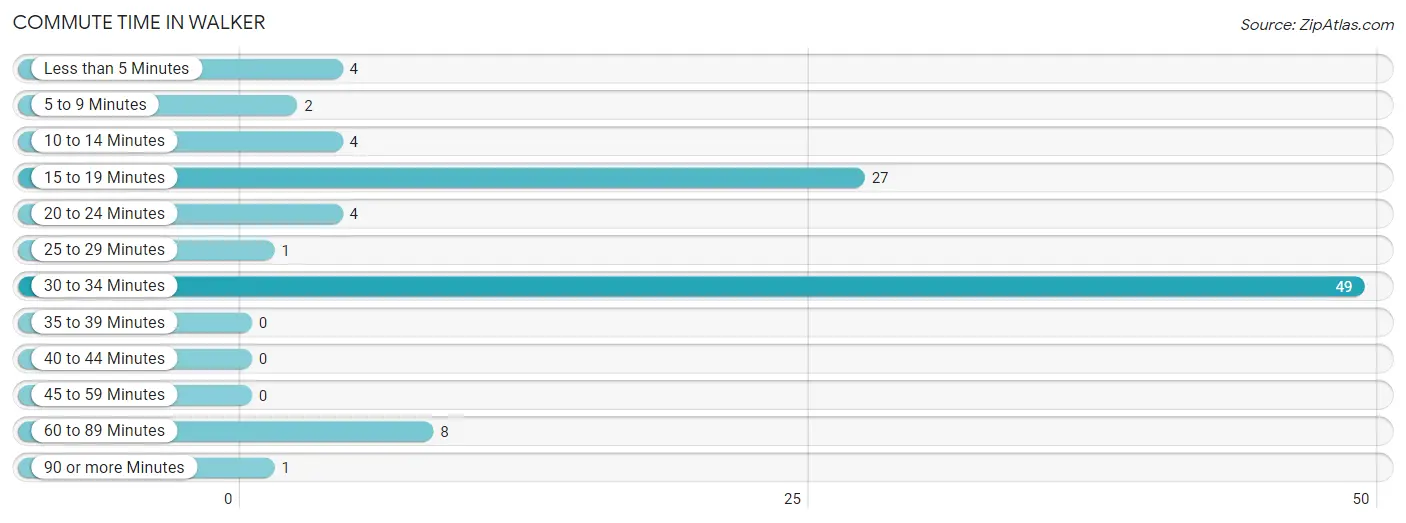
| Commute Time | # Commuters | % Commuters |
| Less than 5 Minutes | 4 | 4.0% |
| 5 to 9 Minutes | 2 | 2.0% |
| 10 to 14 Minutes | 4 | 4.0% |
| 15 to 19 Minutes | 27 | 27.0% |
| 20 to 24 Minutes | 4 | 4.0% |
| 25 to 29 Minutes | 1 | 1.0% |
| 30 to 34 Minutes | 49 | 49.0% |
| 35 to 39 Minutes | 0 | 0.0% |
| 40 to 44 Minutes | 0 | 0.0% |
| 45 to 59 Minutes | 0 | 0.0% |
| 60 to 89 Minutes | 8 | 8.0% |
| 90 or more Minutes | 1 | 1.0% |
Commute Time by Sex in Walker
The most common commute times in Walker are 30 to 34 minutes (44 commuters, 55.7%) for males and 15 to 19 minutes (8 commuters, 38.1%) for females.
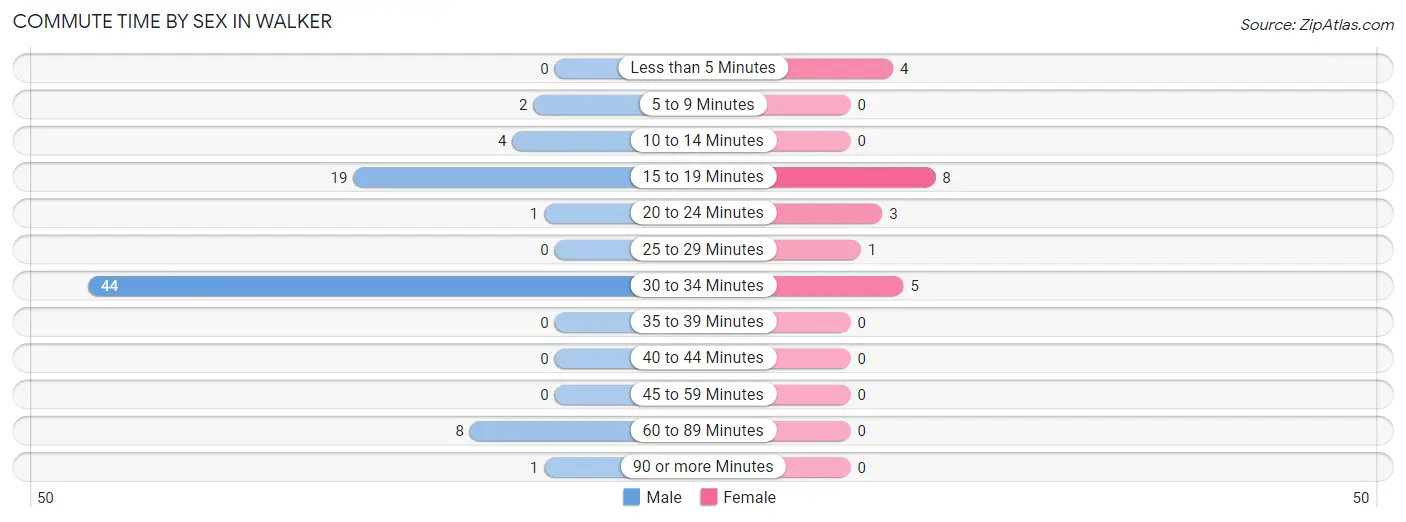
| Commute Time | Male | Female |
| Less than 5 Minutes | 0 (0.0%) | 4 (19.1%) |
| 5 to 9 Minutes | 2 (2.5%) | 0 (0.0%) |
| 10 to 14 Minutes | 4 (5.1%) | 0 (0.0%) |
| 15 to 19 Minutes | 19 (24.0%) | 8 (38.1%) |
| 20 to 24 Minutes | 1 (1.3%) | 3 (14.3%) |
| 25 to 29 Minutes | 0 (0.0%) | 1 (4.8%) |
| 30 to 34 Minutes | 44 (55.7%) | 5 (23.8%) |
| 35 to 39 Minutes | 0 (0.0%) | 0 (0.0%) |
| 40 to 44 Minutes | 0 (0.0%) | 0 (0.0%) |
| 45 to 59 Minutes | 0 (0.0%) | 0 (0.0%) |
| 60 to 89 Minutes | 8 (10.1%) | 0 (0.0%) |
| 90 or more Minutes | 1 (1.3%) | 0 (0.0%) |
Time of Departure to Work by Sex in Walker
The most frequent times of departure to work in Walker are 6:00 AM to 6:29 AM (43, 54.4%) for males and 7:30 AM to 7:59 AM (8, 38.1%) for females.
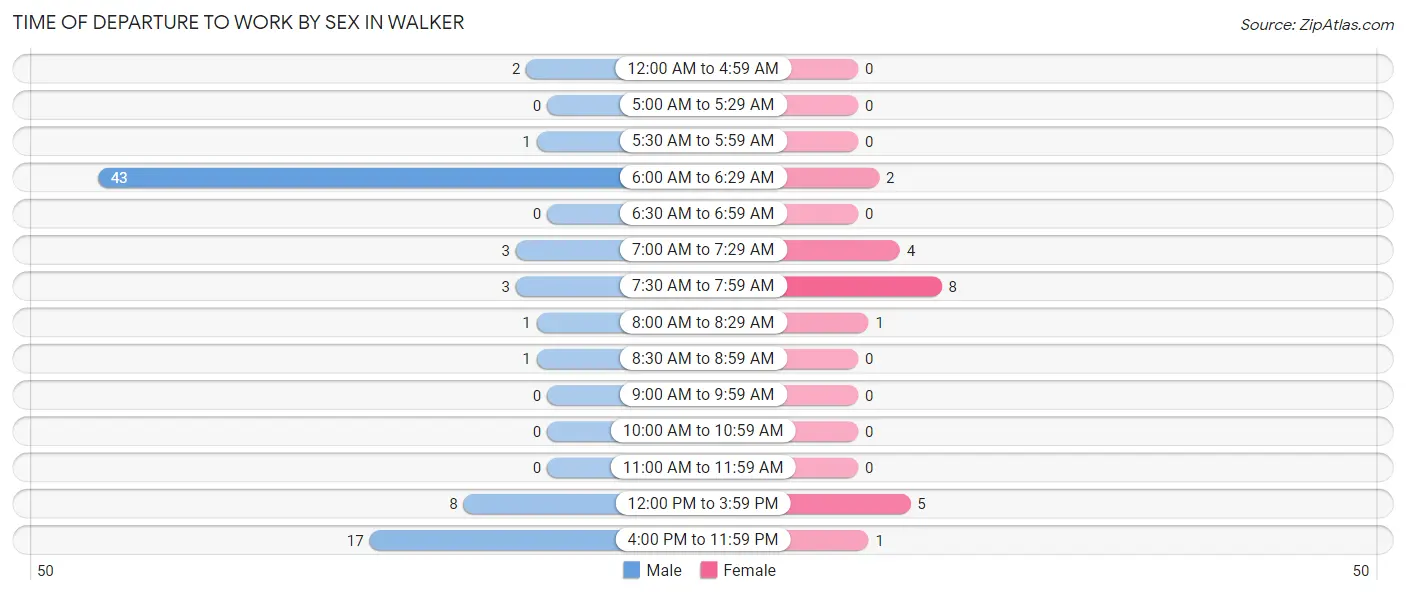
| Time of Departure | Male | Female |
| 12:00 AM to 4:59 AM | 2 (2.5%) | 0 (0.0%) |
| 5:00 AM to 5:29 AM | 0 (0.0%) | 0 (0.0%) |
| 5:30 AM to 5:59 AM | 1 (1.3%) | 0 (0.0%) |
| 6:00 AM to 6:29 AM | 43 (54.4%) | 2 (9.5%) |
| 6:30 AM to 6:59 AM | 0 (0.0%) | 0 (0.0%) |
| 7:00 AM to 7:29 AM | 3 (3.8%) | 4 (19.1%) |
| 7:30 AM to 7:59 AM | 3 (3.8%) | 8 (38.1%) |
| 8:00 AM to 8:29 AM | 1 (1.3%) | 1 (4.8%) |
| 8:30 AM to 8:59 AM | 1 (1.3%) | 0 (0.0%) |
| 9:00 AM to 9:59 AM | 0 (0.0%) | 0 (0.0%) |
| 10:00 AM to 10:59 AM | 0 (0.0%) | 0 (0.0%) |
| 11:00 AM to 11:59 AM | 0 (0.0%) | 0 (0.0%) |
| 12:00 PM to 3:59 PM | 8 (10.1%) | 5 (23.8%) |
| 4:00 PM to 11:59 PM | 17 (21.5%) | 1 (4.8%) |
| Total | 79 (100.0%) | 21 (100.0%) |
Housing Occupancy in Walker
Occupancy by Ownership in Walker
Of the total 118 dwellings in Walker, owner-occupied units account for 86 (72.9%), while renter-occupied units make up 32 (27.1%).
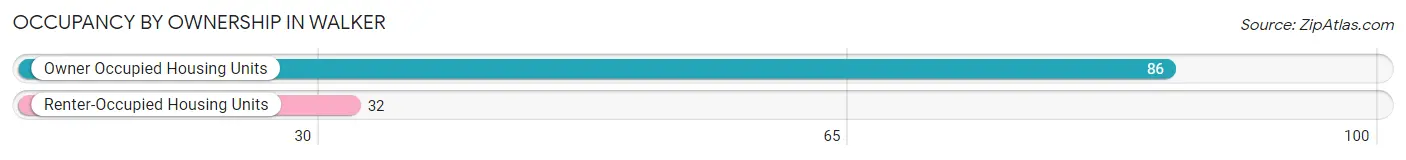
| Occupancy | # Housing Units | % Housing Units |
| Owner Occupied Housing Units | 86 | 72.9% |
| Renter-Occupied Housing Units | 32 | 27.1% |
| Total Occupied Housing Units | 118 | 100.0% |
Occupancy by Household Size in Walker
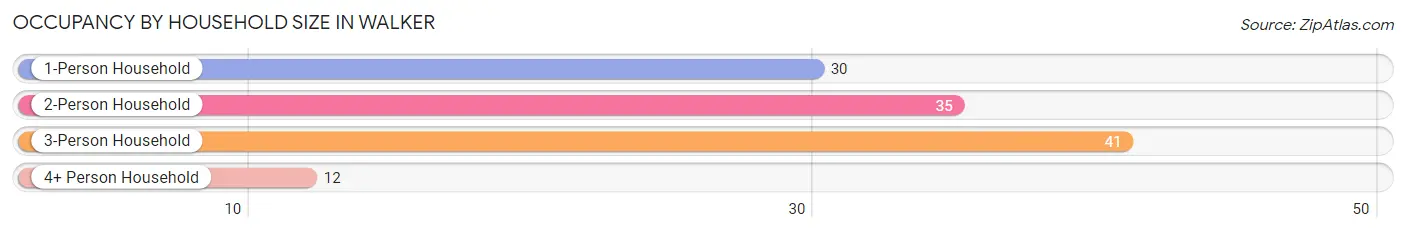
| Household Size | # Housing Units | % Housing Units |
| 1-Person Household | 30 | 25.4% |
| 2-Person Household | 35 | 29.7% |
| 3-Person Household | 41 | 34.7% |
| 4+ Person Household | 12 | 10.2% |
| Total Housing Units | 118 | 100.0% |
Occupancy by Ownership by Household Size in Walker
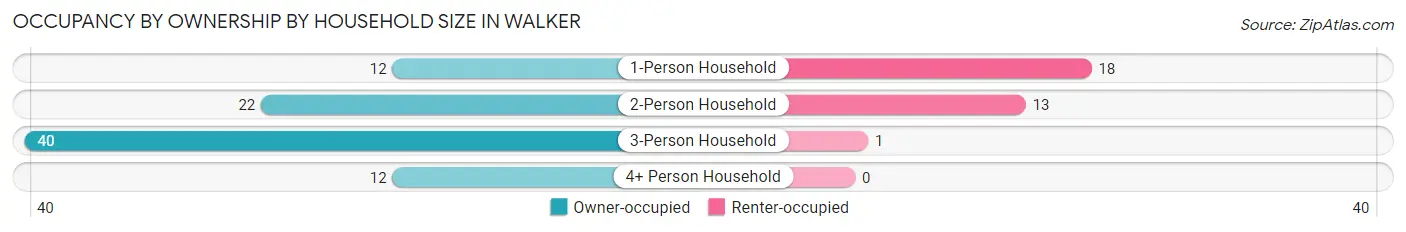
| Household Size | Owner-occupied | Renter-occupied |
| 1-Person Household | 12 (40.0%) | 18 (60.0%) |
| 2-Person Household | 22 (62.9%) | 13 (37.1%) |
| 3-Person Household | 40 (97.6%) | 1 (2.4%) |
| 4+ Person Household | 12 (100.0%) | 0 (0.0%) |
| Total Housing Units | 86 (72.9%) | 32 (27.1%) |
Occupancy by Educational Attainment in Walker
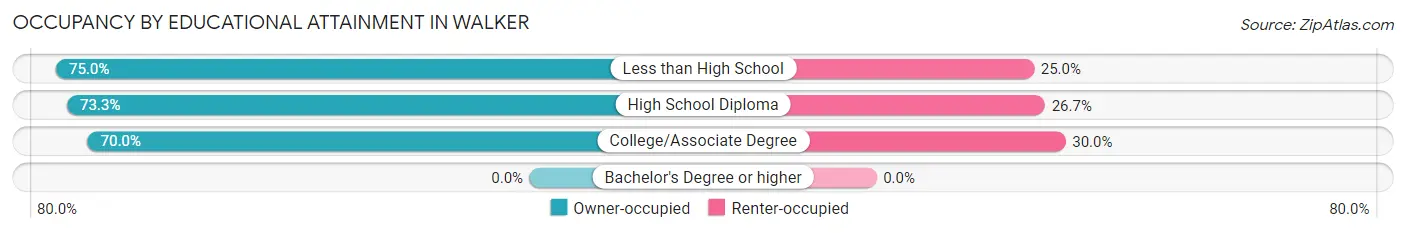
| Household Size | Owner-occupied | Renter-occupied |
| Less than High School | 9 (75.0%) | 3 (25.0%) |
| High School Diploma | 63 (73.3%) | 23 (26.7%) |
| College/Associate Degree | 14 (70.0%) | 6 (30.0%) |
| Bachelor's Degree or higher | 0 (0.0%) | 0 (0.0%) |
Occupancy by Age of Householder in Walker
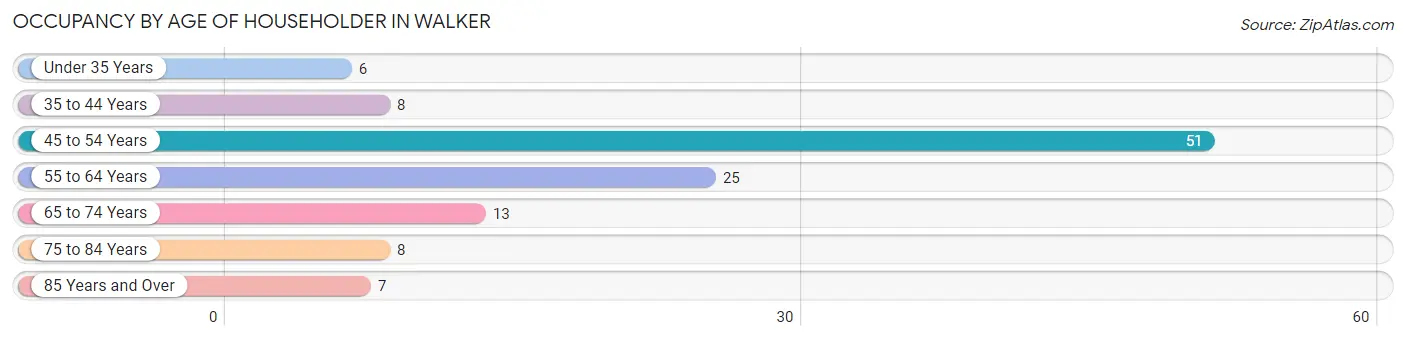
| Age Bracket | # Households | % Households |
| Under 35 Years | 6 | 5.1% |
| 35 to 44 Years | 8 | 6.8% |
| 45 to 54 Years | 51 | 43.2% |
| 55 to 64 Years | 25 | 21.2% |
| 65 to 74 Years | 13 | 11.0% |
| 75 to 84 Years | 8 | 6.8% |
| 85 Years and Over | 7 | 5.9% |
| Total | 118 | 100.0% |
Housing Finances in Walker
Median Income by Occupancy in Walker
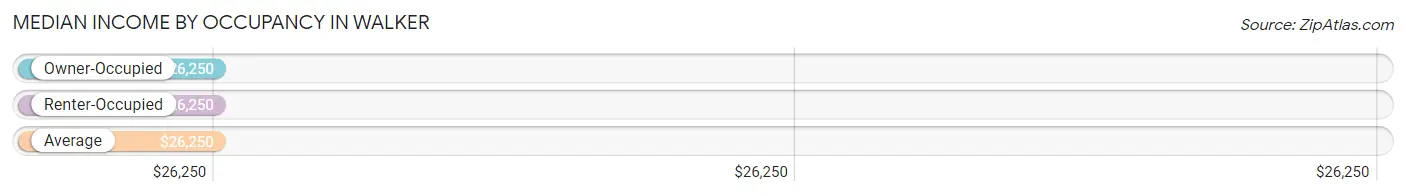
| Occupancy Type | # Households | Median Income |
| Owner-Occupied | 86 (72.9%) | $26,250 |
| Renter-Occupied | 32 (27.1%) | $26,250 |
| Average | 118 (100.0%) | $26,250 |
Occupancy by Householder Income Bracket in Walker
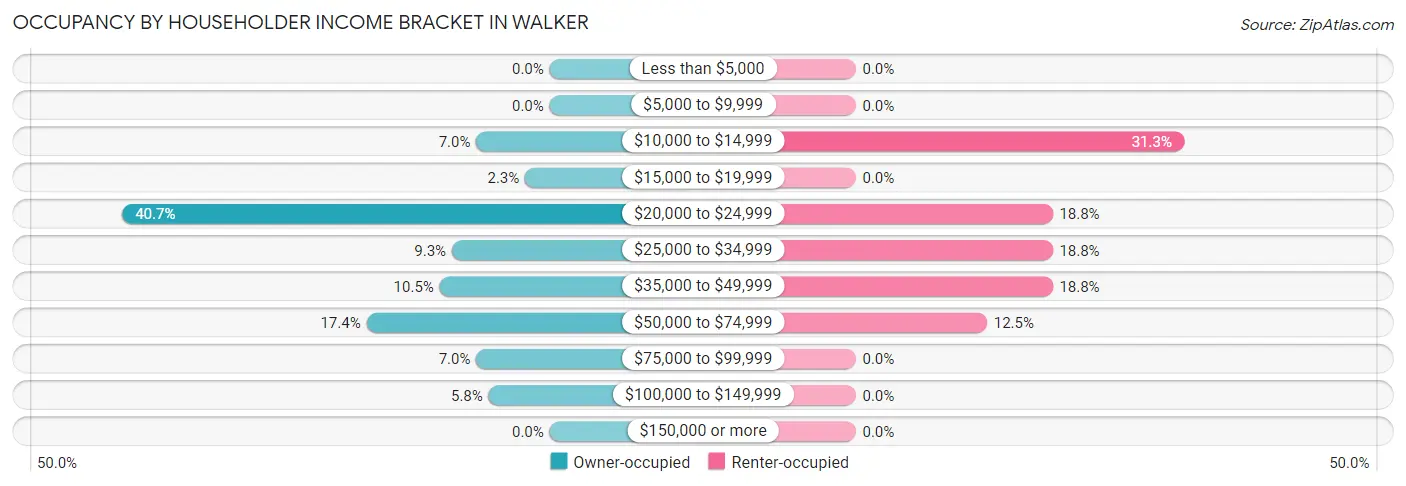
| Income Bracket | Owner-occupied | Renter-occupied |
| Less than $5,000 | 0 (0.0%) | 0 (0.0%) |
| $5,000 to $9,999 | 0 (0.0%) | 0 (0.0%) |
| $10,000 to $14,999 | 6 (7.0%) | 10 (31.2%) |
| $15,000 to $19,999 | 2 (2.3%) | 0 (0.0%) |
| $20,000 to $24,999 | 35 (40.7%) | 6 (18.8%) |
| $25,000 to $34,999 | 8 (9.3%) | 6 (18.8%) |
| $35,000 to $49,999 | 9 (10.5%) | 6 (18.8%) |
| $50,000 to $74,999 | 15 (17.4%) | 4 (12.5%) |
| $75,000 to $99,999 | 6 (7.0%) | 0 (0.0%) |
| $100,000 to $149,999 | 5 (5.8%) | 0 (0.0%) |
| $150,000 or more | 0 (0.0%) | 0 (0.0%) |
| Total | 86 (100.0%) | 32 (100.0%) |
Monthly Housing Cost Tiers in Walker
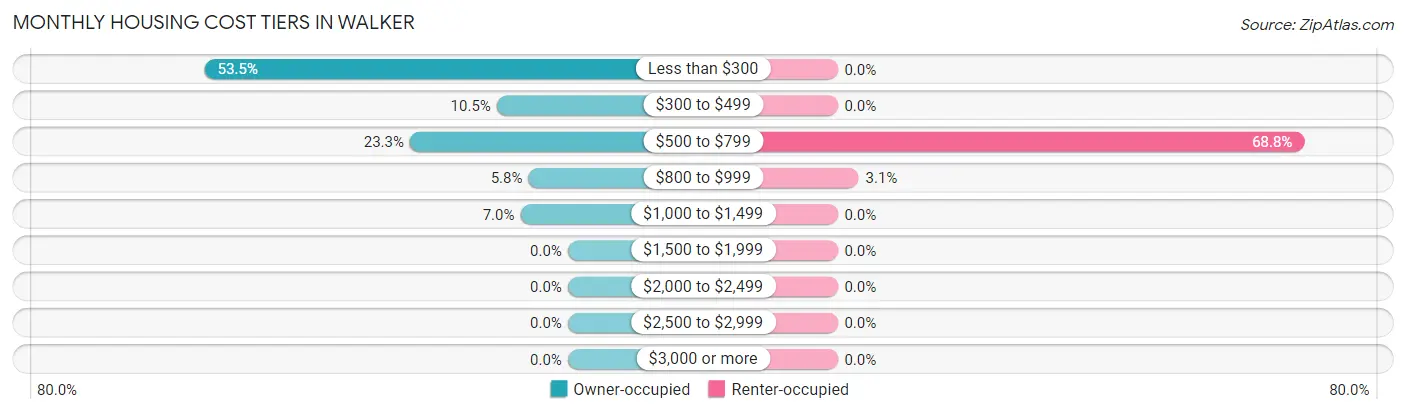
| Monthly Cost | Owner-occupied | Renter-occupied |
| Less than $300 | 46 (53.5%) | 0 (0.0%) |
| $300 to $499 | 9 (10.5%) | 0 (0.0%) |
| $500 to $799 | 20 (23.3%) | 22 (68.8%) |
| $800 to $999 | 5 (5.8%) | 1 (3.1%) |
| $1,000 to $1,499 | 6 (7.0%) | 0 (0.0%) |
| $1,500 to $1,999 | 0 (0.0%) | 0 (0.0%) |
| $2,000 to $2,499 | 0 (0.0%) | 0 (0.0%) |
| $2,500 to $2,999 | 0 (0.0%) | 0 (0.0%) |
| $3,000 or more | 0 (0.0%) | 0 (0.0%) |
| Total | 86 (100.0%) | 32 (100.0%) |
Physical Housing Characteristics in Walker
Housing Structures in Walker
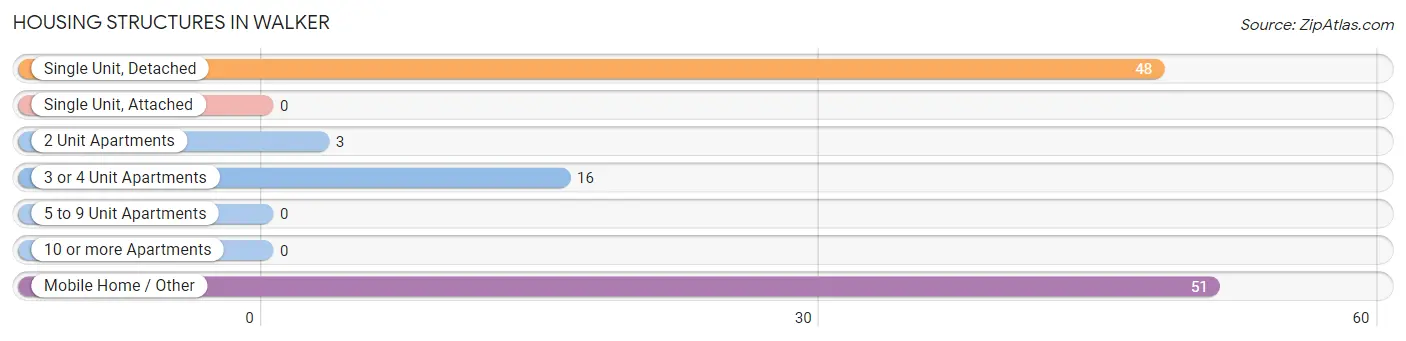
| Structure Type | # Housing Units | % Housing Units |
| Single Unit, Detached | 48 | 40.7% |
| Single Unit, Attached | 0 | 0.0% |
| 2 Unit Apartments | 3 | 2.5% |
| 3 or 4 Unit Apartments | 16 | 13.6% |
| 5 to 9 Unit Apartments | 0 | 0.0% |
| 10 or more Apartments | 0 | 0.0% |
| Mobile Home / Other | 51 | 43.2% |
| Total | 118 | 100.0% |
Housing Structures by Occupancy in Walker
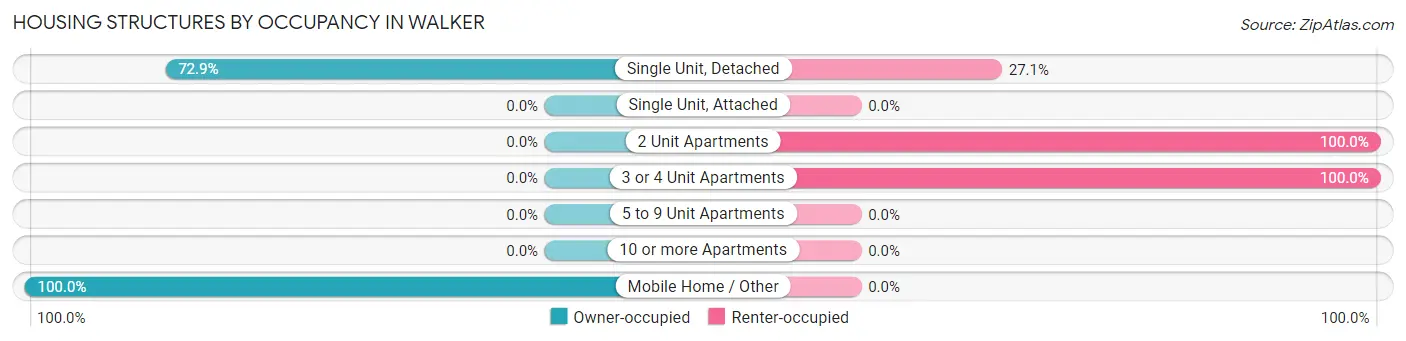
| Structure Type | Owner-occupied | Renter-occupied |
| Single Unit, Detached | 35 (72.9%) | 13 (27.1%) |
| Single Unit, Attached | 0 (0.0%) | 0 (0.0%) |
| 2 Unit Apartments | 0 (0.0%) | 3 (100.0%) |
| 3 or 4 Unit Apartments | 0 (0.0%) | 16 (100.0%) |
| 5 to 9 Unit Apartments | 0 (0.0%) | 0 (0.0%) |
| 10 or more Apartments | 0 (0.0%) | 0 (0.0%) |
| Mobile Home / Other | 51 (100.0%) | 0 (0.0%) |
| Total | 86 (72.9%) | 32 (27.1%) |
Housing Structures by Number of Rooms in Walker
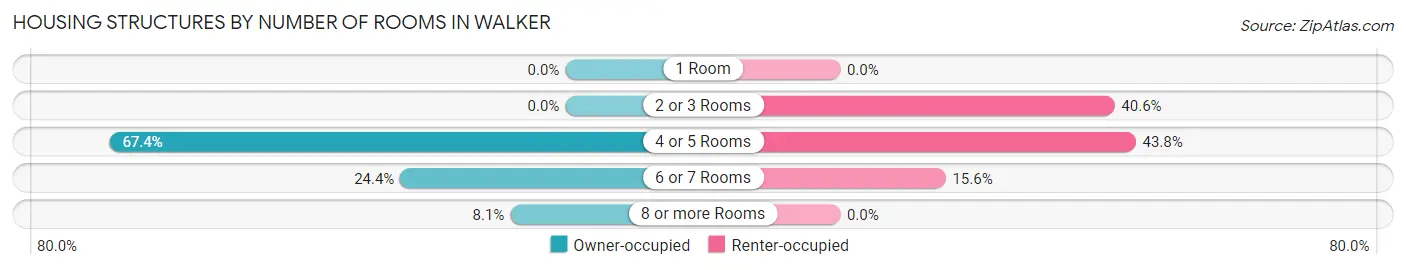
| Number of Rooms | Owner-occupied | Renter-occupied |
| 1 Room | 0 (0.0%) | 0 (0.0%) |
| 2 or 3 Rooms | 0 (0.0%) | 13 (40.6%) |
| 4 or 5 Rooms | 58 (67.4%) | 14 (43.8%) |
| 6 or 7 Rooms | 21 (24.4%) | 5 (15.6%) |
| 8 or more Rooms | 7 (8.1%) | 0 (0.0%) |
| Total | 86 (100.0%) | 32 (100.0%) |
Housing Structure by Heating Type in Walker
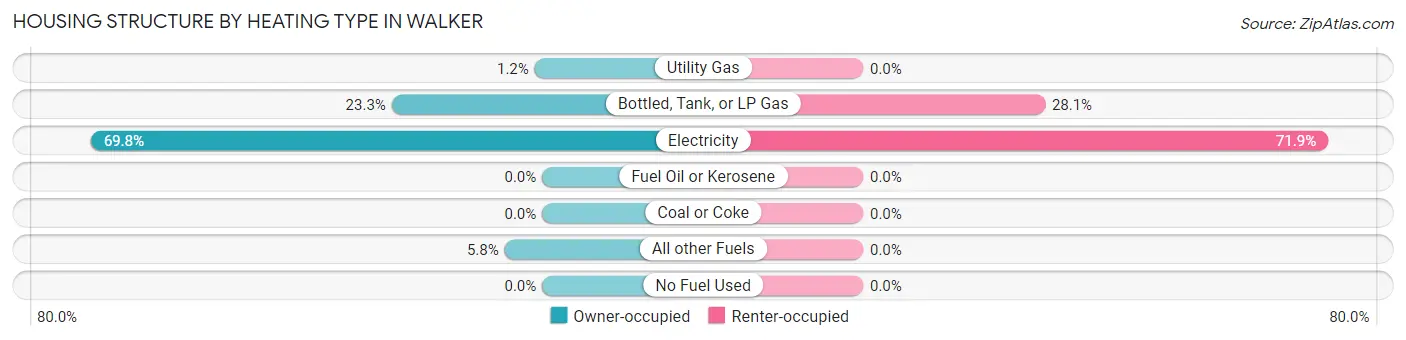
| Heating Type | Owner-occupied | Renter-occupied |
| Utility Gas | 1 (1.2%) | 0 (0.0%) |
| Bottled, Tank, or LP Gas | 20 (23.3%) | 9 (28.1%) |
| Electricity | 60 (69.8%) | 23 (71.9%) |
| Fuel Oil or Kerosene | 0 (0.0%) | 0 (0.0%) |
| Coal or Coke | 0 (0.0%) | 0 (0.0%) |
| All other Fuels | 5 (5.8%) | 0 (0.0%) |
| No Fuel Used | 0 (0.0%) | 0 (0.0%) |
| Total | 86 (100.0%) | 32 (100.0%) |
Household Vehicle Usage in Walker
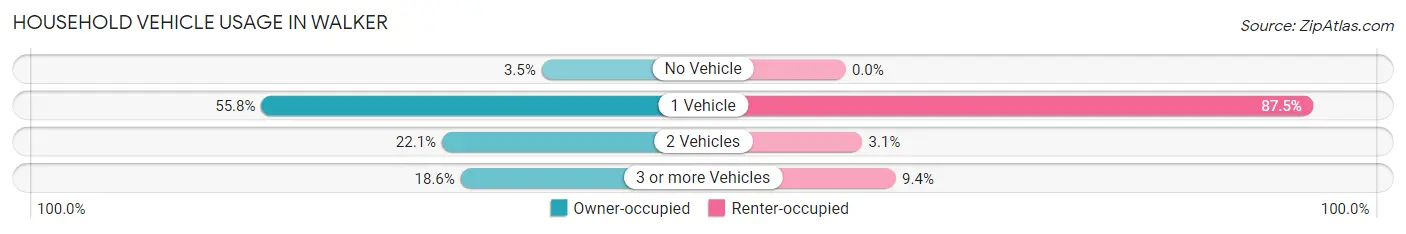
| Vehicles per Household | Owner-occupied | Renter-occupied |
| No Vehicle | 3 (3.5%) | 0 (0.0%) |
| 1 Vehicle | 48 (55.8%) | 28 (87.5%) |
| 2 Vehicles | 19 (22.1%) | 1 (3.1%) |
| 3 or more Vehicles | 16 (18.6%) | 3 (9.4%) |
| Total | 86 (100.0%) | 32 (100.0%) |
Real Estate & Mortgages in Walker
Real Estate and Mortgage Overview in Walker
| Characteristic | Without Mortgage | With Mortgage |
| Housing Units | 72 | 14 |
| Median Property Value | - | - |
| Median Household Income | $24,714 | $0 |
| Monthly Housing Costs | $246 | $0 |
| Real Estate Taxes | - | - |
Property Value by Mortgage Status in Walker
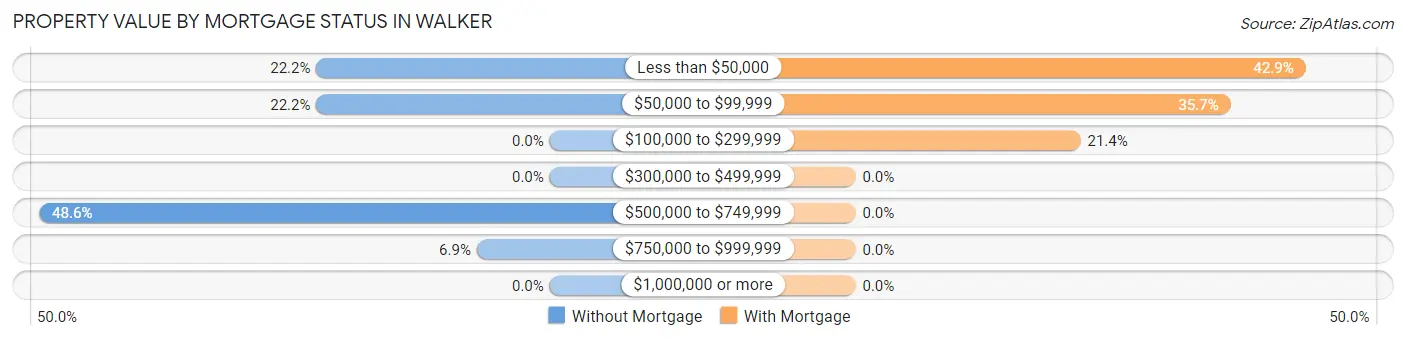
| Property Value | Without Mortgage | With Mortgage |
| Less than $50,000 | 16 (22.2%) | 6 (42.9%) |
| $50,000 to $99,999 | 16 (22.2%) | 5 (35.7%) |
| $100,000 to $299,999 | 0 (0.0%) | 3 (21.4%) |
| $300,000 to $499,999 | 0 (0.0%) | 0 (0.0%) |
| $500,000 to $749,999 | 35 (48.6%) | 0 (0.0%) |
| $750,000 to $999,999 | 5 (6.9%) | 0 (0.0%) |
| $1,000,000 or more | 0 (0.0%) | 0 (0.0%) |
| Total | 72 (100.0%) | 14 (100.0%) |
Household Income by Mortgage Status in Walker
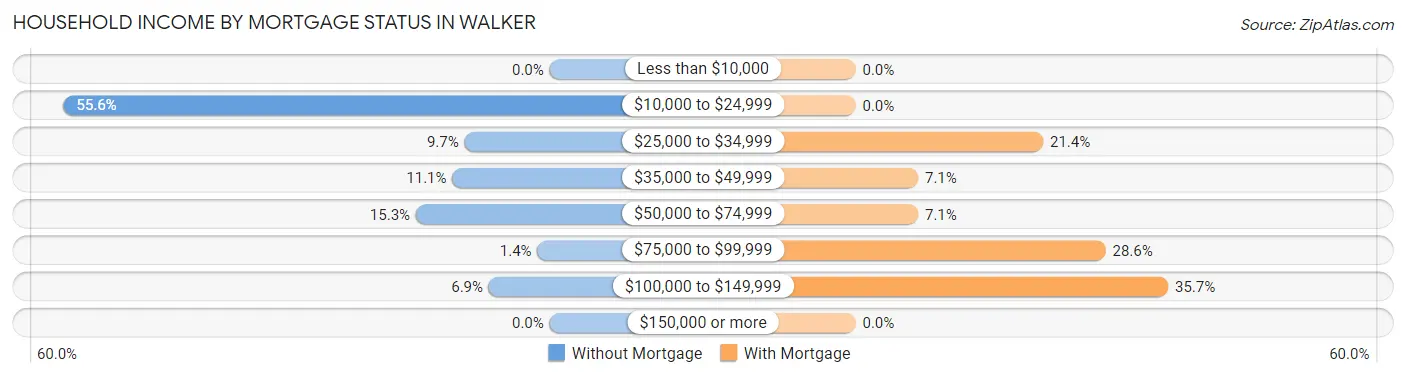
| Household Income | Without Mortgage | With Mortgage |
| Less than $10,000 | 0 (0.0%) | 0 (0.0%) |
| $10,000 to $24,999 | 40 (55.6%) | 0 (0.0%) |
| $25,000 to $34,999 | 7 (9.7%) | 3 (21.4%) |
| $35,000 to $49,999 | 8 (11.1%) | 1 (7.1%) |
| $50,000 to $74,999 | 11 (15.3%) | 1 (7.1%) |
| $75,000 to $99,999 | 1 (1.4%) | 4 (28.6%) |
| $100,000 to $149,999 | 5 (6.9%) | 5 (35.7%) |
| $150,000 or more | 0 (0.0%) | 0 (0.0%) |
| Total | 72 (100.0%) | 14 (100.0%) |
Property Value to Household Income Ratio in Walker
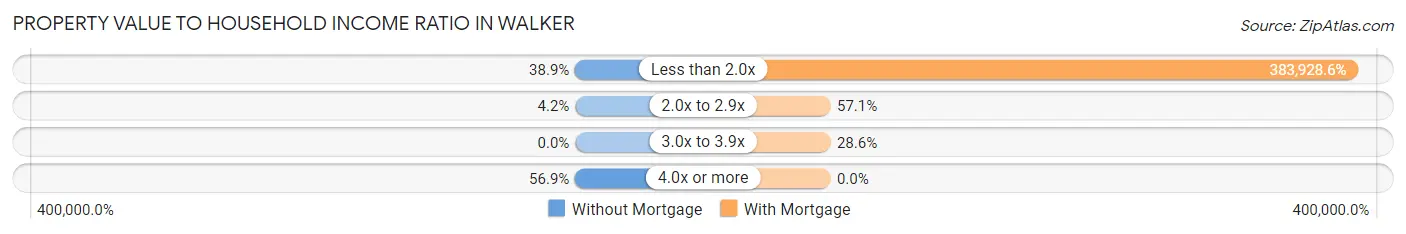
| Value-to-Income Ratio | Without Mortgage | With Mortgage |
| Less than 2.0x | 28 (38.9%) | 53,750 (383,928.6%) |
| 2.0x to 2.9x | 3 (4.2%) | 8 (57.1%) |
| 3.0x to 3.9x | 0 (0.0%) | 4 (28.6%) |
| 4.0x or more | 41 (56.9%) | 0 (0.0%) |
| Total | 72 (100.0%) | 14 (100.0%) |
Real Estate Taxes by Mortgage Status in Walker
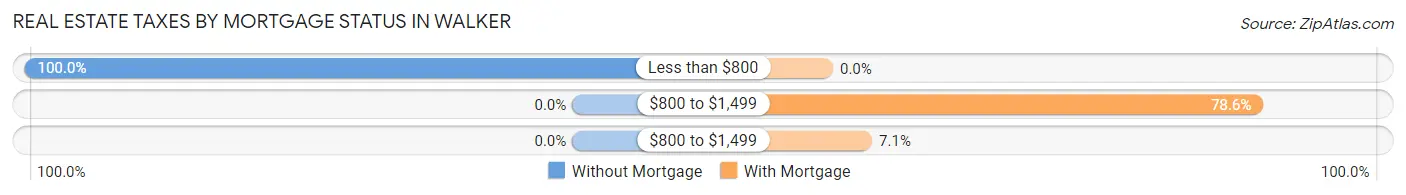
| Property Taxes | Without Mortgage | With Mortgage |
| Less than $800 | 72 (100.0%) | 0 (0.0%) |
| $800 to $1,499 | 0 (0.0%) | 11 (78.6%) |
| $800 to $1,499 | 0 (0.0%) | 1 (7.1%) |
| Total | 72 (100.0%) | 14 (100.0%) |
Health & Disability in Walker
Health Insurance Coverage by Age in Walker
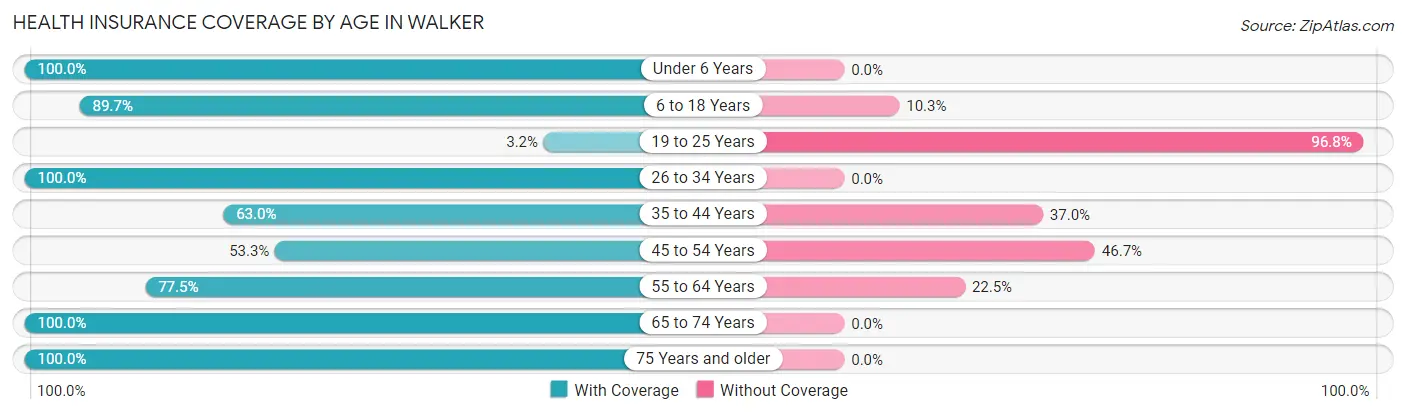
| Age Bracket | With Coverage | Without Coverage |
| Under 6 Years | 3 (100.0%) | 0 (0.0%) |
| 6 to 18 Years | 35 (89.7%) | 4 (10.3%) |
| 19 to 25 Years | 2 (3.2%) | 61 (96.8%) |
| 26 to 34 Years | 15 (100.0%) | 0 (0.0%) |
| 35 to 44 Years | 17 (63.0%) | 10 (37.0%) |
| 45 to 54 Years | 57 (53.3%) | 50 (46.7%) |
| 55 to 64 Years | 31 (77.5%) | 9 (22.5%) |
| 65 to 74 Years | 30 (100.0%) | 0 (0.0%) |
| 75 Years and older | 19 (100.0%) | 0 (0.0%) |
| Total | 209 (60.9%) | 134 (39.1%) |
Health Insurance Coverage by Citizenship Status in Walker
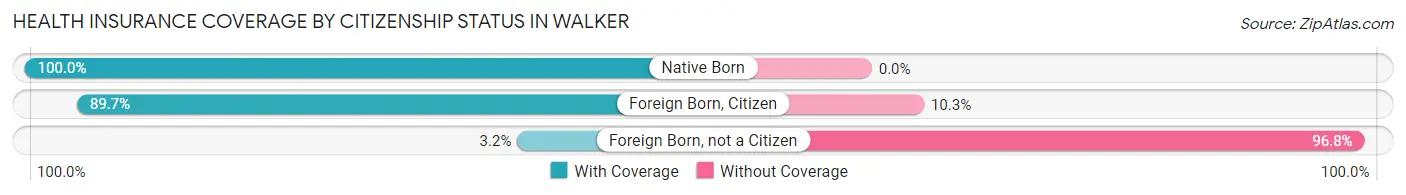
| Citizenship Status | With Coverage | Without Coverage |
| Native Born | 3 (100.0%) | 0 (0.0%) |
| Foreign Born, Citizen | 35 (89.7%) | 4 (10.3%) |
| Foreign Born, not a Citizen | 2 (3.2%) | 61 (96.8%) |
Health Insurance Coverage by Household Income in Walker
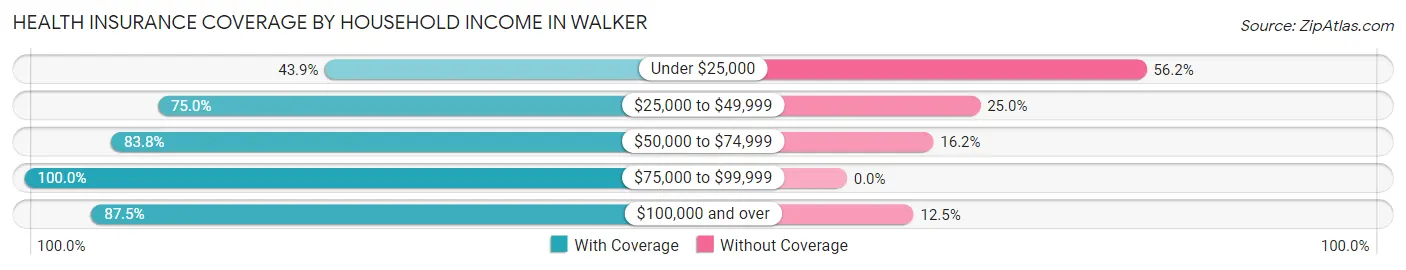
| Household Income | With Coverage | Without Coverage |
| Under $25,000 | 82 (43.9%) | 105 (56.1%) |
| $25,000 to $49,999 | 63 (75.0%) | 21 (25.0%) |
| $50,000 to $74,999 | 31 (83.8%) | 6 (16.2%) |
| $75,000 to $99,999 | 19 (100.0%) | 0 (0.0%) |
| $100,000 and over | 14 (87.5%) | 2 (12.5%) |
Public vs Private Health Insurance Coverage by Age in Walker
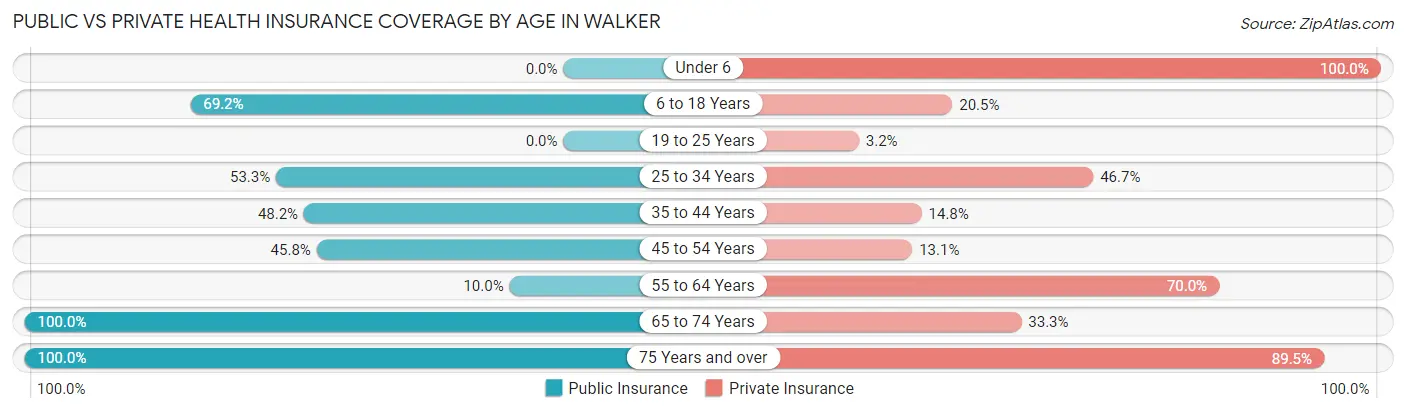
| Age Bracket | Public Insurance | Private Insurance |
| Under 6 | 0 (0.0%) | 3 (100.0%) |
| 6 to 18 Years | 27 (69.2%) | 8 (20.5%) |
| 19 to 25 Years | 0 (0.0%) | 2 (3.2%) |
| 25 to 34 Years | 8 (53.3%) | 7 (46.7%) |
| 35 to 44 Years | 13 (48.1%) | 4 (14.8%) |
| 45 to 54 Years | 49 (45.8%) | 14 (13.1%) |
| 55 to 64 Years | 4 (10.0%) | 28 (70.0%) |
| 65 to 74 Years | 30 (100.0%) | 10 (33.3%) |
| 75 Years and over | 19 (100.0%) | 17 (89.5%) |
| Total | 150 (43.7%) | 93 (27.1%) |
Disability Status by Sex by Age in Walker
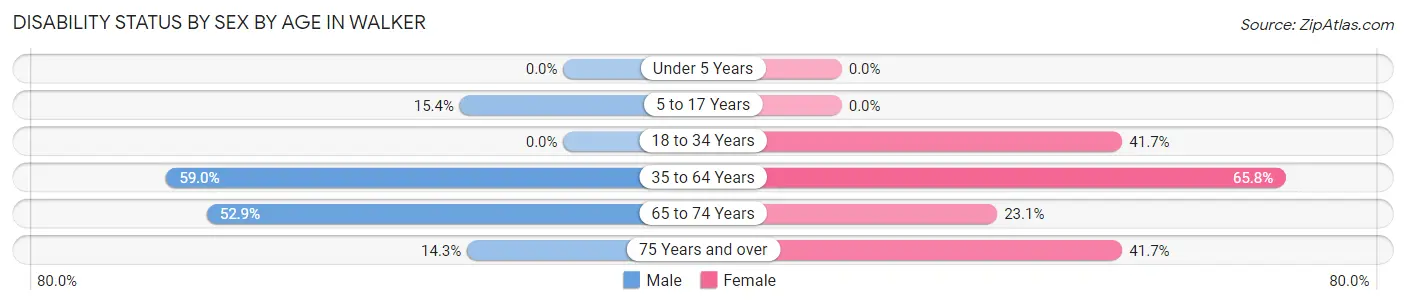
| Age Bracket | Male | Female |
| Under 5 Years | 0 (0.0%) | 0 (0.0%) |
| 5 to 17 Years | 4 (15.4%) | 0 (0.0%) |
| 18 to 34 Years | 0 (0.0%) | 5 (41.7%) |
| 35 to 64 Years | 56 (59.0%) | 52 (65.8%) |
| 65 to 74 Years | 9 (52.9%) | 3 (23.1%) |
| 75 Years and over | 1 (14.3%) | 5 (41.7%) |
Disability Class by Sex by Age in Walker
Disability Class: Hearing Difficulty
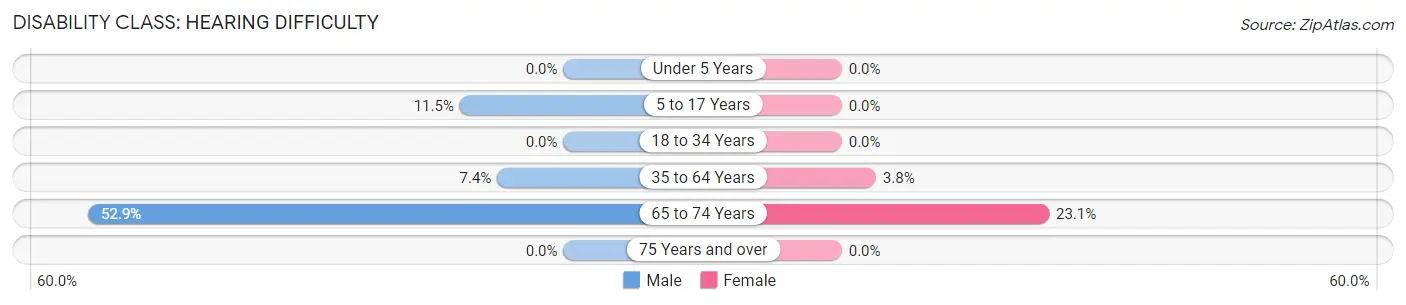
| Age Bracket | Male | Female |
| Under 5 Years | 0 (0.0%) | 0 (0.0%) |
| 5 to 17 Years | 3 (11.5%) | 0 (0.0%) |
| 18 to 34 Years | 0 (0.0%) | 0 (0.0%) |
| 35 to 64 Years | 7 (7.4%) | 3 (3.8%) |
| 65 to 74 Years | 9 (52.9%) | 3 (23.1%) |
| 75 Years and over | 0 (0.0%) | 0 (0.0%) |
Disability Class: Vision Difficulty
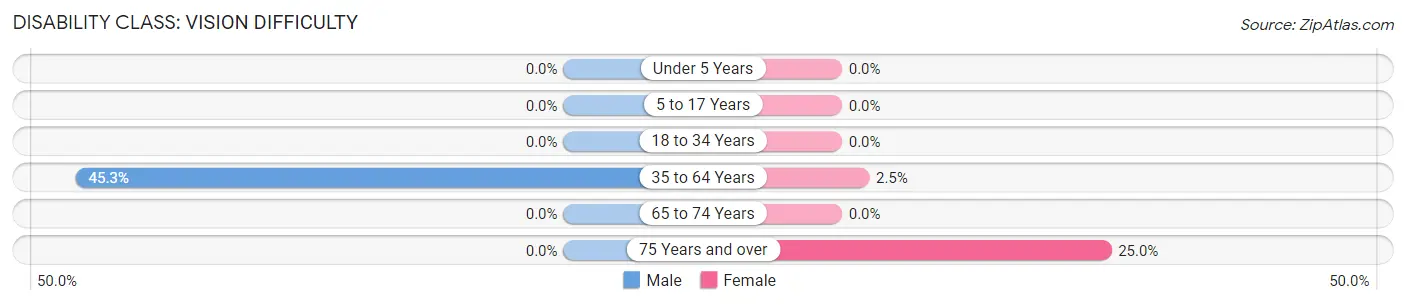
| Age Bracket | Male | Female |
| Under 5 Years | 0 (0.0%) | 0 (0.0%) |
| 5 to 17 Years | 0 (0.0%) | 0 (0.0%) |
| 18 to 34 Years | 0 (0.0%) | 0 (0.0%) |
| 35 to 64 Years | 43 (45.3%) | 2 (2.5%) |
| 65 to 74 Years | 0 (0.0%) | 0 (0.0%) |
| 75 Years and over | 0 (0.0%) | 3 (25.0%) |
Disability Class: Cognitive Difficulty
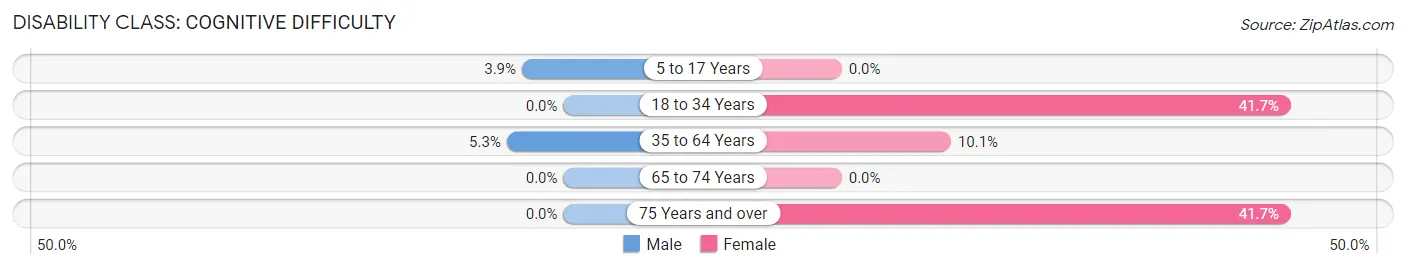
| Age Bracket | Male | Female |
| 5 to 17 Years | 1 (3.8%) | 0 (0.0%) |
| 18 to 34 Years | 0 (0.0%) | 5 (41.7%) |
| 35 to 64 Years | 5 (5.3%) | 8 (10.1%) |
| 65 to 74 Years | 0 (0.0%) | 0 (0.0%) |
| 75 Years and over | 0 (0.0%) | 5 (41.7%) |
Disability Class: Ambulatory Difficulty
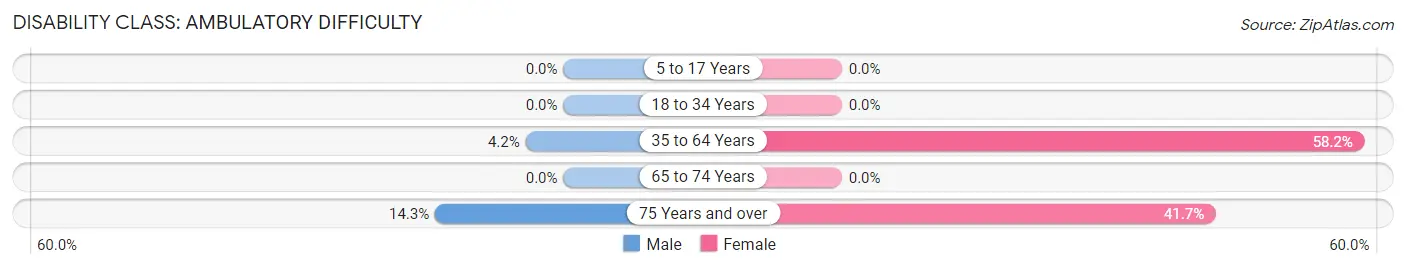
| Age Bracket | Male | Female |
| 5 to 17 Years | 0 (0.0%) | 0 (0.0%) |
| 18 to 34 Years | 0 (0.0%) | 0 (0.0%) |
| 35 to 64 Years | 4 (4.2%) | 46 (58.2%) |
| 65 to 74 Years | 0 (0.0%) | 0 (0.0%) |
| 75 Years and over | 1 (14.3%) | 5 (41.7%) |
Disability Class: Self-Care Difficulty
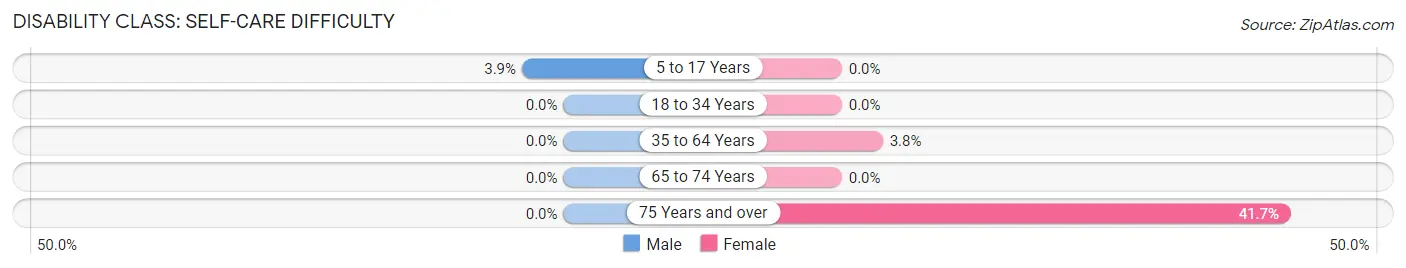
| Age Bracket | Male | Female |
| 5 to 17 Years | 1 (3.8%) | 0 (0.0%) |
| 18 to 34 Years | 0 (0.0%) | 0 (0.0%) |
| 35 to 64 Years | 0 (0.0%) | 3 (3.8%) |
| 65 to 74 Years | 0 (0.0%) | 0 (0.0%) |
| 75 Years and over | 0 (0.0%) | 5 (41.7%) |
Technology Access in Walker
Computing Device Access in Walker
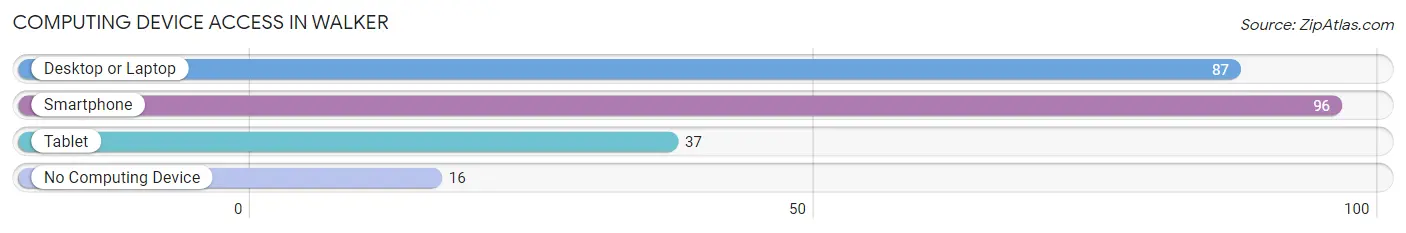
| Device Type | # Households | % Households |
| Desktop or Laptop | 87 | 73.7% |
| Smartphone | 96 | 81.4% |
| Tablet | 37 | 31.4% |
| No Computing Device | 16 | 13.6% |
| Total | 118 | 100.0% |
Internet Access in Walker
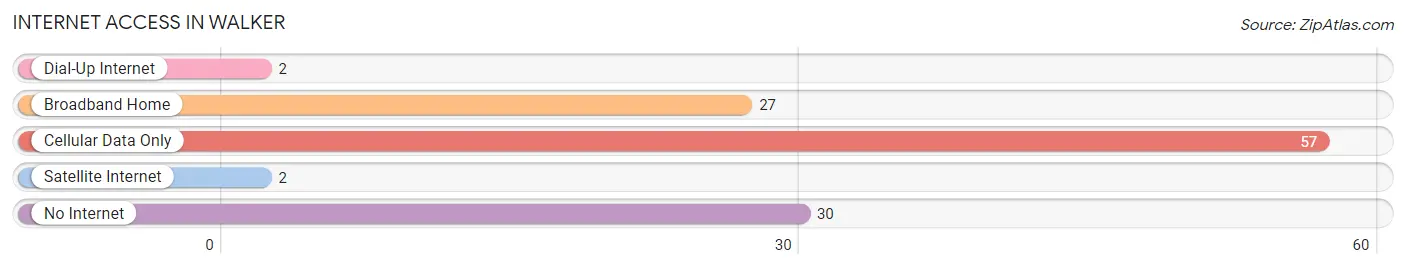
| Internet Type | # Households | % Households |
| Dial-Up Internet | 2 | 1.7% |
| Broadband Home | 27 | 22.9% |
| Cellular Data Only | 57 | 48.3% |
| Satellite Internet | 2 | 1.7% |
| No Internet | 30 | 25.4% |
| Total | 118 | 100.0% |
Walker Summary
Walker is a small city located in the state of Missouri, in the United States of America. It is situated in the southeastern part of the state, in the Ozark Mountains region. The city is located in the county of Taney, and is part of the Branson, Missouri Metropolitan Statistical Area. As of the 2010 census, the population of Walker was 1,845.
History
Walker was founded in 1883 by William Walker, a former Confederate soldier. The city was named after him, and was originally known as Walker’s Station. The city was incorporated in 1887, and was the first city in Taney County to be incorporated.
In the early 1900s, Walker was a thriving community, with a population of over 1,000 people. The city was home to several businesses, including a hotel, a general store, a blacksmith shop, and a sawmill. The city also had a post office, a school, and a church.
In the 1920s, the city began to decline, as many of the businesses closed and the population decreased. The Great Depression further exacerbated the decline, and by the 1940s, the population had dropped to just over 500 people.
In the 1950s, the city began to experience a resurgence, as the population began to increase and new businesses opened. The city was also home to several tourist attractions, including a drive-in movie theater and a miniature golf course.
Geography
Walker is located in the Ozark Mountains region of Missouri. The city is situated in the southeastern part of the state, in Taney County. The city is located at an elevation of 1,072 feet above sea level.
The city is located near several bodies of water, including Table Rock Lake, Bull Shoals Lake, and Lake Taneycomo. The city is also located near several state parks, including Mark Twain State Park, Roaring River State Park, and Table Rock State Park.
Economy
Walker’s economy is largely based on tourism. The city is home to several tourist attractions, including the Silver Dollar City theme park, the Titanic Museum, and the Showboat Branson Belle. The city is also home to several restaurants, hotels, and shops.
The city is also home to several manufacturing companies, including a furniture manufacturer, a plastics manufacturer, and a printing company. The city is also home to several agricultural businesses, including a dairy farm and a poultry farm.
Demographics
As of the 2010 census, the population of Walker was 1,845. The racial makeup of the city was 95.3% White, 0.7% African American, 0.3% Native American, 0.7% Asian, 0.1% Pacific Islander, 0.7% from other races, and 2.1% from two or more races. Hispanic or Latino of any race were 2.2% of the population.
The median household income in Walker was $37,917, and the median family income was $45,625. The per capita income in the city was $20,945. About 11.2% of the population was below the poverty line.
Common Questions
What is Per Capita Income in Walker?
Per Capita income in Walker is $14,479.
What is the Median Family Income in Walker?
Median Family Income in Walker is $24,934.
What is the Median Household income in Walker?
Median Household Income in Walker is $26,250.
What is Income or Wage Gap in Walker?
Income or Wage Gap in Walker is 35.8%.
Women in Walker earn 64.2 cents for every dollar earned by a man.
What is Inequality or Gini Index in Walker?
Inequality or Gini Index in Walker is 0.33.
What is the Total Population of Walker?
Total Population of Walker is 343.
What is the Total Male Population of Walker?
Total Male Population of Walker is 213.
What is the Total Female Population of Walker?
Total Female Population of Walker is 130.
What is the Ratio of Males per 100 Females in Walker?
There are 163.85 Males per 100 Females in Walker.
What is the Ratio of Females per 100 Males in Walker?
There are 61.03 Females per 100 Males in Walker.
What is the Median Population Age in Walker?
Median Population Age in Walker is 49.4 Years.
What is the Average Family Size in Walker
Average Family Size in Walker is 3.6 People.
What is the Average Household Size in Walker
Average Household Size in Walker is 2.9 People.
How Large is the Labor Force in Walker?
There are 115 People in the Labor Forcein in Walker.
What is the Percentage of People in the Labor Force in Walker?
38.2% of People are in the Labor Force in Walker.
What is the Unemployment Rate in Walker?
Unemployment Rate in Walker is 4.3%.