Waco, MO Map & Demographics
Waco Map
Waco Overview
$21,692
PER CAPITA INCOME
$63,750
AVG FAMILY INCOME
$53,833
AVG HOUSEHOLD INCOME
57.4%
WAGE / INCOME GAP [ % ]
42.6¢/ $1
WAGE / INCOME GAP [ $ ]
0.34
INEQUALITY / GINI INDEX
185
TOTAL POPULATION
100
MALE POPULATION
85
FEMALE POPULATION
117.65
MALES / 100 FEMALES
85.00
FEMALES / 100 MALES
46.6
MEDIAN AGE
3.7
AVG FAMILY SIZE
2.8
AVG HOUSEHOLD SIZE
86
LABOR FORCE [ PEOPLE ]
53.1%
PERCENT IN LABOR FORCE
16.3%
UNEMPLOYMENT RATE
Waco Area Codes
Income in Waco
Income Overview in Waco
Per Capita Income in Waco is $21,692, while median incomes of families and households are $63,750 and $53,833 respectively.
| Characteristic | Number | Measure |
| Per Capita Income | 185 | $21,692 |
| Median Family Income | 40 | $63,750 |
| Mean Family Income | 40 | $66,503 |
| Median Household Income | 66 | $53,833 |
| Mean Household Income | 66 | $55,732 |
| Income Deficit | 40 | $0 |
| Wage / Income Gap (%) | 185 | 57.42% |
| Wage / Income Gap ($) | 185 | 42.58¢ per $1 |
| Gini / Inequality Index | 185 | 0.34 |
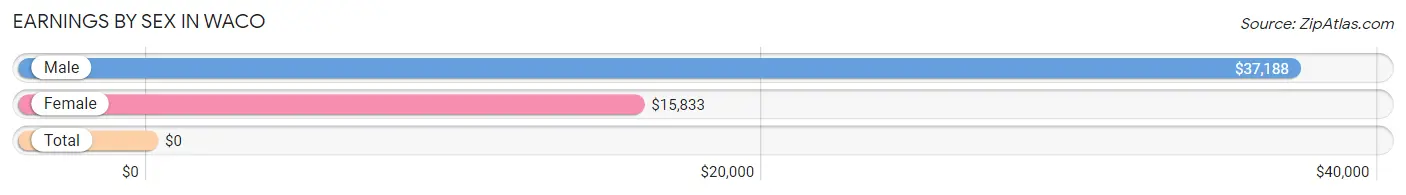
Earnings by Sex in Waco
| Sex | Number | Average Earnings |
| Male | 74 (68.5%) | $37,188 |
| Female | 34 (31.5%) | $15,833 |
| Total | 108 (100.0%) | $0 |
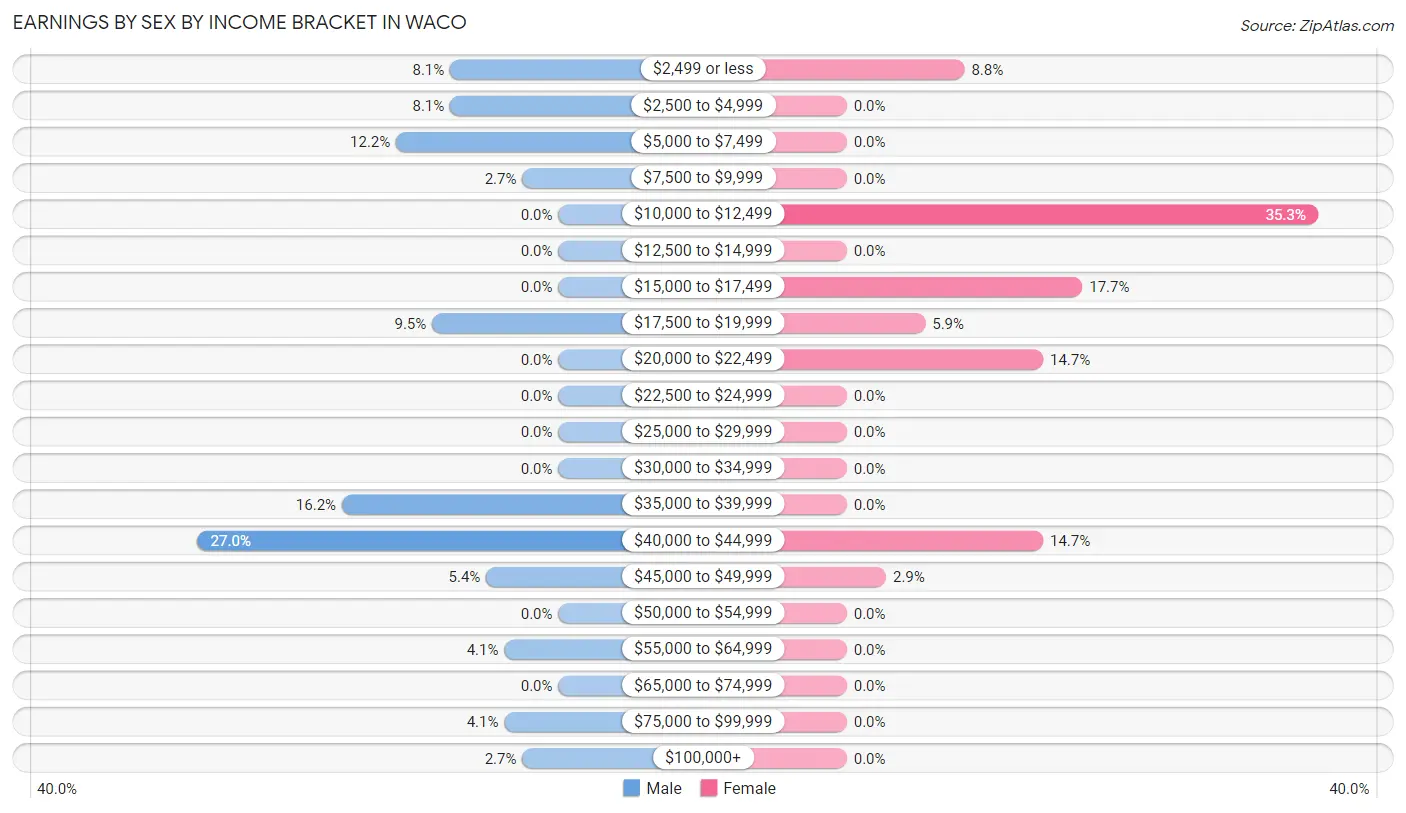
Earnings by Sex by Income Bracket in Waco
The most common earnings brackets in Waco are $40,000 to $44,999 for men (20 | 27.0%) and $10,000 to $12,499 for women (12 | 35.3%).
| Income | Male | Female |
| $2,499 or less | 6 (8.1%) | 3 (8.8%) |
| $2,500 to $4,999 | 6 (8.1%) | 0 (0.0%) |
| $5,000 to $7,499 | 9 (12.2%) | 0 (0.0%) |
| $7,500 to $9,999 | 2 (2.7%) | 0 (0.0%) |
| $10,000 to $12,499 | 0 (0.0%) | 12 (35.3%) |
| $12,500 to $14,999 | 0 (0.0%) | 0 (0.0%) |
| $15,000 to $17,499 | 0 (0.0%) | 6 (17.6%) |
| $17,500 to $19,999 | 7 (9.5%) | 2 (5.9%) |
| $20,000 to $22,499 | 0 (0.0%) | 5 (14.7%) |
| $22,500 to $24,999 | 0 (0.0%) | 0 (0.0%) |
| $25,000 to $29,999 | 0 (0.0%) | 0 (0.0%) |
| $30,000 to $34,999 | 0 (0.0%) | 0 (0.0%) |
| $35,000 to $39,999 | 12 (16.2%) | 0 (0.0%) |
| $40,000 to $44,999 | 20 (27.0%) | 5 (14.7%) |
| $45,000 to $49,999 | 4 (5.4%) | 1 (2.9%) |
| $50,000 to $54,999 | 0 (0.0%) | 0 (0.0%) |
| $55,000 to $64,999 | 3 (4.1%) | 0 (0.0%) |
| $65,000 to $74,999 | 0 (0.0%) | 0 (0.0%) |
| $75,000 to $99,999 | 3 (4.1%) | 0 (0.0%) |
| $100,000+ | 2 (2.7%) | 0 (0.0%) |
| Total | 74 (100.0%) | 34 (100.0%) |
Earnings by Sex by Educational Attainment in Waco

| Educational Attainment | Male Income | Female Income |
| Less than High School | - | - |
| High School Diploma | $35,469 | $11,250 |
| College or Associate's Degree | - | - |
| Bachelor's Degree | - | - |
| Graduate Degree | - | - |
| Total | $40,089 | $0 |
Family Income in Waco
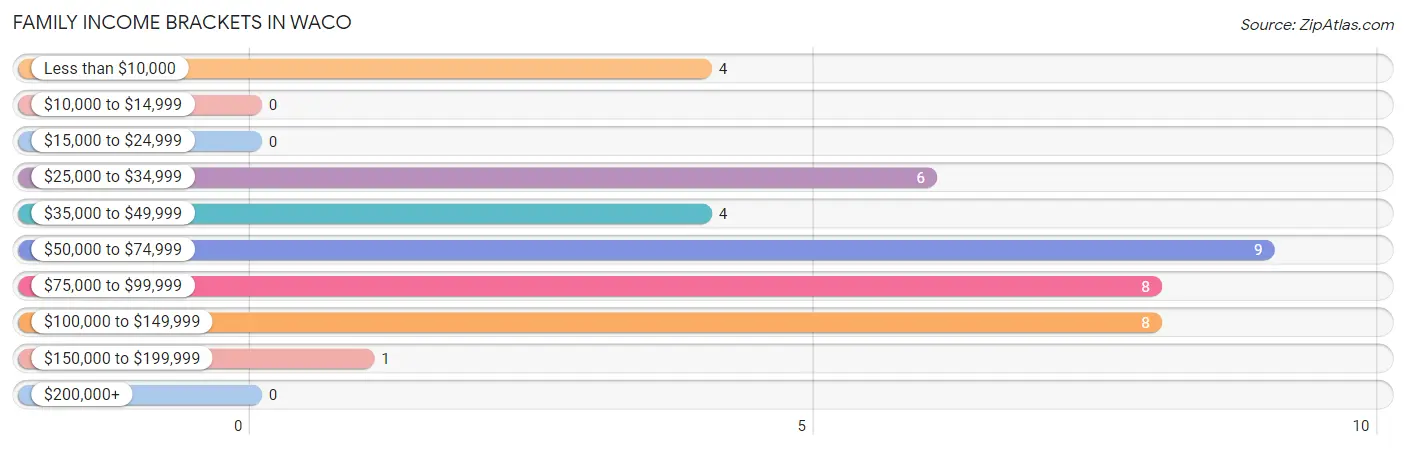
Family Income Brackets in Waco
According to the Waco family income data, there are 9 families falling into the $50,000 to $74,999 income range, which is the most common income bracket and makes up 22.5% of all families.
| Income Bracket | # Families | % Families |
| Less than $10,000 | 4 | 10.0% |
| $10,000 to $14,999 | 0 | 0.0% |
| $15,000 to $24,999 | 0 | 0.0% |
| $25,000 to $34,999 | 6 | 15.0% |
| $35,000 to $49,999 | 4 | 10.0% |
| $50,000 to $74,999 | 9 | 22.5% |
| $75,000 to $99,999 | 8 | 20.0% |
| $100,000 to $149,999 | 8 | 20.0% |
| $150,000 to $199,999 | 1 | 2.5% |
| $200,000+ | 0 | 0.0% |
Family Income by Famaliy Size in Waco
2-person families (18 | 45.0%) account for the highest median family income in Waco with $60,833 per family, while 2-person families (18 | 45.0%) have the highest median income of $30,416 per family member.
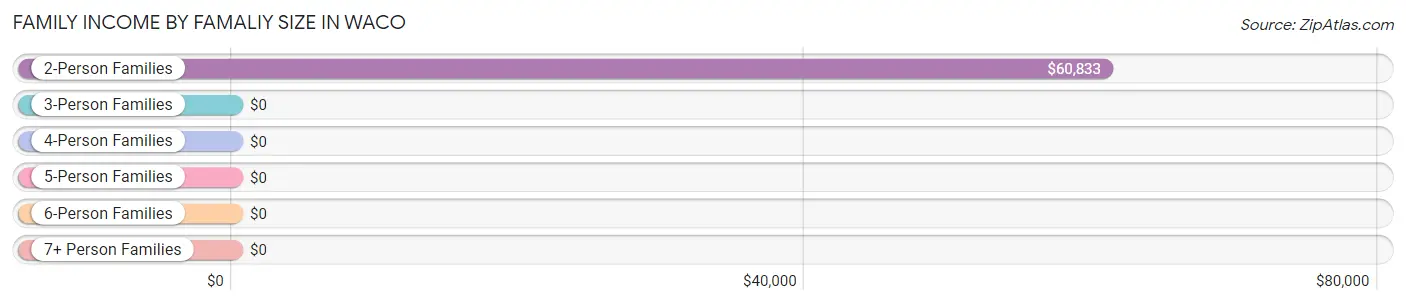
| Income Bracket | # Families | Median Income |
| 2-Person Families | 18 (45.0%) | $60,833 |
| 3-Person Families | 5 (12.5%) | $0 |
| 4-Person Families | 7 (17.5%) | $0 |
| 5-Person Families | 3 (7.5%) | $0 |
| 6-Person Families | 7 (17.5%) | $0 |
| 7+ Person Families | 0 (0.0%) | $0 |
| Total | 40 (100.0%) | $63,750 |
Family Income by Number of Earners in Waco
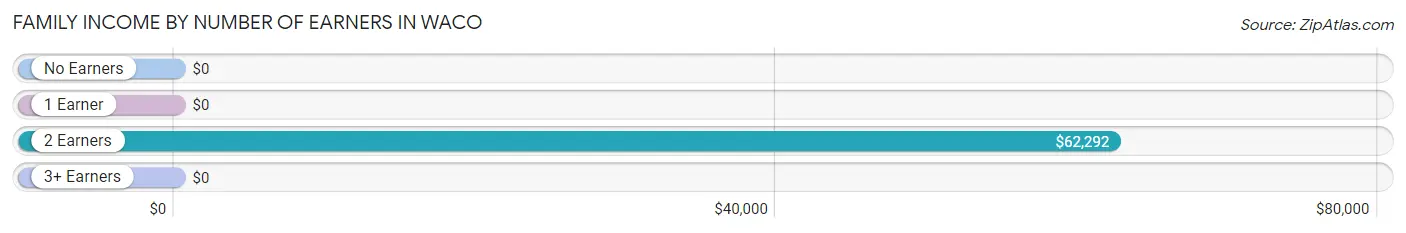
| Number of Earners | # Families | Median Income |
| No Earners | 3 (7.5%) | $0 |
| 1 Earner | 9 (22.5%) | $0 |
| 2 Earners | 17 (42.5%) | $62,292 |
| 3+ Earners | 11 (27.5%) | $0 |
| Total | 40 (100.0%) | $63,750 |
Household Income in Waco
Household Income Brackets in Waco
With 24 households falling in the category, the $50,000 to $74,999 income range is the most frequent in Waco, accounting for 36.4% of all households.
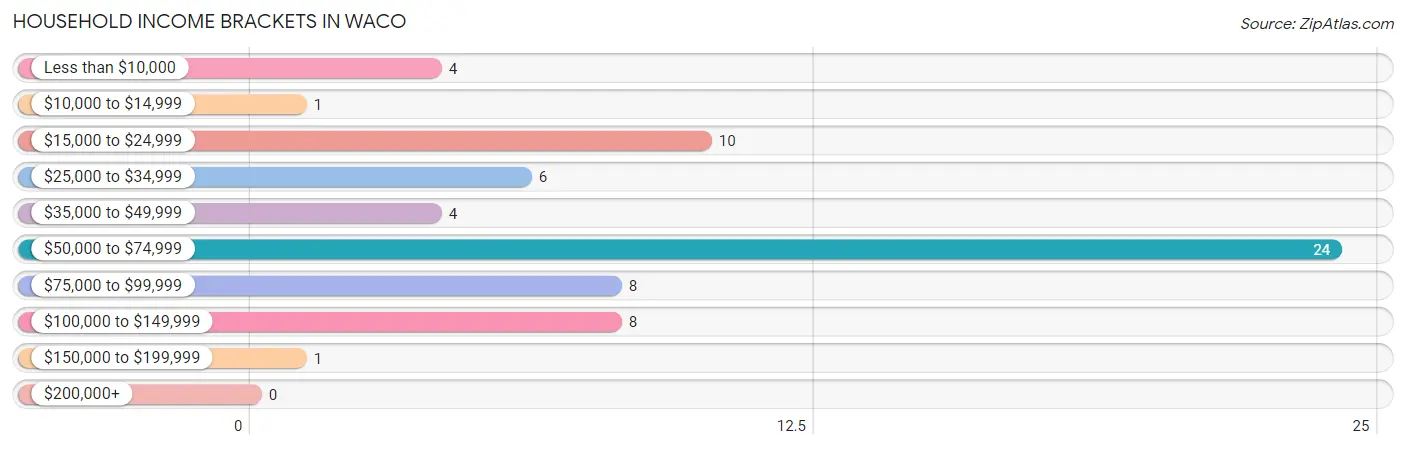
| Income Bracket | # Households | % Households |
| Less than $10,000 | 4 | 6.1% |
| $10,000 to $14,999 | 1 | 1.5% |
| $15,000 to $24,999 | 10 | 15.2% |
| $25,000 to $34,999 | 6 | 9.1% |
| $35,000 to $49,999 | 4 | 6.1% |
| $50,000 to $74,999 | 24 | 36.4% |
| $75,000 to $99,999 | 8 | 12.1% |
| $100,000 to $149,999 | 8 | 12.1% |
| $150,000 to $199,999 | 1 | 1.5% |
| $200,000+ | 0 | 0.0% |
Household Income by Householder Age in Waco
The median household income in Waco is $53,833, with the highest median household income of $54,917 found in the 45 to 64 years age bracket for the primary householder. A total of 43 households (65.1%) fall into this category.
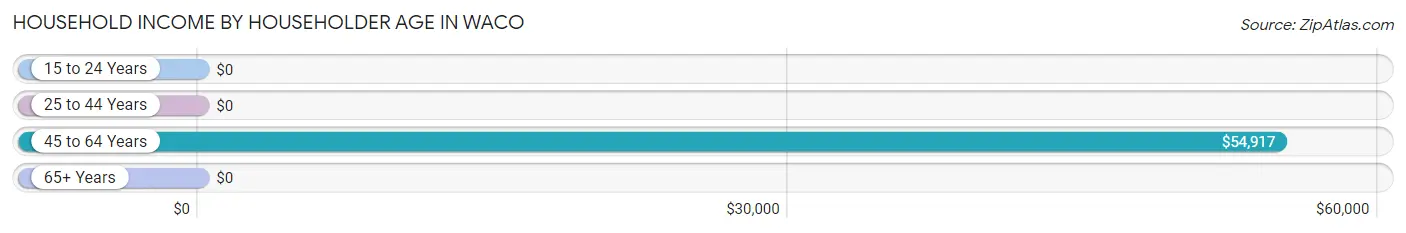
| Income Bracket | # Households | Median Income |
| 15 to 24 Years | 0 (0.0%) | $0 |
| 25 to 44 Years | 17 (25.8%) | $0 |
| 45 to 64 Years | 43 (65.1%) | $54,917 |
| 65+ Years | 6 (9.1%) | $0 |
| Total | 66 (100.0%) | $53,833 |
Poverty in Waco
Income Below Poverty by Sex and Age in Waco
With 8.0% poverty level for males and 27.1% for females among the residents of Waco, 16 and 17 year old males and 16 and 17 year old females are the most vulnerable to poverty, with 4 males (100.0%) and 7 females (100.0%) in their respective age groups living below the poverty level.
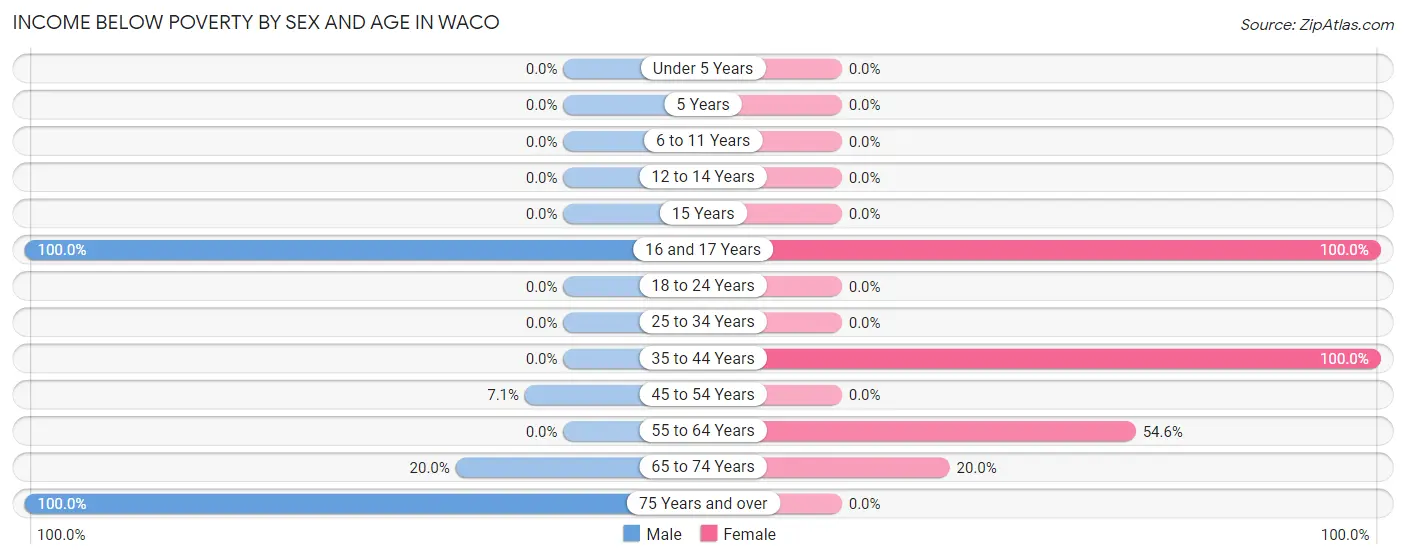
| Age Bracket | Male | Female |
| Under 5 Years | 0 (0.0%) | 0 (0.0%) |
| 5 Years | 0 (0.0%) | 0 (0.0%) |
| 6 to 11 Years | 0 (0.0%) | 0 (0.0%) |
| 12 to 14 Years | 0 (0.0%) | 0 (0.0%) |
| 15 Years | 0 (0.0%) | 0 (0.0%) |
| 16 and 17 Years | 4 (100.0%) | 7 (100.0%) |
| 18 to 24 Years | 0 (0.0%) | 0 (0.0%) |
| 25 to 34 Years | 0 (0.0%) | 0 (0.0%) |
| 35 to 44 Years | 0 (0.0%) | 3 (100.0%) |
| 45 to 54 Years | 2 (7.1%) | 0 (0.0%) |
| 55 to 64 Years | 0 (0.0%) | 12 (54.5%) |
| 65 to 74 Years | 1 (20.0%) | 1 (20.0%) |
| 75 Years and over | 1 (100.0%) | 0 (0.0%) |
| Total | 8 (8.0%) | 23 (27.1%) |
Income Above Poverty by Sex and Age in Waco
According to the poverty statistics in Waco, males aged under 5 years and females aged under 5 years are the age groups that are most secure financially, with 100.0% of males and 100.0% of females in these age groups living above the poverty line.
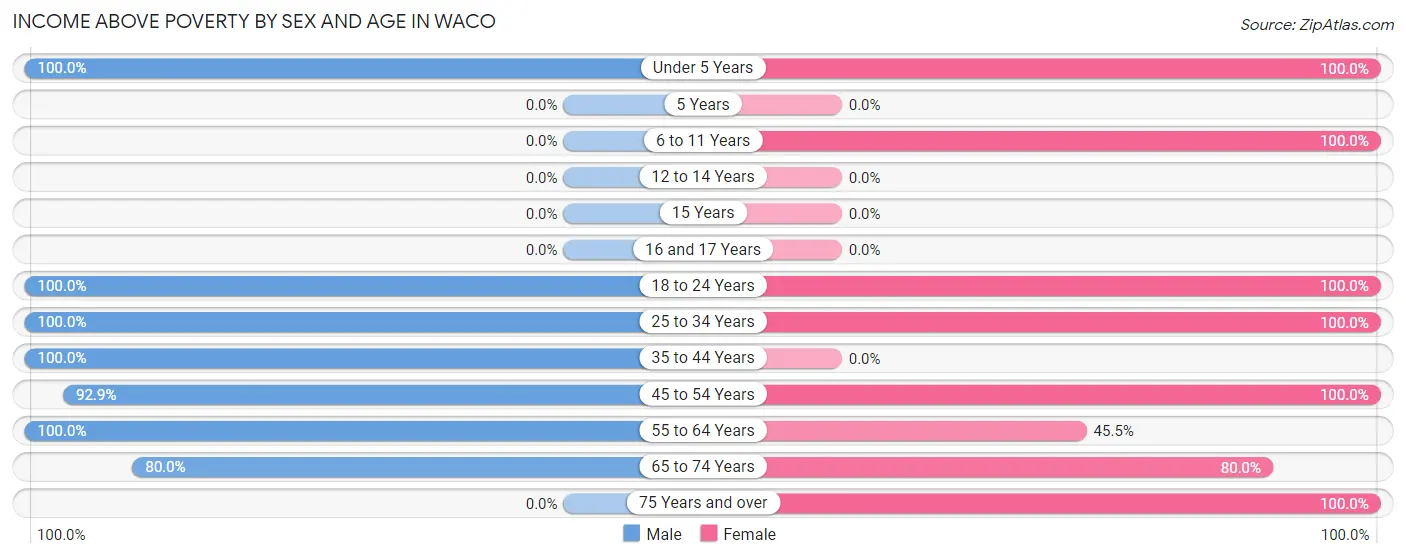
| Age Bracket | Male | Female |
| Under 5 Years | 3 (100.0%) | 12 (100.0%) |
| 5 Years | 0 (0.0%) | 0 (0.0%) |
| 6 to 11 Years | 0 (0.0%) | 8 (100.0%) |
| 12 to 14 Years | 0 (0.0%) | 0 (0.0%) |
| 15 Years | 0 (0.0%) | 0 (0.0%) |
| 16 and 17 Years | 0 (0.0%) | 0 (0.0%) |
| 18 to 24 Years | 7 (100.0%) | 10 (100.0%) |
| 25 to 34 Years | 18 (100.0%) | 7 (100.0%) |
| 35 to 44 Years | 6 (100.0%) | 0 (0.0%) |
| 45 to 54 Years | 26 (92.9%) | 10 (100.0%) |
| 55 to 64 Years | 28 (100.0%) | 10 (45.5%) |
| 65 to 74 Years | 4 (80.0%) | 4 (80.0%) |
| 75 Years and over | 0 (0.0%) | 1 (100.0%) |
| Total | 92 (92.0%) | 62 (72.9%) |
Income Below Poverty Among Married-Couple Families in Waco
The poverty statistics for married-couple families in Waco show that 11.8% or 4 of the total 34 families live below the poverty line. Families with 1 or 2 children have the highest poverty rate of 21.4%, comprising of 3 families. On the other hand, families with 3 or 4 children have the lowest poverty rate of 0.0%, which includes 0 families.
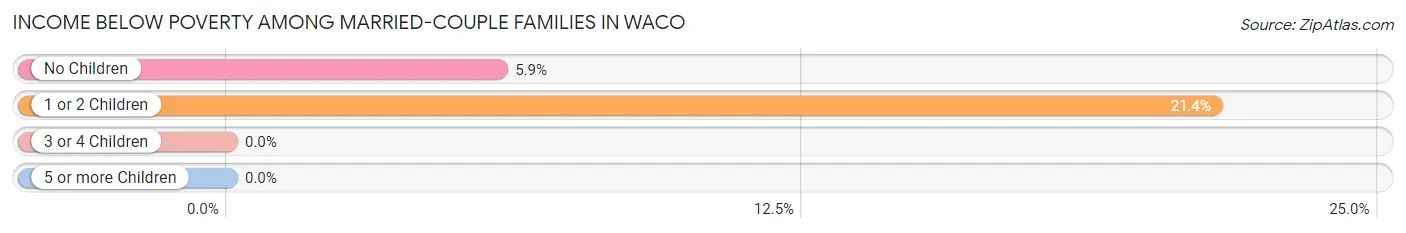
| Children | Above Poverty | Below Poverty |
| No Children | 16 (94.1%) | 1 (5.9%) |
| 1 or 2 Children | 11 (78.6%) | 3 (21.4%) |
| 3 or 4 Children | 3 (100.0%) | 0 (0.0%) |
| 5 or more Children | 0 (0.0%) | 0 (0.0%) |
| Total | 30 (88.2%) | 4 (11.8%) |
Income Below Poverty Among Single-Parent Households in Waco
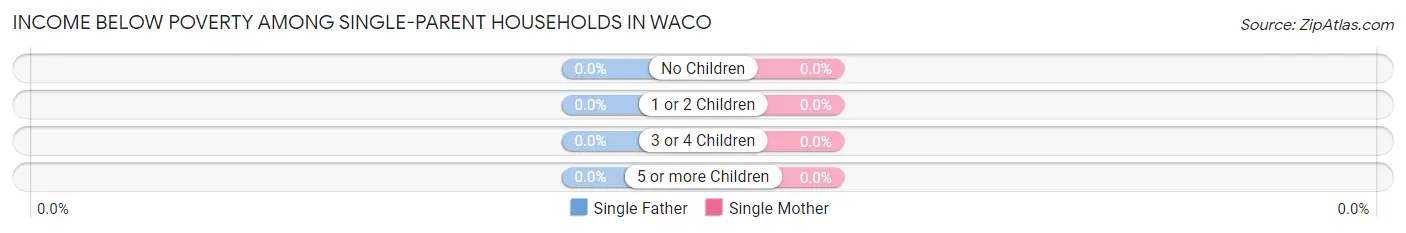
| Children | Single Father | Single Mother |
| No Children | 0 (0.0%) | 0 (0.0%) |
| 1 or 2 Children | 0 (0.0%) | 0 (0.0%) |
| 3 or 4 Children | 0 (0.0%) | 0 (0.0%) |
| 5 or more Children | 0 (0.0%) | 0 (0.0%) |
| Total | 0 (0.0%) | 0 (0.0%) |
Income Below Poverty Among Married-Couple vs Single-Parent Households in Waco
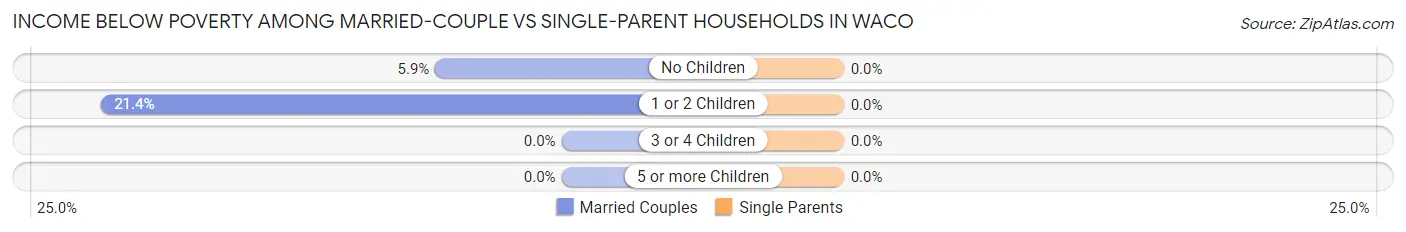
| Children | Married-Couple Families | Single-Parent Households |
| No Children | 1 (5.9%) | 0 (0.0%) |
| 1 or 2 Children | 3 (21.4%) | 0 (0.0%) |
| 3 or 4 Children | 0 (0.0%) | 0 (0.0%) |
| 5 or more Children | 0 (0.0%) | 0 (0.0%) |
| Total | 4 (11.8%) | 0 (0.0%) |
Race in Waco
The most populous races in Waco are , and White / Caucasian (185 | 100.0%).
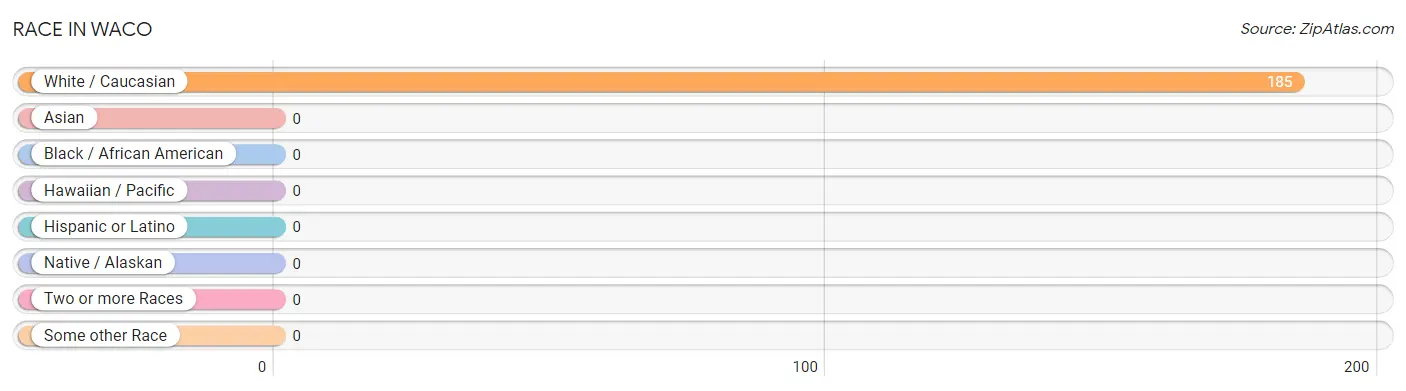
| Race | # Population | % Population |
| Asian | 0 | 0.0% |
| Black / African American | 0 | 0.0% |
| Hawaiian / Pacific | 0 | 0.0% |
| Hispanic or Latino | 0 | 0.0% |
| Native / Alaskan | 0 | 0.0% |
| White / Caucasian | 185 | 100.0% |
| Two or more Races | 0 | 0.0% |
| Some other Race | 0 | 0.0% |
| Total | 185 | 100.0% |
Ancestry in Waco
The most populous ancestries reported in Waco are German (38 | 20.5%), Irish (19 | 10.3%), English (15 | 8.1%), British (4 | 2.2%), and American (1 | 0.5%), together accounting for 41.6% of all Waco residents.
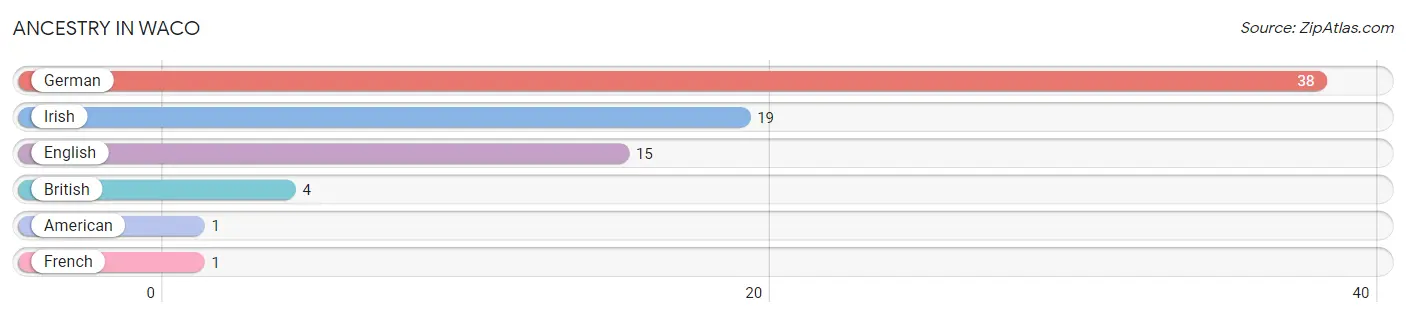
| Ancestry | # Population | % Population |
| American | 1 | 0.5% |
| British | 4 | 2.2% |
| English | 15 | 8.1% |
| French | 1 | 0.5% |
| German | 38 | 20.5% |
| Irish | 19 | 10.3% | View All 6 Rows |
Immigrants in Waco
The most numerous immigrant groups reported in Waco came from Europe (3 | 1.6%), Germany (3 | 1.6%), and Western Europe (3 | 1.6%), together accounting for 4.9% of all Waco residents.
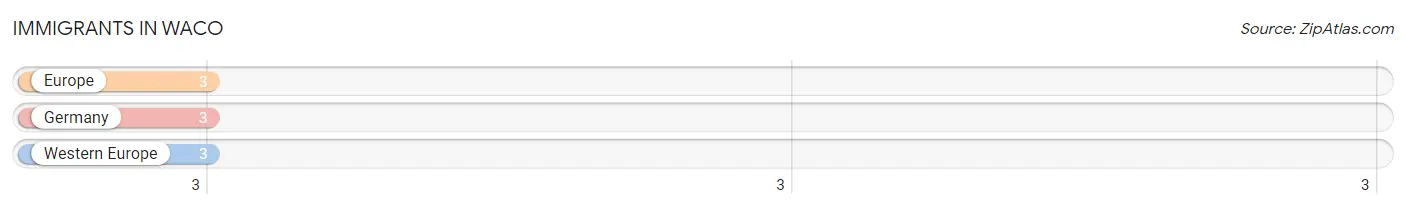
| Immigration Origin | # Population | % Population |
| Europe | 3 | 1.6% |
| Germany | 3 | 1.6% |
| Western Europe | 3 | 1.6% | View All 3 Rows |
Sex and Age in Waco
Sex and Age in Waco
The most populous age groups in Waco are 45 to 49 Years (28 | 28.0%) for men and 60 to 64 Years (18 | 21.2%) for women.
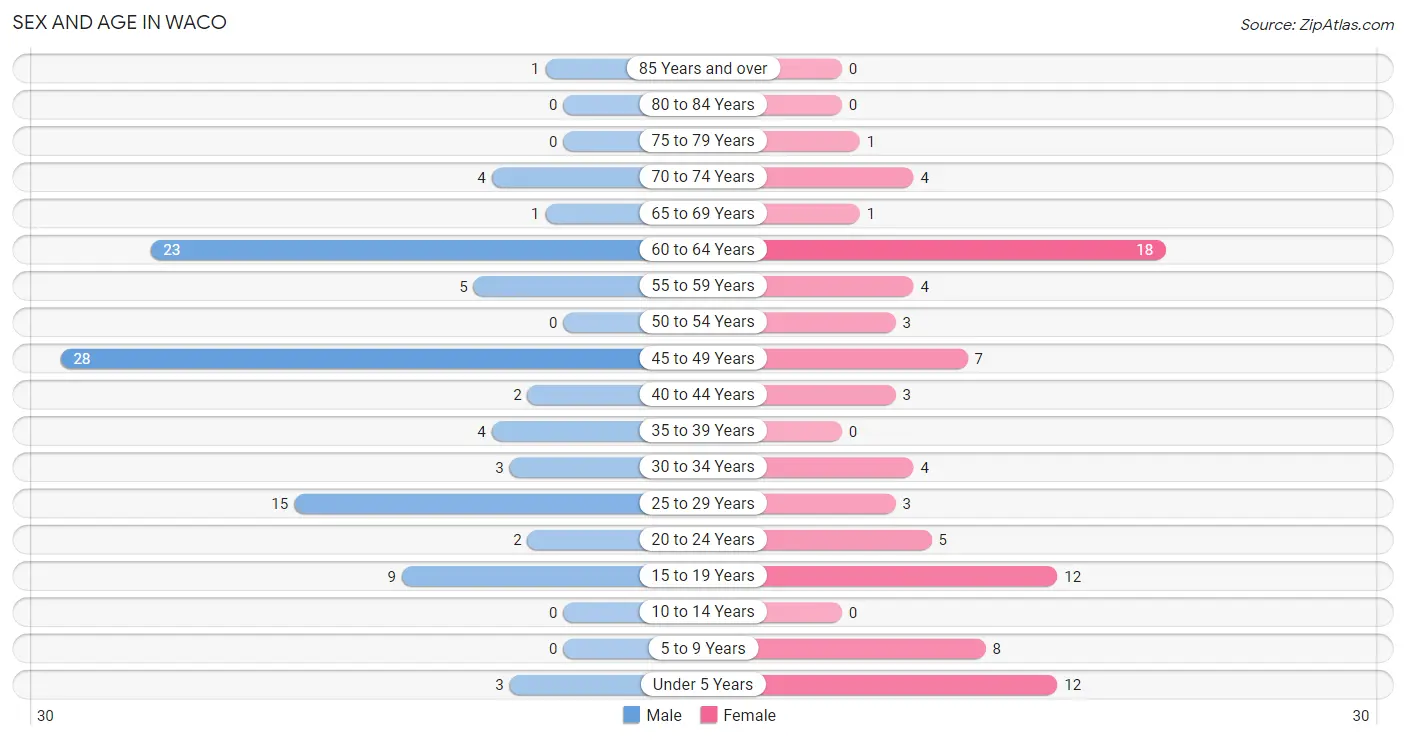
| Age Bracket | Male | Female |
| Under 5 Years | 3 (3.0%) | 12 (14.1%) |
| 5 to 9 Years | 0 (0.0%) | 8 (9.4%) |
| 10 to 14 Years | 0 (0.0%) | 0 (0.0%) |
| 15 to 19 Years | 9 (9.0%) | 12 (14.1%) |
| 20 to 24 Years | 2 (2.0%) | 5 (5.9%) |
| 25 to 29 Years | 15 (15.0%) | 3 (3.5%) |
| 30 to 34 Years | 3 (3.0%) | 4 (4.7%) |
| 35 to 39 Years | 4 (4.0%) | 0 (0.0%) |
| 40 to 44 Years | 2 (2.0%) | 3 (3.5%) |
| 45 to 49 Years | 28 (28.0%) | 7 (8.2%) |
| 50 to 54 Years | 0 (0.0%) | 3 (3.5%) |
| 55 to 59 Years | 5 (5.0%) | 4 (4.7%) |
| 60 to 64 Years | 23 (23.0%) | 18 (21.2%) |
| 65 to 69 Years | 1 (1.0%) | 1 (1.2%) |
| 70 to 74 Years | 4 (4.0%) | 4 (4.7%) |
| 75 to 79 Years | 0 (0.0%) | 1 (1.2%) |
| 80 to 84 Years | 0 (0.0%) | 0 (0.0%) |
| 85 Years and over | 1 (1.0%) | 0 (0.0%) |
| Total | 100 (100.0%) | 85 (100.0%) |
Families and Households in Waco
Median Family Size in Waco
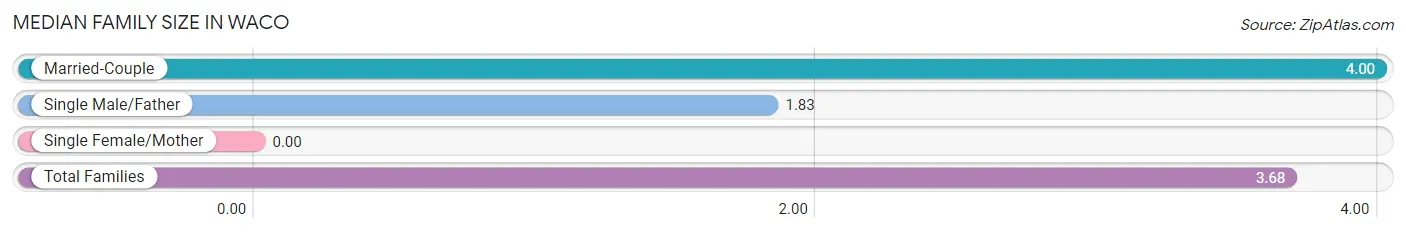
| Family Type | # Families | Family Size |
| Married-Couple | 34 (85.0%) | 4.00 |
| Single Male/Father | 6 (15.0%) | 1.83 |
| Single Female/Mother | 0 (0.0%) | - |
| Total Families | 40 (100.0%) | 3.68 |
Median Household Size in Waco
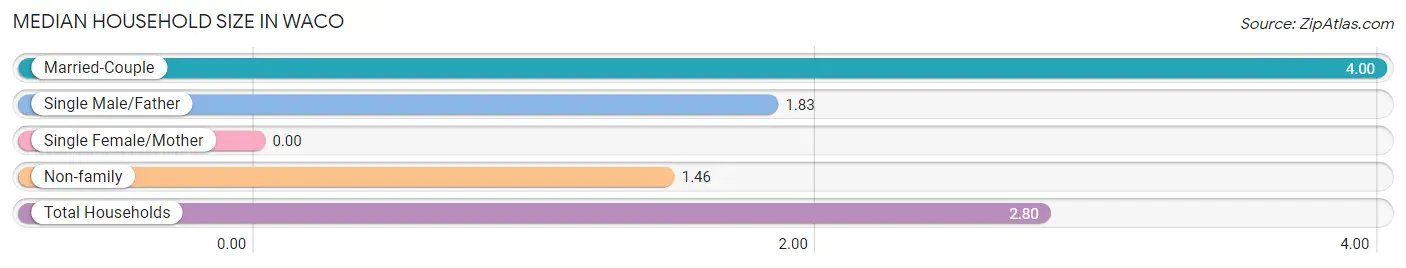
| Household Type | # Households | Household Size |
| Married-Couple | 34 (51.5%) | 4.00 |
| Single Male/Father | 6 (9.1%) | 1.83 |
| Single Female/Mother | 0 (0.0%) | - |
| Non-family | 26 (39.4%) | 1.46 |
| Total Households | 66 (100.0%) | 2.80 |
Household Size by Marriage Status in Waco
Out of a total of 66 households in Waco, 40 (60.6%) are family households, while 26 (39.4%) are nonfamily households. The most numerous type of family households are 2-person households, comprising 18, and the most common type of nonfamily households are 2-person households, comprising 15.
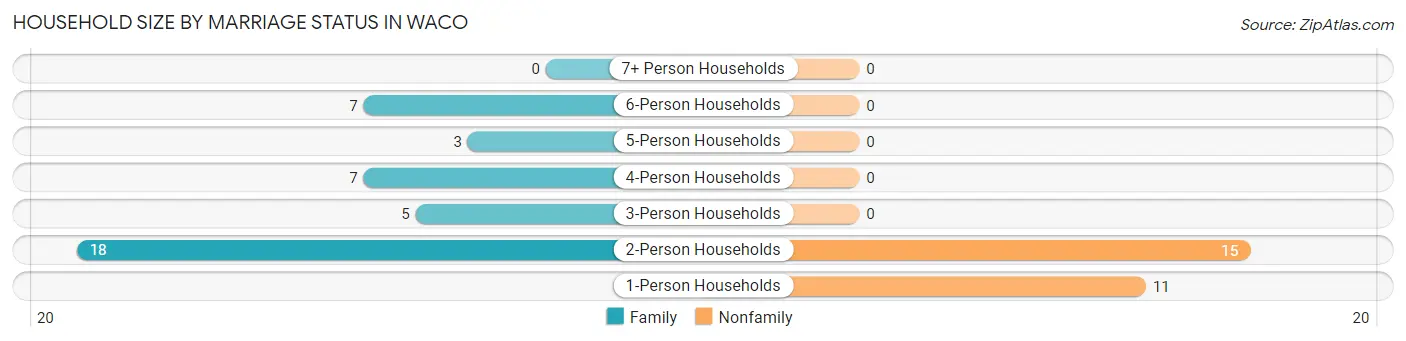
| Household Size | Family Households | Nonfamily Households |
| 1-Person Households | - | 11 (16.7%) |
| 2-Person Households | 18 (27.3%) | 15 (22.7%) |
| 3-Person Households | 5 (7.6%) | 0 (0.0%) |
| 4-Person Households | 7 (10.6%) | 0 (0.0%) |
| 5-Person Households | 3 (4.5%) | 0 (0.0%) |
| 6-Person Households | 7 (10.6%) | 0 (0.0%) |
| 7+ Person Households | 0 (0.0%) | 0 (0.0%) |
| Total | 40 (60.6%) | 26 (39.4%) |
Female Fertility in Waco
Fertility by Age in Waco
| Age Bracket | Women with Births | Births / 1,000 Women |
| 15 to 19 years | 0 (0.0%) | 0.0 |
| 20 to 34 years | 0 (0.0%) | 0.0 |
| 35 to 50 years | 0 (0.0%) | 0.0 |
| Total | 0 (0.0%) | 0.0 |
Fertility by Age by Marriage Status in Waco
| Age Bracket | Married | Unmarried |
| 15 to 19 years | 0 (0.0%) | 0 (0.0%) |
| 20 to 34 years | 0 (0.0%) | 0 (0.0%) |
| 35 to 50 years | 0 (0.0%) | 0 (0.0%) |
| Total | 0 (0.0%) | 0 (0.0%) |
Fertility by Education in Waco
| Educational Attainment | Women with Births | Births / 1,000 Women |
| Less than High School | 0 (0.0%) | 0.0 |
| High School Diploma | 0 (0.0%) | 0.0 |
| College or Associate's Degree | 0 (0.0%) | 0.0 |
| Bachelor's Degree | 0 (0.0%) | 0.0 |
| Graduate Degree | 0 (0.0%) | 0.0 |
| Total | 0 (0.0%) | 0.0 |
Fertility by Education by Marriage Status in Waco
| Educational Attainment | Married | Unmarried |
| Less than High School | 0 (0.0%) | 0 (0.0%) |
| High School Diploma | 0 (0.0%) | 0 (0.0%) |
| College or Associate's Degree | 0 (0.0%) | 0 (0.0%) |
| Bachelor's Degree | 0 (0.0%) | 0 (0.0%) |
| Graduate Degree | 0 (0.0%) | 0 (0.0%) |
| Total | 0 (0.0%) | 0 (0.0%) |
Employment Characteristics in Waco
Employment by Class of Employer in Waco
Among the 72 employed individuals in Waco, private company employees (57 | 79.2%), local government employees (7 | 9.7%), and self-employed (not incorporated) (6 | 8.3%) make up the most common classes of employment.
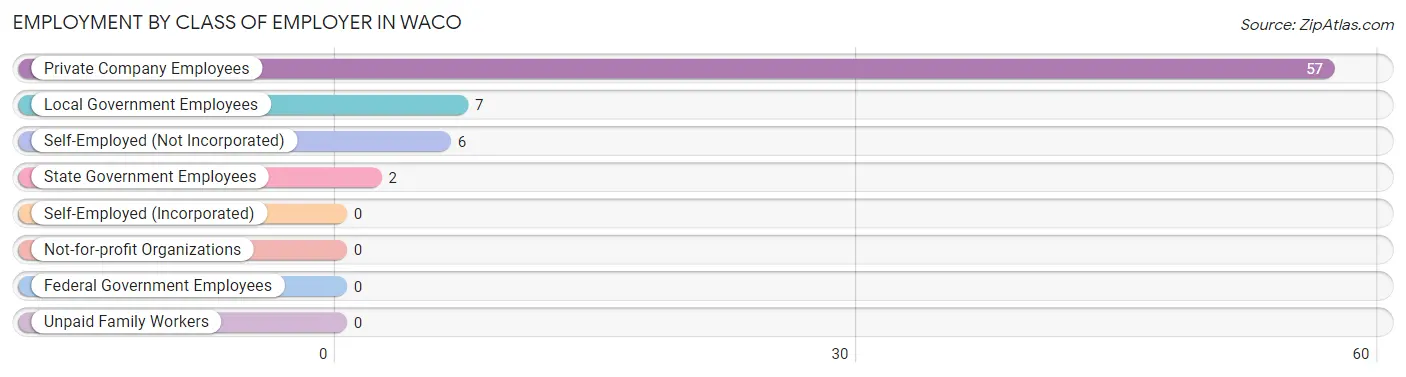
| Employer Class | # Employees | % Employees |
| Private Company Employees | 57 | 79.2% |
| Self-Employed (Incorporated) | 0 | 0.0% |
| Self-Employed (Not Incorporated) | 6 | 8.3% |
| Not-for-profit Organizations | 0 | 0.0% |
| Local Government Employees | 7 | 9.7% |
| State Government Employees | 2 | 2.8% |
| Federal Government Employees | 0 | 0.0% |
| Unpaid Family Workers | 0 | 0.0% |
| Total | 72 | 100.0% |
Employment Status by Age in Waco
According to the labor force statistics for Waco, out of the total population over 16 years of age (162), 53.1% or 86 individuals are in the labor force, with 16.3% or 14 of them unemployed. The age group with the highest labor force participation rate is 25 to 29 years, with 100.0% or 18 individuals in the labor force. Within the labor force, the 45 to 54 years age range has the highest percentage of unemployed individuals, with 45.2% or 14 of them being unemployed.
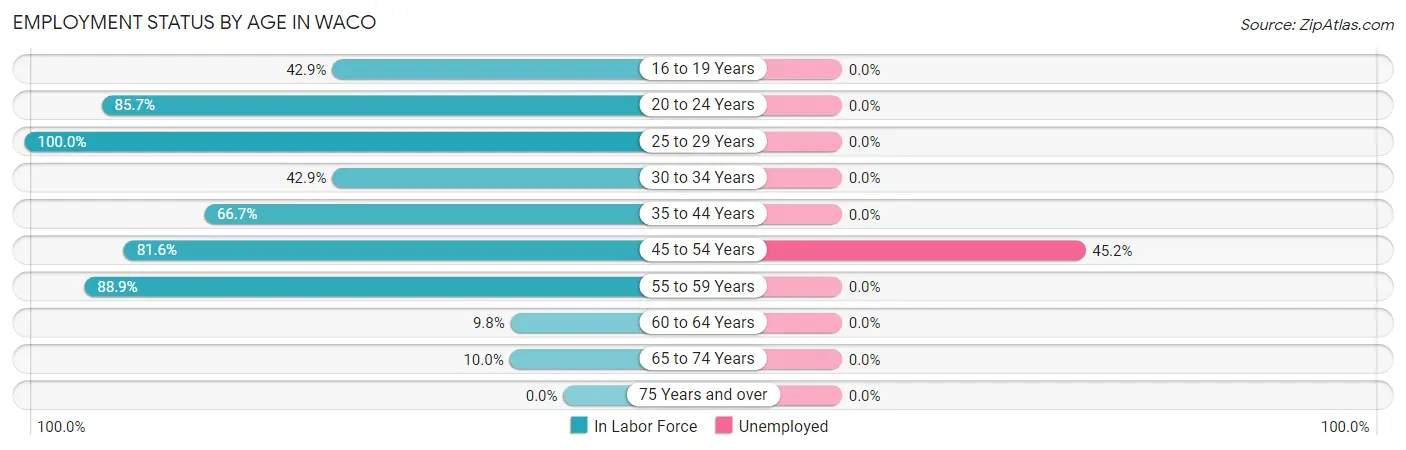
| Age Bracket | In Labor Force | Unemployed |
| 16 to 19 Years | 9 (42.9%) | 0 (0.0%) |
| 20 to 24 Years | 6 (85.7%) | 0 (0.0%) |
| 25 to 29 Years | 18 (100.0%) | 0 (0.0%) |
| 30 to 34 Years | 3 (42.9%) | 0 (0.0%) |
| 35 to 44 Years | 6 (66.7%) | 0 (0.0%) |
| 45 to 54 Years | 31 (81.6%) | 14 (45.2%) |
| 55 to 59 Years | 8 (88.9%) | 0 (0.0%) |
| 60 to 64 Years | 4 (9.8%) | 0 (0.0%) |
| 65 to 74 Years | 1 (10.0%) | 0 (0.0%) |
| 75 Years and over | 0 (0.0%) | 0 (0.0%) |
| Total | 86 (53.1%) | 14 (16.3%) |
Employment Status by Educational Attainment in Waco
According to labor force statistics for Waco, 57.4% of individuals (70) out of the total population between 25 and 64 years of age (122) are in the labor force, with 20.0% or 14 of them being unemployed. The group with the highest labor force participation rate are those with the educational attainment of bachelor's degree or higher, with 91.7% or 11 individuals in the labor force. Within the labor force, individuals with less than high school education have the highest percentage of unemployment, with 63.6% or 14 of them being unemployed.
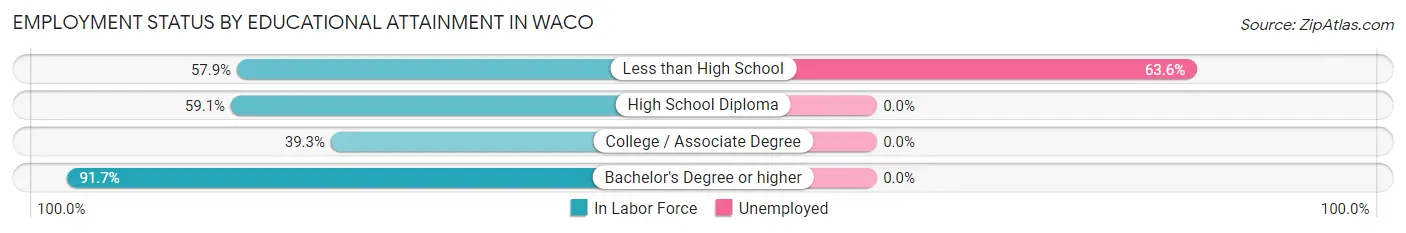
| Educational Attainment | In Labor Force | Unemployed |
| Less than High School | 22 (57.9%) | 24 (63.6%) |
| High School Diploma | 26 (59.1%) | 0 (0.0%) |
| College / Associate Degree | 11 (39.3%) | 0 (0.0%) |
| Bachelor's Degree or higher | 11 (91.7%) | 0 (0.0%) |
| Total | 70 (57.4%) | 24 (20.0%) |
Employment Occupations by Sex in Waco
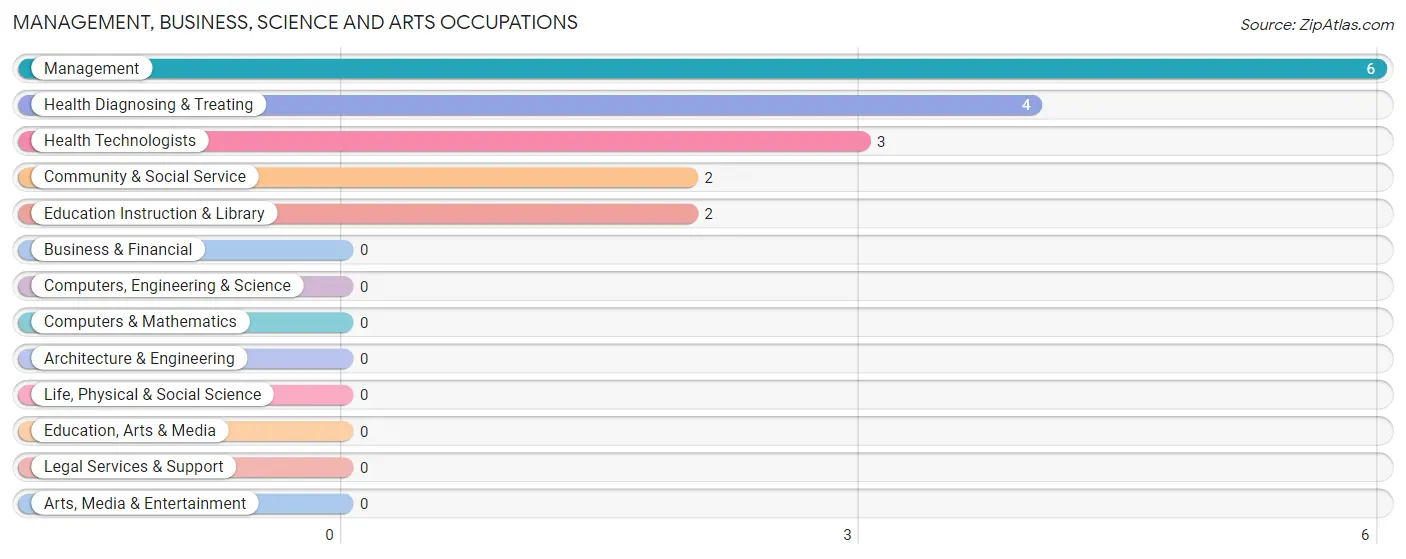
Management, Business, Science and Arts Occupations
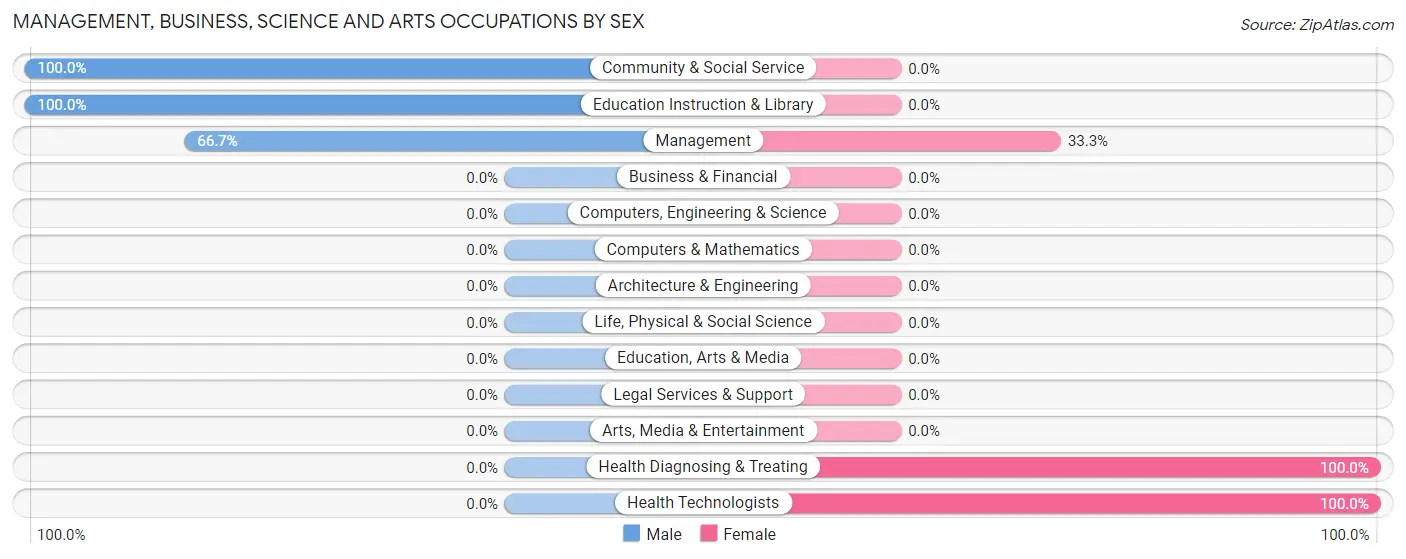
The most common Management, Business, Science and Arts occupations in Waco are Management (6 | 8.3%), Health Diagnosing & Treating (4 | 5.6%), Health Technologists (3 | 4.2%), Community & Social Service (2 | 2.8%), and Education Instruction & Library (2 | 2.8%).
Management, Business, Science and Arts Occupations by Sex
Within the Management, Business, Science and Arts occupations in Waco, the most male-oriented occupations are Community & Social Service (100.0%), Education Instruction & Library (100.0%), and Management (66.7%), while the most female-oriented occupations are Health Diagnosing & Treating (100.0%), Health Technologists (100.0%), and Management (33.3%).
| Occupation | Male | Female |
| Management | 4 (66.7%) | 2 (33.3%) |
| Business & Financial | 0 (0.0%) | 0 (0.0%) |
| Computers, Engineering & Science | 0 (0.0%) | 0 (0.0%) |
| Computers & Mathematics | 0 (0.0%) | 0 (0.0%) |
| Architecture & Engineering | 0 (0.0%) | 0 (0.0%) |
| Life, Physical & Social Science | 0 (0.0%) | 0 (0.0%) |
| Community & Social Service | 2 (100.0%) | 0 (0.0%) |
| Education, Arts & Media | 0 (0.0%) | 0 (0.0%) |
| Legal Services & Support | 0 (0.0%) | 0 (0.0%) |
| Education Instruction & Library | 2 (100.0%) | 0 (0.0%) |
| Arts, Media & Entertainment | 0 (0.0%) | 0 (0.0%) |
| Health Diagnosing & Treating | 0 (0.0%) | 4 (100.0%) |
| Health Technologists | 0 (0.0%) | 3 (100.0%) |
| Total (Category) | 6 (50.0%) | 6 (50.0%) |
| Total (Overall) | 56 (77.8%) | 16 (22.2%) |
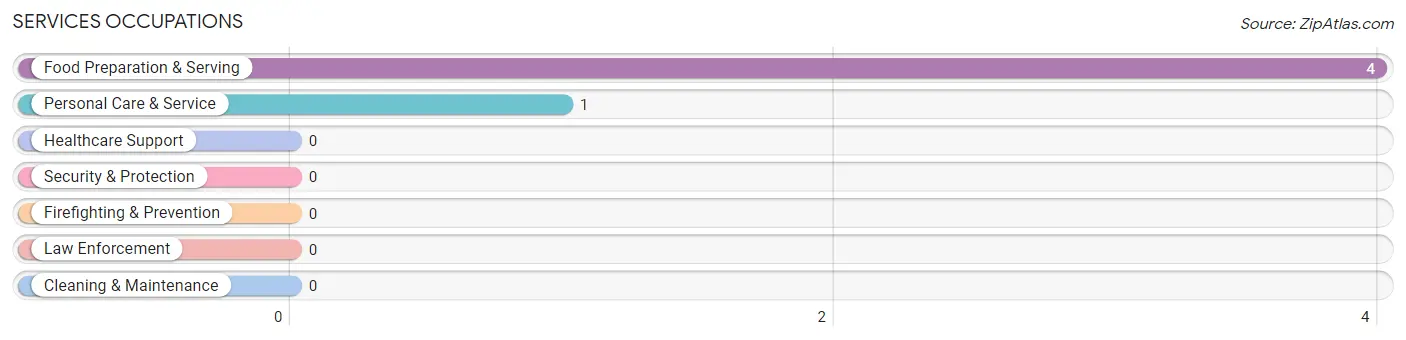
Services Occupations
The most common Services occupations in Waco are Food Preparation & Serving (4 | 5.6%), and Personal Care & Service (1 | 1.4%).
Services Occupations by Sex
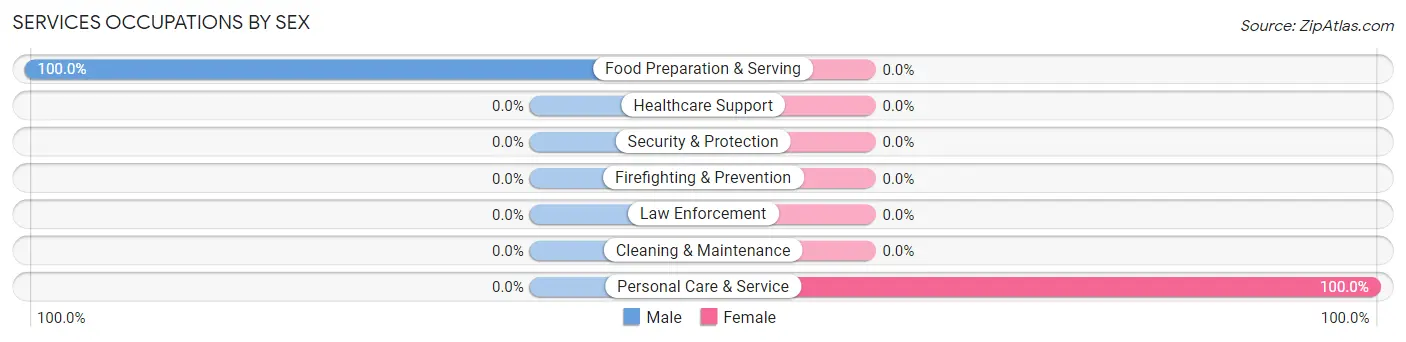
| Occupation | Male | Female |
| Healthcare Support | 0 (0.0%) | 0 (0.0%) |
| Security & Protection | 0 (0.0%) | 0 (0.0%) |
| Firefighting & Prevention | 0 (0.0%) | 0 (0.0%) |
| Law Enforcement | 0 (0.0%) | 0 (0.0%) |
| Food Preparation & Serving | 4 (100.0%) | 0 (0.0%) |
| Cleaning & Maintenance | 0 (0.0%) | 0 (0.0%) |
| Personal Care & Service | 0 (0.0%) | 1 (100.0%) |
| Total (Category) | 4 (80.0%) | 1 (20.0%) |
| Total (Overall) | 56 (77.8%) | 16 (22.2%) |
Sales and Office Occupations
The most common Sales and Office occupations in Waco are Office & Administration (7 | 9.7%), and Sales & Related (2 | 2.8%).

Sales and Office Occupations by Sex

| Occupation | Male | Female |
| Sales & Related | 0 (0.0%) | 2 (100.0%) |
| Office & Administration | 7 (100.0%) | 0 (0.0%) |
| Total (Category) | 7 (77.8%) | 2 (22.2%) |
| Total (Overall) | 56 (77.8%) | 16 (22.2%) |
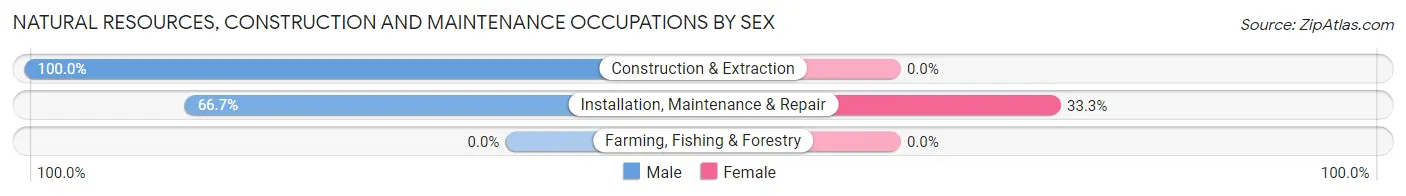
Natural Resources, Construction and Maintenance Occupations
The most common Natural Resources, Construction and Maintenance occupations in Waco are Construction & Extraction (14 | 19.4%), and Installation, Maintenance & Repair (9 | 12.5%).

Natural Resources, Construction and Maintenance Occupations by Sex
| Occupation | Male | Female |
| Farming, Fishing & Forestry | 0 (0.0%) | 0 (0.0%) |
| Construction & Extraction | 14 (100.0%) | 0 (0.0%) |
| Installation, Maintenance & Repair | 6 (66.7%) | 3 (33.3%) |
| Total (Category) | 20 (87.0%) | 3 (13.0%) |
| Total (Overall) | 56 (77.8%) | 16 (22.2%) |
Production, Transportation and Moving Occupations
The most common Production, Transportation and Moving occupations in Waco are Production (16 | 22.2%), and Material Moving (7 | 9.7%).
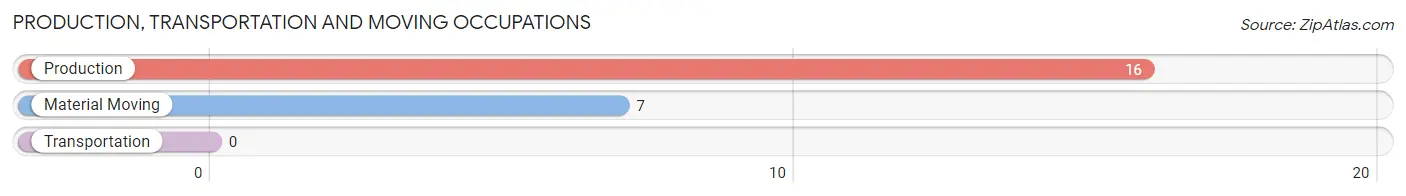
Production, Transportation and Moving Occupations by Sex
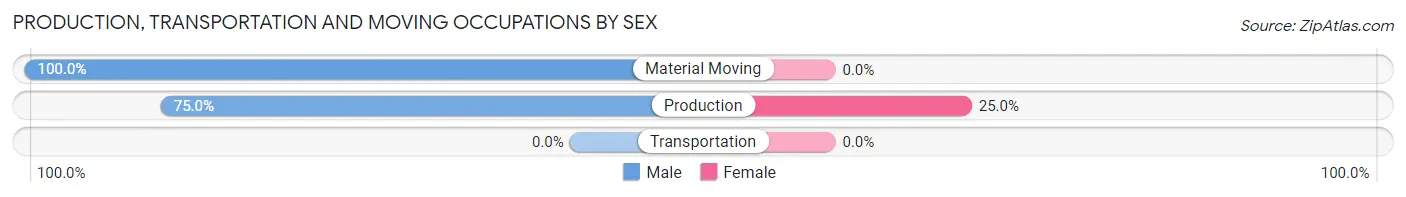
| Occupation | Male | Female |
| Production | 12 (75.0%) | 4 (25.0%) |
| Transportation | 0 (0.0%) | 0 (0.0%) |
| Material Moving | 7 (100.0%) | 0 (0.0%) |
| Total (Category) | 19 (82.6%) | 4 (17.4%) |
| Total (Overall) | 56 (77.8%) | 16 (22.2%) |
Employment Industries by Sex in Waco
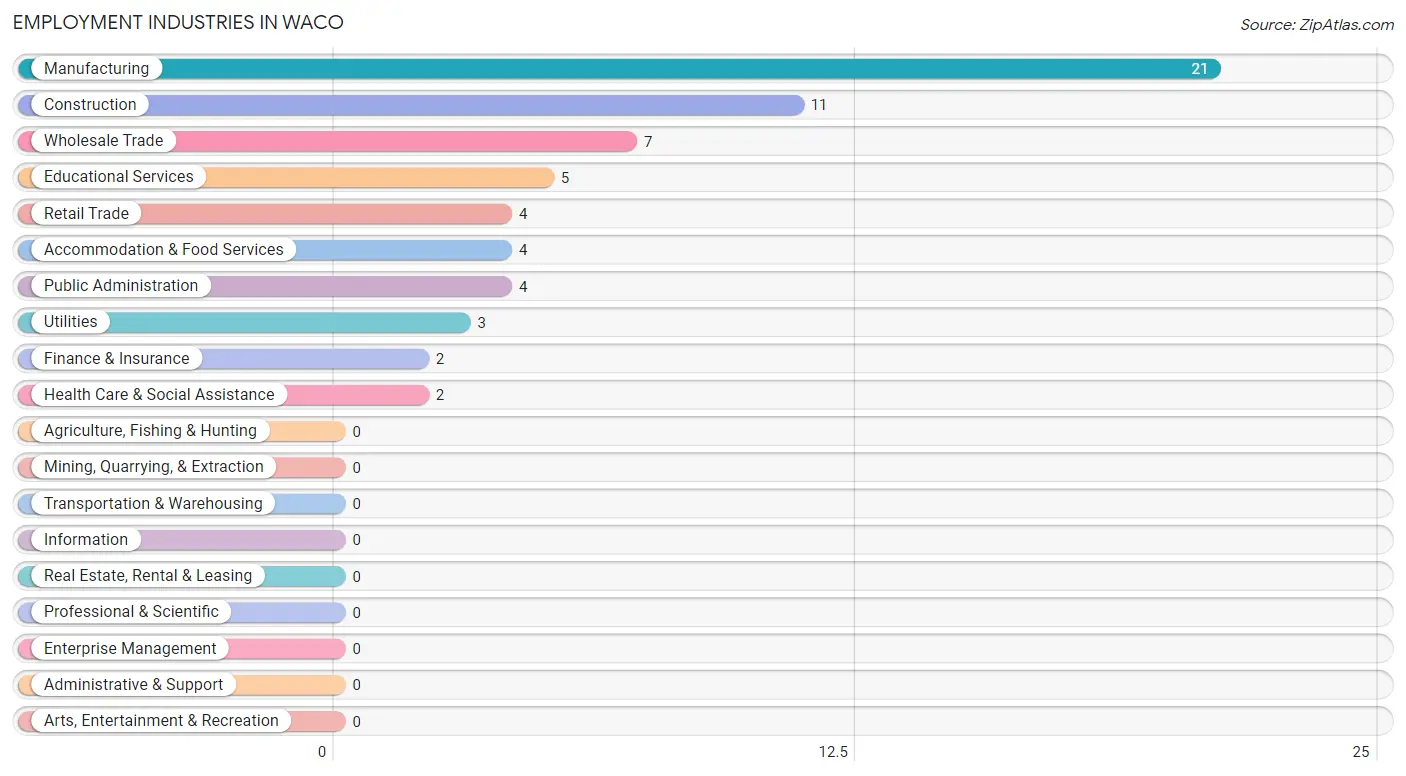
Employment Industries in Waco
The major employment industries in Waco include Manufacturing (21 | 29.2%), Construction (11 | 15.3%), Wholesale Trade (7 | 9.7%), Educational Services (5 | 6.9%), and Retail Trade (4 | 5.6%).
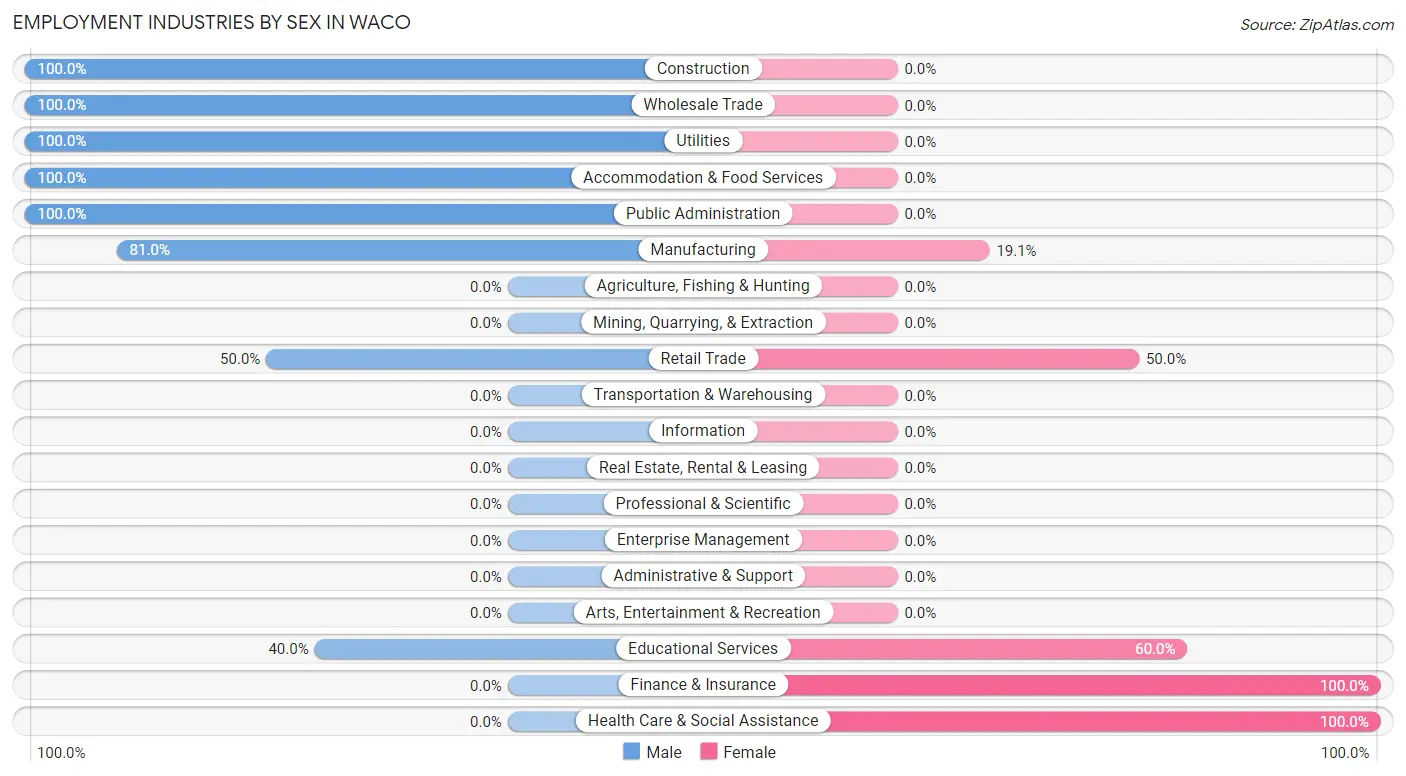
Employment Industries by Sex in Waco
The Waco industries that see more men than women are Construction (100.0%), Wholesale Trade (100.0%), and Utilities (100.0%), whereas the industries that tend to have a higher number of women are Finance & Insurance (100.0%), Health Care & Social Assistance (100.0%), and Educational Services (60.0%).
| Industry | Male | Female |
| Agriculture, Fishing & Hunting | 0 (0.0%) | 0 (0.0%) |
| Mining, Quarrying, & Extraction | 0 (0.0%) | 0 (0.0%) |
| Construction | 11 (100.0%) | 0 (0.0%) |
| Manufacturing | 17 (80.9%) | 4 (19.1%) |
| Wholesale Trade | 7 (100.0%) | 0 (0.0%) |
| Retail Trade | 2 (50.0%) | 2 (50.0%) |
| Transportation & Warehousing | 0 (0.0%) | 0 (0.0%) |
| Utilities | 3 (100.0%) | 0 (0.0%) |
| Information | 0 (0.0%) | 0 (0.0%) |
| Finance & Insurance | 0 (0.0%) | 2 (100.0%) |
| Real Estate, Rental & Leasing | 0 (0.0%) | 0 (0.0%) |
| Professional & Scientific | 0 (0.0%) | 0 (0.0%) |
| Enterprise Management | 0 (0.0%) | 0 (0.0%) |
| Administrative & Support | 0 (0.0%) | 0 (0.0%) |
| Educational Services | 2 (40.0%) | 3 (60.0%) |
| Health Care & Social Assistance | 0 (0.0%) | 2 (100.0%) |
| Arts, Entertainment & Recreation | 0 (0.0%) | 0 (0.0%) |
| Accommodation & Food Services | 4 (100.0%) | 0 (0.0%) |
| Public Administration | 4 (100.0%) | 0 (0.0%) |
| Total | 56 (77.8%) | 16 (22.2%) |
Education in Waco
School Enrollment in Waco
The most common levels of schooling among the 29 students in Waco are high school (11 | 37.9%), college / undergraduate (7 | 24.1%), and kindergarten (4 | 13.8%).
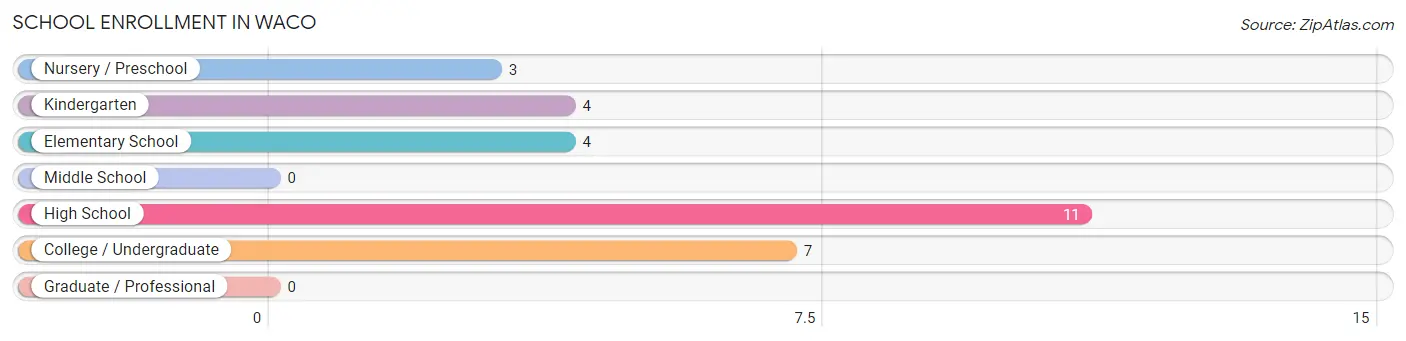
| School Level | # Students | % Students |
| Nursery / Preschool | 3 | 10.3% |
| Kindergarten | 4 | 13.8% |
| Elementary School | 4 | 13.8% |
| Middle School | 0 | 0.0% |
| High School | 11 | 37.9% |
| College / Undergraduate | 7 | 24.1% |
| Graduate / Professional | 0 | 0.0% |
| Total | 29 | 100.0% |
School Enrollment by Age by Funding Source in Waco
Out of a total of 29 students who are enrolled in schools in Waco, 16 (55.2%) attend a private institution, while the remaining 13 (44.8%) are enrolled in public schools. The age group of 3 to 4 year olds has the highest likelihood of being enrolled in private schools, with 3 (100.0% in the age bracket) enrolled. Conversely, the age group of 20 to 24 year olds has the lowest likelihood of being enrolled in a private school, with 2 (100.0% in the age bracket) attending a public institution.
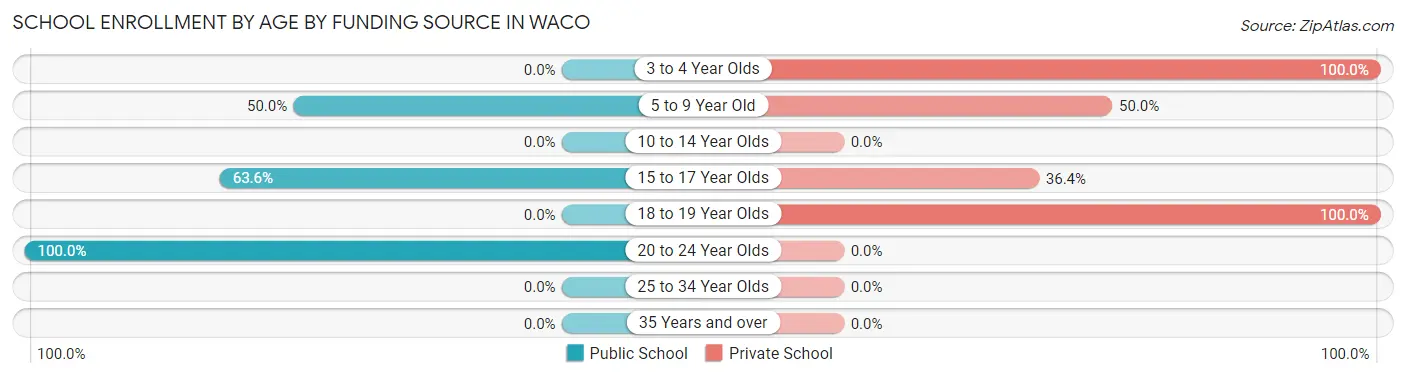
| Age Bracket | Public School | Private School |
| 3 to 4 Year Olds | 0 (0.0%) | 3 (100.0%) |
| 5 to 9 Year Old | 4 (50.0%) | 4 (50.0%) |
| 10 to 14 Year Olds | 0 (0.0%) | 0 (0.0%) |
| 15 to 17 Year Olds | 7 (63.6%) | 4 (36.4%) |
| 18 to 19 Year Olds | 0 (0.0%) | 5 (100.0%) |
| 20 to 24 Year Olds | 2 (100.0%) | 0 (0.0%) |
| 25 to 34 Year Olds | 0 (0.0%) | 0 (0.0%) |
| 35 Years and over | 0 (0.0%) | 0 (0.0%) |
| Total | 13 (44.8%) | 16 (55.2%) |
Educational Attainment by Field of Study in Waco
Computers & mathematics (8 | 44.4%), physical & health sciences (4 | 22.2%), science & technology (3 | 16.7%), and education (3 | 16.7%) are the most common fields of study among 18 individuals in Waco who have obtained a bachelor's degree or higher.
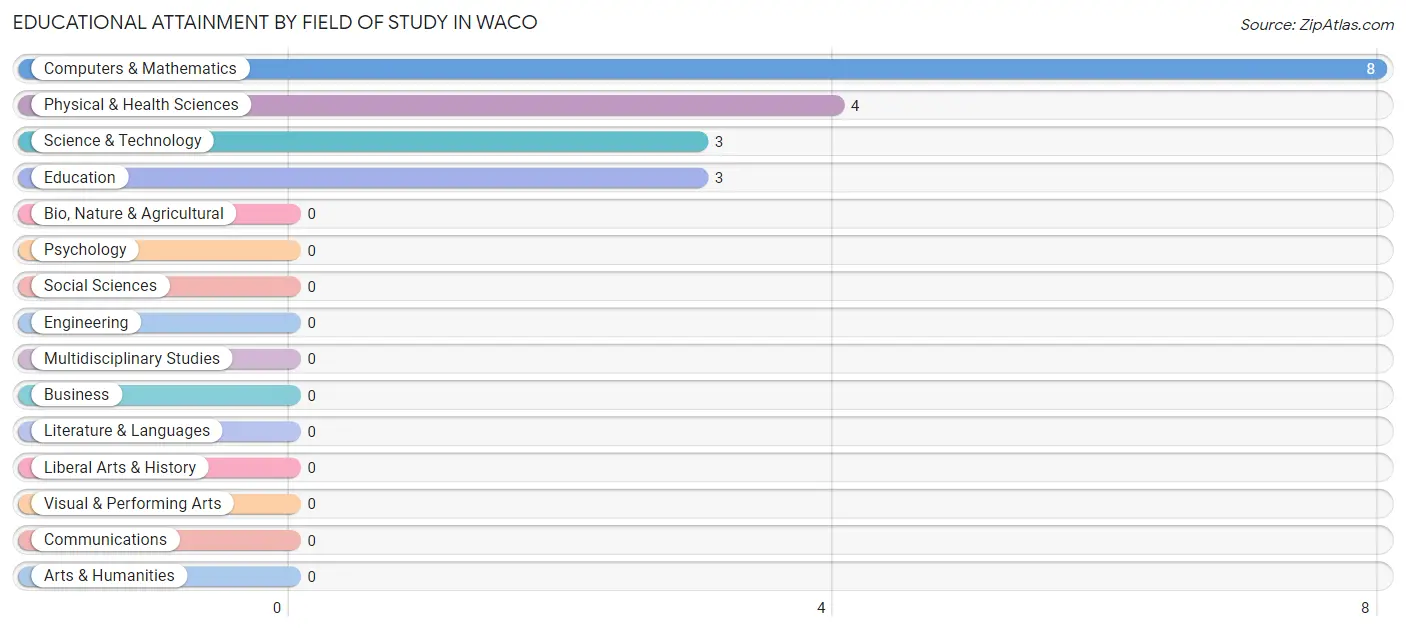
| Field of Study | # Graduates | % Graduates |
| Computers & Mathematics | 8 | 44.4% |
| Bio, Nature & Agricultural | 0 | 0.0% |
| Physical & Health Sciences | 4 | 22.2% |
| Psychology | 0 | 0.0% |
| Social Sciences | 0 | 0.0% |
| Engineering | 0 | 0.0% |
| Multidisciplinary Studies | 0 | 0.0% |
| Science & Technology | 3 | 16.7% |
| Business | 0 | 0.0% |
| Education | 3 | 16.7% |
| Literature & Languages | 0 | 0.0% |
| Liberal Arts & History | 0 | 0.0% |
| Visual & Performing Arts | 0 | 0.0% |
| Communications | 0 | 0.0% |
| Arts & Humanities | 0 | 0.0% |
| Total | 18 | 100.0% |
Transportation & Commute in Waco
Vehicle Availability by Sex in Waco
The most prevalent vehicle ownership categories in Waco are males with 3 vehicles (17, accounting for 30.4%) and females with 3 vehicles (5, making up 106.2%).
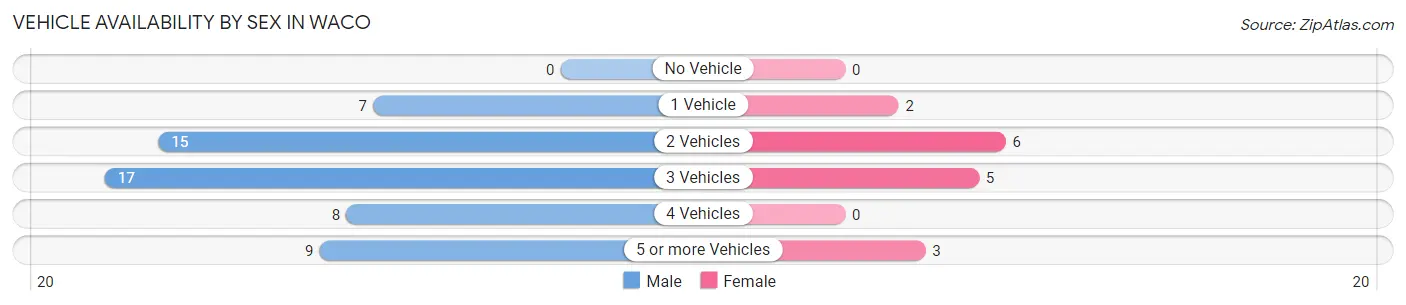
| Vehicles Available | Male | Female |
| No Vehicle | 0 (0.0%) | 0 (0.0%) |
| 1 Vehicle | 7 (12.5%) | 2 (12.5%) |
| 2 Vehicles | 15 (26.8%) | 6 (37.5%) |
| 3 Vehicles | 17 (30.4%) | 5 (31.2%) |
| 4 Vehicles | 8 (14.3%) | 0 (0.0%) |
| 5 or more Vehicles | 9 (16.1%) | 3 (18.8%) |
| Total | 56 (100.0%) | 16 (100.0%) |
Commute Time in Waco
The most frequently occuring commute durations in Waco are 30 to 34 minutes (33 commuters, 45.8%), 25 to 29 minutes (15 commuters, 20.8%), and 20 to 24 minutes (14 commuters, 19.4%).
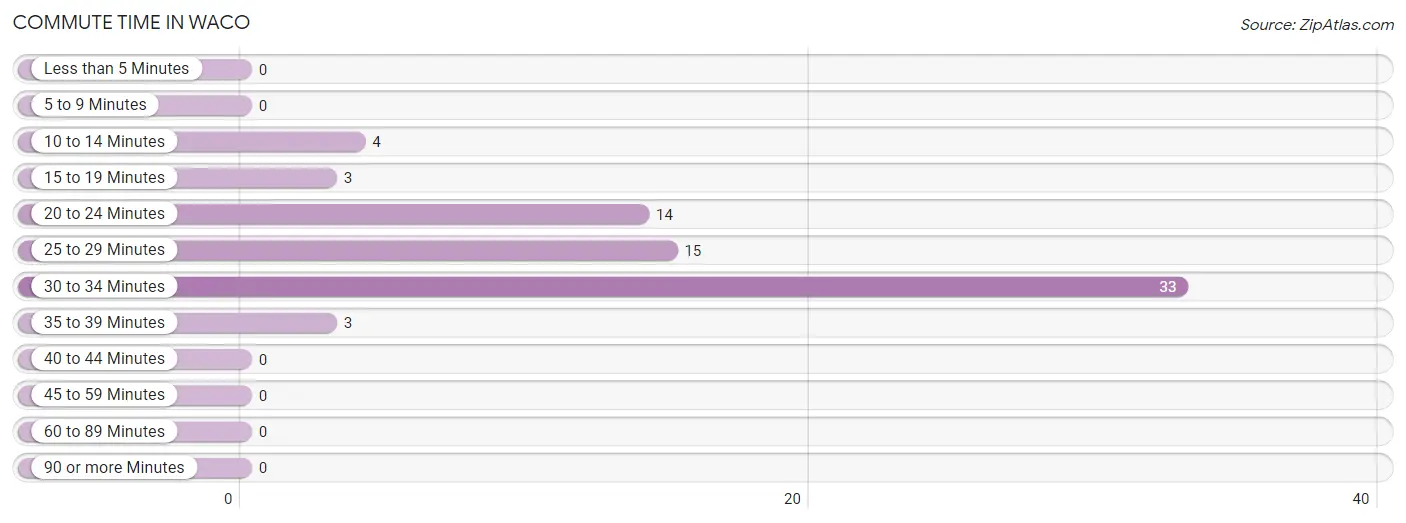
| Commute Time | # Commuters | % Commuters |
| Less than 5 Minutes | 0 | 0.0% |
| 5 to 9 Minutes | 0 | 0.0% |
| 10 to 14 Minutes | 4 | 5.6% |
| 15 to 19 Minutes | 3 | 4.2% |
| 20 to 24 Minutes | 14 | 19.4% |
| 25 to 29 Minutes | 15 | 20.8% |
| 30 to 34 Minutes | 33 | 45.8% |
| 35 to 39 Minutes | 3 | 4.2% |
| 40 to 44 Minutes | 0 | 0.0% |
| 45 to 59 Minutes | 0 | 0.0% |
| 60 to 89 Minutes | 0 | 0.0% |
| 90 or more Minutes | 0 | 0.0% |
Commute Time by Sex in Waco
The most common commute times in Waco are 30 to 34 minutes (30 commuters, 53.6%) for males and 20 to 24 minutes (4 commuters, 25.0%) for females.
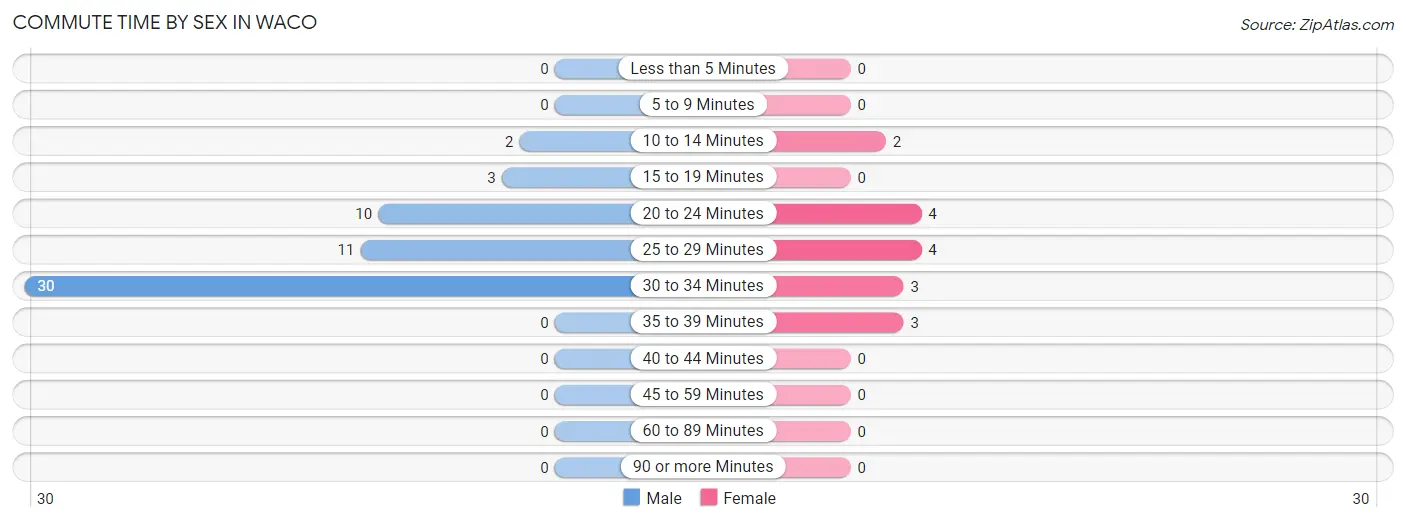
| Commute Time | Male | Female |
| Less than 5 Minutes | 0 (0.0%) | 0 (0.0%) |
| 5 to 9 Minutes | 0 (0.0%) | 0 (0.0%) |
| 10 to 14 Minutes | 2 (3.6%) | 2 (12.5%) |
| 15 to 19 Minutes | 3 (5.4%) | 0 (0.0%) |
| 20 to 24 Minutes | 10 (17.9%) | 4 (25.0%) |
| 25 to 29 Minutes | 11 (19.6%) | 4 (25.0%) |
| 30 to 34 Minutes | 30 (53.6%) | 3 (18.8%) |
| 35 to 39 Minutes | 0 (0.0%) | 3 (18.8%) |
| 40 to 44 Minutes | 0 (0.0%) | 0 (0.0%) |
| 45 to 59 Minutes | 0 (0.0%) | 0 (0.0%) |
| 60 to 89 Minutes | 0 (0.0%) | 0 (0.0%) |
| 90 or more Minutes | 0 (0.0%) | 0 (0.0%) |
Time of Departure to Work by Sex in Waco
The most frequent times of departure to work in Waco are 5:30 AM to 5:59 AM (25, 44.6%) for males and 7:30 AM to 7:59 AM (5, 31.2%) for females.
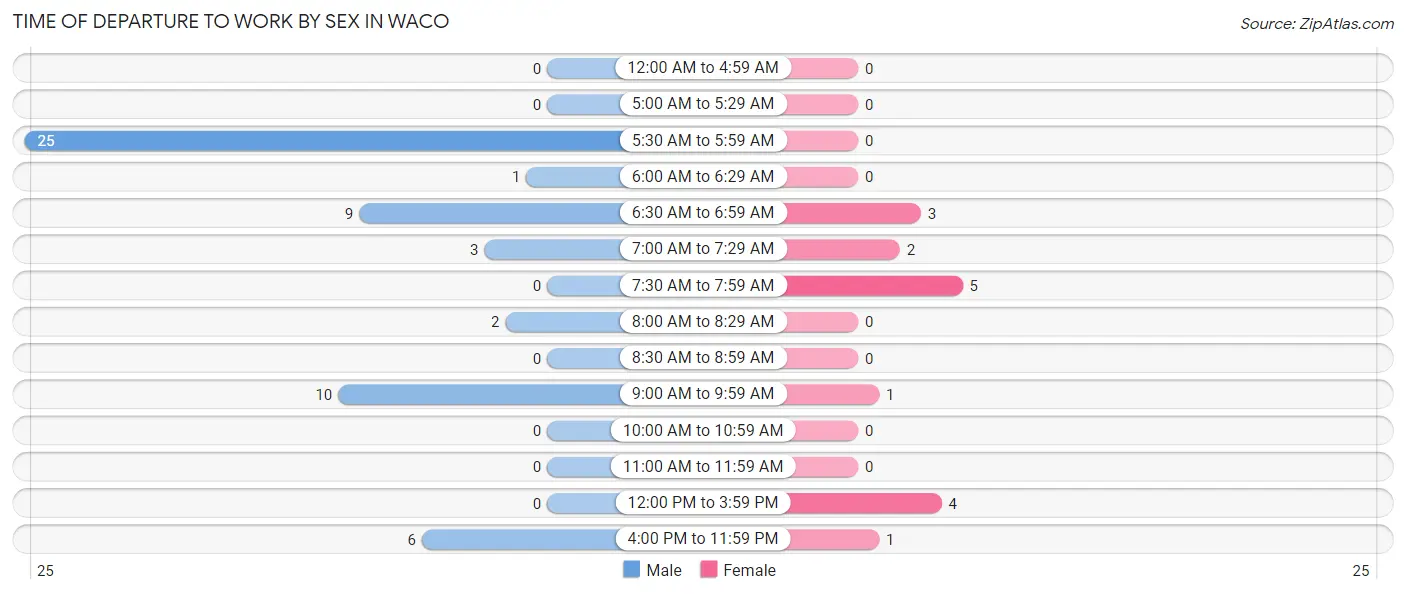
| Time of Departure | Male | Female |
| 12:00 AM to 4:59 AM | 0 (0.0%) | 0 (0.0%) |
| 5:00 AM to 5:29 AM | 0 (0.0%) | 0 (0.0%) |
| 5:30 AM to 5:59 AM | 25 (44.6%) | 0 (0.0%) |
| 6:00 AM to 6:29 AM | 1 (1.8%) | 0 (0.0%) |
| 6:30 AM to 6:59 AM | 9 (16.1%) | 3 (18.8%) |
| 7:00 AM to 7:29 AM | 3 (5.4%) | 2 (12.5%) |
| 7:30 AM to 7:59 AM | 0 (0.0%) | 5 (31.2%) |
| 8:00 AM to 8:29 AM | 2 (3.6%) | 0 (0.0%) |
| 8:30 AM to 8:59 AM | 0 (0.0%) | 0 (0.0%) |
| 9:00 AM to 9:59 AM | 10 (17.9%) | 1 (6.2%) |
| 10:00 AM to 10:59 AM | 0 (0.0%) | 0 (0.0%) |
| 11:00 AM to 11:59 AM | 0 (0.0%) | 0 (0.0%) |
| 12:00 PM to 3:59 PM | 0 (0.0%) | 4 (25.0%) |
| 4:00 PM to 11:59 PM | 6 (10.7%) | 1 (6.2%) |
| Total | 56 (100.0%) | 16 (100.0%) |
Housing Occupancy in Waco
Occupancy by Ownership in Waco
Of the total 66 dwellings in Waco, owner-occupied units account for 59 (89.4%), while renter-occupied units make up 7 (10.6%).
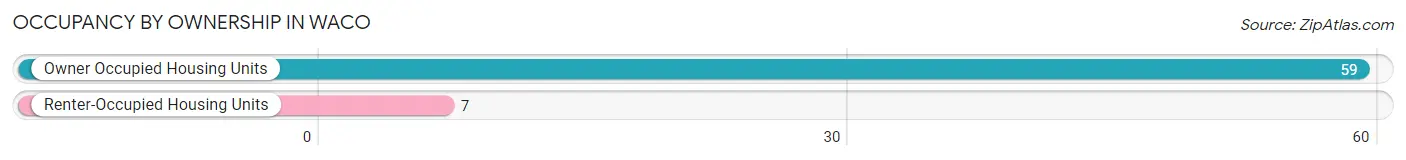
| Occupancy | # Housing Units | % Housing Units |
| Owner Occupied Housing Units | 59 | 89.4% |
| Renter-Occupied Housing Units | 7 | 10.6% |
| Total Occupied Housing Units | 66 | 100.0% |
Occupancy by Household Size in Waco
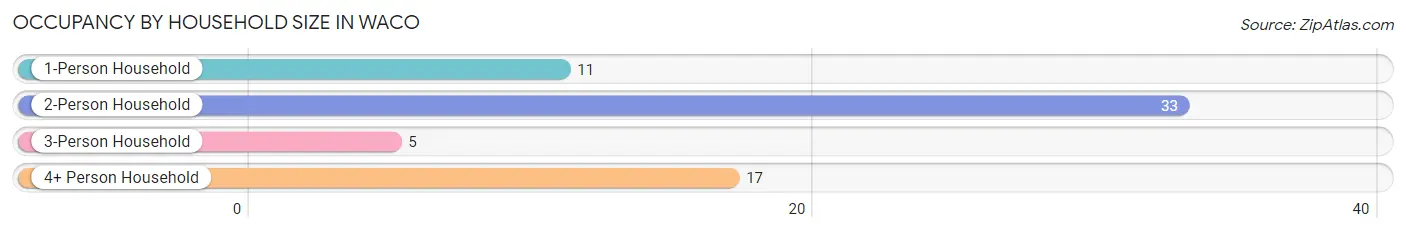
| Household Size | # Housing Units | % Housing Units |
| 1-Person Household | 11 | 16.7% |
| 2-Person Household | 33 | 50.0% |
| 3-Person Household | 5 | 7.6% |
| 4+ Person Household | 17 | 25.8% |
| Total Housing Units | 66 | 100.0% |
Occupancy by Ownership by Household Size in Waco
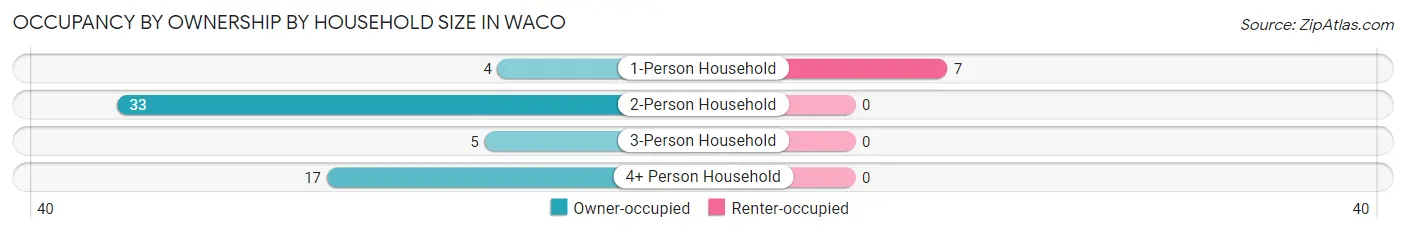
| Household Size | Owner-occupied | Renter-occupied |
| 1-Person Household | 4 (36.4%) | 7 (63.6%) |
| 2-Person Household | 33 (100.0%) | 0 (0.0%) |
| 3-Person Household | 5 (100.0%) | 0 (0.0%) |
| 4+ Person Household | 17 (100.0%) | 0 (0.0%) |
| Total Housing Units | 59 (89.4%) | 7 (10.6%) |
Occupancy by Educational Attainment in Waco
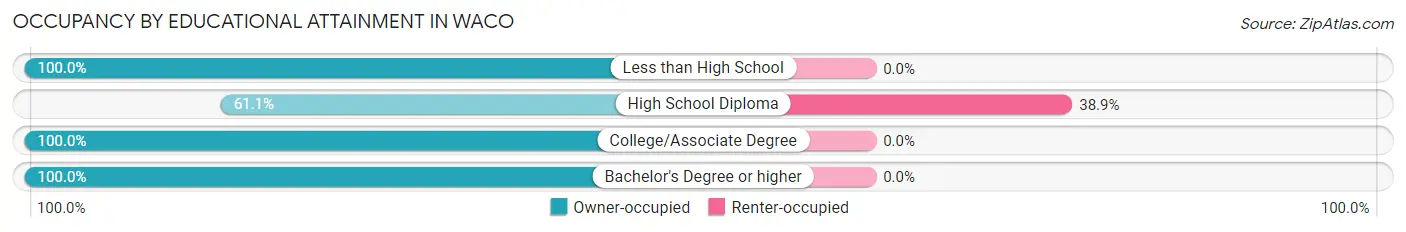
| Household Size | Owner-occupied | Renter-occupied |
| Less than High School | 18 (100.0%) | 0 (0.0%) |
| High School Diploma | 11 (61.1%) | 7 (38.9%) |
| College/Associate Degree | 22 (100.0%) | 0 (0.0%) |
| Bachelor's Degree or higher | 8 (100.0%) | 0 (0.0%) |
Occupancy by Age of Householder in Waco
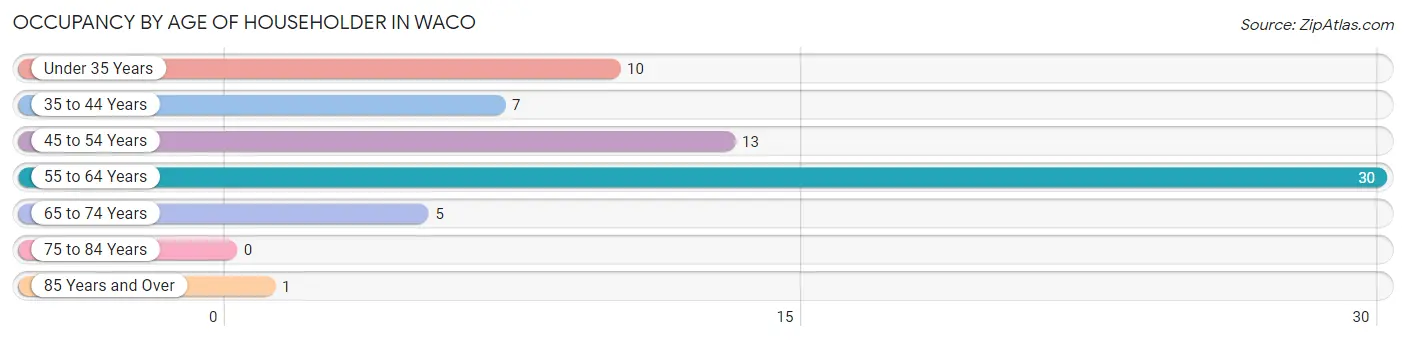
| Age Bracket | # Households | % Households |
| Under 35 Years | 10 | 15.1% |
| 35 to 44 Years | 7 | 10.6% |
| 45 to 54 Years | 13 | 19.7% |
| 55 to 64 Years | 30 | 45.5% |
| 65 to 74 Years | 5 | 7.6% |
| 75 to 84 Years | 0 | 0.0% |
| 85 Years and Over | 1 | 1.5% |
| Total | 66 | 100.0% |
Housing Finances in Waco
Median Income by Occupancy in Waco
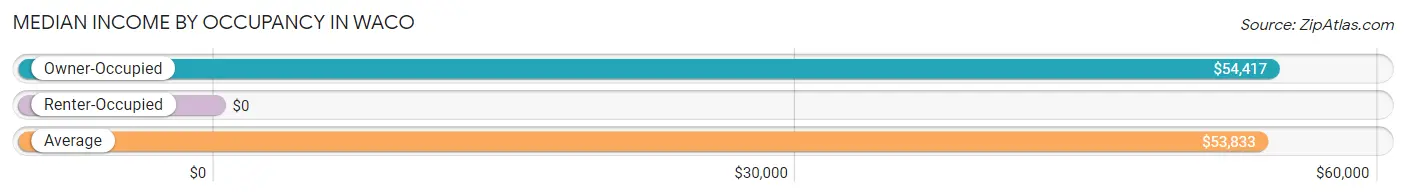
| Occupancy Type | # Households | Median Income |
| Owner-Occupied | 59 (89.4%) | $54,417 |
| Renter-Occupied | 7 (10.6%) | $0 |
| Average | 66 (100.0%) | $53,833 |
Occupancy by Householder Income Bracket in Waco
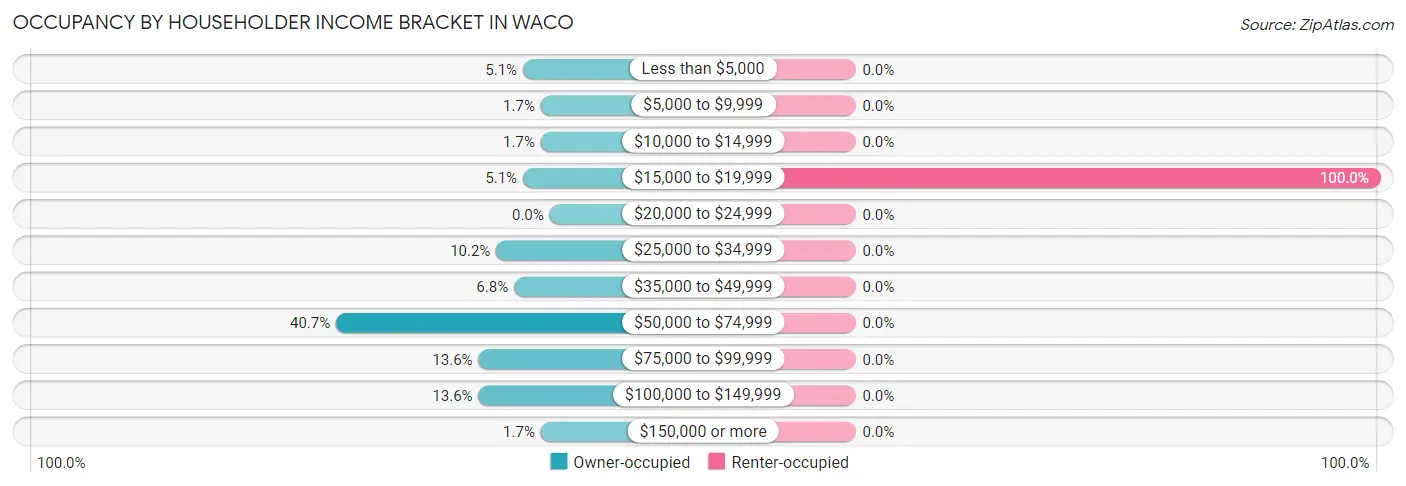
| Income Bracket | Owner-occupied | Renter-occupied |
| Less than $5,000 | 3 (5.1%) | 0 (0.0%) |
| $5,000 to $9,999 | 1 (1.7%) | 0 (0.0%) |
| $10,000 to $14,999 | 1 (1.7%) | 0 (0.0%) |
| $15,000 to $19,999 | 3 (5.1%) | 7 (100.0%) |
| $20,000 to $24,999 | 0 (0.0%) | 0 (0.0%) |
| $25,000 to $34,999 | 6 (10.2%) | 0 (0.0%) |
| $35,000 to $49,999 | 4 (6.8%) | 0 (0.0%) |
| $50,000 to $74,999 | 24 (40.7%) | 0 (0.0%) |
| $75,000 to $99,999 | 8 (13.6%) | 0 (0.0%) |
| $100,000 to $149,999 | 8 (13.6%) | 0 (0.0%) |
| $150,000 or more | 1 (1.7%) | 0 (0.0%) |
| Total | 59 (100.0%) | 7 (100.0%) |
Monthly Housing Cost Tiers in Waco
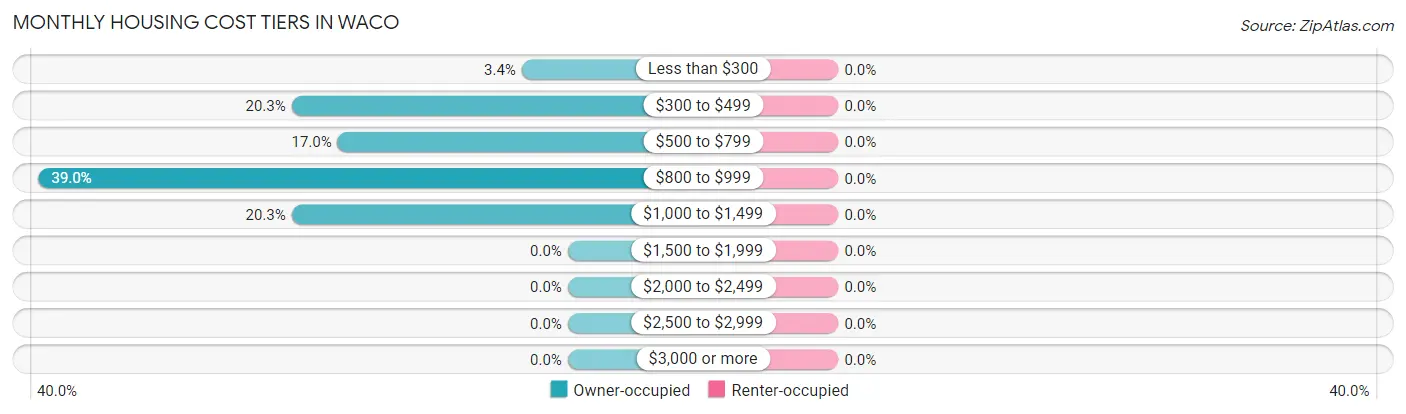
| Monthly Cost | Owner-occupied | Renter-occupied |
| Less than $300 | 2 (3.4%) | 0 (0.0%) |
| $300 to $499 | 12 (20.3%) | 0 (0.0%) |
| $500 to $799 | 10 (17.0%) | 0 (0.0%) |
| $800 to $999 | 23 (39.0%) | 0 (0.0%) |
| $1,000 to $1,499 | 12 (20.3%) | 0 (0.0%) |
| $1,500 to $1,999 | 0 (0.0%) | 0 (0.0%) |
| $2,000 to $2,499 | 0 (0.0%) | 0 (0.0%) |
| $2,500 to $2,999 | 0 (0.0%) | 0 (0.0%) |
| $3,000 or more | 0 (0.0%) | 0 (0.0%) |
| Total | 59 (100.0%) | 7 (100.0%) |
Physical Housing Characteristics in Waco
Housing Structures in Waco
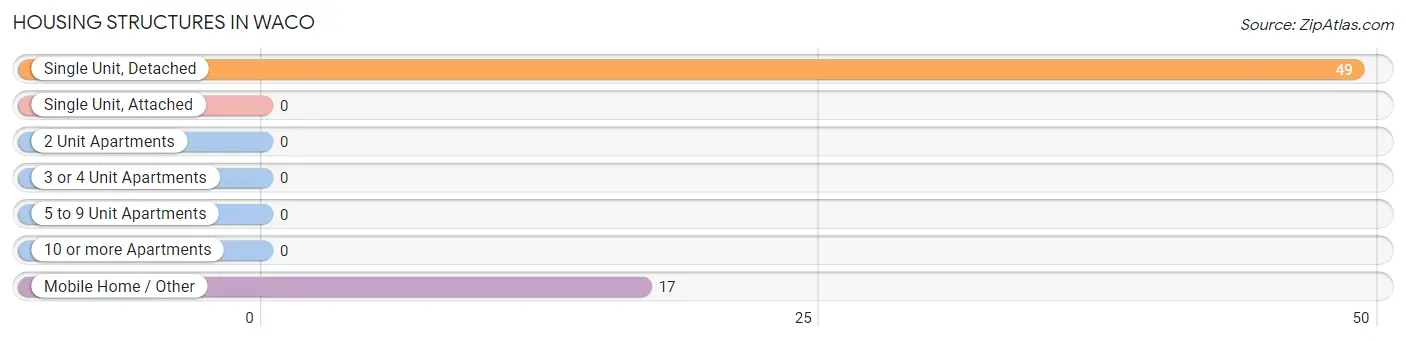
| Structure Type | # Housing Units | % Housing Units |
| Single Unit, Detached | 49 | 74.2% |
| Single Unit, Attached | 0 | 0.0% |
| 2 Unit Apartments | 0 | 0.0% |
| 3 or 4 Unit Apartments | 0 | 0.0% |
| 5 to 9 Unit Apartments | 0 | 0.0% |
| 10 or more Apartments | 0 | 0.0% |
| Mobile Home / Other | 17 | 25.8% |
| Total | 66 | 100.0% |
Housing Structures by Occupancy in Waco
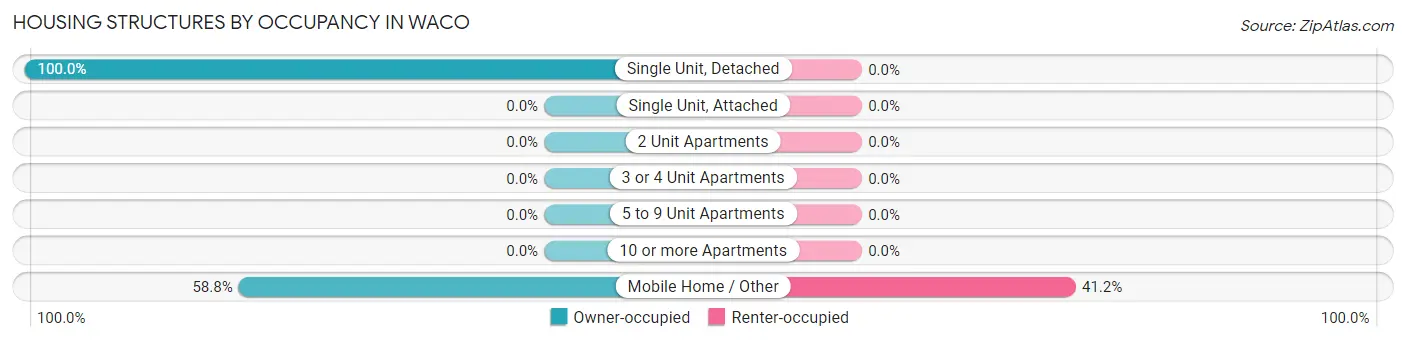
| Structure Type | Owner-occupied | Renter-occupied |
| Single Unit, Detached | 49 (100.0%) | 0 (0.0%) |
| Single Unit, Attached | 0 (0.0%) | 0 (0.0%) |
| 2 Unit Apartments | 0 (0.0%) | 0 (0.0%) |
| 3 or 4 Unit Apartments | 0 (0.0%) | 0 (0.0%) |
| 5 to 9 Unit Apartments | 0 (0.0%) | 0 (0.0%) |
| 10 or more Apartments | 0 (0.0%) | 0 (0.0%) |
| Mobile Home / Other | 10 (58.8%) | 7 (41.2%) |
| Total | 59 (89.4%) | 7 (10.6%) |
Housing Structures by Number of Rooms in Waco
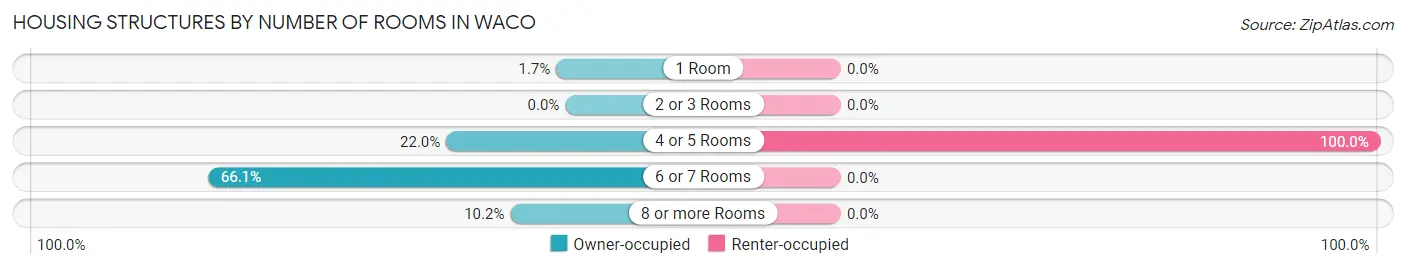
| Number of Rooms | Owner-occupied | Renter-occupied |
| 1 Room | 1 (1.7%) | 0 (0.0%) |
| 2 or 3 Rooms | 0 (0.0%) | 0 (0.0%) |
| 4 or 5 Rooms | 13 (22.0%) | 7 (100.0%) |
| 6 or 7 Rooms | 39 (66.1%) | 0 (0.0%) |
| 8 or more Rooms | 6 (10.2%) | 0 (0.0%) |
| Total | 59 (100.0%) | 7 (100.0%) |
Housing Structure by Heating Type in Waco
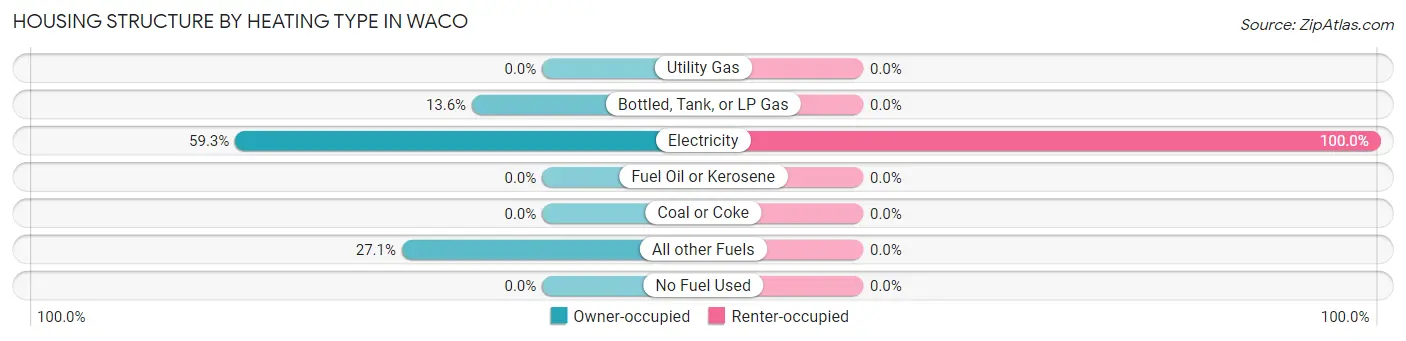
| Heating Type | Owner-occupied | Renter-occupied |
| Utility Gas | 0 (0.0%) | 0 (0.0%) |
| Bottled, Tank, or LP Gas | 8 (13.6%) | 0 (0.0%) |
| Electricity | 35 (59.3%) | 7 (100.0%) |
| Fuel Oil or Kerosene | 0 (0.0%) | 0 (0.0%) |
| Coal or Coke | 0 (0.0%) | 0 (0.0%) |
| All other Fuels | 16 (27.1%) | 0 (0.0%) |
| No Fuel Used | 0 (0.0%) | 0 (0.0%) |
| Total | 59 (100.0%) | 7 (100.0%) |
Household Vehicle Usage in Waco
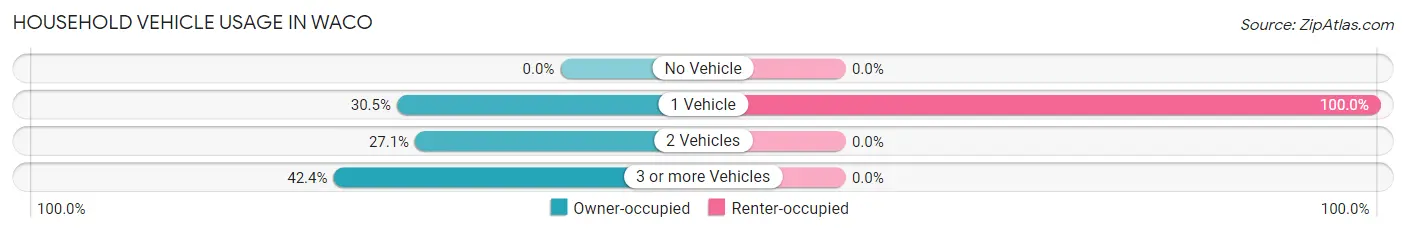
| Vehicles per Household | Owner-occupied | Renter-occupied |
| No Vehicle | 0 (0.0%) | 0 (0.0%) |
| 1 Vehicle | 18 (30.5%) | 7 (100.0%) |
| 2 Vehicles | 16 (27.1%) | 0 (0.0%) |
| 3 or more Vehicles | 25 (42.4%) | 0 (0.0%) |
| Total | 59 (100.0%) | 7 (100.0%) |
Real Estate & Mortgages in Waco
Real Estate and Mortgage Overview in Waco
| Characteristic | Without Mortgage | With Mortgage |
| Housing Units | 37 | 22 |
| Median Property Value | $104,200 | $0 |
| Median Household Income | $53,583 | $0 |
| Monthly Housing Costs | $650 | $0 |
| Real Estate Taxes | $199 | $0 |
Property Value by Mortgage Status in Waco
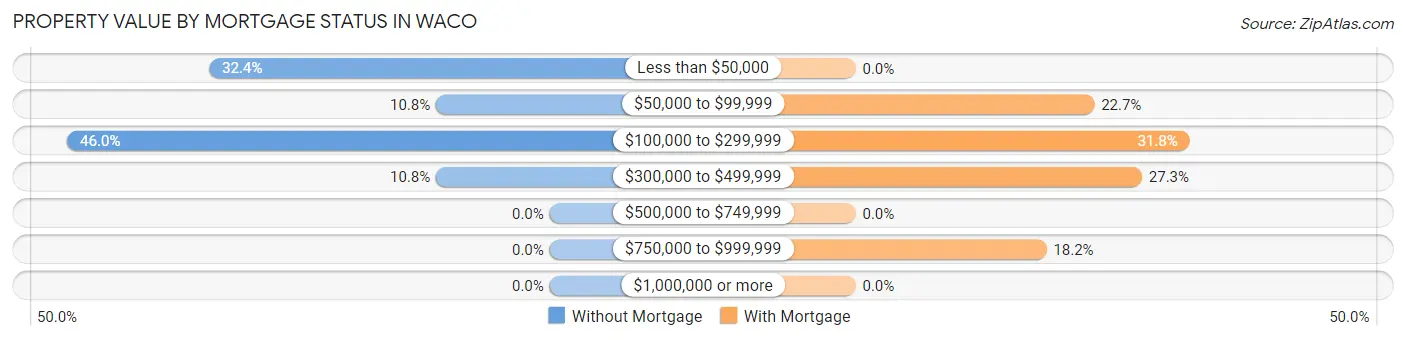
| Property Value | Without Mortgage | With Mortgage |
| Less than $50,000 | 12 (32.4%) | 0 (0.0%) |
| $50,000 to $99,999 | 4 (10.8%) | 5 (22.7%) |
| $100,000 to $299,999 | 17 (46.0%) | 7 (31.8%) |
| $300,000 to $499,999 | 4 (10.8%) | 6 (27.3%) |
| $500,000 to $749,999 | 0 (0.0%) | 0 (0.0%) |
| $750,000 to $999,999 | 0 (0.0%) | 4 (18.2%) |
| $1,000,000 or more | 0 (0.0%) | 0 (0.0%) |
| Total | 37 (100.0%) | 22 (100.0%) |
Household Income by Mortgage Status in Waco
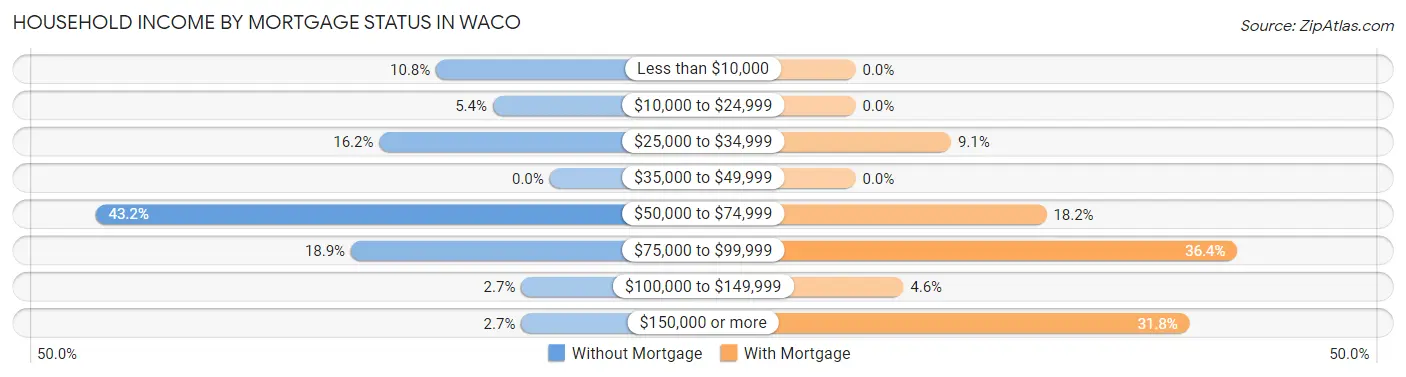
| Household Income | Without Mortgage | With Mortgage |
| Less than $10,000 | 4 (10.8%) | 0 (0.0%) |
| $10,000 to $24,999 | 2 (5.4%) | 0 (0.0%) |
| $25,000 to $34,999 | 6 (16.2%) | 2 (9.1%) |
| $35,000 to $49,999 | 0 (0.0%) | 0 (0.0%) |
| $50,000 to $74,999 | 16 (43.2%) | 4 (18.2%) |
| $75,000 to $99,999 | 7 (18.9%) | 8 (36.4%) |
| $100,000 to $149,999 | 1 (2.7%) | 1 (4.5%) |
| $150,000 or more | 1 (2.7%) | 7 (31.8%) |
| Total | 37 (100.0%) | 22 (100.0%) |
Property Value to Household Income Ratio in Waco
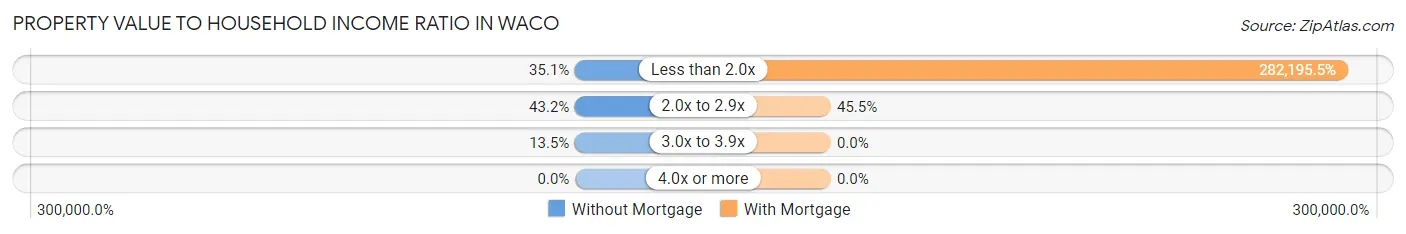
| Value-to-Income Ratio | Without Mortgage | With Mortgage |
| Less than 2.0x | 13 (35.1%) | 62,083 (282,195.4%) |
| 2.0x to 2.9x | 16 (43.2%) | 10 (45.5%) |
| 3.0x to 3.9x | 5 (13.5%) | 0 (0.0%) |
| 4.0x or more | 0 (0.0%) | 0 (0.0%) |
| Total | 37 (100.0%) | 22 (100.0%) |
Real Estate Taxes by Mortgage Status in Waco

| Property Taxes | Without Mortgage | With Mortgage |
| Less than $800 | 30 (81.1%) | 0 (0.0%) |
| $800 to $1,499 | 1 (2.7%) | 12 (54.5%) |
| $800 to $1,499 | 6 (16.2%) | 4 (18.2%) |
| Total | 37 (100.0%) | 22 (100.0%) |
Health & Disability in Waco
Health Insurance Coverage by Age in Waco
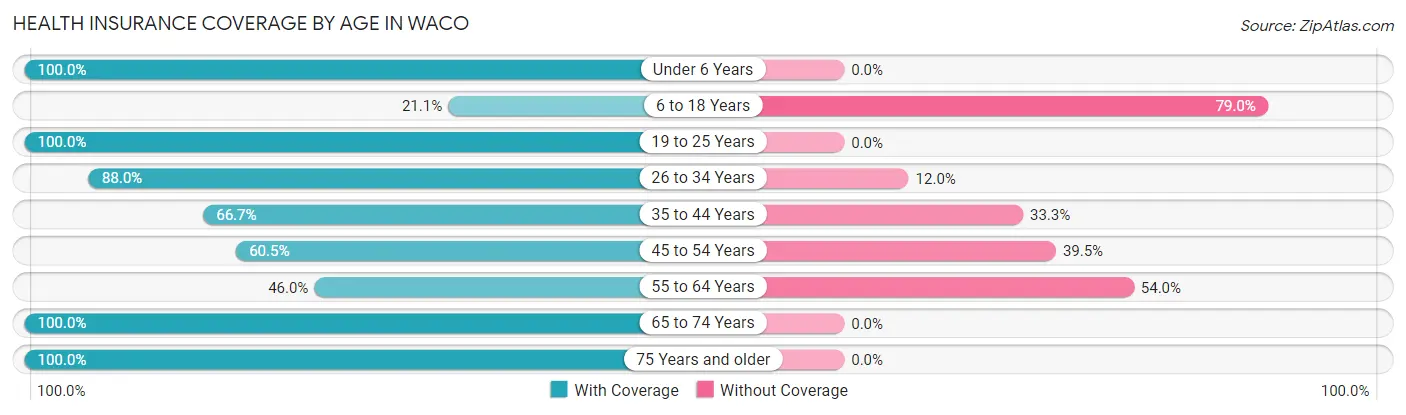
| Age Bracket | With Coverage | Without Coverage |
| Under 6 Years | 15 (100.0%) | 0 (0.0%) |
| 6 to 18 Years | 4 (21.0%) | 15 (78.9%) |
| 19 to 25 Years | 17 (100.0%) | 0 (0.0%) |
| 26 to 34 Years | 22 (88.0%) | 3 (12.0%) |
| 35 to 44 Years | 6 (66.7%) | 3 (33.3%) |
| 45 to 54 Years | 23 (60.5%) | 15 (39.5%) |
| 55 to 64 Years | 23 (46.0%) | 27 (54.0%) |
| 65 to 74 Years | 10 (100.0%) | 0 (0.0%) |
| 75 Years and older | 2 (100.0%) | 0 (0.0%) |
| Total | 122 (65.9%) | 63 (34.1%) |
Health Insurance Coverage by Citizenship Status in Waco

| Citizenship Status | With Coverage | Without Coverage |
| Native Born | 15 (100.0%) | 0 (0.0%) |
| Foreign Born, Citizen | 4 (21.0%) | 15 (78.9%) |
| Foreign Born, not a Citizen | 17 (100.0%) | 0 (0.0%) |
Health Insurance Coverage by Household Income in Waco

| Household Income | With Coverage | Without Coverage |
| Under $25,000 | 13 (44.8%) | 16 (55.2%) |
| $25,000 to $49,999 | 20 (74.1%) | 7 (25.9%) |
| $50,000 to $74,999 | 19 (41.3%) | 27 (58.7%) |
| $75,000 to $99,999 | 27 (100.0%) | 0 (0.0%) |
| $100,000 and over | 43 (76.8%) | 13 (23.2%) |
Public vs Private Health Insurance Coverage by Age in Waco
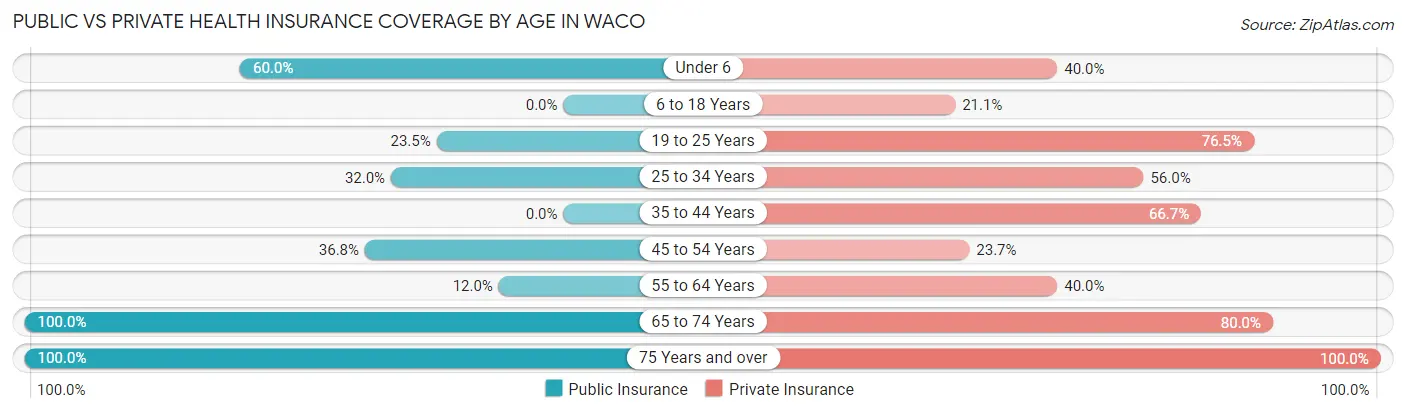
| Age Bracket | Public Insurance | Private Insurance |
| Under 6 | 9 (60.0%) | 6 (40.0%) |
| 6 to 18 Years | 0 (0.0%) | 4 (21.0%) |
| 19 to 25 Years | 4 (23.5%) | 13 (76.5%) |
| 25 to 34 Years | 8 (32.0%) | 14 (56.0%) |
| 35 to 44 Years | 0 (0.0%) | 6 (66.7%) |
| 45 to 54 Years | 14 (36.8%) | 9 (23.7%) |
| 55 to 64 Years | 6 (12.0%) | 20 (40.0%) |
| 65 to 74 Years | 10 (100.0%) | 8 (80.0%) |
| 75 Years and over | 2 (100.0%) | 2 (100.0%) |
| Total | 53 (28.6%) | 82 (44.3%) |
Disability Status by Sex by Age in Waco
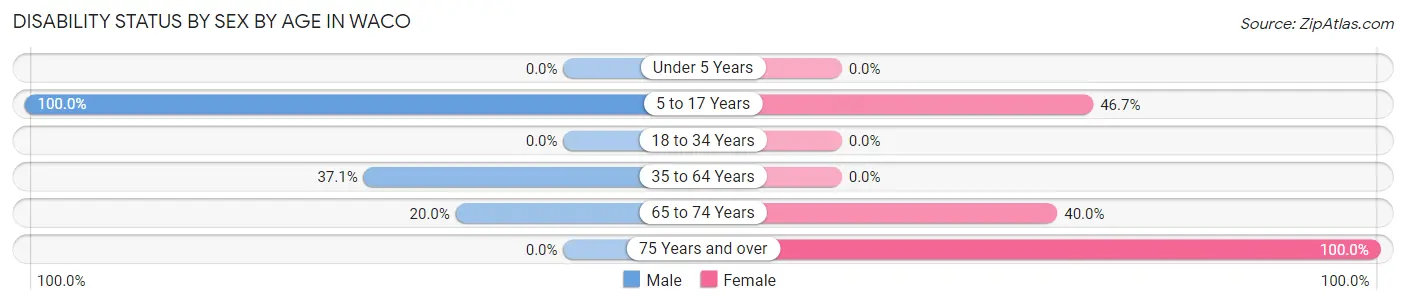
| Age Bracket | Male | Female |
| Under 5 Years | 0 (0.0%) | 0 (0.0%) |
| 5 to 17 Years | 4 (100.0%) | 7 (46.7%) |
| 18 to 34 Years | 0 (0.0%) | 0 (0.0%) |
| 35 to 64 Years | 23 (37.1%) | 0 (0.0%) |
| 65 to 74 Years | 1 (20.0%) | 2 (40.0%) |
| 75 Years and over | 0 (0.0%) | 1 (100.0%) |
Disability Class by Sex by Age in Waco
Disability Class: Hearing Difficulty
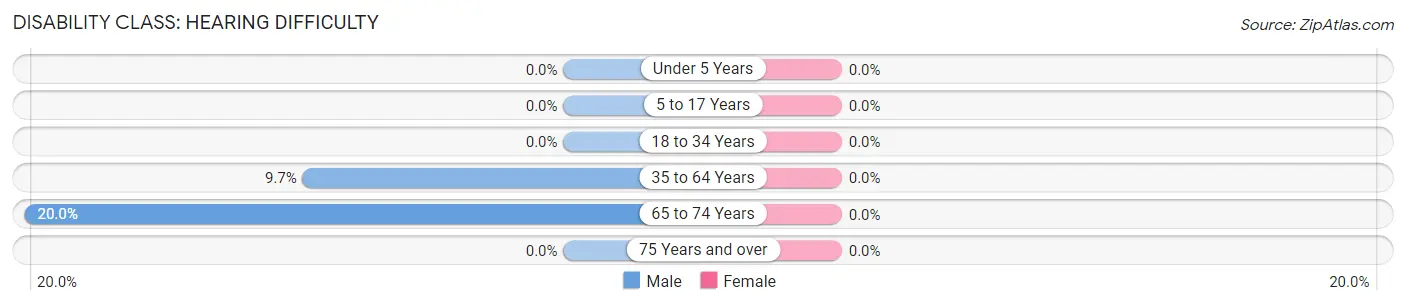
| Age Bracket | Male | Female |
| Under 5 Years | 0 (0.0%) | 0 (0.0%) |
| 5 to 17 Years | 0 (0.0%) | 0 (0.0%) |
| 18 to 34 Years | 0 (0.0%) | 0 (0.0%) |
| 35 to 64 Years | 6 (9.7%) | 0 (0.0%) |
| 65 to 74 Years | 1 (20.0%) | 0 (0.0%) |
| 75 Years and over | 0 (0.0%) | 0 (0.0%) |
Disability Class: Vision Difficulty
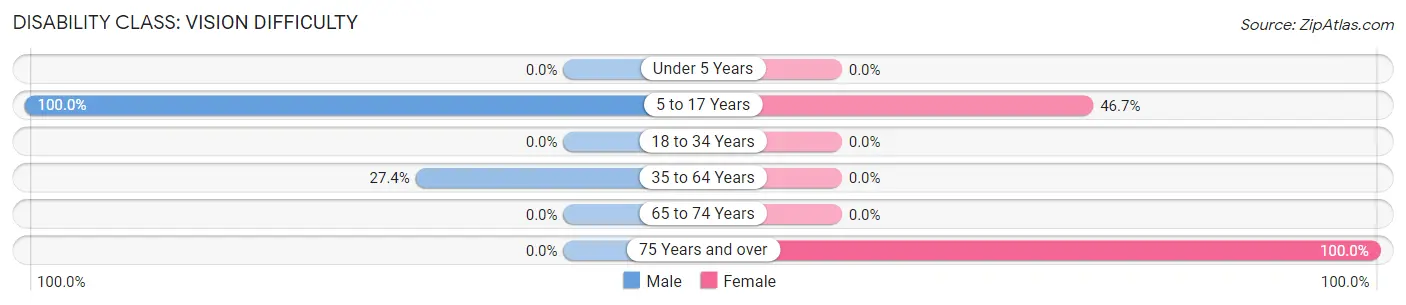
| Age Bracket | Male | Female |
| Under 5 Years | 0 (0.0%) | 0 (0.0%) |
| 5 to 17 Years | 4 (100.0%) | 7 (46.7%) |
| 18 to 34 Years | 0 (0.0%) | 0 (0.0%) |
| 35 to 64 Years | 17 (27.4%) | 0 (0.0%) |
| 65 to 74 Years | 0 (0.0%) | 0 (0.0%) |
| 75 Years and over | 0 (0.0%) | 1 (100.0%) |
Disability Class: Cognitive Difficulty
| Age Bracket | Male | Female |
| 5 to 17 Years | 0 (0.0%) | 0 (0.0%) |
| 18 to 34 Years | 0 (0.0%) | 0 (0.0%) |
| 35 to 64 Years | 0 (0.0%) | 0 (0.0%) |
| 65 to 74 Years | 0 (0.0%) | 0 (0.0%) |
| 75 Years and over | 0 (0.0%) | 0 (0.0%) |
Disability Class: Ambulatory Difficulty
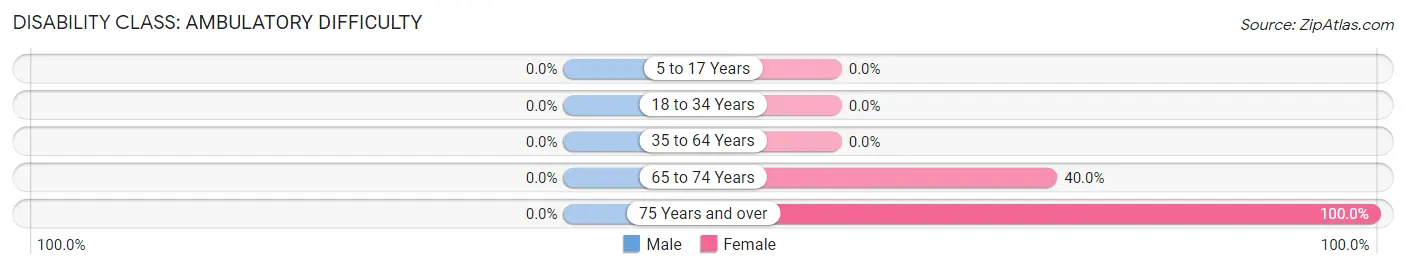
| Age Bracket | Male | Female |
| 5 to 17 Years | 0 (0.0%) | 0 (0.0%) |
| 18 to 34 Years | 0 (0.0%) | 0 (0.0%) |
| 35 to 64 Years | 0 (0.0%) | 0 (0.0%) |
| 65 to 74 Years | 0 (0.0%) | 2 (40.0%) |
| 75 Years and over | 0 (0.0%) | 1 (100.0%) |
Disability Class: Self-Care Difficulty
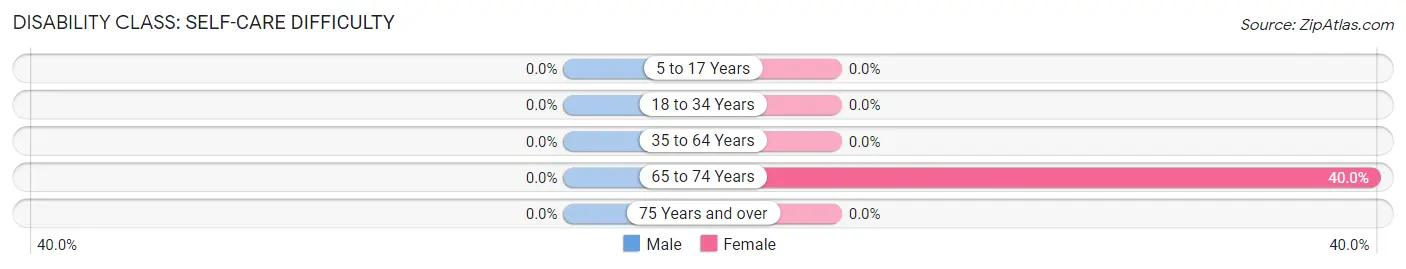
| Age Bracket | Male | Female |
| 5 to 17 Years | 0 (0.0%) | 0 (0.0%) |
| 18 to 34 Years | 0 (0.0%) | 0 (0.0%) |
| 35 to 64 Years | 0 (0.0%) | 0 (0.0%) |
| 65 to 74 Years | 0 (0.0%) | 2 (40.0%) |
| 75 Years and over | 0 (0.0%) | 0 (0.0%) |
Technology Access in Waco
Computing Device Access in Waco
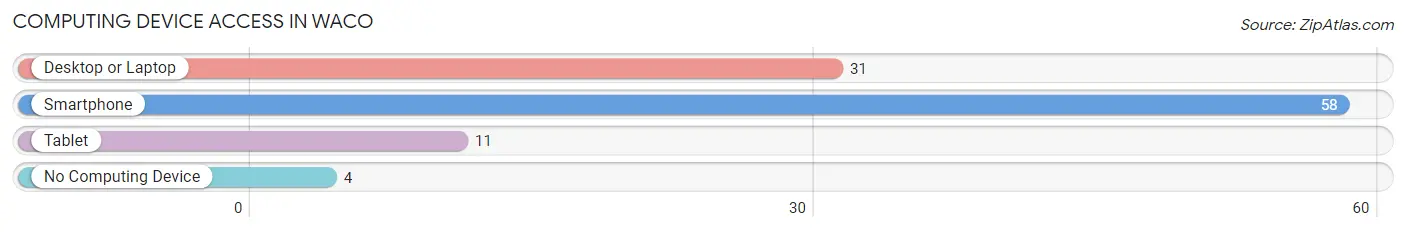
| Device Type | # Households | % Households |
| Desktop or Laptop | 31 | 47.0% |
| Smartphone | 58 | 87.9% |
| Tablet | 11 | 16.7% |
| No Computing Device | 4 | 6.1% |
| Total | 66 | 100.0% |
Internet Access in Waco
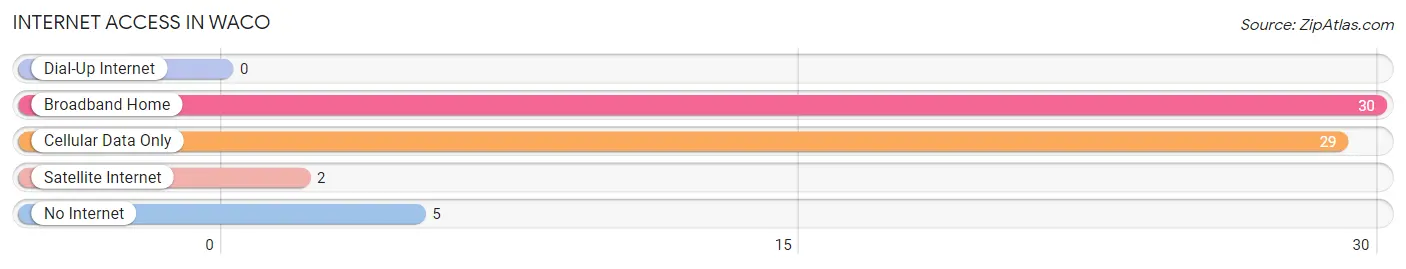
| Internet Type | # Households | % Households |
| Dial-Up Internet | 0 | 0.0% |
| Broadband Home | 30 | 45.5% |
| Cellular Data Only | 29 | 43.9% |
| Satellite Internet | 2 | 3.0% |
| No Internet | 5 | 7.6% |
| Total | 66 | 100.0% |
Waco Summary
Waco, Missouri is a small town located in the heart of the Ozarks in the southwestern part of the state. It is situated in the foothills of the Ozark Mountains, and is surrounded by rolling hills and lush forests. The town is located in the county of Laclede, and is part of the Lebanon Micropolitan Statistical Area. The population of Waco was estimated to be 1,072 in the year 2000, making it one of the smallest towns in the state.
History
The town of Waco was founded in 1845 by a group of settlers from Kentucky and Tennessee. The town was named after the Waco Indians, who were a Native American tribe that lived in the area. The town was originally a farming community, and the settlers grew corn, wheat, and other crops. The town also had a sawmill and a gristmill, which were used to process the crops.
In the late 1800s, the town began to grow and prosper. The railroad came to town in 1887, and the town became a hub for the surrounding area. The railroad brought new businesses and industries to the town, and the population began to grow.
Geography
Waco is located in the southwestern part of the state of Missouri, in the foothills of the Ozark Mountains. The town is situated in the county of Laclede, and is part of the Lebanon Micropolitan Statistical Area. The town is located at an elevation of 890 feet above sea level.
The town is surrounded by rolling hills and lush forests. The town is located near the Gasconade River, which is a tributary of the Missouri River. The town is also located near the Mark Twain National Forest, which is a popular destination for outdoor recreation.
Economy
The economy of Waco is largely based on agriculture and tourism. The town is home to several farms, which produce corn, wheat, soybeans, and other crops. The town is also home to several small businesses, including restaurants, shops, and other services.
The town is also a popular destination for tourists, who come to enjoy the natural beauty of the Ozark Mountains. The town is home to several parks and recreational areas, including the Mark Twain National Forest. The town is also home to several historic sites, including the Waco Historic District.
Demographics
The population of Waco was estimated to be 1,072 in the year 2000. The town is predominantly white, with a small African American population. The median household income in the town is $30,000, and the median age is 40. The town has a low unemployment rate, and the majority of the population is employed in the agricultural and tourism industries.
Conclusion
Waco, Missouri is a small town located in the heart of the Ozarks in the southwestern part of the state. The town was founded in 1845 by a group of settlers from Kentucky and Tennessee, and was named after the Waco Indians. The town is surrounded by rolling hills and lush forests, and is located near the Gasconade River and the Mark Twain National Forest. The economy of Waco is largely based on agriculture and tourism, and the population of the town was estimated to be 1,072 in the year 2000. The town is predominantly white, with a small African American population, and the median household income is $30,000.
Common Questions
What is Per Capita Income in Waco?
Per Capita income in Waco is $21,692.
What is the Median Family Income in Waco?
Median Family Income in Waco is $63,750.
What is the Median Household income in Waco?
Median Household Income in Waco is $53,833.
What is Income or Wage Gap in Waco?
Income or Wage Gap in Waco is 57.4%.
Women in Waco earn 42.6 cents for every dollar earned by a man.
What is Inequality or Gini Index in Waco?
Inequality or Gini Index in Waco is 0.34.
What is the Total Population of Waco?
Total Population of Waco is 185.
What is the Total Male Population of Waco?
Total Male Population of Waco is 100.
What is the Total Female Population of Waco?
Total Female Population of Waco is 85.
What is the Ratio of Males per 100 Females in Waco?
There are 117.65 Males per 100 Females in Waco.
What is the Ratio of Females per 100 Males in Waco?
There are 85.00 Females per 100 Males in Waco.
What is the Median Population Age in Waco?
Median Population Age in Waco is 46.6 Years.
What is the Average Family Size in Waco
Average Family Size in Waco is 3.7 People.
What is the Average Household Size in Waco
Average Household Size in Waco is 2.8 People.
How Large is the Labor Force in Waco?
There are 86 People in the Labor Forcein in Waco.
What is the Percentage of People in the Labor Force in Waco?
53.1% of People are in the Labor Force in Waco.
What is the Unemployment Rate in Waco?
Unemployment Rate in Waco is 16.3%.