Urbana, MO Map & Demographics
Urbana Map
Urbana Overview
$22,475
PER CAPITA INCOME
$47,000
AVG FAMILY INCOME
$34,063
AVG HOUSEHOLD INCOME
$13,831
FAMILY INCOME DEFICIT
0.49
INEQUALITY / GINI INDEX
452
TOTAL POPULATION
248
MALE POPULATION
204
FEMALE POPULATION
121.57
MALES / 100 FEMALES
82.26
FEMALES / 100 MALES
48.1
MEDIAN AGE
3.4
AVG FAMILY SIZE
2.6
AVG HOUSEHOLD SIZE
170
LABOR FORCE [ PEOPLE ]
44.5%
PERCENT IN LABOR FORCE
2.9%
UNEMPLOYMENT RATE
Urbana Zip Codes
Urbana Area Codes
Income in Urbana
Income Overview in Urbana
Per Capita Income in Urbana is $22,475, while median incomes of families and households are $47,000 and $34,063 respectively.
| Characteristic | Number | Measure |
| Per Capita Income | 452 | $22,475 |
| Median Family Income | 104 | $47,000 |
| Mean Family Income | 104 | $67,704 |
| Median Household Income | 169 | $34,063 |
| Mean Household Income | 169 | $52,522 |
| Income Deficit | 104 | $13,831 |
| Wage / Income Gap (%) | 452 | 0.00% |
| Wage / Income Gap ($) | 452 | 100.00¢ per $1 |
| Gini / Inequality Index | 452 | 0.49 |
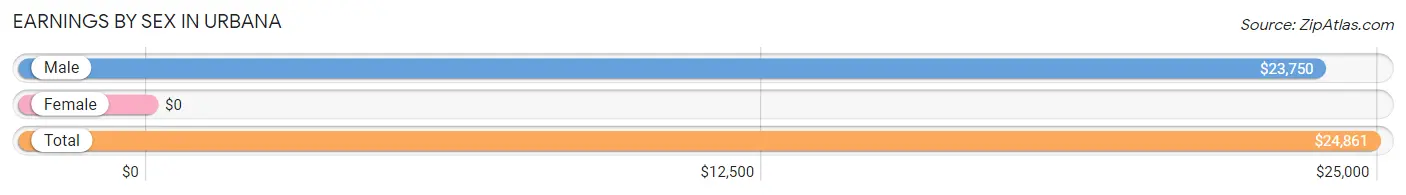
Earnings by Sex in Urbana
| Sex | Number | Average Earnings |
| Male | 108 (60.3%) | $23,750 |
| Female | 71 (39.7%) | $0 |
| Total | 179 (100.0%) | $24,861 |
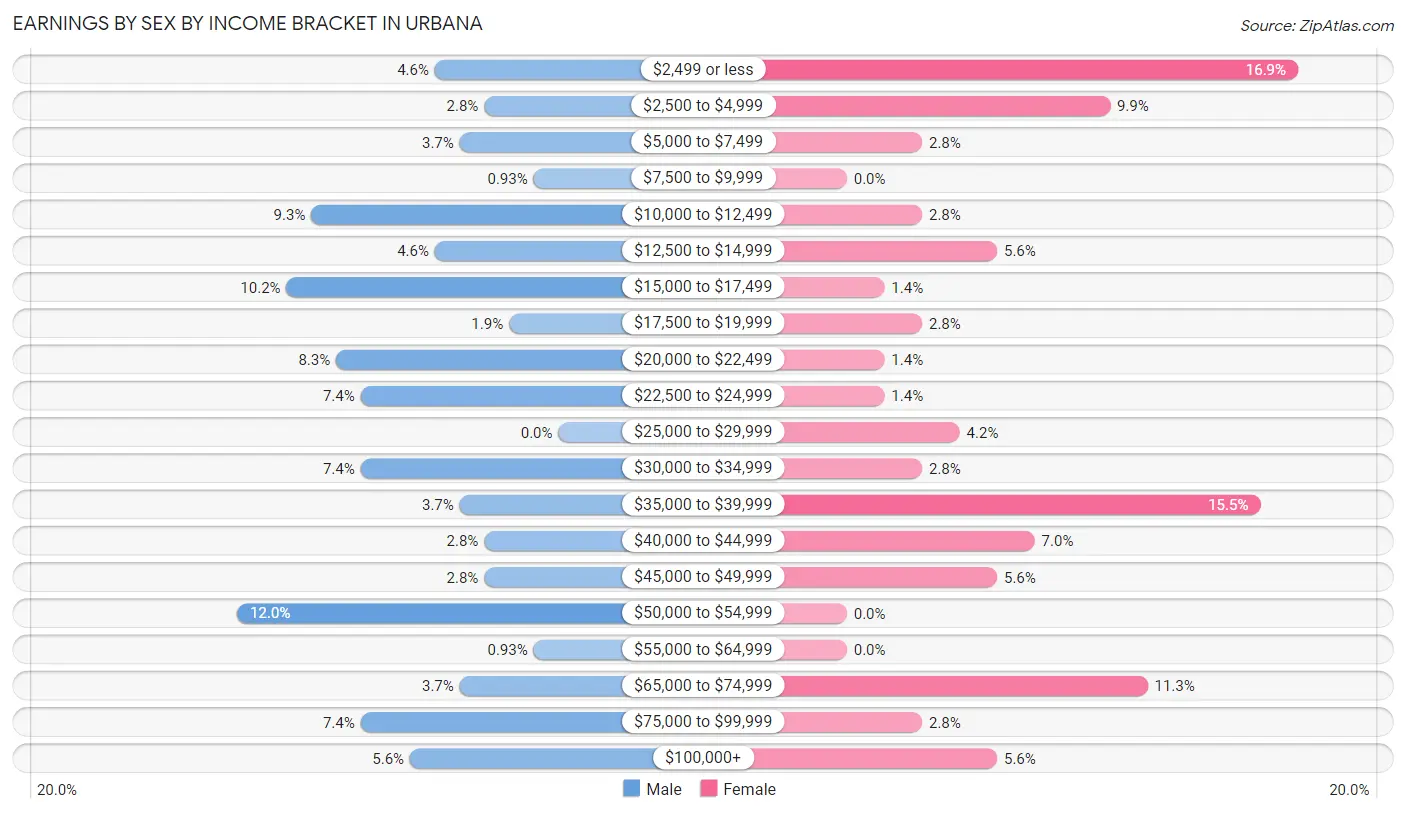
Earnings by Sex by Income Bracket in Urbana
The most common earnings brackets in Urbana are $50,000 to $54,999 for men (13 | 12.0%) and $2,499 or less for women (12 | 16.9%).
| Income | Male | Female |
| $2,499 or less | 5 (4.6%) | 12 (16.9%) |
| $2,500 to $4,999 | 3 (2.8%) | 7 (9.9%) |
| $5,000 to $7,499 | 4 (3.7%) | 2 (2.8%) |
| $7,500 to $9,999 | 1 (0.9%) | 0 (0.0%) |
| $10,000 to $12,499 | 10 (9.3%) | 2 (2.8%) |
| $12,500 to $14,999 | 5 (4.6%) | 4 (5.6%) |
| $15,000 to $17,499 | 11 (10.2%) | 1 (1.4%) |
| $17,500 to $19,999 | 2 (1.8%) | 2 (2.8%) |
| $20,000 to $22,499 | 9 (8.3%) | 1 (1.4%) |
| $22,500 to $24,999 | 8 (7.4%) | 1 (1.4%) |
| $25,000 to $29,999 | 0 (0.0%) | 3 (4.2%) |
| $30,000 to $34,999 | 8 (7.4%) | 2 (2.8%) |
| $35,000 to $39,999 | 4 (3.7%) | 11 (15.5%) |
| $40,000 to $44,999 | 3 (2.8%) | 5 (7.0%) |
| $45,000 to $49,999 | 3 (2.8%) | 4 (5.6%) |
| $50,000 to $54,999 | 13 (12.0%) | 0 (0.0%) |
| $55,000 to $64,999 | 1 (0.9%) | 0 (0.0%) |
| $65,000 to $74,999 | 4 (3.7%) | 8 (11.3%) |
| $75,000 to $99,999 | 8 (7.4%) | 2 (2.8%) |
| $100,000+ | 6 (5.6%) | 4 (5.6%) |
| Total | 108 (100.0%) | 71 (100.0%) |
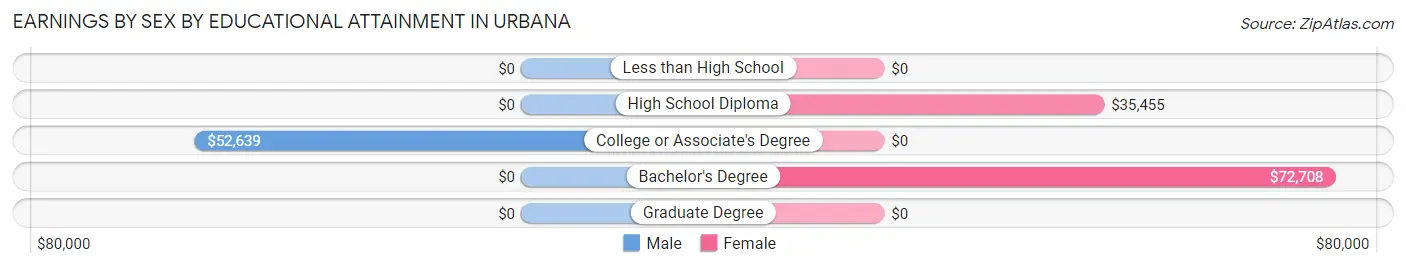
Earnings by Sex by Educational Attainment in Urbana
| Educational Attainment | Male Income | Female Income |
| Less than High School | - | - |
| High School Diploma | - | - |
| College or Associate's Degree | $52,639 | $0 |
| Bachelor's Degree | - | - |
| Graduate Degree | - | - |
| Total | - | - |
Family Income in Urbana
Family Income Brackets in Urbana
According to the Urbana family income data, there are 21 families falling into the $25,000 to $34,999 income range, which is the most common income bracket and makes up 20.2% of all families. Conversely, the $15,000 to $24,999 income bracket is the least frequent group with only 2 families (1.9%) belonging to this category.
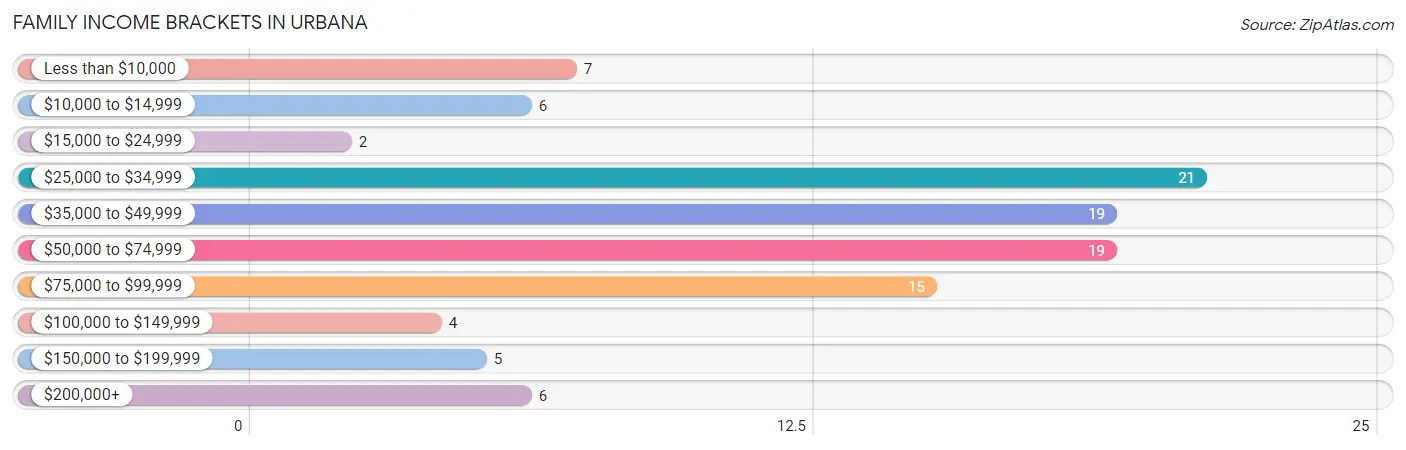
| Income Bracket | # Families | % Families |
| Less than $10,000 | 7 | 6.7% |
| $10,000 to $14,999 | 6 | 5.8% |
| $15,000 to $24,999 | 2 | 1.9% |
| $25,000 to $34,999 | 21 | 20.2% |
| $35,000 to $49,999 | 19 | 18.3% |
| $50,000 to $74,999 | 19 | 18.3% |
| $75,000 to $99,999 | 15 | 14.4% |
| $100,000 to $149,999 | 4 | 3.8% |
| $150,000 to $199,999 | 5 | 4.8% |
| $200,000+ | 6 | 5.8% |
Family Income by Famaliy Size in Urbana
5-person families (8 | 7.7%) account for the highest median family income in Urbana with $78,125 per family, while 2-person families (47 | 45.2%) have the highest median income of $24,688 per family member.
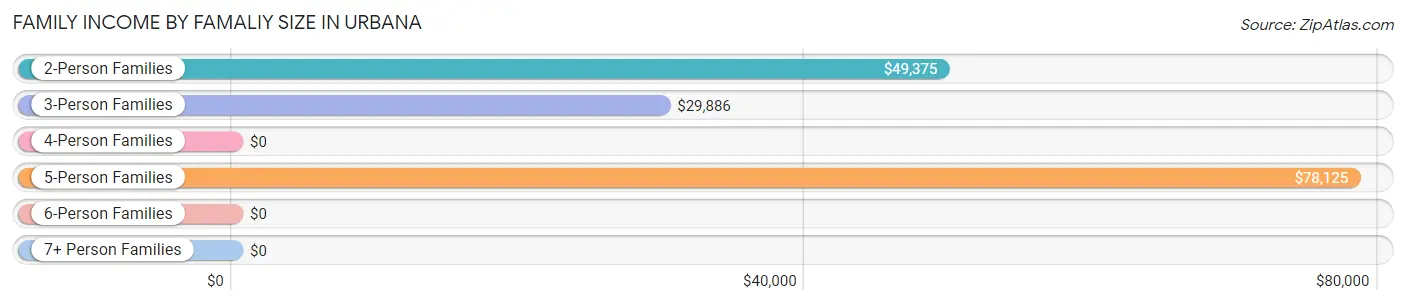
| Income Bracket | # Families | Median Income |
| 2-Person Families | 47 (45.2%) | $49,375 |
| 3-Person Families | 21 (20.2%) | $29,886 |
| 4-Person Families | 28 (26.9%) | $0 |
| 5-Person Families | 8 (7.7%) | $78,125 |
| 6-Person Families | 0 (0.0%) | $0 |
| 7+ Person Families | 0 (0.0%) | $0 |
| Total | 104 (100.0%) | $47,000 |
Family Income by Number of Earners in Urbana
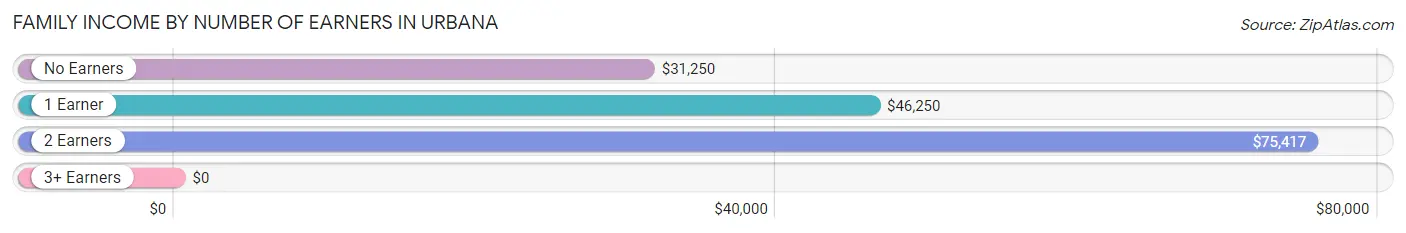
| Number of Earners | # Families | Median Income |
| No Earners | 18 (17.3%) | $31,250 |
| 1 Earner | 34 (32.7%) | $46,250 |
| 2 Earners | 49 (47.1%) | $75,417 |
| 3+ Earners | 3 (2.9%) | $0 |
| Total | 104 (100.0%) | $47,000 |
Household Income in Urbana
Household Income Brackets in Urbana
With 32 households falling in the category, the $25,000 to $34,999 income range is the most frequent in Urbana, accounting for 18.9% of all households. In contrast, only 5 households (3.0%) fall into the $150,000 to $199,999 income bracket, making it the least populous group.
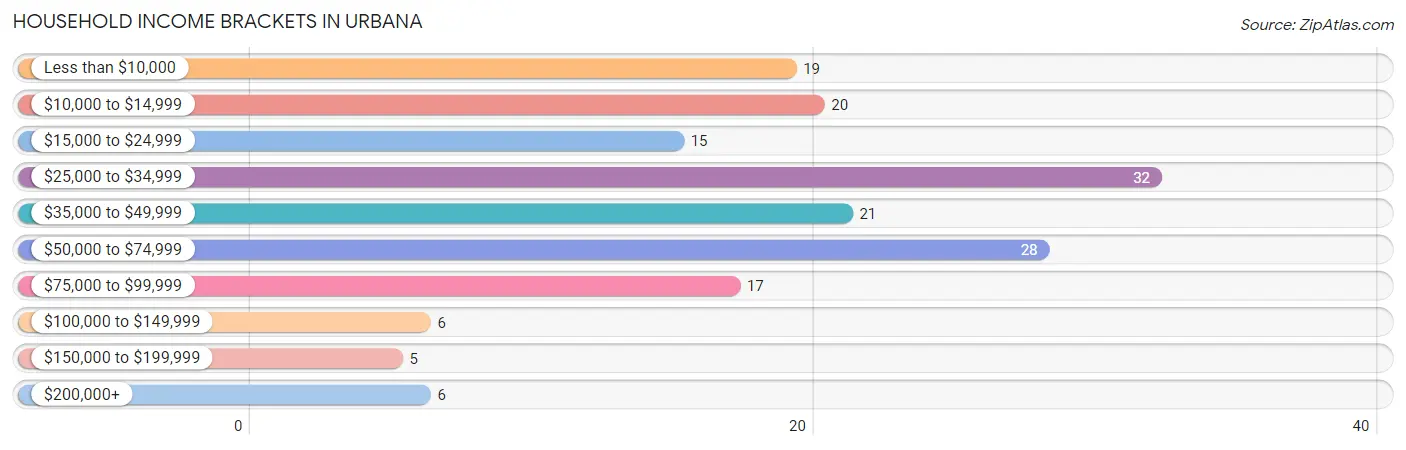
| Income Bracket | # Households | % Households |
| Less than $10,000 | 19 | 11.2% |
| $10,000 to $14,999 | 20 | 11.8% |
| $15,000 to $24,999 | 15 | 8.9% |
| $25,000 to $34,999 | 32 | 18.9% |
| $35,000 to $49,999 | 21 | 12.4% |
| $50,000 to $74,999 | 28 | 16.6% |
| $75,000 to $99,999 | 17 | 10.1% |
| $100,000 to $149,999 | 6 | 3.6% |
| $150,000 to $199,999 | 5 | 3.0% |
| $200,000+ | 6 | 3.6% |
Household Income by Householder Age in Urbana
The median household income in Urbana is $34,063, with the highest median household income of $50,208 found in the 25 to 44 years age bracket for the primary householder. A total of 31 households (18.3%) fall into this category. Meanwhile, the 15 to 24 years age bracket for the primary householder has the lowest median household income of $0, with 2 households (1.2%) in this group.
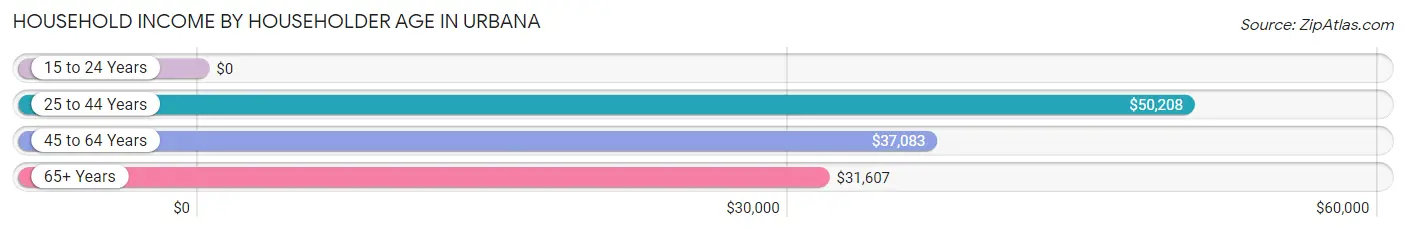
| Income Bracket | # Households | Median Income |
| 15 to 24 Years | 2 (1.2%) | $0 |
| 25 to 44 Years | 31 (18.3%) | $50,208 |
| 45 to 64 Years | 85 (50.3%) | $37,083 |
| 65+ Years | 51 (30.2%) | $31,607 |
| Total | 169 (100.0%) | $34,063 |
Poverty in Urbana
Income Below Poverty by Sex and Age in Urbana
With 27.3% poverty level for males and 26.5% for females among the residents of Urbana, 75 year old and over males and 15 year old females are the most vulnerable to poverty, with 2 males (66.7%) and 4 females (100.0%) in their respective age groups living below the poverty level.
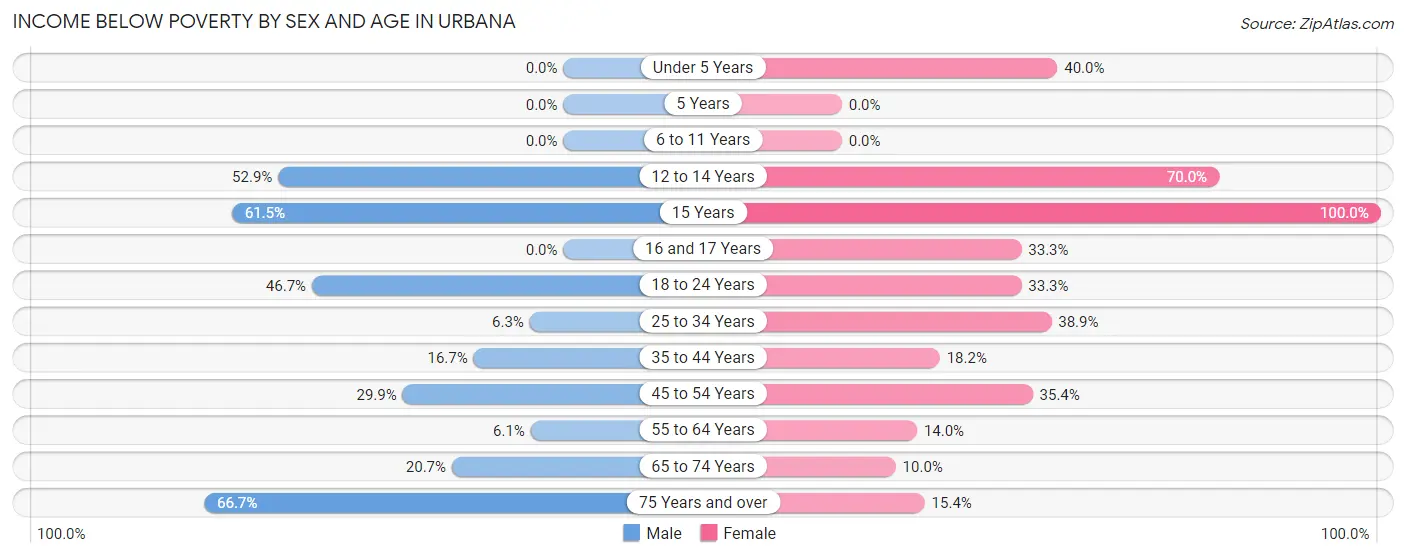
| Age Bracket | Male | Female |
| Under 5 Years | 0 (0.0%) | 2 (40.0%) |
| 5 Years | 0 (0.0%) | 0 (0.0%) |
| 6 to 11 Years | 0 (0.0%) | 0 (0.0%) |
| 12 to 14 Years | 9 (52.9%) | 7 (70.0%) |
| 15 Years | 8 (61.5%) | 4 (100.0%) |
| 16 and 17 Years | 0 (0.0%) | 2 (33.3%) |
| 18 to 24 Years | 14 (46.7%) | 1 (33.3%) |
| 25 to 34 Years | 1 (6.2%) | 7 (38.9%) |
| 35 to 44 Years | 3 (16.7%) | 4 (18.2%) |
| 45 to 54 Years | 20 (29.8%) | 17 (35.4%) |
| 55 to 64 Years | 2 (6.1%) | 6 (14.0%) |
| 65 to 74 Years | 6 (20.7%) | 2 (10.0%) |
| 75 Years and over | 2 (66.7%) | 2 (15.4%) |
| Total | 65 (27.3%) | 54 (26.5%) |
Income Above Poverty by Sex and Age in Urbana
According to the poverty statistics in Urbana, males aged under 5 years and females aged 5 years are the age groups that are most secure financially, with 100.0% of males and 100.0% of females in these age groups living above the poverty line.
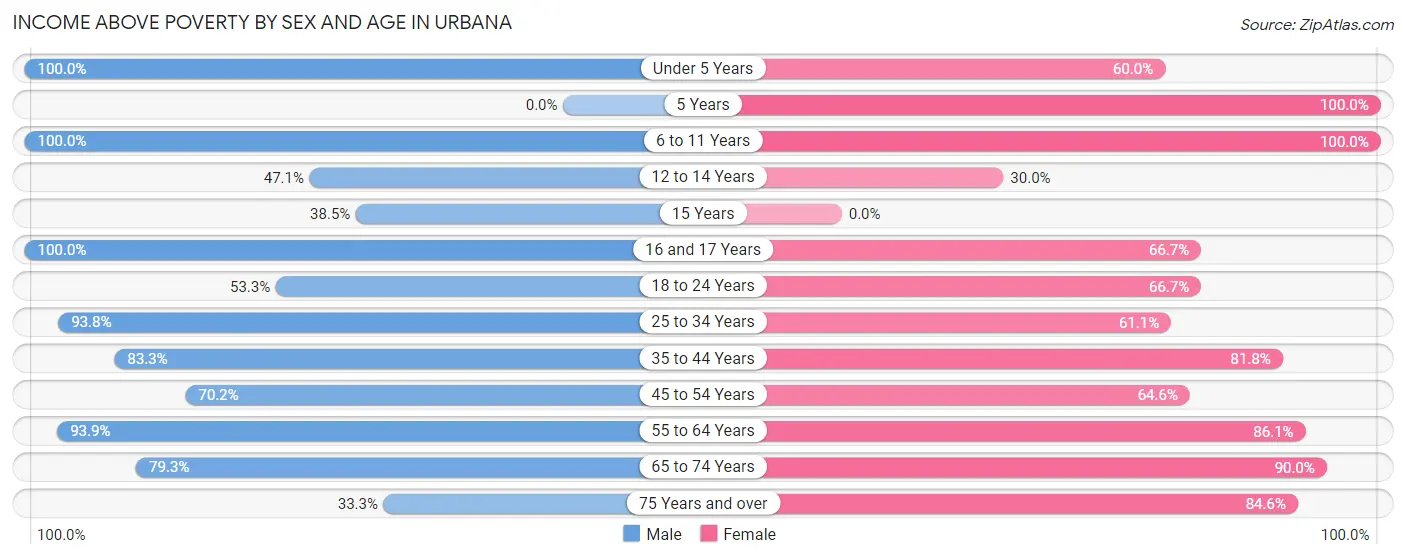
| Age Bracket | Male | Female |
| Under 5 Years | 5 (100.0%) | 3 (60.0%) |
| 5 Years | 0 (0.0%) | 2 (100.0%) |
| 6 to 11 Years | 4 (100.0%) | 10 (100.0%) |
| 12 to 14 Years | 8 (47.1%) | 3 (30.0%) |
| 15 Years | 5 (38.5%) | 0 (0.0%) |
| 16 and 17 Years | 3 (100.0%) | 4 (66.7%) |
| 18 to 24 Years | 16 (53.3%) | 2 (66.7%) |
| 25 to 34 Years | 15 (93.8%) | 11 (61.1%) |
| 35 to 44 Years | 15 (83.3%) | 18 (81.8%) |
| 45 to 54 Years | 47 (70.2%) | 31 (64.6%) |
| 55 to 64 Years | 31 (93.9%) | 37 (86.1%) |
| 65 to 74 Years | 23 (79.3%) | 18 (90.0%) |
| 75 Years and over | 1 (33.3%) | 11 (84.6%) |
| Total | 173 (72.7%) | 150 (73.5%) |
Income Below Poverty Among Married-Couple Families in Urbana
The poverty statistics for married-couple families in Urbana show that 9.5% or 8 of the total 84 families live below the poverty line. Families with 3 or 4 children have the highest poverty rate of 14.3%, comprising of 1 families. On the other hand, families with no children have the lowest poverty rate of 7.7%, which includes 4 families.
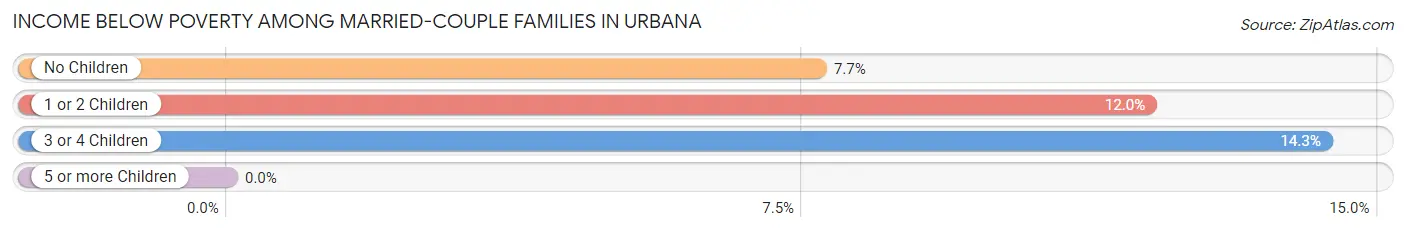
| Children | Above Poverty | Below Poverty |
| No Children | 48 (92.3%) | 4 (7.7%) |
| 1 or 2 Children | 22 (88.0%) | 3 (12.0%) |
| 3 or 4 Children | 6 (85.7%) | 1 (14.3%) |
| 5 or more Children | 0 (0.0%) | 0 (0.0%) |
| Total | 76 (90.5%) | 8 (9.5%) |
Income Below Poverty Among Single-Parent Households in Urbana
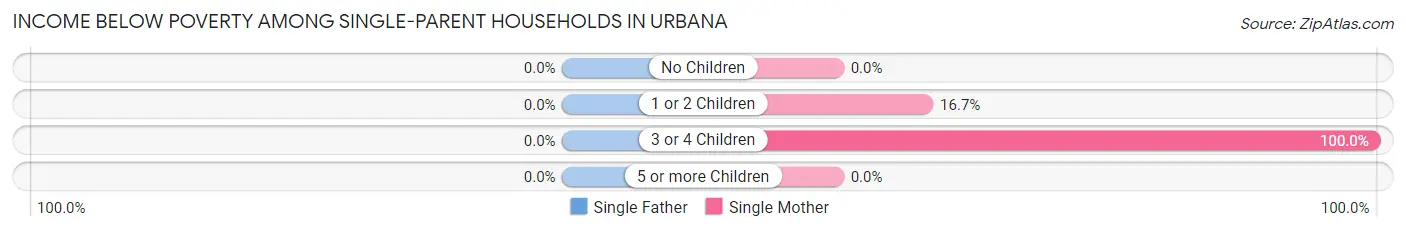
| Children | Single Father | Single Mother |
| No Children | 0 (0.0%) | 0 (0.0%) |
| 1 or 2 Children | 0 (0.0%) | 1 (16.7%) |
| 3 or 4 Children | 0 (0.0%) | 7 (100.0%) |
| 5 or more Children | 0 (0.0%) | 0 (0.0%) |
| Total | 0 (0.0%) | 8 (40.0%) |
Income Below Poverty Among Married-Couple vs Single-Parent Households in Urbana
The poverty data for Urbana shows that 8 of the married-couple family households (9.5%) and 8 of the single-parent households (40.0%) are living below the poverty level. Within the married-couple family households, those with 3 or 4 children have the highest poverty rate, with 1 households (14.3%) falling below the poverty line. Among the single-parent households, those with 3 or 4 children have the highest poverty rate, with 7 household (100.0%) living below poverty.
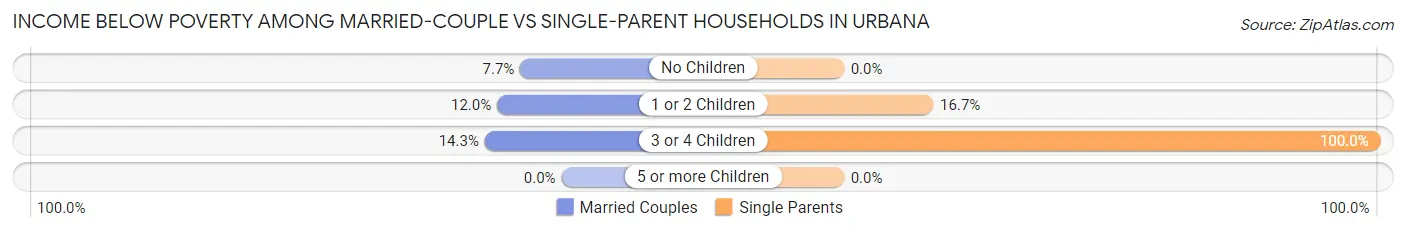
| Children | Married-Couple Families | Single-Parent Households |
| No Children | 4 (7.7%) | 0 (0.0%) |
| 1 or 2 Children | 3 (12.0%) | 1 (16.7%) |
| 3 or 4 Children | 1 (14.3%) | 7 (100.0%) |
| 5 or more Children | 0 (0.0%) | 0 (0.0%) |
| Total | 8 (9.5%) | 8 (40.0%) |
Race in Urbana
The most populous races in Urbana are White / Caucasian (384 | 85.0%), Two or more Races (48 | 10.6%), and Black / African American (10 | 2.2%).
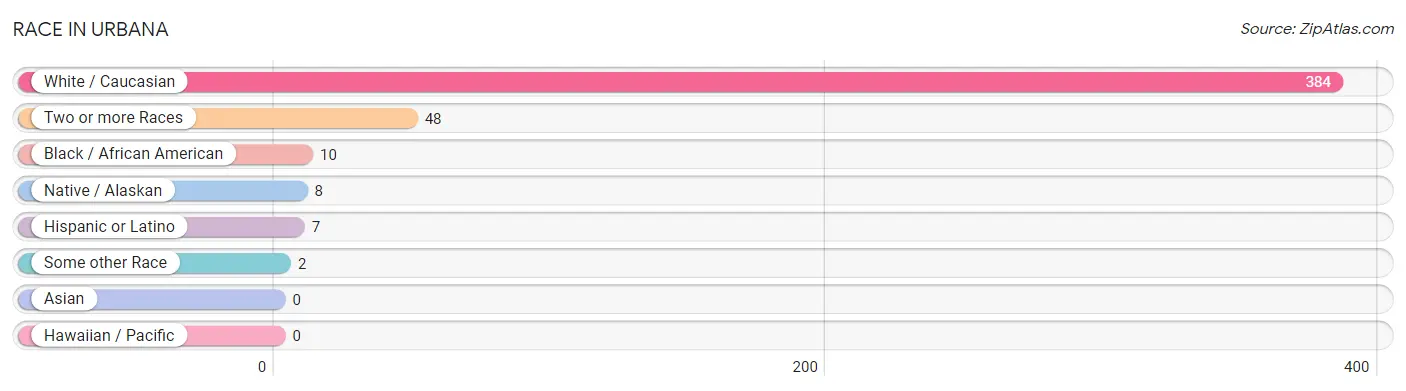
| Race | # Population | % Population |
| Asian | 0 | 0.0% |
| Black / African American | 10 | 2.2% |
| Hawaiian / Pacific | 0 | 0.0% |
| Hispanic or Latino | 7 | 1.5% |
| Native / Alaskan | 8 | 1.8% |
| White / Caucasian | 384 | 85.0% |
| Two or more Races | 48 | 10.6% |
| Some other Race | 2 | 0.4% |
| Total | 452 | 100.0% |
Ancestry in Urbana
The most populous ancestries reported in Urbana are German (90 | 19.9%), American (69 | 15.3%), English (59 | 13.1%), Cherokee (34 | 7.5%), and Irish (33 | 7.3%), together accounting for 63.0% of all Urbana residents.
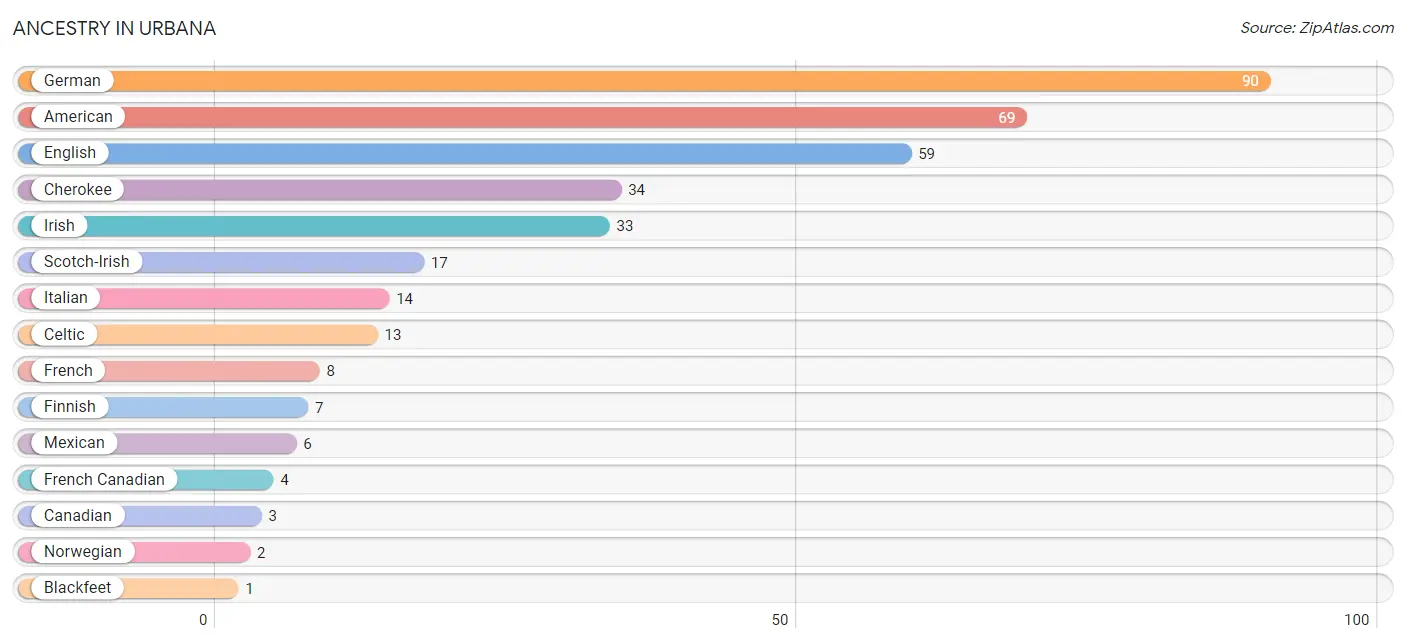
| Ancestry | # Population | % Population |
| American | 69 | 15.3% |
| Blackfeet | 1 | 0.2% |
| Canadian | 3 | 0.7% |
| Celtic | 13 | 2.9% |
| Cherokee | 34 | 7.5% |
| Dutch | 1 | 0.2% |
| English | 59 | 13.1% |
| Finnish | 7 | 1.5% |
| French | 8 | 1.8% |
| French Canadian | 4 | 0.9% |
| German | 90 | 19.9% |
| Irish | 33 | 7.3% |
| Italian | 14 | 3.1% |
| Mexican | 6 | 1.3% |
| Norwegian | 2 | 0.4% |
| Polish | 1 | 0.2% |
| Scotch-Irish | 17 | 3.8% |
| Scottish | 1 | 0.2% |
| Sioux | 1 | 0.2% | View All 19 Rows |
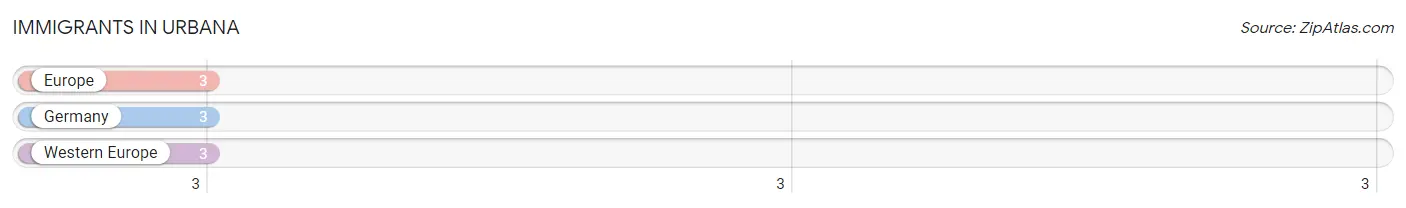
Immigrants in Urbana
The most numerous immigrant groups reported in Urbana came from Europe (3 | 0.7%), Germany (3 | 0.7%), and Western Europe (3 | 0.7%), together accounting for 2.0% of all Urbana residents.
| Immigration Origin | # Population | % Population |
| Europe | 3 | 0.7% |
| Germany | 3 | 0.7% |
| Western Europe | 3 | 0.7% | View All 3 Rows |
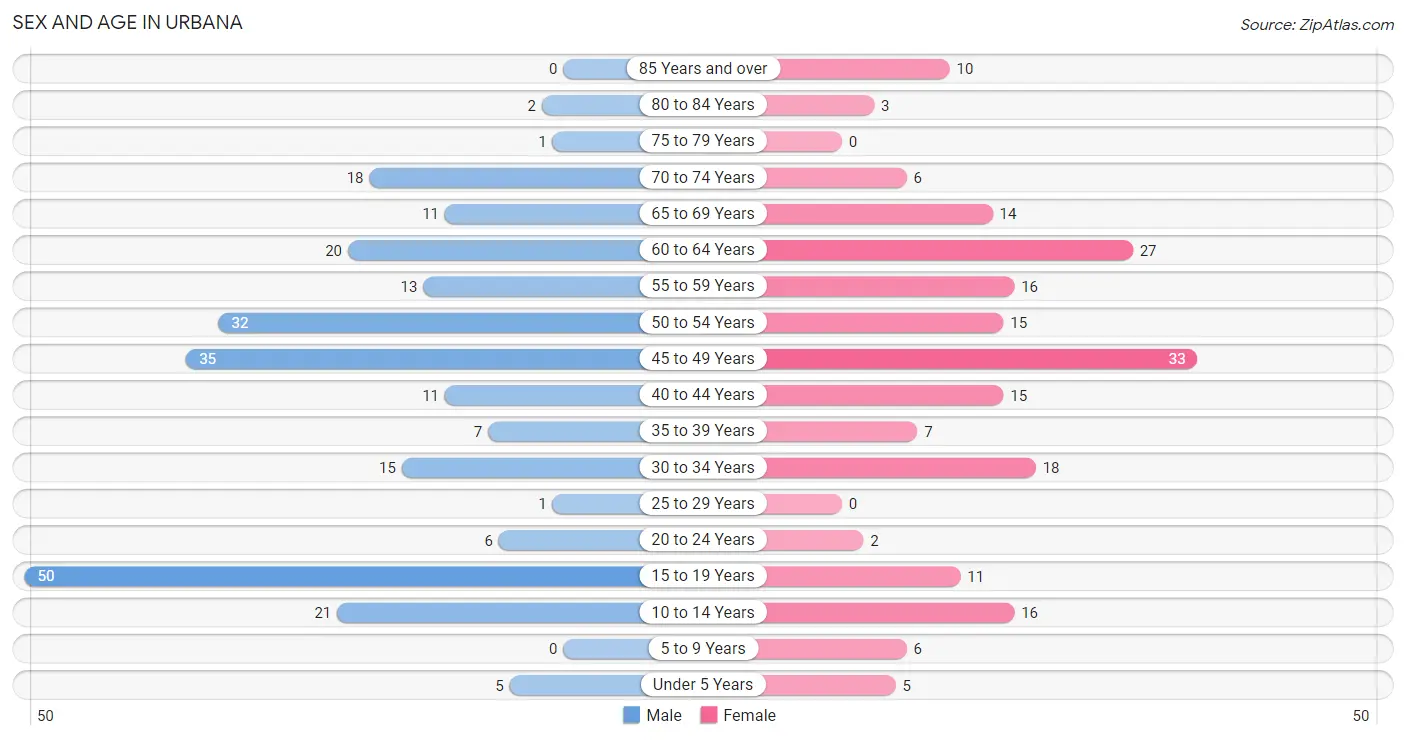
Sex and Age in Urbana
Sex and Age in Urbana
The most populous age groups in Urbana are 15 to 19 Years (50 | 20.2%) for men and 45 to 49 Years (33 | 16.2%) for women.
| Age Bracket | Male | Female |
| Under 5 Years | 5 (2.0%) | 5 (2.5%) |
| 5 to 9 Years | 0 (0.0%) | 6 (2.9%) |
| 10 to 14 Years | 21 (8.5%) | 16 (7.8%) |
| 15 to 19 Years | 50 (20.2%) | 11 (5.4%) |
| 20 to 24 Years | 6 (2.4%) | 2 (1.0%) |
| 25 to 29 Years | 1 (0.4%) | 0 (0.0%) |
| 30 to 34 Years | 15 (6.0%) | 18 (8.8%) |
| 35 to 39 Years | 7 (2.8%) | 7 (3.4%) |
| 40 to 44 Years | 11 (4.4%) | 15 (7.3%) |
| 45 to 49 Years | 35 (14.1%) | 33 (16.2%) |
| 50 to 54 Years | 32 (12.9%) | 15 (7.3%) |
| 55 to 59 Years | 13 (5.2%) | 16 (7.8%) |
| 60 to 64 Years | 20 (8.1%) | 27 (13.2%) |
| 65 to 69 Years | 11 (4.4%) | 14 (6.9%) |
| 70 to 74 Years | 18 (7.3%) | 6 (2.9%) |
| 75 to 79 Years | 1 (0.4%) | 0 (0.0%) |
| 80 to 84 Years | 2 (0.8%) | 3 (1.5%) |
| 85 Years and over | 0 (0.0%) | 10 (4.9%) |
| Total | 248 (100.0%) | 204 (100.0%) |
Families and Households in Urbana
Median Family Size in Urbana
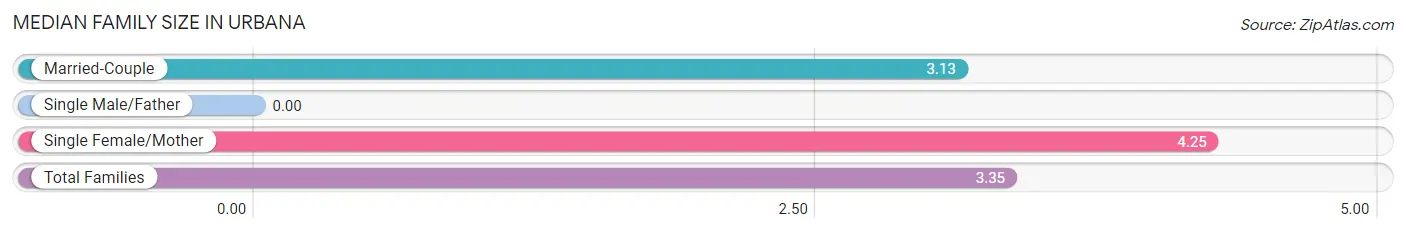
| Family Type | # Families | Family Size |
| Married-Couple | 84 (80.8%) | 3.13 |
| Single Male/Father | 0 (0.0%) | - |
| Single Female/Mother | 20 (19.2%) | 4.25 |
| Total Families | 104 (100.0%) | 3.35 |
Median Household Size in Urbana
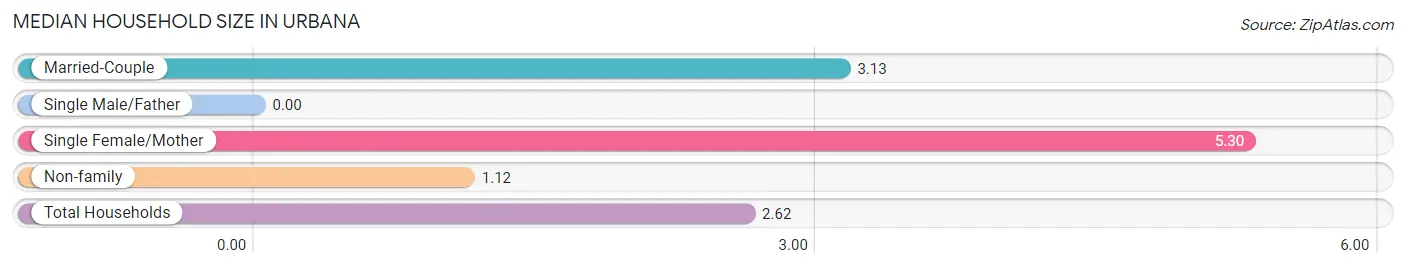
| Household Type | # Households | Household Size |
| Married-Couple | 84 (49.7%) | 3.13 |
| Single Male/Father | 0 (0.0%) | - |
| Single Female/Mother | 20 (11.8%) | 5.30 |
| Non-family | 65 (38.5%) | 1.12 |
| Total Households | 169 (100.0%) | 2.62 |
Household Size by Marriage Status in Urbana
Out of a total of 169 households in Urbana, 104 (61.5%) are family households, while 65 (38.5%) are nonfamily households. The most numerous type of family households are 2-person households, comprising 47, and the most common type of nonfamily households are 1-person households, comprising 58.
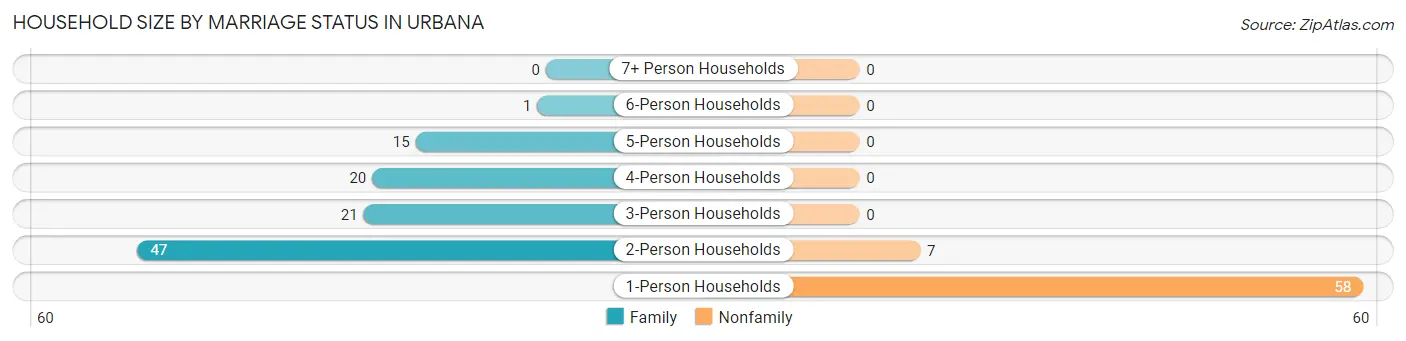
| Household Size | Family Households | Nonfamily Households |
| 1-Person Households | - | 58 (34.3%) |
| 2-Person Households | 47 (27.8%) | 7 (4.1%) |
| 3-Person Households | 21 (12.4%) | 0 (0.0%) |
| 4-Person Households | 20 (11.8%) | 0 (0.0%) |
| 5-Person Households | 15 (8.9%) | 0 (0.0%) |
| 6-Person Households | 1 (0.6%) | 0 (0.0%) |
| 7+ Person Households | 0 (0.0%) | 0 (0.0%) |
| Total | 104 (61.5%) | 65 (38.5%) |
Female Fertility in Urbana
Fertility by Age in Urbana
Average fertility rate in Urbana is 11.0 births per 1,000 women. Women in the age bracket of 15 to 19 years have the highest fertility rate with 91.0 births per 1,000 women. Women in the age bracket of 15 to 19 years acount for 100.0% of all women with births.
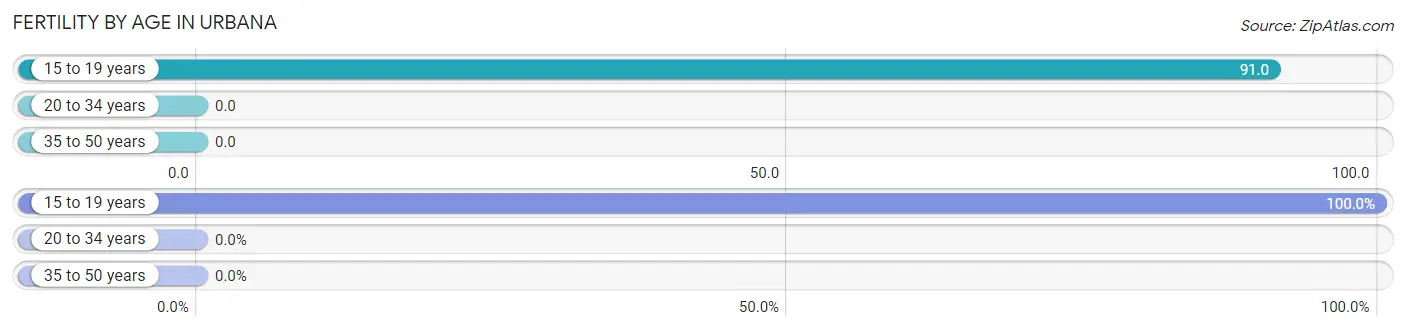
| Age Bracket | Women with Births | Births / 1,000 Women |
| 15 to 19 years | 1 (100.0%) | 91.0 |
| 20 to 34 years | 0 (0.0%) | 0.0 |
| 35 to 50 years | 0 (0.0%) | 0.0 |
| Total | 1 (100.0%) | 11.0 |
Fertility by Age by Marriage Status in Urbana
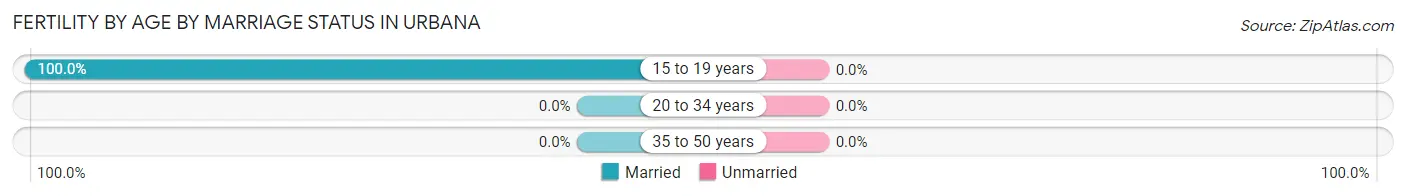
| Age Bracket | Married | Unmarried |
| 15 to 19 years | 1 (100.0%) | 0 (0.0%) |
| 20 to 34 years | 0 (0.0%) | 0 (0.0%) |
| 35 to 50 years | 0 (0.0%) | 0 (0.0%) |
| Total | 1 (100.0%) | 0 (0.0%) |
Fertility by Education in Urbana
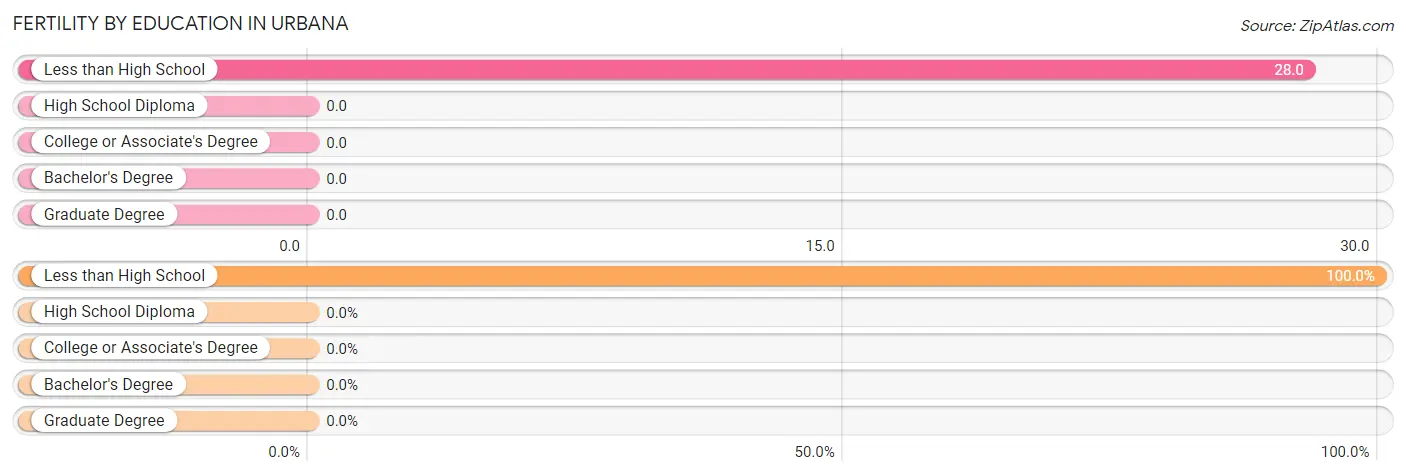
| Educational Attainment | Women with Births | Births / 1,000 Women |
| Less than High School | 1 (100.0%) | 28.0 |
| High School Diploma | 0 (0.0%) | 0.0 |
| College or Associate's Degree | 0 (0.0%) | 0.0 |
| Bachelor's Degree | 0 (0.0%) | 0.0 |
| Graduate Degree | 0 (0.0%) | 0.0 |
| Total | 1 (100.0%) | 11.0 |
Fertility by Education by Marriage Status in Urbana
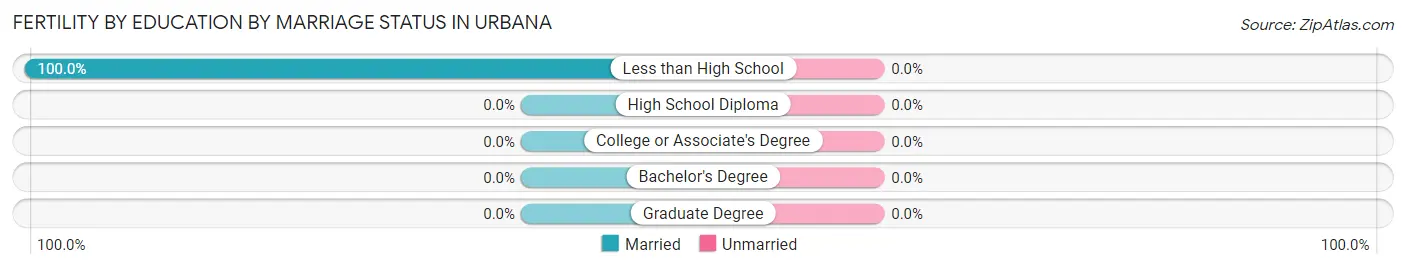
| Educational Attainment | Married | Unmarried |
| Less than High School | 1 (100.0%) | 0 (0.0%) |
| High School Diploma | 0 (0.0%) | 0 (0.0%) |
| College or Associate's Degree | 0 (0.0%) | 0 (0.0%) |
| Bachelor's Degree | 0 (0.0%) | 0 (0.0%) |
| Graduate Degree | 0 (0.0%) | 0 (0.0%) |
| Total | 1 (100.0%) | 0 (0.0%) |
Employment Characteristics in Urbana
Employment by Class of Employer in Urbana
Among the 163 employed individuals in Urbana, private company employees (105 | 64.4%), not-for-profit organizations (21 | 12.9%), and self-employed (not incorporated) (19 | 11.7%) make up the most common classes of employment.
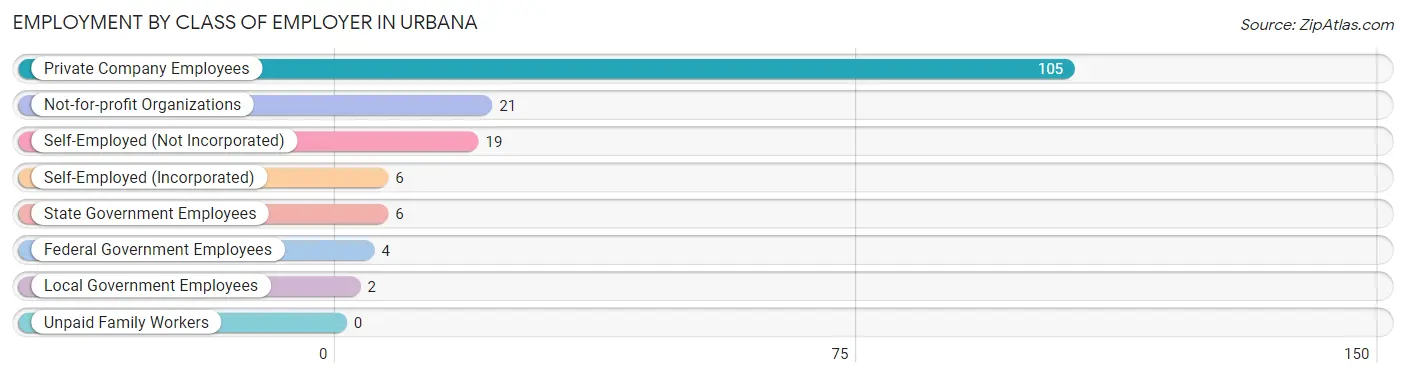
| Employer Class | # Employees | % Employees |
| Private Company Employees | 105 | 64.4% |
| Self-Employed (Incorporated) | 6 | 3.7% |
| Self-Employed (Not Incorporated) | 19 | 11.7% |
| Not-for-profit Organizations | 21 | 12.9% |
| Local Government Employees | 2 | 1.2% |
| State Government Employees | 6 | 3.7% |
| Federal Government Employees | 4 | 2.5% |
| Unpaid Family Workers | 0 | 0.0% |
| Total | 163 | 100.0% |
Employment Status by Age in Urbana
According to the labor force statistics for Urbana, out of the total population over 16 years of age (382), 44.5% or 170 individuals are in the labor force, with 2.9% or 5 of them unemployed. The age group with the highest labor force participation rate is 20 to 24 years, with 100.0% or 8 individuals in the labor force. Within the labor force, the 35 to 44 years age range has the highest percentage of unemployed individuals, with 8.6% or 3 of them being unemployed.
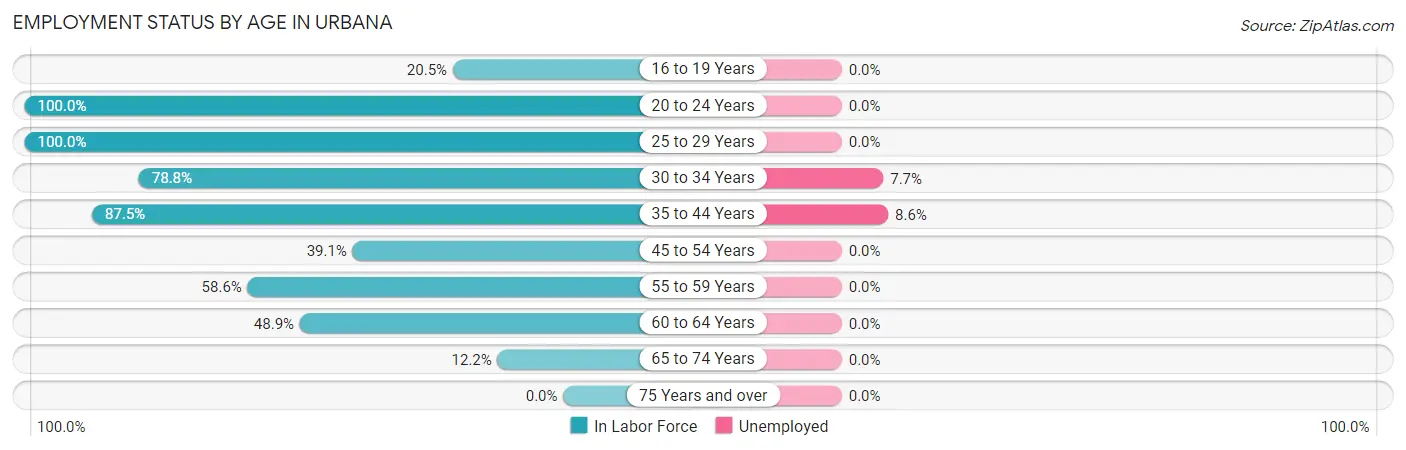
| Age Bracket | In Labor Force | Unemployed |
| 16 to 19 Years | 9 (20.5%) | 0 (0.0%) |
| 20 to 24 Years | 8 (100.0%) | 0 (0.0%) |
| 25 to 29 Years | 1 (100.0%) | 0 (0.0%) |
| 30 to 34 Years | 26 (78.8%) | 2 (7.7%) |
| 35 to 44 Years | 35 (87.5%) | 3 (8.6%) |
| 45 to 54 Years | 45 (39.1%) | 0 (0.0%) |
| 55 to 59 Years | 17 (58.6%) | 0 (0.0%) |
| 60 to 64 Years | 23 (48.9%) | 0 (0.0%) |
| 65 to 74 Years | 6 (12.2%) | 0 (0.0%) |
| 75 Years and over | 0 (0.0%) | 0 (0.0%) |
| Total | 170 (44.5%) | 5 (2.9%) |
Employment Status by Educational Attainment in Urbana
According to labor force statistics for Urbana, 55.5% of individuals (147) out of the total population between 25 and 64 years of age (265) are in the labor force, with 3.4% or 5 of them being unemployed. The group with the highest labor force participation rate are those with the educational attainment of high school diploma, with 66.7% or 72 individuals in the labor force. Within the labor force, individuals with high school diploma education have the highest percentage of unemployment, with 6.9% or 5 of them being unemployed.
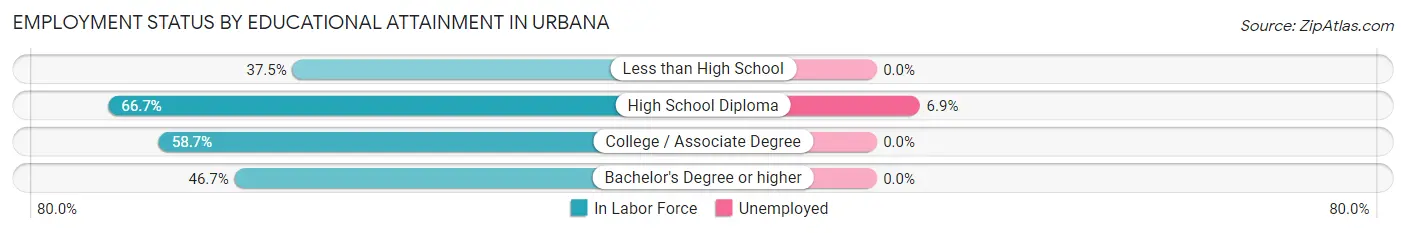
| Educational Attainment | In Labor Force | Unemployed |
| Less than High School | 24 (37.5%) | 0 (0.0%) |
| High School Diploma | 72 (66.7%) | 7 (6.9%) |
| College / Associate Degree | 37 (58.7%) | 0 (0.0%) |
| Bachelor's Degree or higher | 14 (46.7%) | 0 (0.0%) |
| Total | 147 (55.5%) | 9 (3.4%) |
Employment Occupations by Sex in Urbana
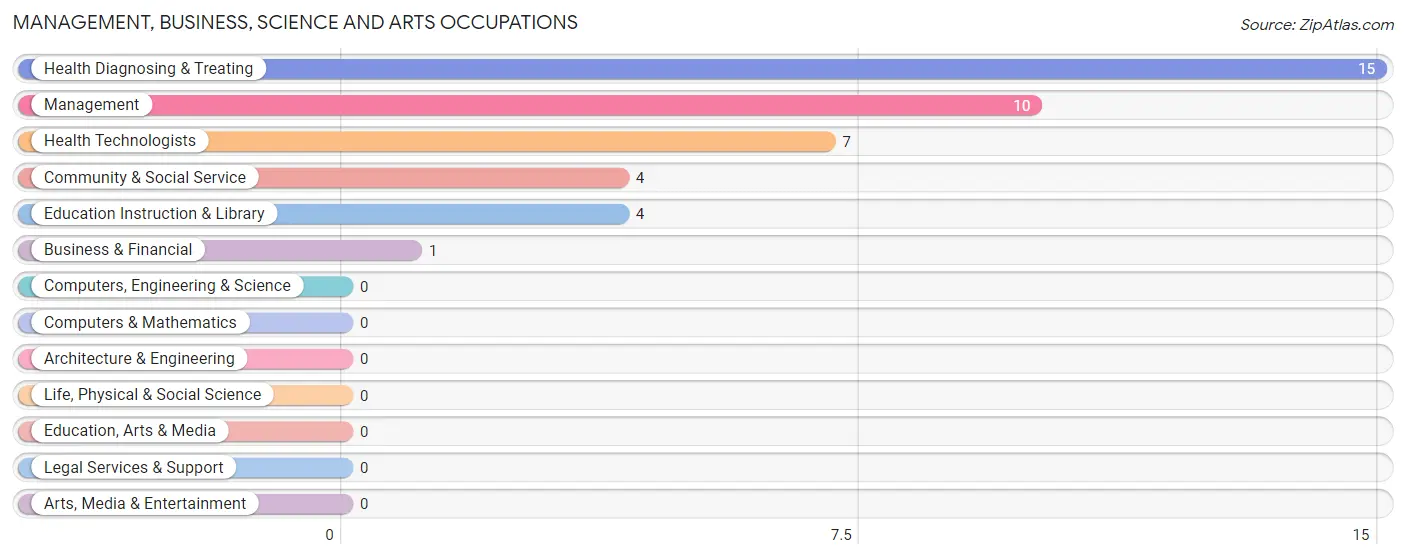
Management, Business, Science and Arts Occupations
The most common Management, Business, Science and Arts occupations in Urbana are Health Diagnosing & Treating (15 | 9.1%), Management (10 | 6.1%), Health Technologists (7 | 4.2%), Community & Social Service (4 | 2.4%), and Education Instruction & Library (4 | 2.4%).
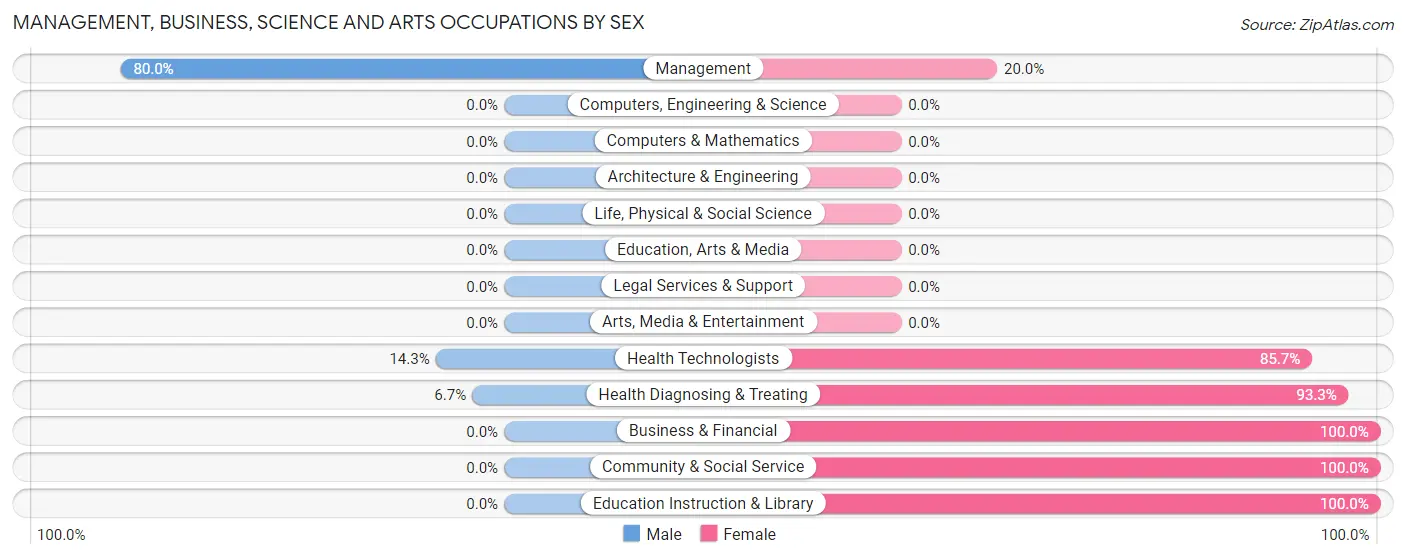
Management, Business, Science and Arts Occupations by Sex
Within the Management, Business, Science and Arts occupations in Urbana, the most male-oriented occupations are Management (80.0%), Health Technologists (14.3%), and Health Diagnosing & Treating (6.7%), while the most female-oriented occupations are Business & Financial (100.0%), Community & Social Service (100.0%), and Education Instruction & Library (100.0%).
| Occupation | Male | Female |
| Management | 8 (80.0%) | 2 (20.0%) |
| Business & Financial | 0 (0.0%) | 1 (100.0%) |
| Computers, Engineering & Science | 0 (0.0%) | 0 (0.0%) |
| Computers & Mathematics | 0 (0.0%) | 0 (0.0%) |
| Architecture & Engineering | 0 (0.0%) | 0 (0.0%) |
| Life, Physical & Social Science | 0 (0.0%) | 0 (0.0%) |
| Community & Social Service | 0 (0.0%) | 4 (100.0%) |
| Education, Arts & Media | 0 (0.0%) | 0 (0.0%) |
| Legal Services & Support | 0 (0.0%) | 0 (0.0%) |
| Education Instruction & Library | 0 (0.0%) | 4 (100.0%) |
| Arts, Media & Entertainment | 0 (0.0%) | 0 (0.0%) |
| Health Diagnosing & Treating | 1 (6.7%) | 14 (93.3%) |
| Health Technologists | 1 (14.3%) | 6 (85.7%) |
| Total (Category) | 9 (30.0%) | 21 (70.0%) |
| Total (Overall) | 99 (60.0%) | 66 (40.0%) |
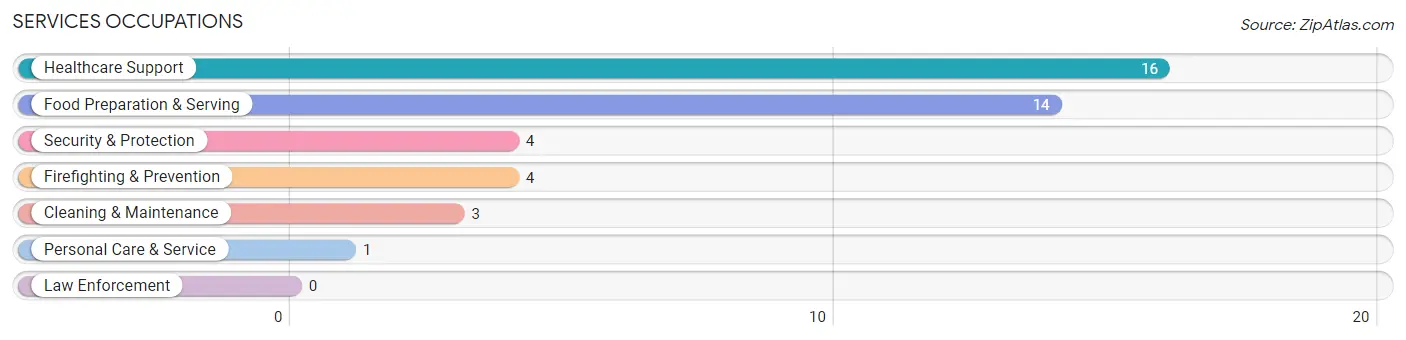
Services Occupations
The most common Services occupations in Urbana are Healthcare Support (16 | 9.7%), Food Preparation & Serving (14 | 8.5%), Security & Protection (4 | 2.4%), Firefighting & Prevention (4 | 2.4%), and Cleaning & Maintenance (3 | 1.8%).
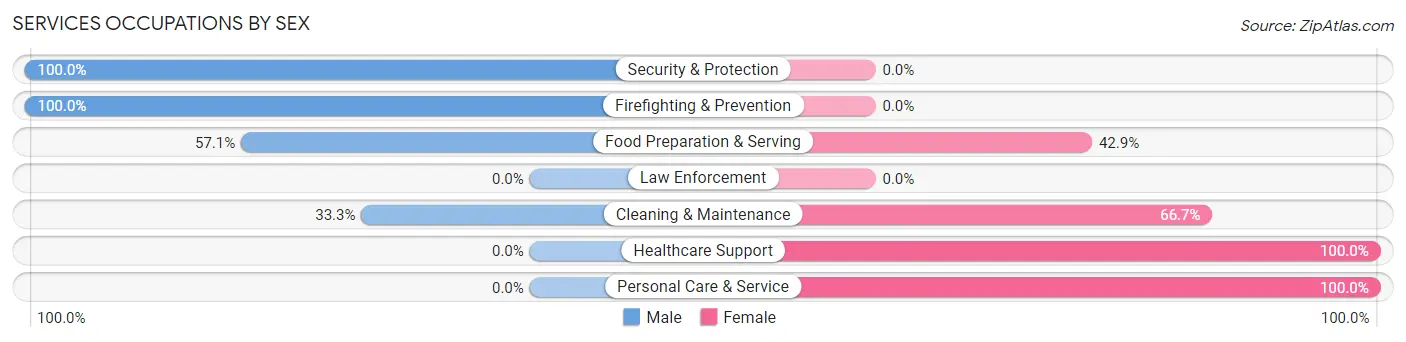
Services Occupations by Sex
Within the Services occupations in Urbana, the most male-oriented occupations are Security & Protection (100.0%), Firefighting & Prevention (100.0%), and Food Preparation & Serving (57.1%), while the most female-oriented occupations are Healthcare Support (100.0%), Personal Care & Service (100.0%), and Cleaning & Maintenance (66.7%).
| Occupation | Male | Female |
| Healthcare Support | 0 (0.0%) | 16 (100.0%) |
| Security & Protection | 4 (100.0%) | 0 (0.0%) |
| Firefighting & Prevention | 4 (100.0%) | 0 (0.0%) |
| Law Enforcement | 0 (0.0%) | 0 (0.0%) |
| Food Preparation & Serving | 8 (57.1%) | 6 (42.9%) |
| Cleaning & Maintenance | 1 (33.3%) | 2 (66.7%) |
| Personal Care & Service | 0 (0.0%) | 1 (100.0%) |
| Total (Category) | 13 (34.2%) | 25 (65.8%) |
| Total (Overall) | 99 (60.0%) | 66 (40.0%) |
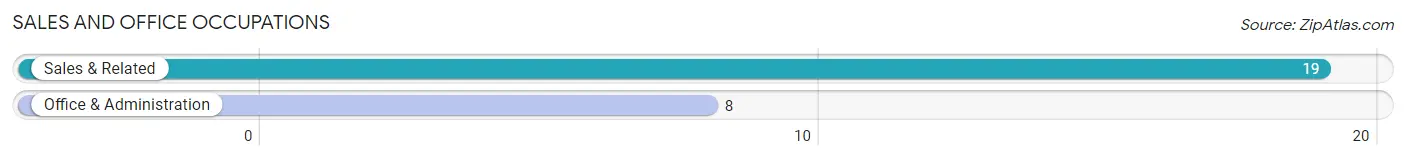
Sales and Office Occupations
The most common Sales and Office occupations in Urbana are Sales & Related (19 | 11.5%), and Office & Administration (8 | 4.9%).
Sales and Office Occupations by Sex
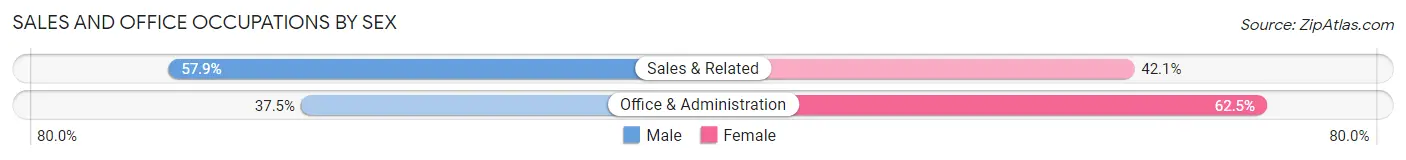
| Occupation | Male | Female |
| Sales & Related | 11 (57.9%) | 8 (42.1%) |
| Office & Administration | 3 (37.5%) | 5 (62.5%) |
| Total (Category) | 14 (51.8%) | 13 (48.1%) |
| Total (Overall) | 99 (60.0%) | 66 (40.0%) |
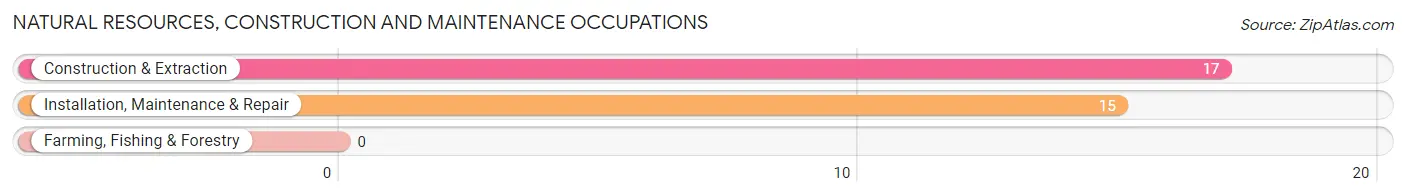
Natural Resources, Construction and Maintenance Occupations
The most common Natural Resources, Construction and Maintenance occupations in Urbana are Construction & Extraction (17 | 10.3%), and Installation, Maintenance & Repair (15 | 9.1%).
Natural Resources, Construction and Maintenance Occupations by Sex
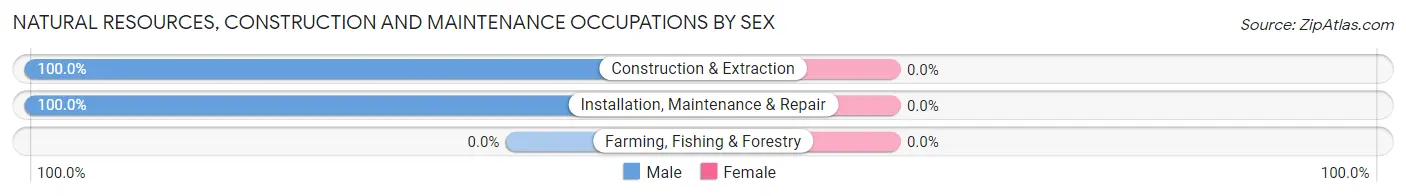
| Occupation | Male | Female |
| Farming, Fishing & Forestry | 0 (0.0%) | 0 (0.0%) |
| Construction & Extraction | 17 (100.0%) | 0 (0.0%) |
| Installation, Maintenance & Repair | 15 (100.0%) | 0 (0.0%) |
| Total (Category) | 32 (100.0%) | 0 (0.0%) |
| Total (Overall) | 99 (60.0%) | 66 (40.0%) |
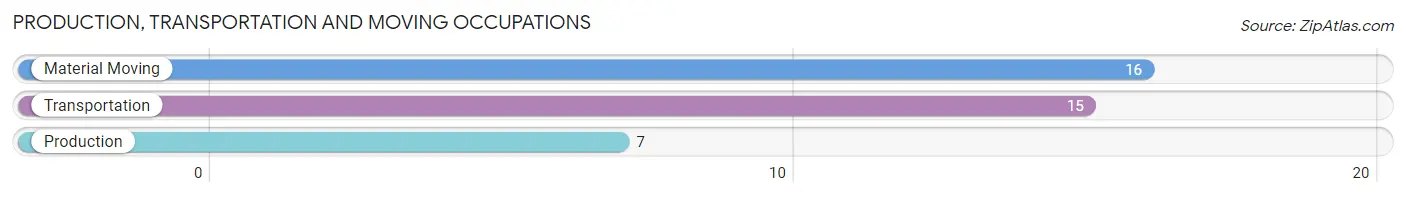
Production, Transportation and Moving Occupations
The most common Production, Transportation and Moving occupations in Urbana are Material Moving (16 | 9.7%), Transportation (15 | 9.1%), and Production (7 | 4.2%).
Production, Transportation and Moving Occupations by Sex
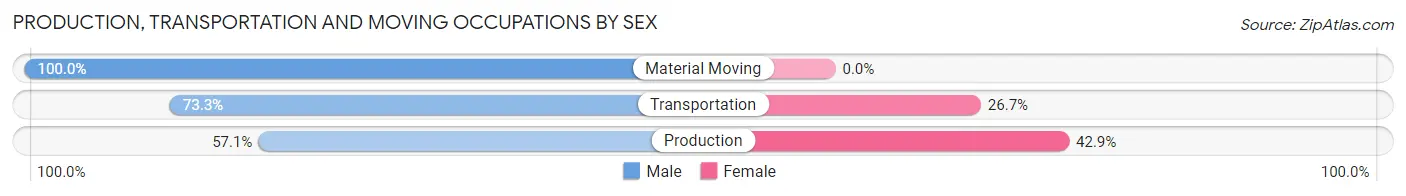
| Occupation | Male | Female |
| Production | 4 (57.1%) | 3 (42.9%) |
| Transportation | 11 (73.3%) | 4 (26.7%) |
| Material Moving | 16 (100.0%) | 0 (0.0%) |
| Total (Category) | 31 (81.6%) | 7 (18.4%) |
| Total (Overall) | 99 (60.0%) | 66 (40.0%) |
Employment Industries by Sex in Urbana
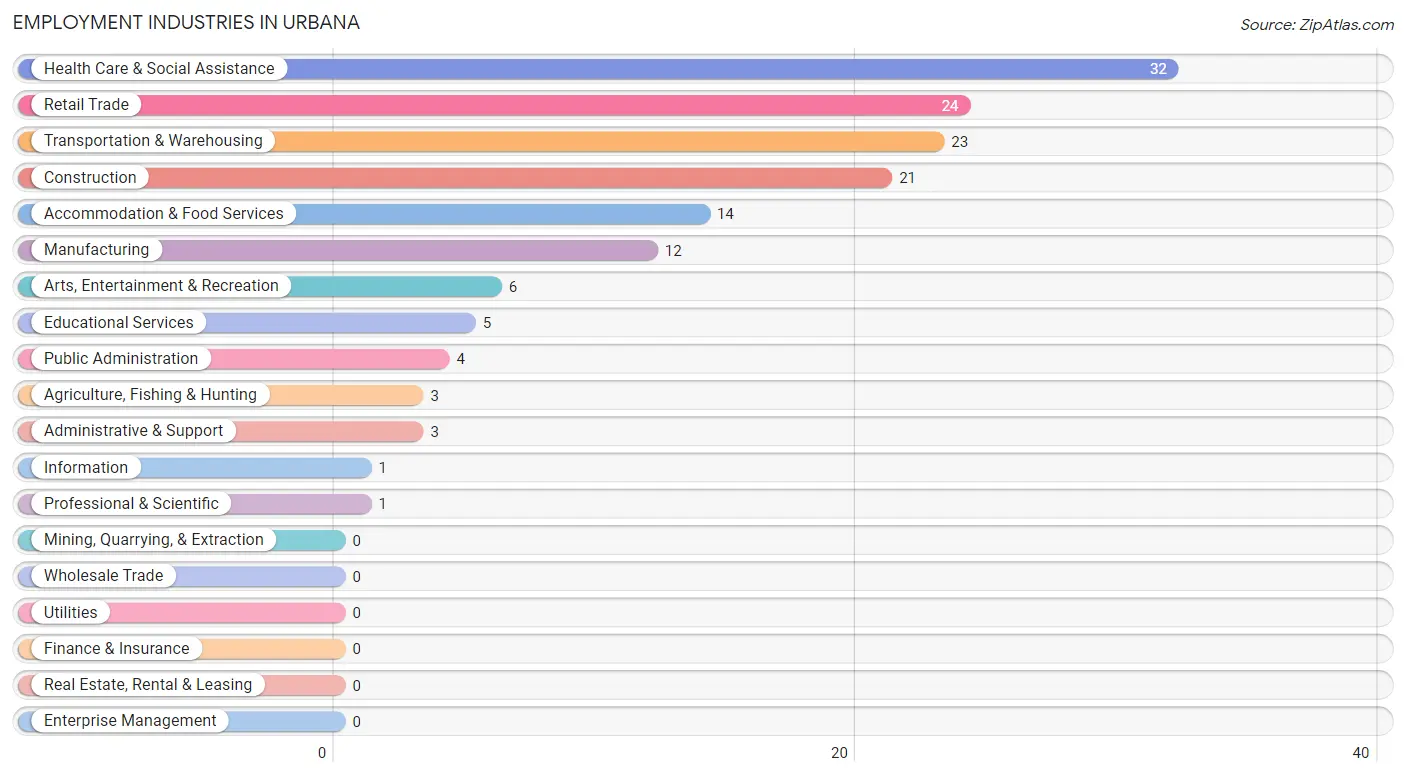
Employment Industries in Urbana
The major employment industries in Urbana include Health Care & Social Assistance (32 | 19.4%), Retail Trade (24 | 14.5%), Transportation & Warehousing (23 | 13.9%), Construction (21 | 12.7%), and Accommodation & Food Services (14 | 8.5%).
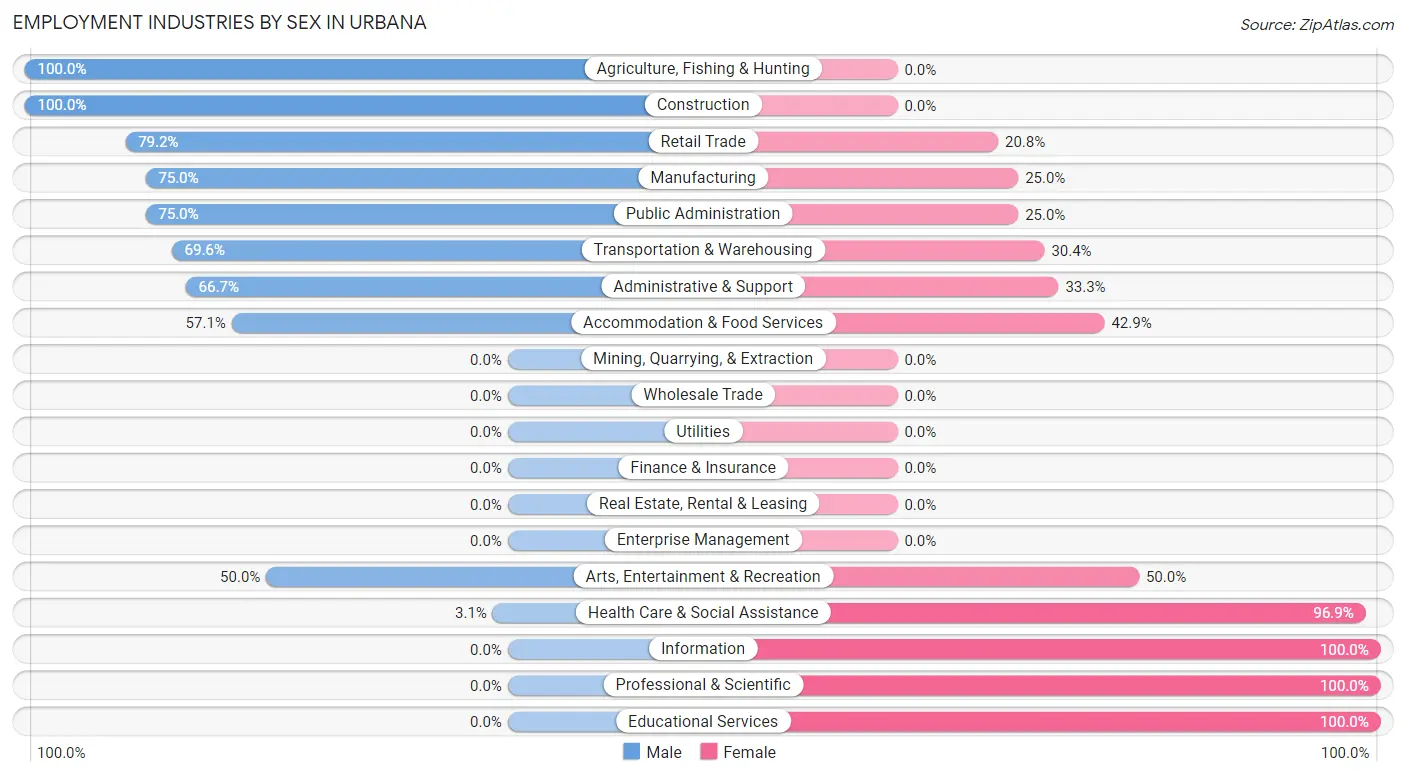
Employment Industries by Sex in Urbana
The Urbana industries that see more men than women are Agriculture, Fishing & Hunting (100.0%), Construction (100.0%), and Retail Trade (79.2%), whereas the industries that tend to have a higher number of women are Information (100.0%), Professional & Scientific (100.0%), and Educational Services (100.0%).
| Industry | Male | Female |
| Agriculture, Fishing & Hunting | 3 (100.0%) | 0 (0.0%) |
| Mining, Quarrying, & Extraction | 0 (0.0%) | 0 (0.0%) |
| Construction | 21 (100.0%) | 0 (0.0%) |
| Manufacturing | 9 (75.0%) | 3 (25.0%) |
| Wholesale Trade | 0 (0.0%) | 0 (0.0%) |
| Retail Trade | 19 (79.2%) | 5 (20.8%) |
| Transportation & Warehousing | 16 (69.6%) | 7 (30.4%) |
| Utilities | 0 (0.0%) | 0 (0.0%) |
| Information | 0 (0.0%) | 1 (100.0%) |
| Finance & Insurance | 0 (0.0%) | 0 (0.0%) |
| Real Estate, Rental & Leasing | 0 (0.0%) | 0 (0.0%) |
| Professional & Scientific | 0 (0.0%) | 1 (100.0%) |
| Enterprise Management | 0 (0.0%) | 0 (0.0%) |
| Administrative & Support | 2 (66.7%) | 1 (33.3%) |
| Educational Services | 0 (0.0%) | 5 (100.0%) |
| Health Care & Social Assistance | 1 (3.1%) | 31 (96.9%) |
| Arts, Entertainment & Recreation | 3 (50.0%) | 3 (50.0%) |
| Accommodation & Food Services | 8 (57.1%) | 6 (42.9%) |
| Public Administration | 3 (75.0%) | 1 (25.0%) |
| Total | 99 (60.0%) | 66 (40.0%) |
Education in Urbana
School Enrollment in Urbana
The most common levels of schooling among the 99 students in Urbana are high school (41 | 41.4%), middle school (30 | 30.3%), and elementary school (10 | 10.1%).
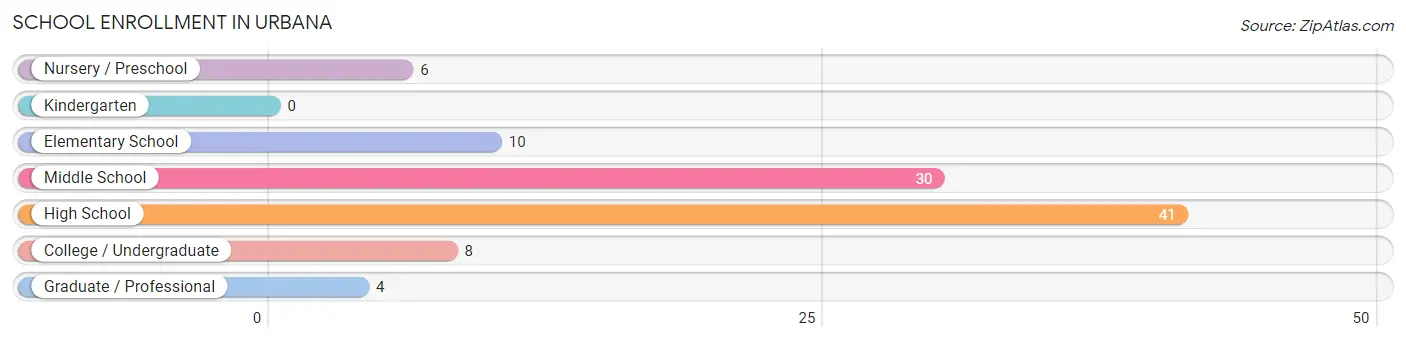
| School Level | # Students | % Students |
| Nursery / Preschool | 6 | 6.1% |
| Kindergarten | 0 | 0.0% |
| Elementary School | 10 | 10.1% |
| Middle School | 30 | 30.3% |
| High School | 41 | 41.4% |
| College / Undergraduate | 8 | 8.1% |
| Graduate / Professional | 4 | 4.0% |
| Total | 99 | 100.0% |
School Enrollment by Age by Funding Source in Urbana
Out of a total of 99 students who are enrolled in schools in Urbana, 15 (15.2%) attend a private institution, while the remaining 84 (84.8%) are enrolled in public schools. The age group of 5 to 9 year old has the highest likelihood of being enrolled in private schools, with 2 (33.3% in the age bracket) enrolled. Conversely, the age group of 3 to 4 year olds has the lowest likelihood of being enrolled in a private school, with 4 (100.0% in the age bracket) attending a public institution.
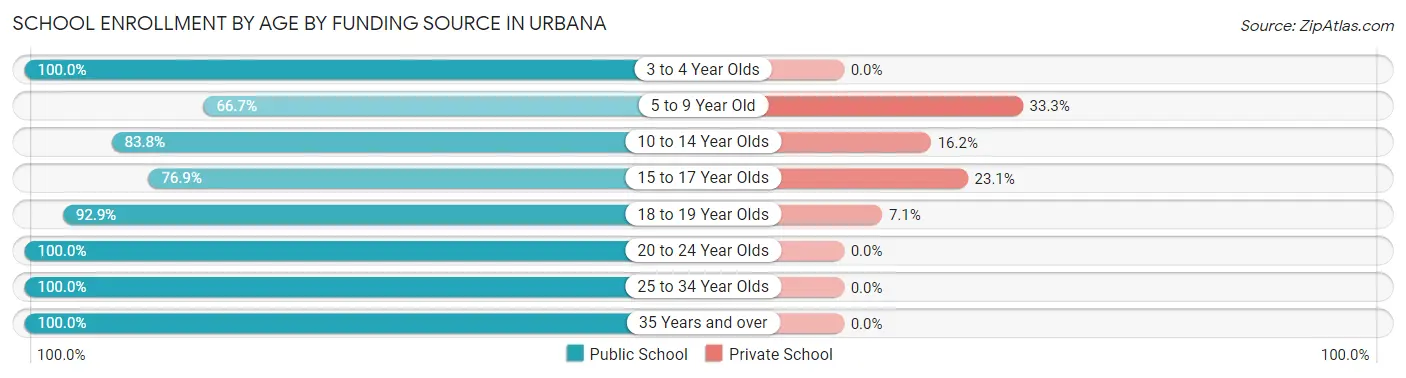
| Age Bracket | Public School | Private School |
| 3 to 4 Year Olds | 4 (100.0%) | 0 (0.0%) |
| 5 to 9 Year Old | 4 (66.7%) | 2 (33.3%) |
| 10 to 14 Year Olds | 31 (83.8%) | 6 (16.2%) |
| 15 to 17 Year Olds | 20 (76.9%) | 6 (23.1%) |
| 18 to 19 Year Olds | 13 (92.9%) | 1 (7.1%) |
| 20 to 24 Year Olds | 1 (100.0%) | 0 (0.0%) |
| 25 to 34 Year Olds | 4 (100.0%) | 0 (0.0%) |
| 35 Years and over | 7 (100.0%) | 0 (0.0%) |
| Total | 84 (84.8%) | 15 (15.2%) |
Educational Attainment by Field of Study in Urbana
Bio, nature & agricultural (13 | 36.1%), science & technology (13 | 36.1%), education (5 | 13.9%), psychology (3 | 8.3%), and computers & mathematics (1 | 2.8%) are the most common fields of study among 36 individuals in Urbana who have obtained a bachelor's degree or higher.
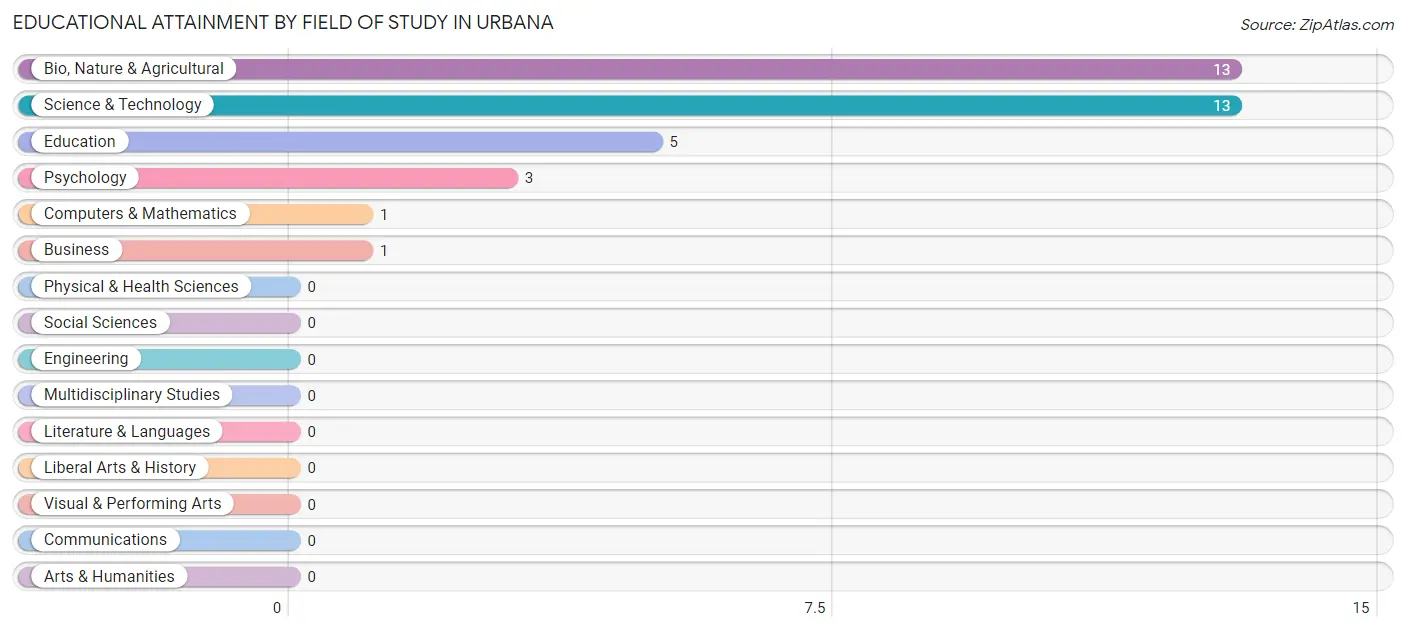
| Field of Study | # Graduates | % Graduates |
| Computers & Mathematics | 1 | 2.8% |
| Bio, Nature & Agricultural | 13 | 36.1% |
| Physical & Health Sciences | 0 | 0.0% |
| Psychology | 3 | 8.3% |
| Social Sciences | 0 | 0.0% |
| Engineering | 0 | 0.0% |
| Multidisciplinary Studies | 0 | 0.0% |
| Science & Technology | 13 | 36.1% |
| Business | 1 | 2.8% |
| Education | 5 | 13.9% |
| Literature & Languages | 0 | 0.0% |
| Liberal Arts & History | 0 | 0.0% |
| Visual & Performing Arts | 0 | 0.0% |
| Communications | 0 | 0.0% |
| Arts & Humanities | 0 | 0.0% |
| Total | 36 | 100.0% |
Transportation & Commute in Urbana
Vehicle Availability by Sex in Urbana
The most prevalent vehicle ownership categories in Urbana are males with 3 vehicles (50, accounting for 50.5%) and females with 3 vehicles (25, making up 78.1%).
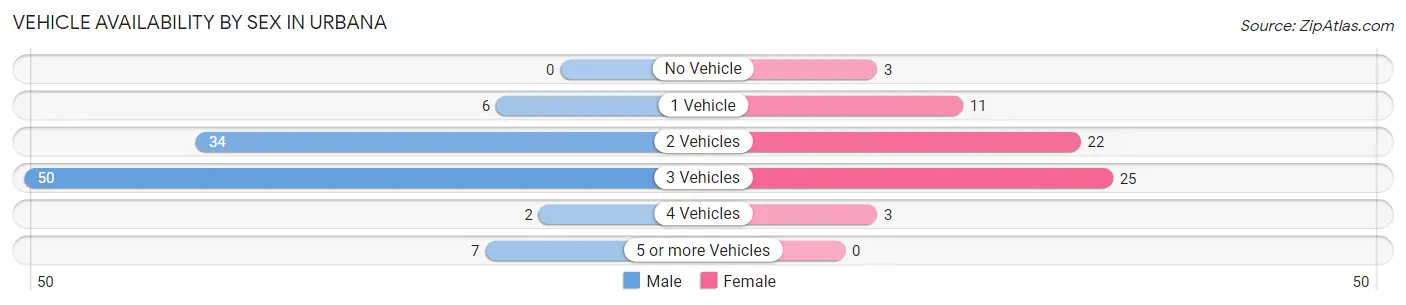
| Vehicles Available | Male | Female |
| No Vehicle | 0 (0.0%) | 3 (4.7%) |
| 1 Vehicle | 6 (6.1%) | 11 (17.2%) |
| 2 Vehicles | 34 (34.3%) | 22 (34.4%) |
| 3 Vehicles | 50 (50.5%) | 25 (39.1%) |
| 4 Vehicles | 2 (2.0%) | 3 (4.7%) |
| 5 or more Vehicles | 7 (7.1%) | 0 (0.0%) |
| Total | 99 (100.0%) | 64 (100.0%) |
Commute Time in Urbana
The most frequently occuring commute durations in Urbana are 45 to 59 minutes (34 commuters, 21.0%), 30 to 34 minutes (31 commuters, 19.1%), and 60 to 89 minutes (28 commuters, 17.3%).
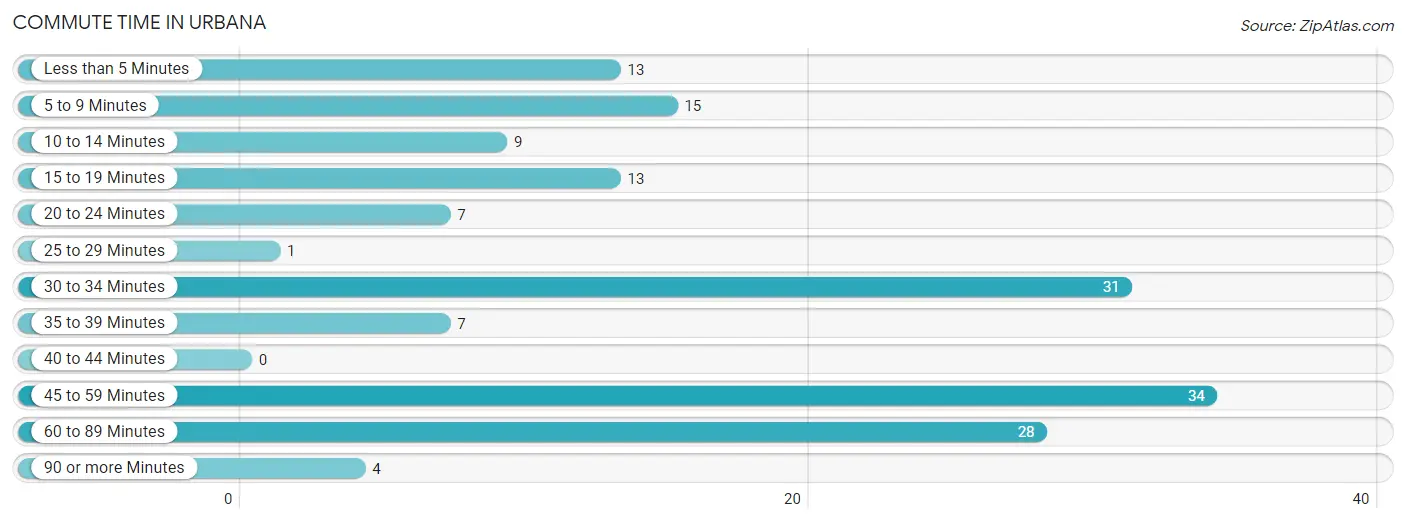
| Commute Time | # Commuters | % Commuters |
| Less than 5 Minutes | 13 | 8.0% |
| 5 to 9 Minutes | 15 | 9.3% |
| 10 to 14 Minutes | 9 | 5.6% |
| 15 to 19 Minutes | 13 | 8.0% |
| 20 to 24 Minutes | 7 | 4.3% |
| 25 to 29 Minutes | 1 | 0.6% |
| 30 to 34 Minutes | 31 | 19.1% |
| 35 to 39 Minutes | 7 | 4.3% |
| 40 to 44 Minutes | 0 | 0.0% |
| 45 to 59 Minutes | 34 | 21.0% |
| 60 to 89 Minutes | 28 | 17.3% |
| 90 or more Minutes | 4 | 2.5% |
Commute Time by Sex in Urbana
The most common commute times in Urbana are 45 to 59 minutes (29 commuters, 29.6%) for males and 30 to 34 minutes (18 commuters, 28.1%) for females.
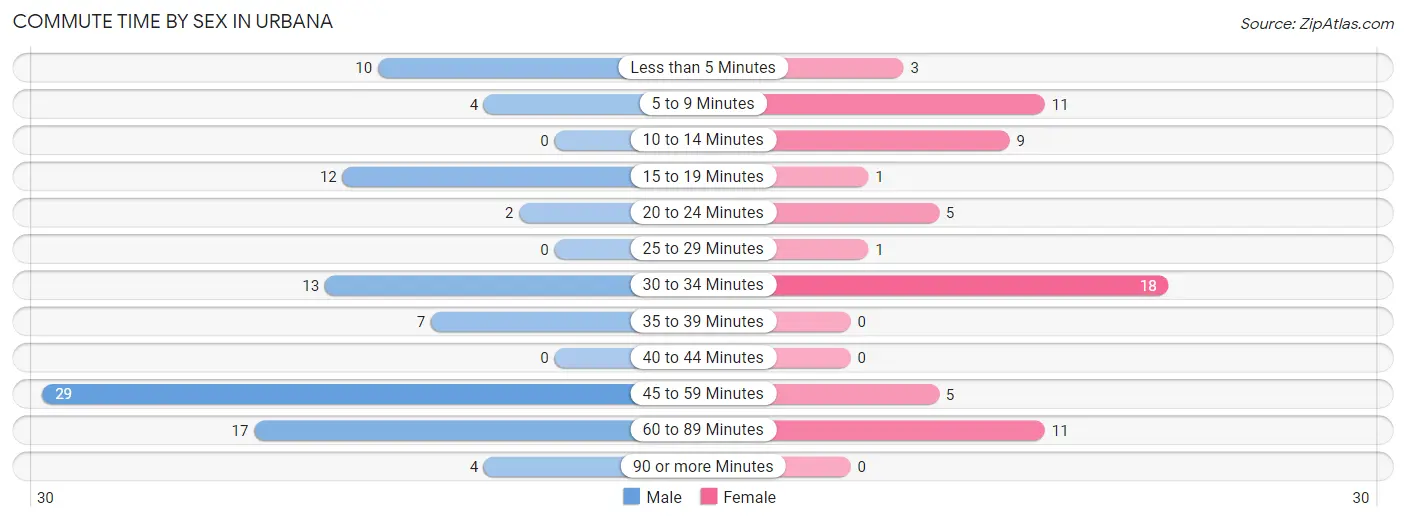
| Commute Time | Male | Female |
| Less than 5 Minutes | 10 (10.2%) | 3 (4.7%) |
| 5 to 9 Minutes | 4 (4.1%) | 11 (17.2%) |
| 10 to 14 Minutes | 0 (0.0%) | 9 (14.1%) |
| 15 to 19 Minutes | 12 (12.2%) | 1 (1.6%) |
| 20 to 24 Minutes | 2 (2.0%) | 5 (7.8%) |
| 25 to 29 Minutes | 0 (0.0%) | 1 (1.6%) |
| 30 to 34 Minutes | 13 (13.3%) | 18 (28.1%) |
| 35 to 39 Minutes | 7 (7.1%) | 0 (0.0%) |
| 40 to 44 Minutes | 0 (0.0%) | 0 (0.0%) |
| 45 to 59 Minutes | 29 (29.6%) | 5 (7.8%) |
| 60 to 89 Minutes | 17 (17.3%) | 11 (17.2%) |
| 90 or more Minutes | 4 (4.1%) | 0 (0.0%) |
Time of Departure to Work by Sex in Urbana
The most frequent times of departure to work in Urbana are 7:30 AM to 7:59 AM (20, 20.4%) for males and 8:00 AM to 8:29 AM (14, 21.9%) for females.
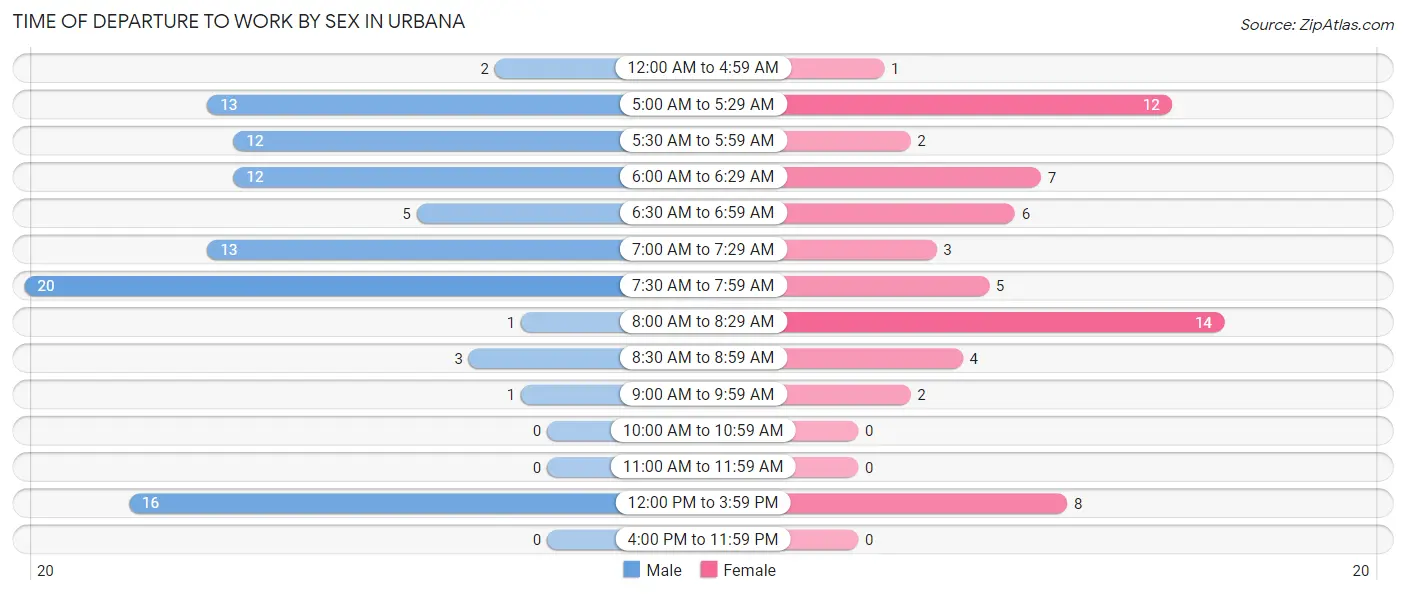
| Time of Departure | Male | Female |
| 12:00 AM to 4:59 AM | 2 (2.0%) | 1 (1.6%) |
| 5:00 AM to 5:29 AM | 13 (13.3%) | 12 (18.8%) |
| 5:30 AM to 5:59 AM | 12 (12.2%) | 2 (3.1%) |
| 6:00 AM to 6:29 AM | 12 (12.2%) | 7 (10.9%) |
| 6:30 AM to 6:59 AM | 5 (5.1%) | 6 (9.4%) |
| 7:00 AM to 7:29 AM | 13 (13.3%) | 3 (4.7%) |
| 7:30 AM to 7:59 AM | 20 (20.4%) | 5 (7.8%) |
| 8:00 AM to 8:29 AM | 1 (1.0%) | 14 (21.9%) |
| 8:30 AM to 8:59 AM | 3 (3.1%) | 4 (6.2%) |
| 9:00 AM to 9:59 AM | 1 (1.0%) | 2 (3.1%) |
| 10:00 AM to 10:59 AM | 0 (0.0%) | 0 (0.0%) |
| 11:00 AM to 11:59 AM | 0 (0.0%) | 0 (0.0%) |
| 12:00 PM to 3:59 PM | 16 (16.3%) | 8 (12.5%) |
| 4:00 PM to 11:59 PM | 0 (0.0%) | 0 (0.0%) |
| Total | 98 (100.0%) | 64 (100.0%) |
Housing Occupancy in Urbana
Occupancy by Ownership in Urbana
Of the total 169 dwellings in Urbana, owner-occupied units account for 106 (62.7%), while renter-occupied units make up 63 (37.3%).
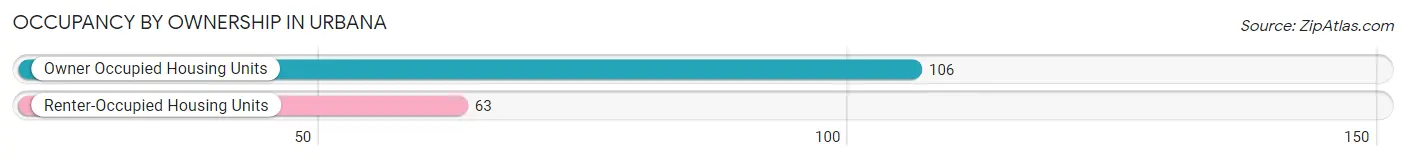
| Occupancy | # Housing Units | % Housing Units |
| Owner Occupied Housing Units | 106 | 62.7% |
| Renter-Occupied Housing Units | 63 | 37.3% |
| Total Occupied Housing Units | 169 | 100.0% |
Occupancy by Household Size in Urbana
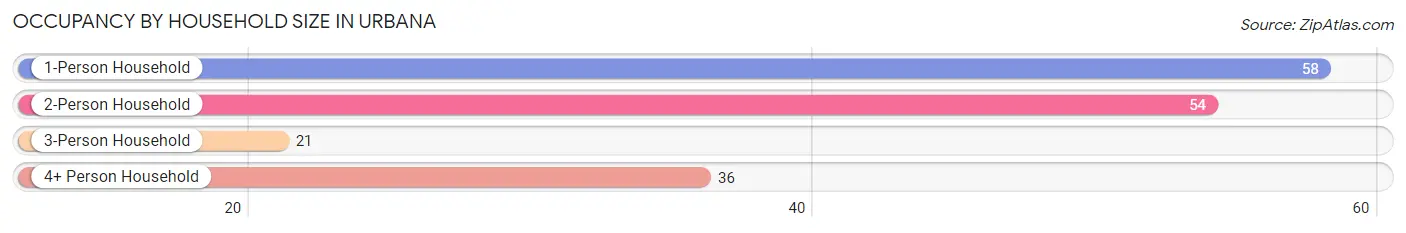
| Household Size | # Housing Units | % Housing Units |
| 1-Person Household | 58 | 34.3% |
| 2-Person Household | 54 | 32.0% |
| 3-Person Household | 21 | 12.4% |
| 4+ Person Household | 36 | 21.3% |
| Total Housing Units | 169 | 100.0% |
Occupancy by Ownership by Household Size in Urbana
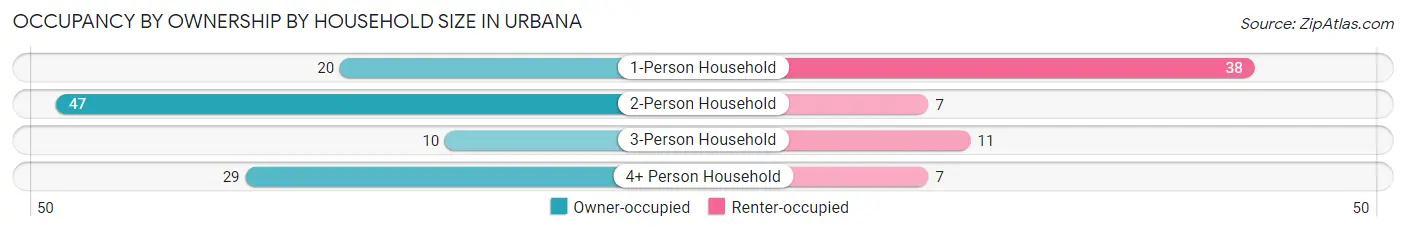
| Household Size | Owner-occupied | Renter-occupied |
| 1-Person Household | 20 (34.5%) | 38 (65.5%) |
| 2-Person Household | 47 (87.0%) | 7 (13.0%) |
| 3-Person Household | 10 (47.6%) | 11 (52.4%) |
| 4+ Person Household | 29 (80.6%) | 7 (19.4%) |
| Total Housing Units | 106 (62.7%) | 63 (37.3%) |
Occupancy by Educational Attainment in Urbana
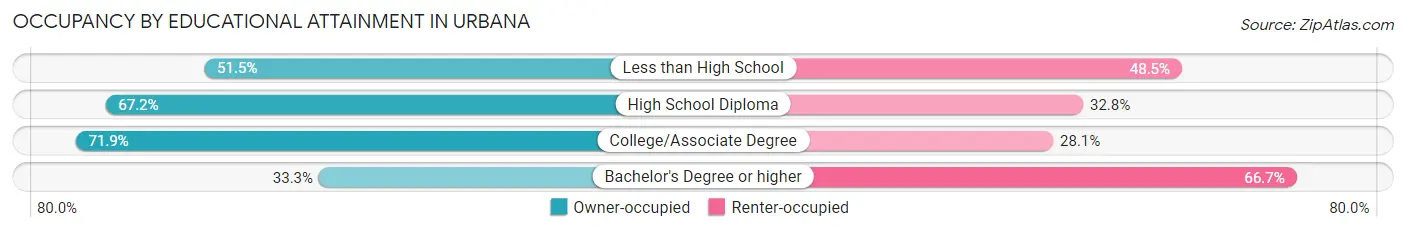
| Household Size | Owner-occupied | Renter-occupied |
| Less than High School | 17 (51.5%) | 16 (48.5%) |
| High School Diploma | 43 (67.2%) | 21 (32.8%) |
| College/Associate Degree | 41 (71.9%) | 16 (28.1%) |
| Bachelor's Degree or higher | 5 (33.3%) | 10 (66.7%) |
Occupancy by Age of Householder in Urbana
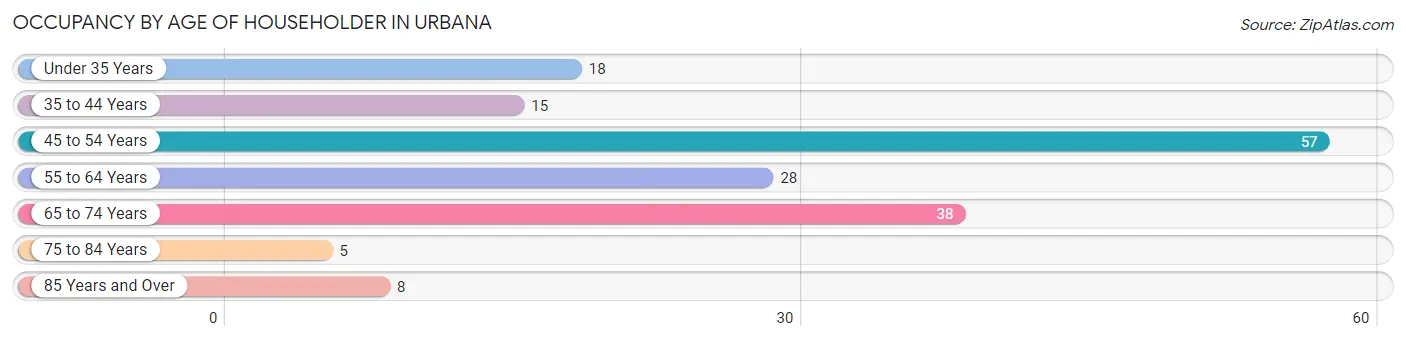
| Age Bracket | # Households | % Households |
| Under 35 Years | 18 | 10.6% |
| 35 to 44 Years | 15 | 8.9% |
| 45 to 54 Years | 57 | 33.7% |
| 55 to 64 Years | 28 | 16.6% |
| 65 to 74 Years | 38 | 22.5% |
| 75 to 84 Years | 5 | 3.0% |
| 85 Years and Over | 8 | 4.7% |
| Total | 169 | 100.0% |
Housing Finances in Urbana
Median Income by Occupancy in Urbana
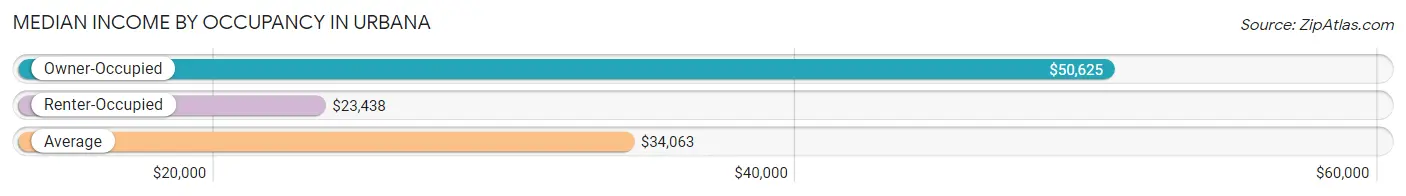
| Occupancy Type | # Households | Median Income |
| Owner-Occupied | 106 (62.7%) | $50,625 |
| Renter-Occupied | 63 (37.3%) | $23,438 |
| Average | 169 (100.0%) | $34,063 |
Occupancy by Householder Income Bracket in Urbana
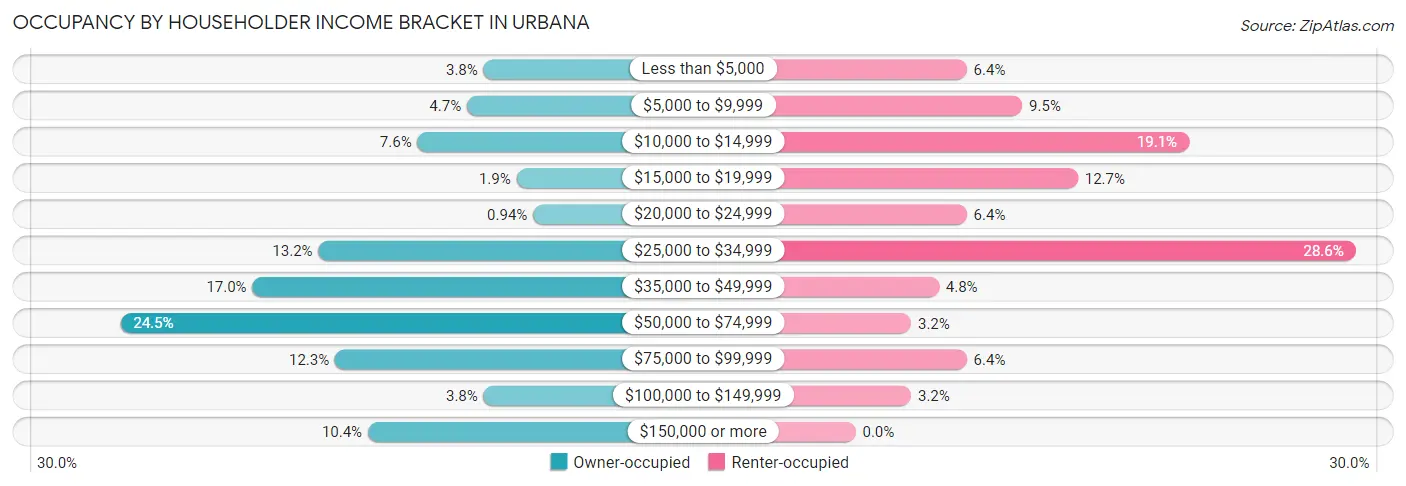
| Income Bracket | Owner-occupied | Renter-occupied |
| Less than $5,000 | 4 (3.8%) | 4 (6.4%) |
| $5,000 to $9,999 | 5 (4.7%) | 6 (9.5%) |
| $10,000 to $14,999 | 8 (7.5%) | 12 (19.1%) |
| $15,000 to $19,999 | 2 (1.9%) | 8 (12.7%) |
| $20,000 to $24,999 | 1 (0.9%) | 4 (6.4%) |
| $25,000 to $34,999 | 14 (13.2%) | 18 (28.6%) |
| $35,000 to $49,999 | 18 (17.0%) | 3 (4.8%) |
| $50,000 to $74,999 | 26 (24.5%) | 2 (3.2%) |
| $75,000 to $99,999 | 13 (12.3%) | 4 (6.4%) |
| $100,000 to $149,999 | 4 (3.8%) | 2 (3.2%) |
| $150,000 or more | 11 (10.4%) | 0 (0.0%) |
| Total | 106 (100.0%) | 63 (100.0%) |
Monthly Housing Cost Tiers in Urbana
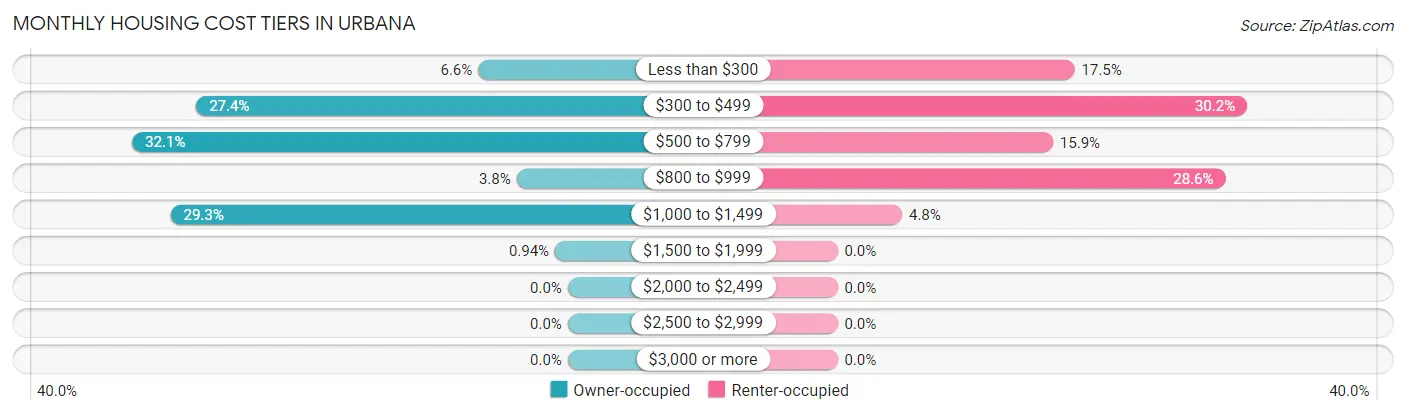
| Monthly Cost | Owner-occupied | Renter-occupied |
| Less than $300 | 7 (6.6%) | 11 (17.5%) |
| $300 to $499 | 29 (27.4%) | 19 (30.2%) |
| $500 to $799 | 34 (32.1%) | 10 (15.9%) |
| $800 to $999 | 4 (3.8%) | 18 (28.6%) |
| $1,000 to $1,499 | 31 (29.2%) | 3 (4.8%) |
| $1,500 to $1,999 | 1 (0.9%) | 0 (0.0%) |
| $2,000 to $2,499 | 0 (0.0%) | 0 (0.0%) |
| $2,500 to $2,999 | 0 (0.0%) | 0 (0.0%) |
| $3,000 or more | 0 (0.0%) | 0 (0.0%) |
| Total | 106 (100.0%) | 63 (100.0%) |
Physical Housing Characteristics in Urbana
Housing Structures in Urbana
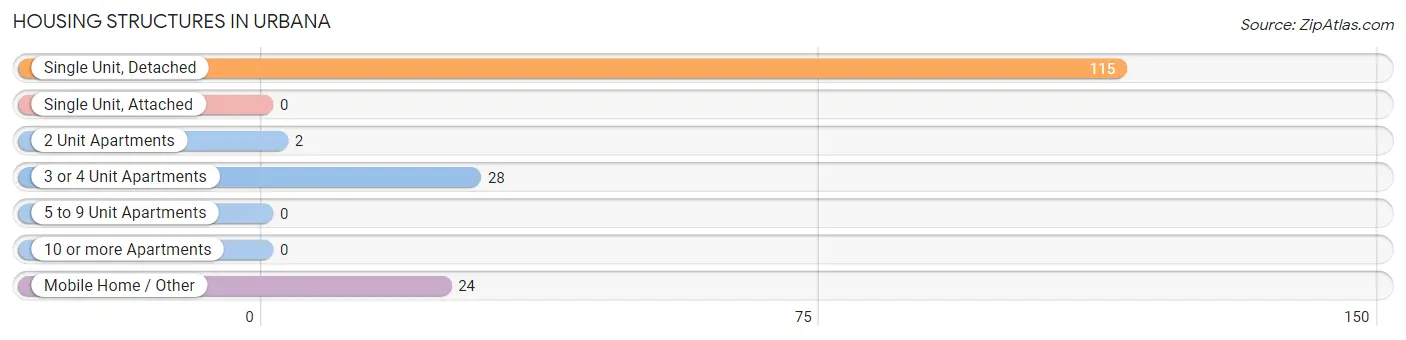
| Structure Type | # Housing Units | % Housing Units |
| Single Unit, Detached | 115 | 68.0% |
| Single Unit, Attached | 0 | 0.0% |
| 2 Unit Apartments | 2 | 1.2% |
| 3 or 4 Unit Apartments | 28 | 16.6% |
| 5 to 9 Unit Apartments | 0 | 0.0% |
| 10 or more Apartments | 0 | 0.0% |
| Mobile Home / Other | 24 | 14.2% |
| Total | 169 | 100.0% |
Housing Structures by Occupancy in Urbana
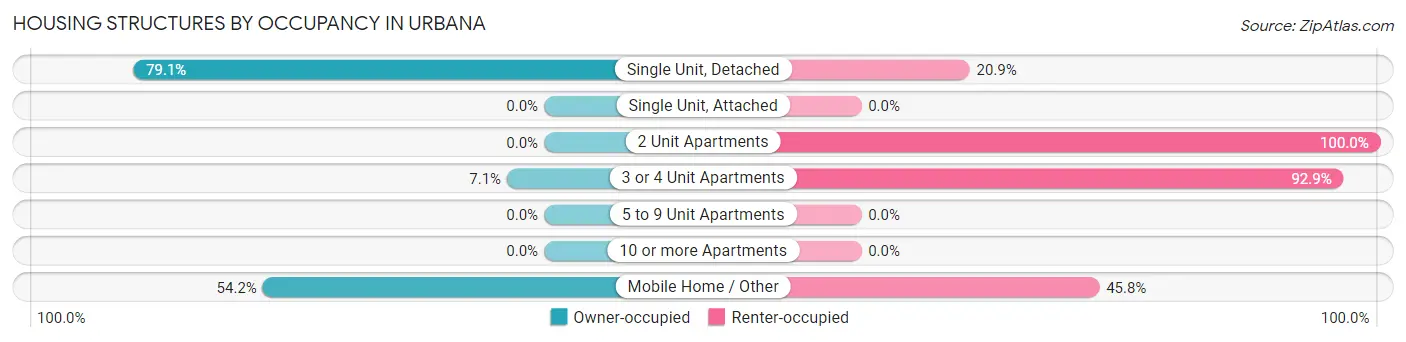
| Structure Type | Owner-occupied | Renter-occupied |
| Single Unit, Detached | 91 (79.1%) | 24 (20.9%) |
| Single Unit, Attached | 0 (0.0%) | 0 (0.0%) |
| 2 Unit Apartments | 0 (0.0%) | 2 (100.0%) |
| 3 or 4 Unit Apartments | 2 (7.1%) | 26 (92.9%) |
| 5 to 9 Unit Apartments | 0 (0.0%) | 0 (0.0%) |
| 10 or more Apartments | 0 (0.0%) | 0 (0.0%) |
| Mobile Home / Other | 13 (54.2%) | 11 (45.8%) |
| Total | 106 (62.7%) | 63 (37.3%) |
Housing Structures by Number of Rooms in Urbana
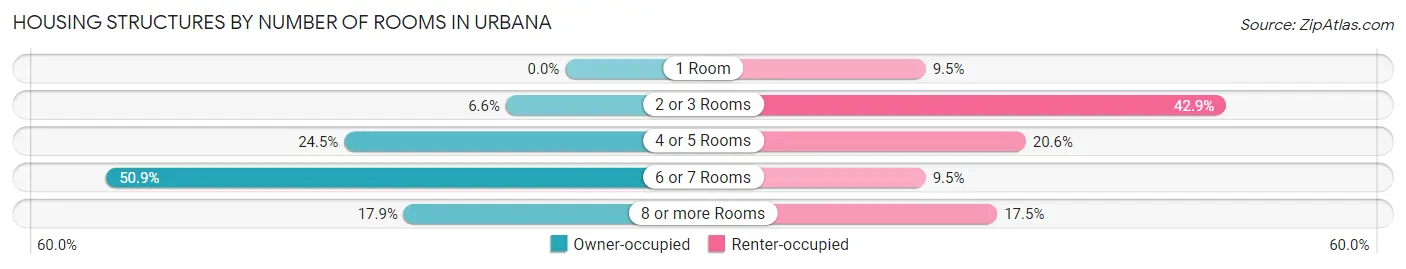
| Number of Rooms | Owner-occupied | Renter-occupied |
| 1 Room | 0 (0.0%) | 6 (9.5%) |
| 2 or 3 Rooms | 7 (6.6%) | 27 (42.9%) |
| 4 or 5 Rooms | 26 (24.5%) | 13 (20.6%) |
| 6 or 7 Rooms | 54 (50.9%) | 6 (9.5%) |
| 8 or more Rooms | 19 (17.9%) | 11 (17.5%) |
| Total | 106 (100.0%) | 63 (100.0%) |
Housing Structure by Heating Type in Urbana
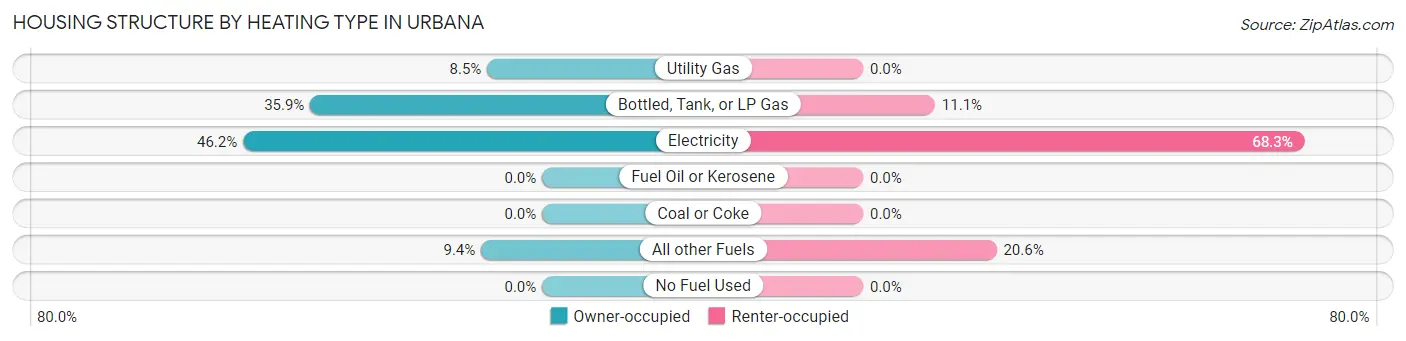
| Heating Type | Owner-occupied | Renter-occupied |
| Utility Gas | 9 (8.5%) | 0 (0.0%) |
| Bottled, Tank, or LP Gas | 38 (35.8%) | 7 (11.1%) |
| Electricity | 49 (46.2%) | 43 (68.2%) |
| Fuel Oil or Kerosene | 0 (0.0%) | 0 (0.0%) |
| Coal or Coke | 0 (0.0%) | 0 (0.0%) |
| All other Fuels | 10 (9.4%) | 13 (20.6%) |
| No Fuel Used | 0 (0.0%) | 0 (0.0%) |
| Total | 106 (100.0%) | 63 (100.0%) |
Household Vehicle Usage in Urbana
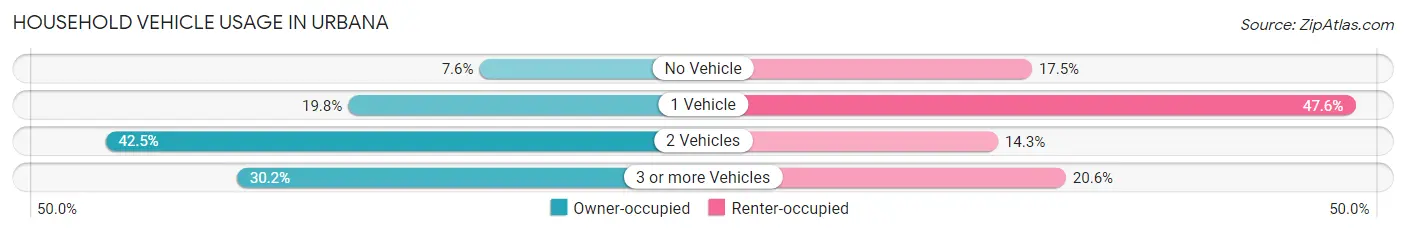
| Vehicles per Household | Owner-occupied | Renter-occupied |
| No Vehicle | 8 (7.5%) | 11 (17.5%) |
| 1 Vehicle | 21 (19.8%) | 30 (47.6%) |
| 2 Vehicles | 45 (42.4%) | 9 (14.3%) |
| 3 or more Vehicles | 32 (30.2%) | 13 (20.6%) |
| Total | 106 (100.0%) | 63 (100.0%) |
Real Estate & Mortgages in Urbana
Real Estate and Mortgage Overview in Urbana
| Characteristic | Without Mortgage | With Mortgage |
| Housing Units | 63 | 43 |
| Median Property Value | $65,000 | $112,500 |
| Median Household Income | $40,938 | $9 |
| Monthly Housing Costs | $472 | $0 |
| Real Estate Taxes | $381 | $1 |
Property Value by Mortgage Status in Urbana
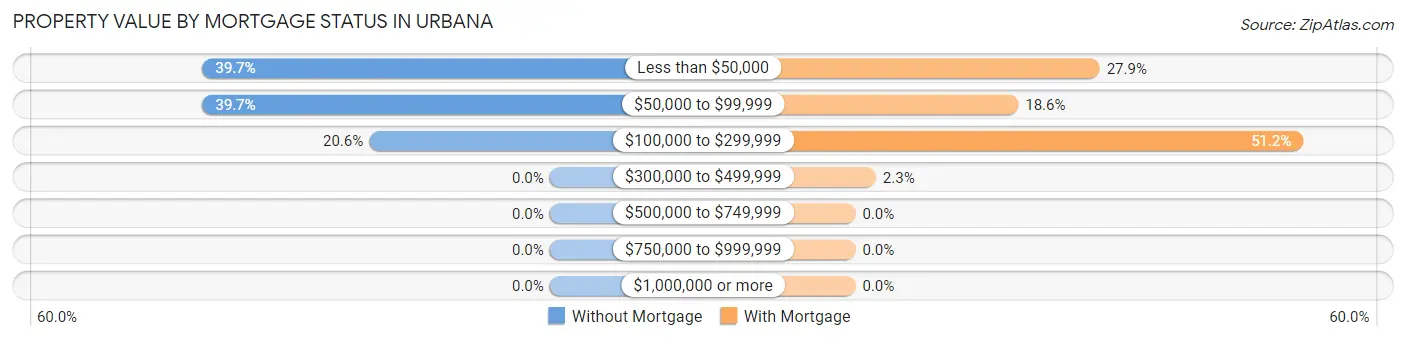
| Property Value | Without Mortgage | With Mortgage |
| Less than $50,000 | 25 (39.7%) | 12 (27.9%) |
| $50,000 to $99,999 | 25 (39.7%) | 8 (18.6%) |
| $100,000 to $299,999 | 13 (20.6%) | 22 (51.2%) |
| $300,000 to $499,999 | 0 (0.0%) | 1 (2.3%) |
| $500,000 to $749,999 | 0 (0.0%) | 0 (0.0%) |
| $750,000 to $999,999 | 0 (0.0%) | 0 (0.0%) |
| $1,000,000 or more | 0 (0.0%) | 0 (0.0%) |
| Total | 63 (100.0%) | 43 (100.0%) |
Household Income by Mortgage Status in Urbana
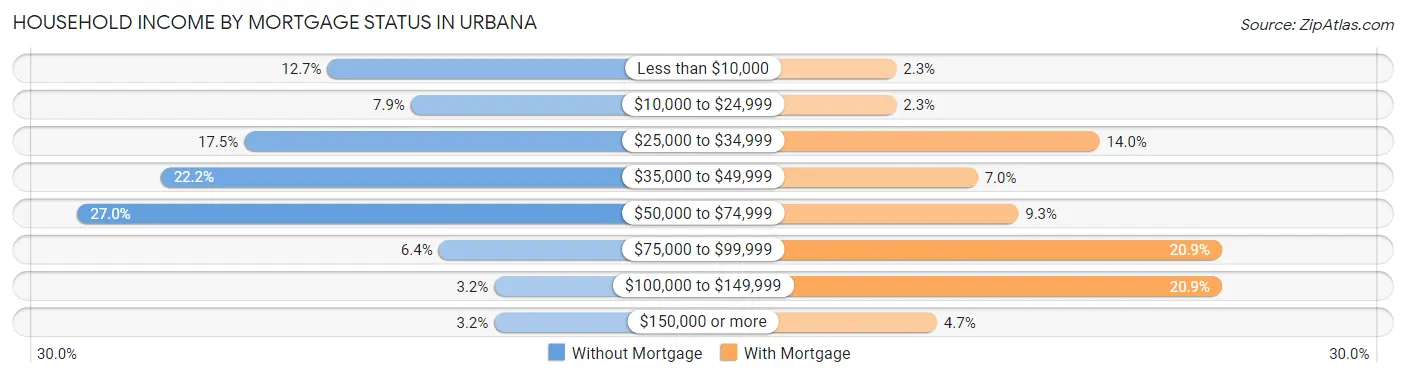
| Household Income | Without Mortgage | With Mortgage |
| Less than $10,000 | 8 (12.7%) | 1 (2.3%) |
| $10,000 to $24,999 | 5 (7.9%) | 1 (2.3%) |
| $25,000 to $34,999 | 11 (17.5%) | 6 (14.0%) |
| $35,000 to $49,999 | 14 (22.2%) | 3 (7.0%) |
| $50,000 to $74,999 | 17 (27.0%) | 4 (9.3%) |
| $75,000 to $99,999 | 4 (6.4%) | 9 (20.9%) |
| $100,000 to $149,999 | 2 (3.2%) | 9 (20.9%) |
| $150,000 or more | 2 (3.2%) | 2 (4.6%) |
| Total | 63 (100.0%) | 43 (100.0%) |
Property Value to Household Income Ratio in Urbana
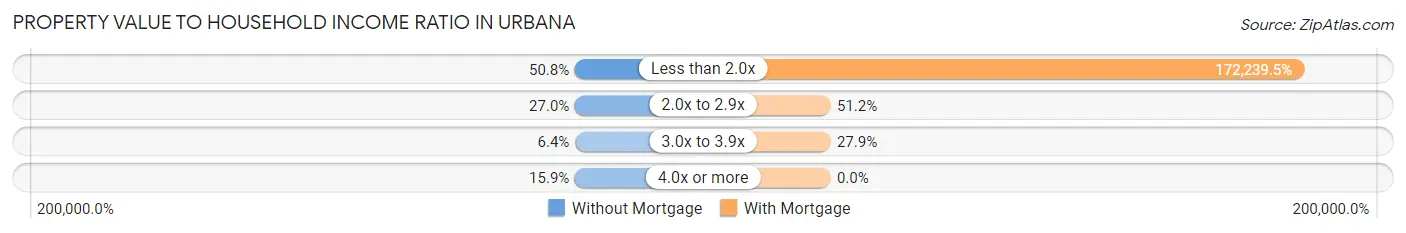
| Value-to-Income Ratio | Without Mortgage | With Mortgage |
| Less than 2.0x | 32 (50.8%) | 74,063 (172,239.5%) |
| 2.0x to 2.9x | 17 (27.0%) | 22 (51.2%) |
| 3.0x to 3.9x | 4 (6.4%) | 12 (27.9%) |
| 4.0x or more | 10 (15.9%) | 0 (0.0%) |
| Total | 63 (100.0%) | 43 (100.0%) |
Real Estate Taxes by Mortgage Status in Urbana
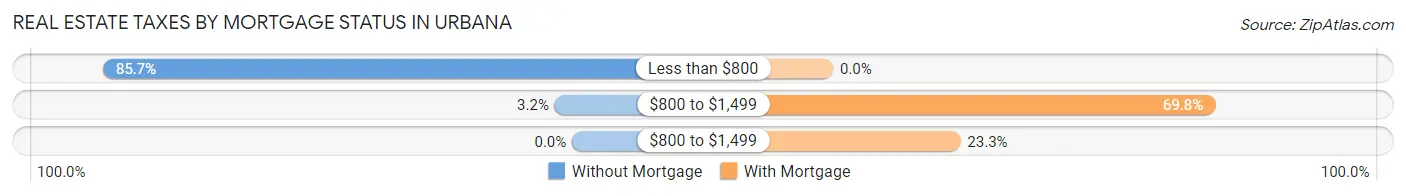
| Property Taxes | Without Mortgage | With Mortgage |
| Less than $800 | 54 (85.7%) | 0 (0.0%) |
| $800 to $1,499 | 2 (3.2%) | 30 (69.8%) |
| $800 to $1,499 | 0 (0.0%) | 10 (23.3%) |
| Total | 63 (100.0%) | 43 (100.0%) |
Health & Disability in Urbana
Health Insurance Coverage by Age in Urbana
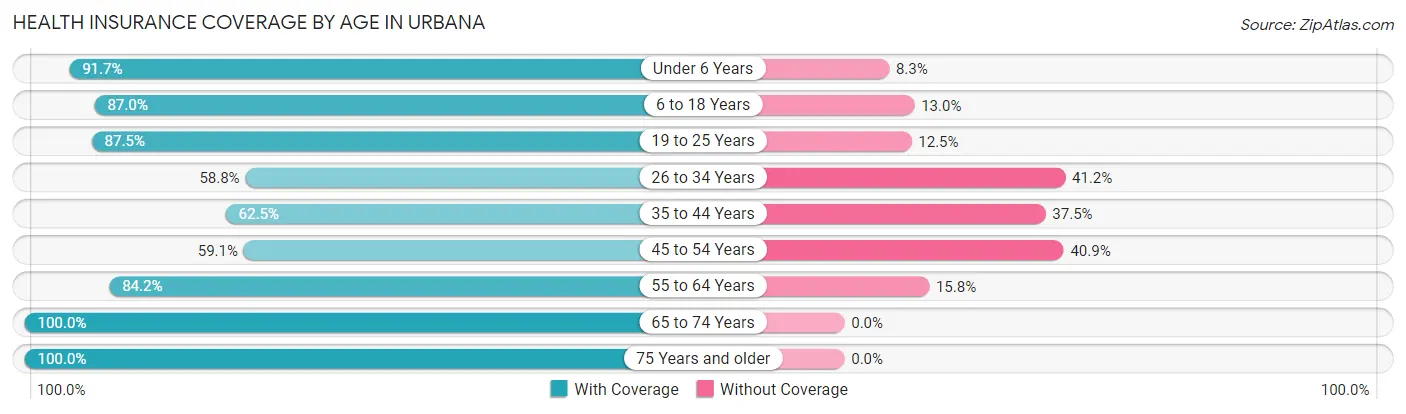
| Age Bracket | With Coverage | Without Coverage |
| Under 6 Years | 11 (91.7%) | 1 (8.3%) |
| 6 to 18 Years | 80 (87.0%) | 12 (13.0%) |
| 19 to 25 Years | 7 (87.5%) | 1 (12.5%) |
| 26 to 34 Years | 20 (58.8%) | 14 (41.2%) |
| 35 to 44 Years | 25 (62.5%) | 15 (37.5%) |
| 45 to 54 Years | 68 (59.1%) | 47 (40.9%) |
| 55 to 64 Years | 64 (84.2%) | 12 (15.8%) |
| 65 to 74 Years | 49 (100.0%) | 0 (0.0%) |
| 75 Years and older | 16 (100.0%) | 0 (0.0%) |
| Total | 340 (76.9%) | 102 (23.1%) |
Health Insurance Coverage by Citizenship Status in Urbana
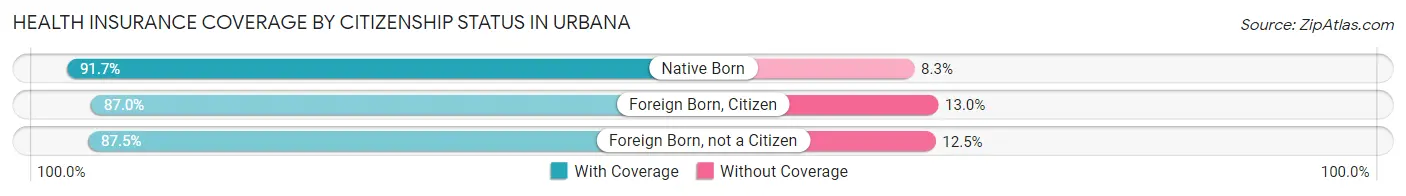
| Citizenship Status | With Coverage | Without Coverage |
| Native Born | 11 (91.7%) | 1 (8.3%) |
| Foreign Born, Citizen | 80 (87.0%) | 12 (13.0%) |
| Foreign Born, not a Citizen | 7 (87.5%) | 1 (12.5%) |
Health Insurance Coverage by Household Income in Urbana
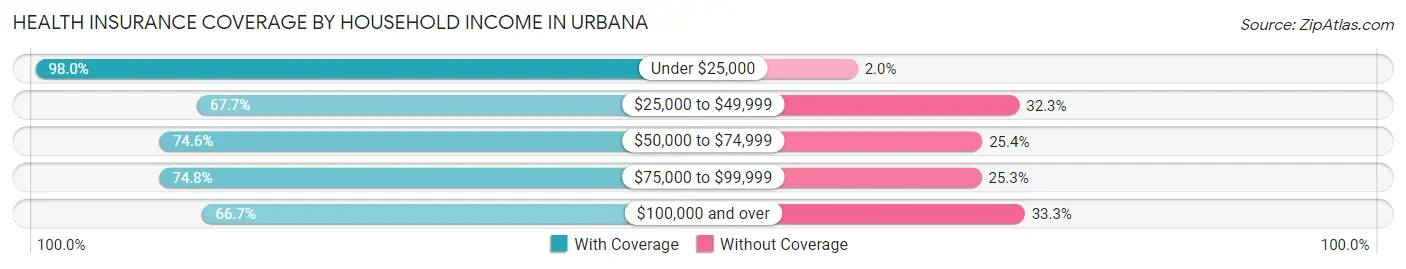
| Household Income | With Coverage | Without Coverage |
| Under $25,000 | 96 (98.0%) | 2 (2.0%) |
| $25,000 to $49,999 | 90 (67.7%) | 43 (32.3%) |
| $50,000 to $74,999 | 50 (74.6%) | 17 (25.4%) |
| $75,000 to $99,999 | 74 (74.8%) | 25 (25.3%) |
| $100,000 and over | 30 (66.7%) | 15 (33.3%) |
Public vs Private Health Insurance Coverage by Age in Urbana
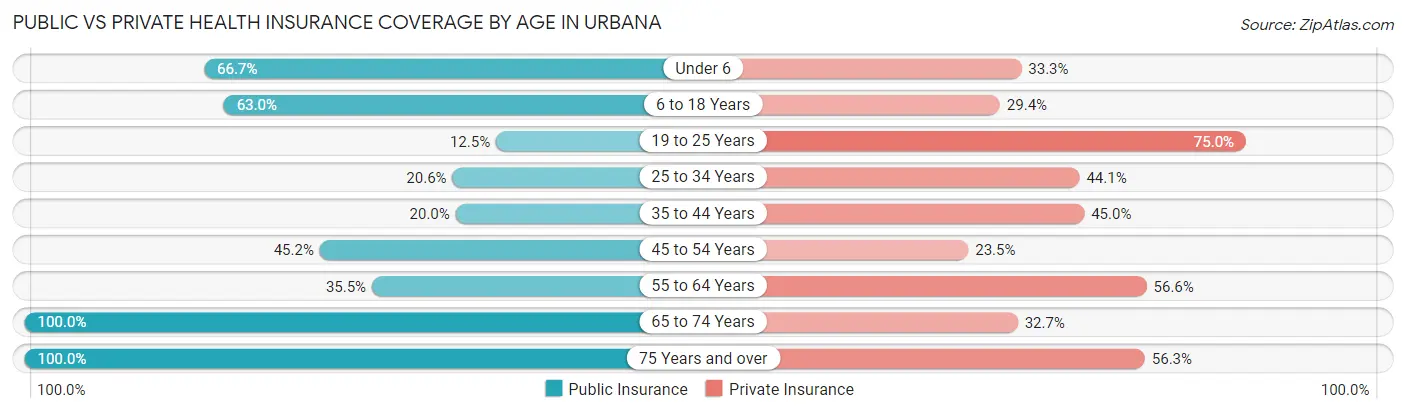
| Age Bracket | Public Insurance | Private Insurance |
| Under 6 | 8 (66.7%) | 4 (33.3%) |
| 6 to 18 Years | 58 (63.0%) | 27 (29.3%) |
| 19 to 25 Years | 1 (12.5%) | 6 (75.0%) |
| 25 to 34 Years | 7 (20.6%) | 15 (44.1%) |
| 35 to 44 Years | 8 (20.0%) | 18 (45.0%) |
| 45 to 54 Years | 52 (45.2%) | 27 (23.5%) |
| 55 to 64 Years | 27 (35.5%) | 43 (56.6%) |
| 65 to 74 Years | 49 (100.0%) | 16 (32.7%) |
| 75 Years and over | 16 (100.0%) | 9 (56.2%) |
| Total | 226 (51.1%) | 165 (37.3%) |
Disability Status by Sex by Age in Urbana
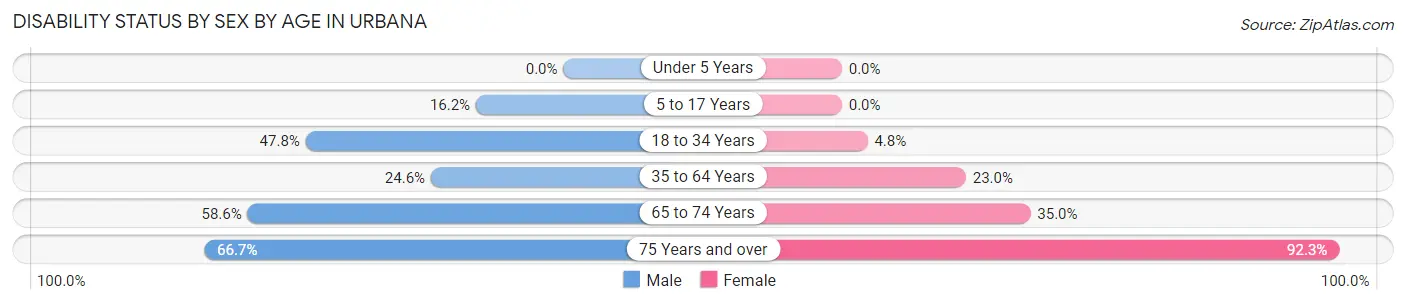
| Age Bracket | Male | Female |
| Under 5 Years | 0 (0.0%) | 0 (0.0%) |
| 5 to 17 Years | 6 (16.2%) | 0 (0.0%) |
| 18 to 34 Years | 22 (47.8%) | 1 (4.8%) |
| 35 to 64 Years | 29 (24.6%) | 26 (23.0%) |
| 65 to 74 Years | 17 (58.6%) | 7 (35.0%) |
| 75 Years and over | 2 (66.7%) | 12 (92.3%) |
Disability Class by Sex by Age in Urbana
Disability Class: Hearing Difficulty
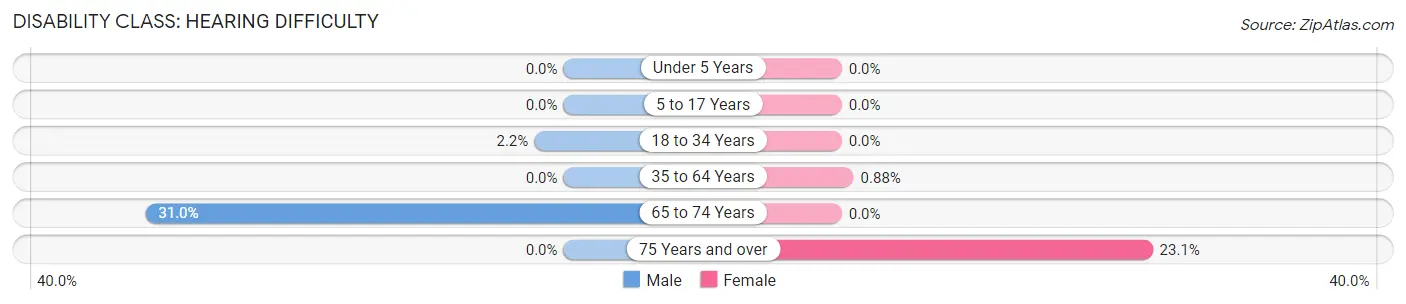
| Age Bracket | Male | Female |
| Under 5 Years | 0 (0.0%) | 0 (0.0%) |
| 5 to 17 Years | 0 (0.0%) | 0 (0.0%) |
| 18 to 34 Years | 1 (2.2%) | 0 (0.0%) |
| 35 to 64 Years | 0 (0.0%) | 1 (0.9%) |
| 65 to 74 Years | 9 (31.0%) | 0 (0.0%) |
| 75 Years and over | 0 (0.0%) | 3 (23.1%) |
Disability Class: Vision Difficulty
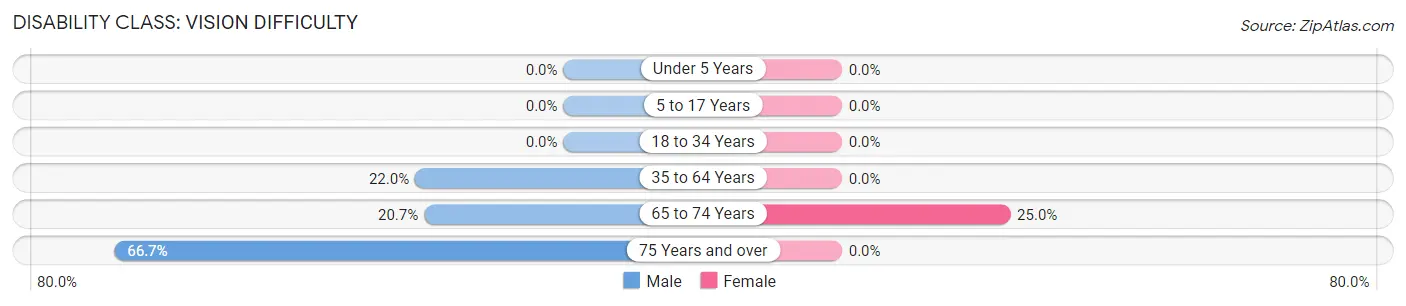
| Age Bracket | Male | Female |
| Under 5 Years | 0 (0.0%) | 0 (0.0%) |
| 5 to 17 Years | 0 (0.0%) | 0 (0.0%) |
| 18 to 34 Years | 0 (0.0%) | 0 (0.0%) |
| 35 to 64 Years | 26 (22.0%) | 0 (0.0%) |
| 65 to 74 Years | 6 (20.7%) | 5 (25.0%) |
| 75 Years and over | 2 (66.7%) | 0 (0.0%) |
Disability Class: Cognitive Difficulty
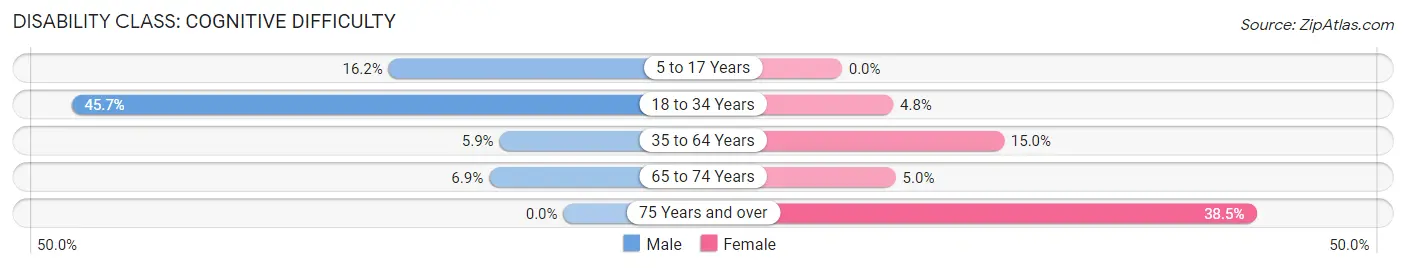
| Age Bracket | Male | Female |
| 5 to 17 Years | 6 (16.2%) | 0 (0.0%) |
| 18 to 34 Years | 21 (45.7%) | 1 (4.8%) |
| 35 to 64 Years | 7 (5.9%) | 17 (15.0%) |
| 65 to 74 Years | 2 (6.9%) | 1 (5.0%) |
| 75 Years and over | 0 (0.0%) | 5 (38.5%) |
Disability Class: Ambulatory Difficulty
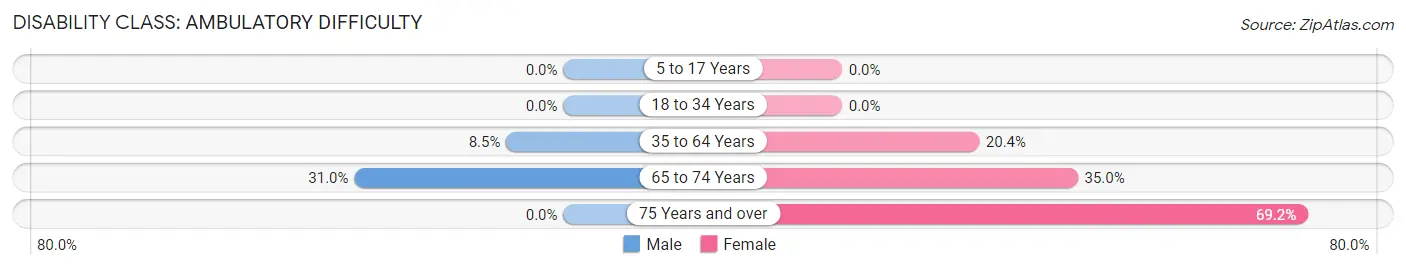
| Age Bracket | Male | Female |
| 5 to 17 Years | 0 (0.0%) | 0 (0.0%) |
| 18 to 34 Years | 0 (0.0%) | 0 (0.0%) |
| 35 to 64 Years | 10 (8.5%) | 23 (20.3%) |
| 65 to 74 Years | 9 (31.0%) | 7 (35.0%) |
| 75 Years and over | 0 (0.0%) | 9 (69.2%) |
Disability Class: Self-Care Difficulty
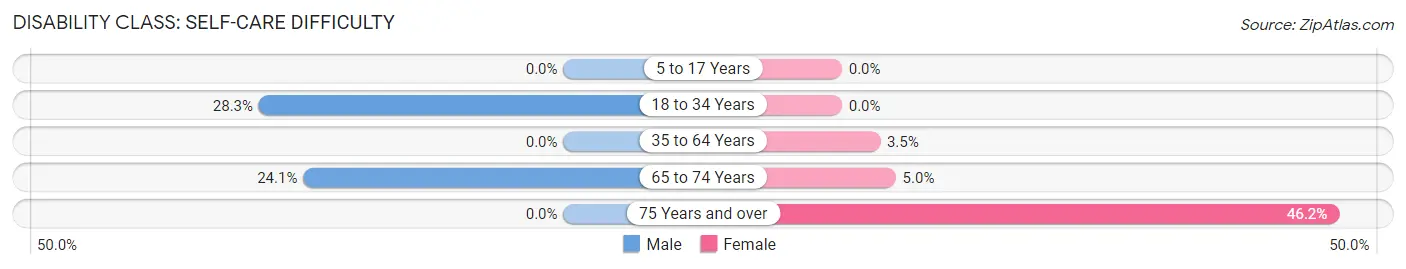
| Age Bracket | Male | Female |
| 5 to 17 Years | 0 (0.0%) | 0 (0.0%) |
| 18 to 34 Years | 13 (28.3%) | 0 (0.0%) |
| 35 to 64 Years | 0 (0.0%) | 4 (3.5%) |
| 65 to 74 Years | 7 (24.1%) | 1 (5.0%) |
| 75 Years and over | 0 (0.0%) | 6 (46.2%) |
Technology Access in Urbana
Computing Device Access in Urbana
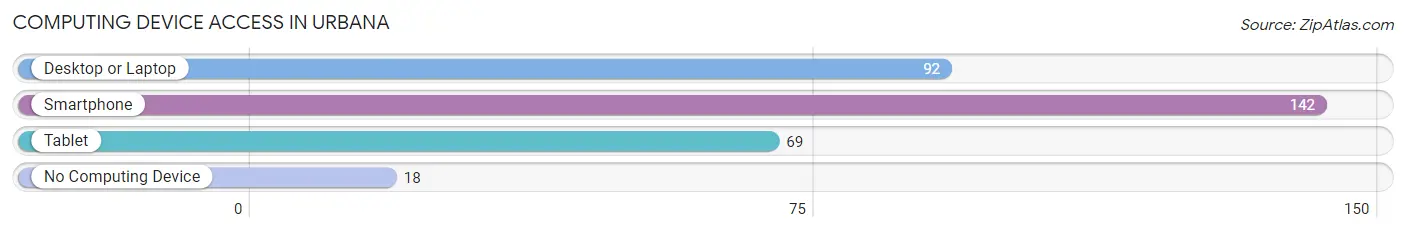
| Device Type | # Households | % Households |
| Desktop or Laptop | 92 | 54.4% |
| Smartphone | 142 | 84.0% |
| Tablet | 69 | 40.8% |
| No Computing Device | 18 | 10.6% |
| Total | 169 | 100.0% |
Internet Access in Urbana
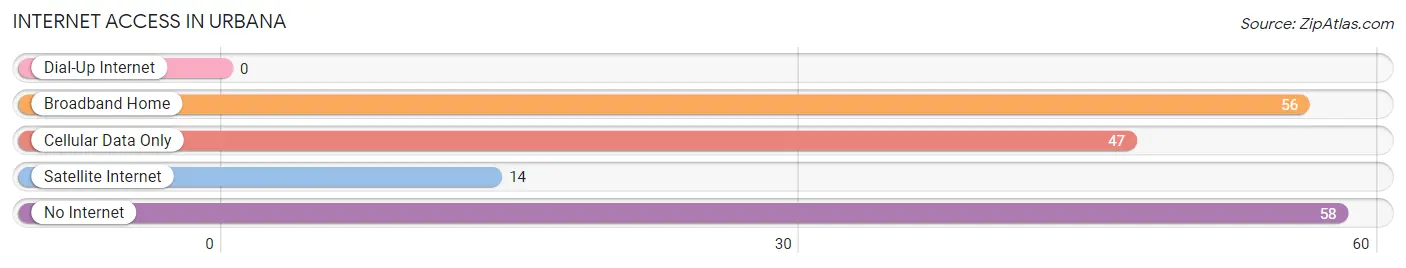
| Internet Type | # Households | % Households |
| Dial-Up Internet | 0 | 0.0% |
| Broadband Home | 56 | 33.1% |
| Cellular Data Only | 47 | 27.8% |
| Satellite Internet | 14 | 8.3% |
| No Internet | 58 | 34.3% |
| Total | 169 | 100.0% |
Urbana Summary
Urbana, Missouri is a small town located in the Ozark Mountains of south-central Missouri. It is situated in the foothills of the Ozarks, about 25 miles south of Springfield. The town has a population of approximately 1,500 people and is the county seat of Douglas County.
History
The area that is now Urbana was first settled in the early 1800s by settlers from Kentucky and Tennessee. The town was originally known as “Mountain View” and was later renamed “Urbana” in 1837. The name was chosen to honor the city of Urbana, Ohio, which was the hometown of one of the original settlers.
The town was officially incorporated in 1845 and quickly became a center of commerce and industry. The town was home to several mills, a tannery, and a distillery. The town also had a thriving agricultural industry, with many farmers growing corn, wheat, and other crops.
In the late 1800s, the town began to decline as the railroad bypassed it and the mills and other businesses began to close. The town was nearly abandoned by the early 1900s, but was revived in the 1920s when the Ozark National Scenic Riverways was established. The town was designated as the county seat of Douglas County in 1925.
Geography
Urbana is located in the Ozark Mountains of south-central Missouri. The town is situated in the foothills of the Ozarks, about 25 miles south of Springfield. The town is located on the banks of the North Fork River, which is a tributary of the White River.
The town is surrounded by rolling hills and forests, and is home to several parks and recreational areas. The town is also home to several caves, including the popular Onyx Cave.
Economy
The economy of Urbana is largely based on tourism and agriculture. The town is home to several tourist attractions, including the Ozark National Scenic Riverways, Onyx Cave, and the historic downtown area. The town is also home to several wineries and vineyards, as well as several farms and ranches.
The town is also home to several small businesses, including restaurants, shops, and other services. The town is also home to several manufacturing companies, including a furniture factory and a metal fabrication plant.
Demographics
As of the 2010 census, the population of Urbana was 1,521. The town is predominantly white, with about 95% of the population being white. The town also has a small Hispanic population, with about 4% of the population being Hispanic. The town also has a small African American population, with about 1% of the population being African American.
The median household income in Urbana is $37,000, and the median home value is $90,000. The town has a poverty rate of about 17%, which is slightly higher than the national average. The town also has a high unemployment rate, with about 8% of the population being unemployed.
Common Questions
What is Per Capita Income in Urbana?
Per Capita income in Urbana is $22,475.
What is the Median Family Income in Urbana?
Median Family Income in Urbana is $47,000.
What is the Median Household income in Urbana?
Median Household Income in Urbana is $34,063.
What is Family Income Deficit in Urbana?
Family Income Deficit in Urbana is $13,831.
Families that are below poverty line in Urbana earn $13,831 less on average than the poverty threshold level.
What is Inequality or Gini Index in Urbana?
Inequality or Gini Index in Urbana is 0.49.
What is the Total Population of Urbana?
Total Population of Urbana is 452.
What is the Total Male Population of Urbana?
Total Male Population of Urbana is 248.
What is the Total Female Population of Urbana?
Total Female Population of Urbana is 204.
What is the Ratio of Males per 100 Females in Urbana?
There are 121.57 Males per 100 Females in Urbana.
What is the Ratio of Females per 100 Males in Urbana?
There are 82.26 Females per 100 Males in Urbana.
What is the Median Population Age in Urbana?
Median Population Age in Urbana is 48.1 Years.
What is the Average Family Size in Urbana
Average Family Size in Urbana is 3.4 People.
What is the Average Household Size in Urbana
Average Household Size in Urbana is 2.6 People.
How Large is the Labor Force in Urbana?
There are 170 People in the Labor Forcein in Urbana.
What is the Percentage of People in the Labor Force in Urbana?
44.5% of People are in the Labor Force in Urbana.
What is the Unemployment Rate in Urbana?
Unemployment Rate in Urbana is 2.9%.