Troy, MO Map & Demographics
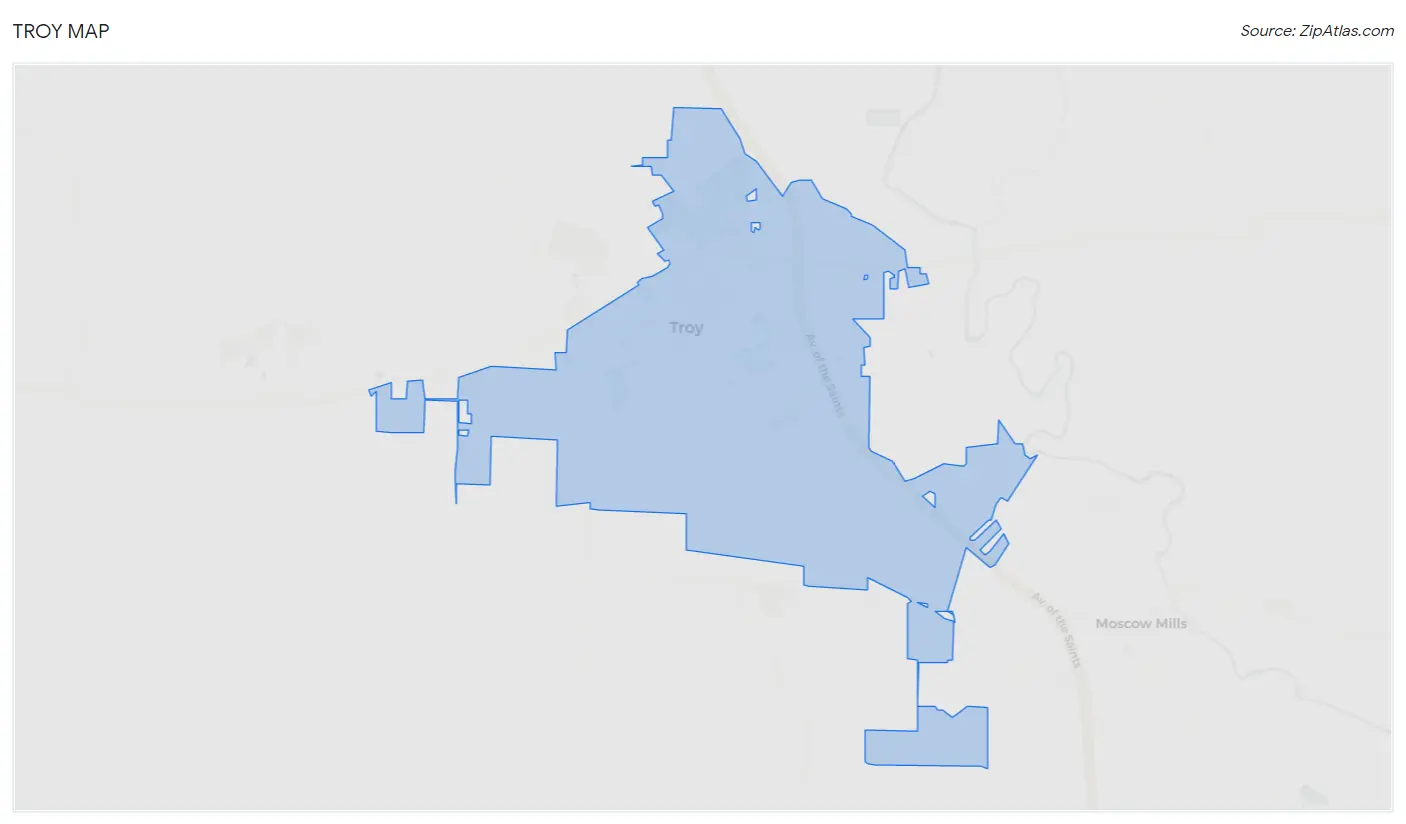
Troy Map
Troy Overview
$29,422
PER CAPITA INCOME
$83,052
AVG FAMILY INCOME
$74,463
AVG HOUSEHOLD INCOME
33.4%
WAGE / INCOME GAP [ % ]
66.6¢/ $1
WAGE / INCOME GAP [ $ ]
0.37
INEQUALITY / GINI INDEX
12,964
TOTAL POPULATION
6,145
MALE POPULATION
6,819
FEMALE POPULATION
90.12
MALES / 100 FEMALES
110.97
FEMALES / 100 MALES
35.5
MEDIAN AGE
2.8
AVG FAMILY SIZE
2.6
AVG HOUSEHOLD SIZE
6,623
LABOR FORCE [ PEOPLE ]
65.3%
PERCENT IN LABOR FORCE
1.8%
UNEMPLOYMENT RATE
Troy Zip Codes
Income in Troy
Income Overview in Troy
Per Capita Income in Troy is $29,422, while median incomes of families and households are $83,052 and $74,463 respectively.
| Characteristic | Number | Measure |
| Per Capita Income | 12,964 | $29,422 |
| Median Family Income | 3,635 | $83,052 |
| Mean Family Income | 3,635 | $82,427 |
| Median Household Income | 4,873 | $74,463 |
| Mean Household Income | 4,873 | $75,424 |
| Income Deficit | 3,635 | $0 |
| Wage / Income Gap (%) | 12,964 | 33.38% |
| Wage / Income Gap ($) | 12,964 | 66.62¢ per $1 |
| Gini / Inequality Index | 12,964 | 0.37 |
Earnings by Sex in Troy
Average Earnings in Troy are $42,495, $53,729 for men and $35,796 for women, a difference of 33.4%.
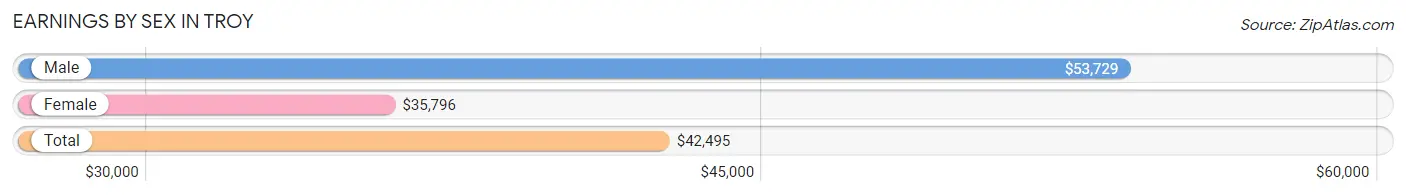
| Sex | Number | Average Earnings |
| Male | 3,662 (52.8%) | $53,729 |
| Female | 3,273 (47.2%) | $35,796 |
| Total | 6,935 (100.0%) | $42,495 |
Earnings by Sex by Income Bracket in Troy
The most common earnings brackets in Troy are $75,000 to $99,999 for men (746 | 20.4%) and $35,000 to $39,999 for women (508 | 15.5%).
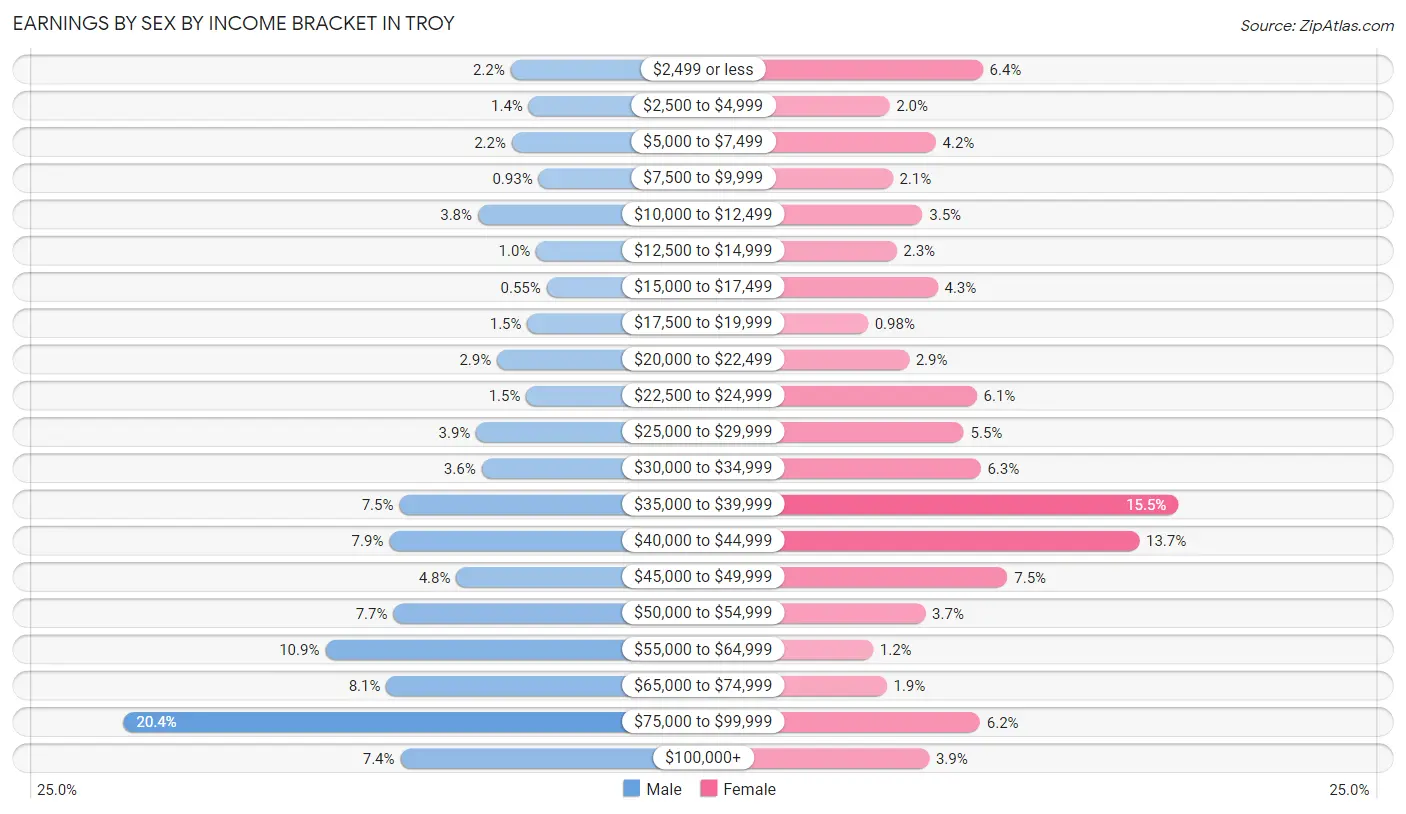
| Income | Male | Female |
| $2,499 or less | 82 (2.2%) | 208 (6.4%) |
| $2,500 to $4,999 | 51 (1.4%) | 65 (2.0%) |
| $5,000 to $7,499 | 80 (2.2%) | 136 (4.2%) |
| $7,500 to $9,999 | 34 (0.9%) | 70 (2.1%) |
| $10,000 to $12,499 | 138 (3.8%) | 116 (3.5%) |
| $12,500 to $14,999 | 38 (1.0%) | 76 (2.3%) |
| $15,000 to $17,499 | 20 (0.5%) | 139 (4.3%) |
| $17,500 to $19,999 | 53 (1.5%) | 32 (1.0%) |
| $20,000 to $22,499 | 105 (2.9%) | 95 (2.9%) |
| $22,500 to $24,999 | 55 (1.5%) | 199 (6.1%) |
| $25,000 to $29,999 | 141 (3.8%) | 179 (5.5%) |
| $30,000 to $34,999 | 132 (3.6%) | 205 (6.3%) |
| $35,000 to $39,999 | 273 (7.4%) | 508 (15.5%) |
| $40,000 to $44,999 | 290 (7.9%) | 448 (13.7%) |
| $45,000 to $49,999 | 175 (4.8%) | 246 (7.5%) |
| $50,000 to $54,999 | 283 (7.7%) | 120 (3.7%) |
| $55,000 to $64,999 | 400 (10.9%) | 40 (1.2%) |
| $65,000 to $74,999 | 295 (8.1%) | 61 (1.9%) |
| $75,000 to $99,999 | 746 (20.4%) | 204 (6.2%) |
| $100,000+ | 271 (7.4%) | 126 (3.8%) |
| Total | 3,662 (100.0%) | 3,273 (100.0%) |
Earnings by Sex by Educational Attainment in Troy
Average earnings in Troy are $56,638 for men and $36,950 for women, a difference of 34.8%. Men with an educational attainment of high school diploma enjoy the highest average annual earnings of $61,190, while those with college or associate's degree education earn the least with $53,393. Women with an educational attainment of bachelor's degree earn the most with the average annual earnings of $46,790, while those with high school diploma education have the smallest earnings of $35,776.
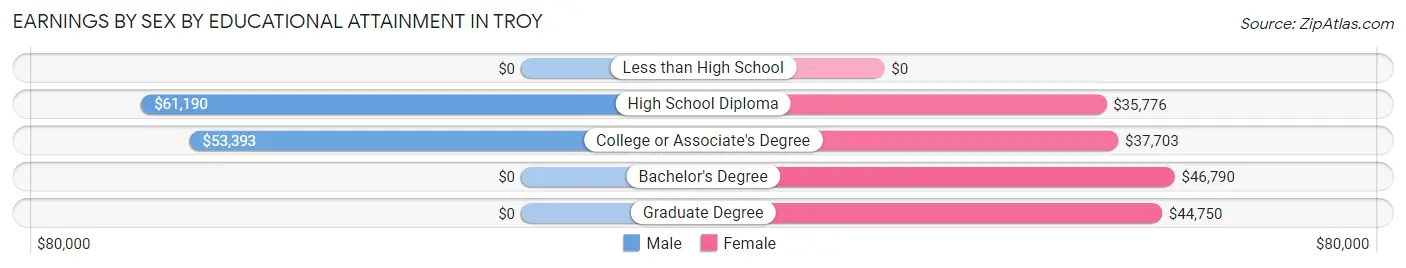
| Educational Attainment | Male Income | Female Income |
| Less than High School | - | - |
| High School Diploma | $61,190 | $35,776 |
| College or Associate's Degree | $53,393 | $37,703 |
| Bachelor's Degree | - | - |
| Graduate Degree | - | - |
| Total | $56,638 | $36,950 |
Family Income in Troy
Family Income Brackets in Troy
According to the Troy family income data, there are 1,087 families falling into the $100,000 to $149,999 income range, which is the most common income bracket and makes up 29.9% of all families. Conversely, the less than $10,000 income bracket is the least frequent group with only 33 families (0.9%) belonging to this category.
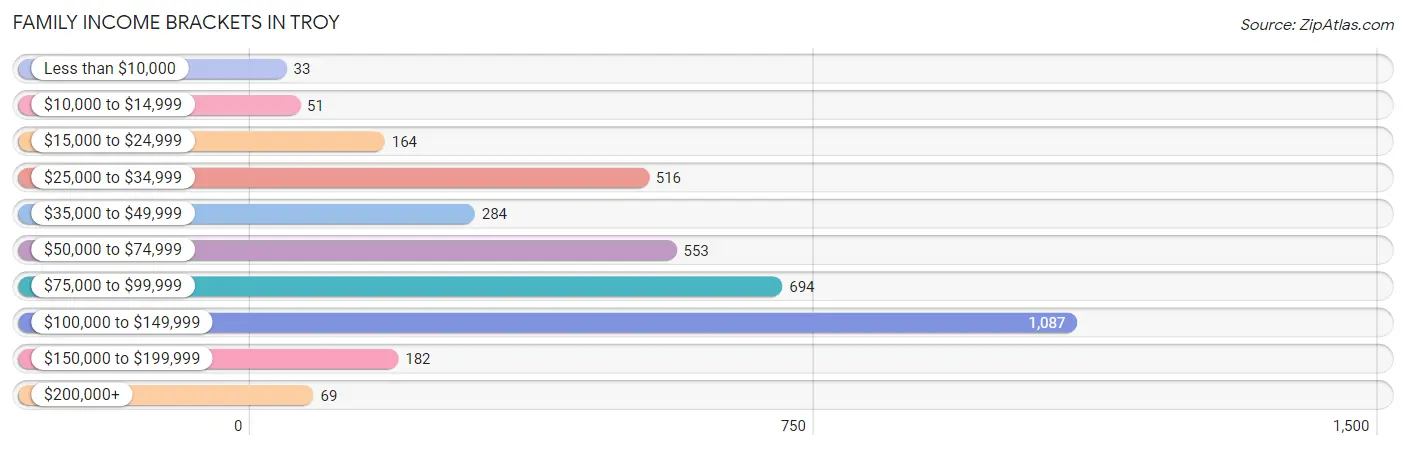
| Income Bracket | # Families | % Families |
| Less than $10,000 | 33 | 0.9% |
| $10,000 to $14,999 | 51 | 1.4% |
| $15,000 to $24,999 | 164 | 4.5% |
| $25,000 to $34,999 | 516 | 14.2% |
| $35,000 to $49,999 | 284 | 7.8% |
| $50,000 to $74,999 | 553 | 15.2% |
| $75,000 to $99,999 | 694 | 19.1% |
| $100,000 to $149,999 | 1,087 | 29.9% |
| $150,000 to $199,999 | 182 | 5.0% |
| $200,000+ | 69 | 1.9% |
Family Income by Famaliy Size in Troy
5-person families (161 | 4.4%) account for the highest median family income in Troy with $100,313 per family, while 2-person families (1,809 | 49.8%) have the highest median income of $41,475 per family member.
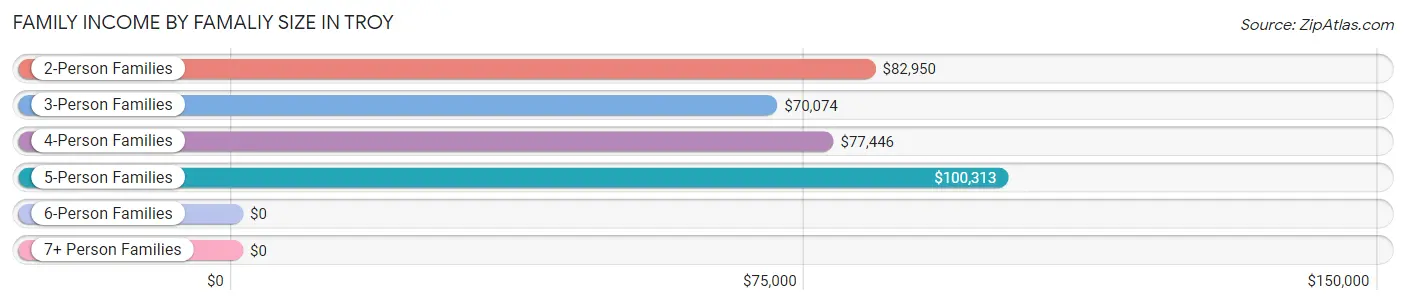
| Income Bracket | # Families | Median Income |
| 2-Person Families | 1,809 (49.8%) | $82,950 |
| 3-Person Families | 983 (27.0%) | $70,074 |
| 4-Person Families | 609 (16.8%) | $77,446 |
| 5-Person Families | 161 (4.4%) | $100,313 |
| 6-Person Families | 27 (0.7%) | $0 |
| 7+ Person Families | 46 (1.3%) | $0 |
| Total | 3,635 (100.0%) | $83,052 |
Family Income by Number of Earners in Troy
The median family income in Troy is $83,052, with families comprising 3+ earners (220) having the highest median family income of $134,074, while families with no earners (534) have the lowest median family income of $31,111, accounting for 6.0% and 14.7% of families, respectively.
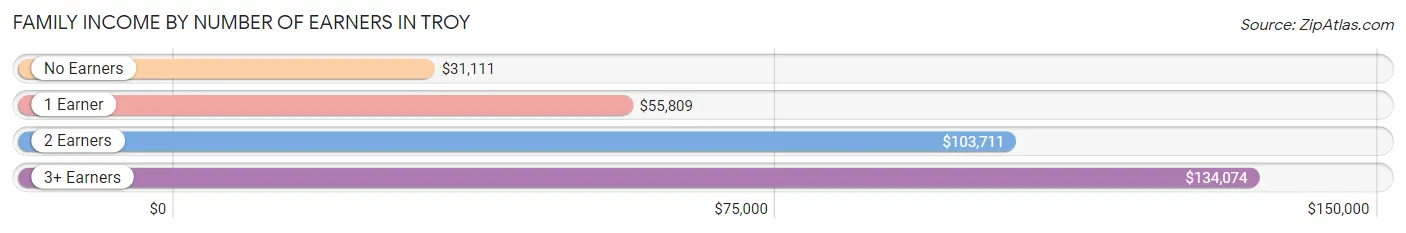
| Number of Earners | # Families | Median Income |
| No Earners | 534 (14.7%) | $31,111 |
| 1 Earner | 1,137 (31.3%) | $55,809 |
| 2 Earners | 1,744 (48.0%) | $103,711 |
| 3+ Earners | 220 (6.0%) | $134,074 |
| Total | 3,635 (100.0%) | $83,052 |
Household Income in Troy
Household Income Brackets in Troy
With 1,282 households falling in the category, the $100,000 to $149,999 income range is the most frequent in Troy, accounting for 26.3% of all households. In contrast, only 97 households (2.0%) fall into the $200,000+ income bracket, making it the least populous group.
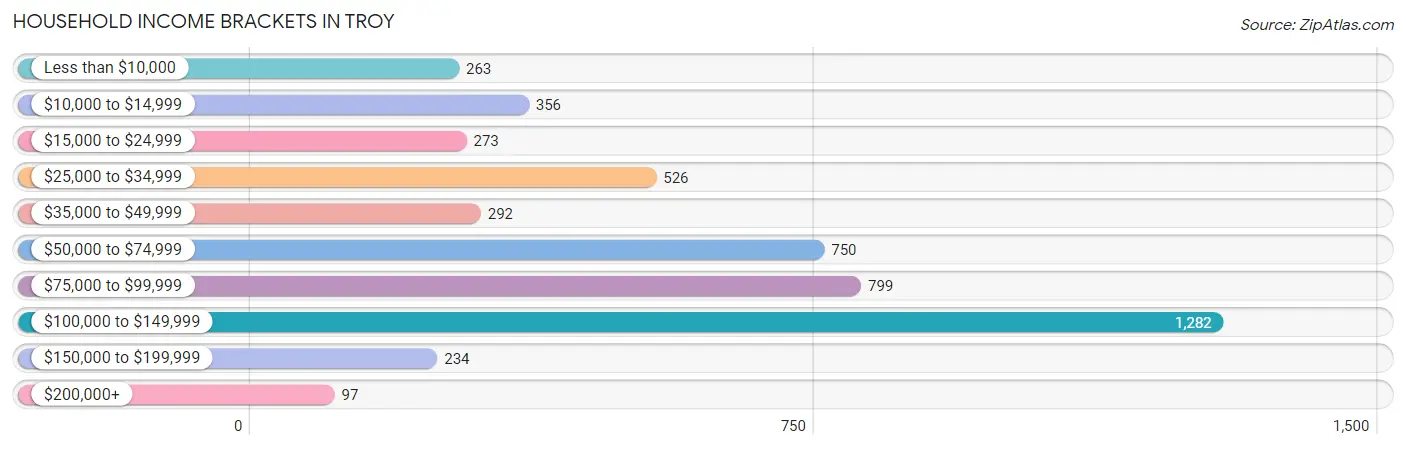
| Income Bracket | # Households | % Households |
| Less than $10,000 | 263 | 5.4% |
| $10,000 to $14,999 | 356 | 7.3% |
| $15,000 to $24,999 | 273 | 5.6% |
| $25,000 to $34,999 | 526 | 10.8% |
| $35,000 to $49,999 | 292 | 6.0% |
| $50,000 to $74,999 | 750 | 15.4% |
| $75,000 to $99,999 | 799 | 16.4% |
| $100,000 to $149,999 | 1,282 | 26.3% |
| $150,000 to $199,999 | 234 | 4.8% |
| $200,000+ | 97 | 2.0% |
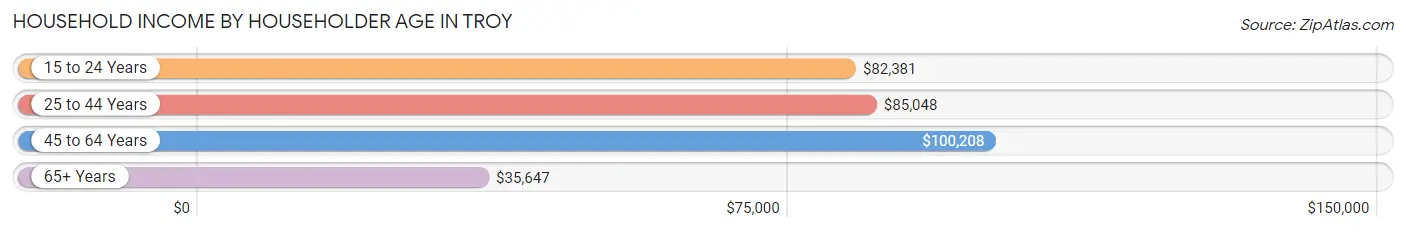
Household Income by Householder Age in Troy
The median household income in Troy is $74,463, with the highest median household income of $100,208 found in the 45 to 64 years age bracket for the primary householder. A total of 1,405 households (28.8%) fall into this category. Meanwhile, the 65+ years age bracket for the primary householder has the lowest median household income of $35,647, with 1,139 households (23.4%) in this group.
| Income Bracket | # Households | Median Income |
| 15 to 24 Years | 206 (4.2%) | $82,381 |
| 25 to 44 Years | 2,123 (43.6%) | $85,048 |
| 45 to 64 Years | 1,405 (28.8%) | $100,208 |
| 65+ Years | 1,139 (23.4%) | $35,647 |
| Total | 4,873 (100.0%) | $74,463 |
Poverty in Troy
Income Below Poverty by Sex and Age in Troy
With 8.1% poverty level for males and 13.7% for females among the residents of Troy, 6 to 11 year old males and 45 to 54 year old females are the most vulnerable to poverty, with 125 males (19.1%) and 156 females (28.5%) in their respective age groups living below the poverty level.
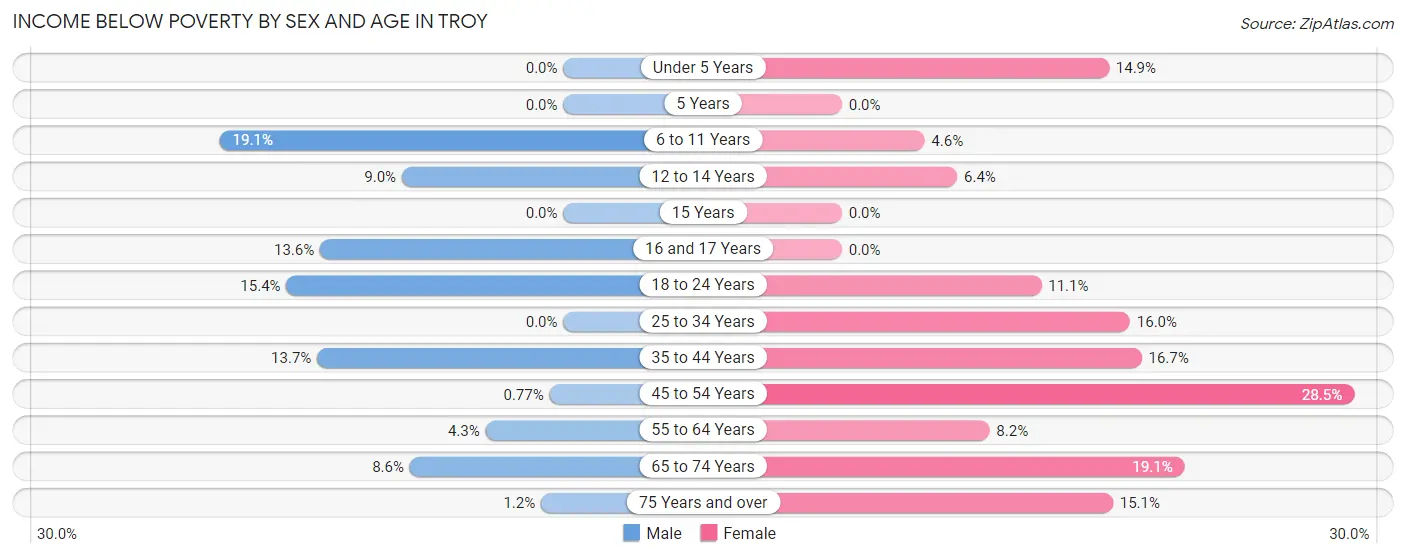
| Age Bracket | Male | Female |
| Under 5 Years | 0 (0.0%) | 76 (14.9%) |
| 5 Years | 0 (0.0%) | 0 (0.0%) |
| 6 to 11 Years | 125 (19.1%) | 15 (4.6%) |
| 12 to 14 Years | 24 (9.0%) | 21 (6.4%) |
| 15 Years | 0 (0.0%) | 0 (0.0%) |
| 16 and 17 Years | 29 (13.6%) | 0 (0.0%) |
| 18 to 24 Years | 78 (15.4%) | 54 (11.1%) |
| 25 to 34 Years | 0 (0.0%) | 180 (16.0%) |
| 35 to 44 Years | 140 (13.7%) | 148 (16.7%) |
| 45 to 54 Years | 4 (0.8%) | 156 (28.5%) |
| 55 to 64 Years | 33 (4.3%) | 77 (8.2%) |
| 65 to 74 Years | 33 (8.6%) | 109 (19.1%) |
| 75 Years and over | 3 (1.2%) | 72 (15.1%) |
| Total | 469 (8.1%) | 908 (13.7%) |
Income Above Poverty by Sex and Age in Troy
According to the poverty statistics in Troy, males aged under 5 years and females aged 5 years are the age groups that are most secure financially, with 100.0% of males and 100.0% of females in these age groups living above the poverty line.
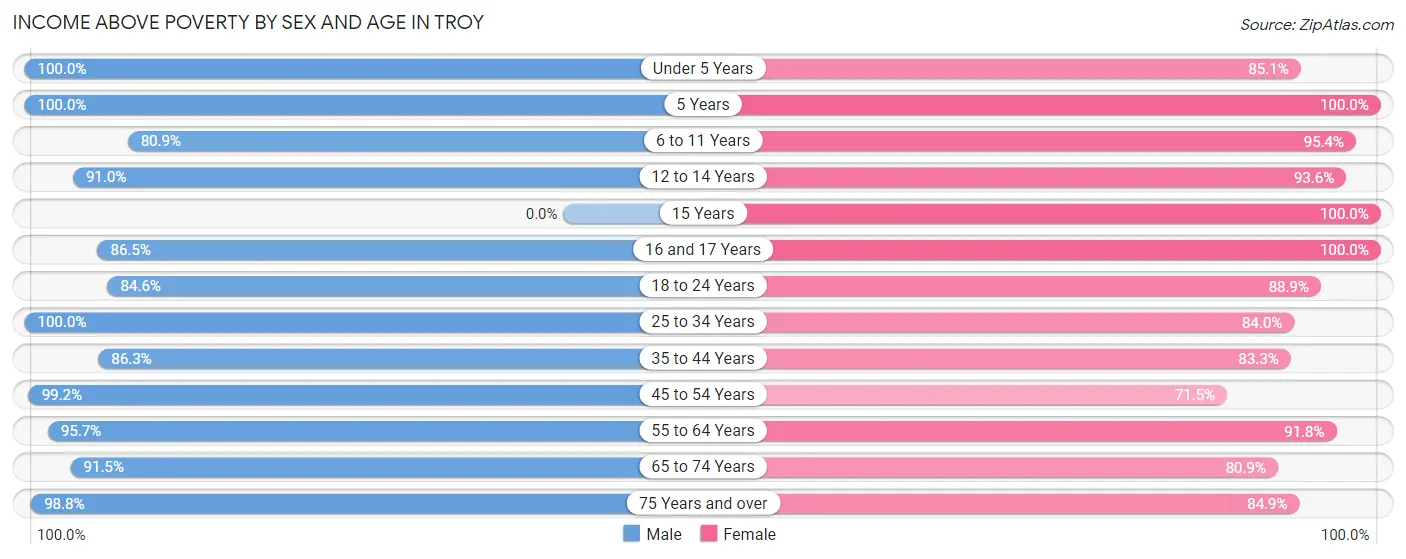
| Age Bracket | Male | Female |
| Under 5 Years | 227 (100.0%) | 435 (85.1%) |
| 5 Years | 125 (100.0%) | 147 (100.0%) |
| 6 to 11 Years | 528 (80.9%) | 311 (95.4%) |
| 12 to 14 Years | 243 (91.0%) | 306 (93.6%) |
| 15 Years | 0 (0.0%) | 50 (100.0%) |
| 16 and 17 Years | 185 (86.5%) | 223 (100.0%) |
| 18 to 24 Years | 428 (84.6%) | 432 (88.9%) |
| 25 to 34 Years | 871 (100.0%) | 942 (84.0%) |
| 35 to 44 Years | 881 (86.3%) | 739 (83.3%) |
| 45 to 54 Years | 515 (99.2%) | 391 (71.5%) |
| 55 to 64 Years | 730 (95.7%) | 860 (91.8%) |
| 65 to 74 Years | 353 (91.4%) | 462 (80.9%) |
| 75 Years and over | 239 (98.8%) | 405 (84.9%) |
| Total | 5,325 (91.9%) | 5,703 (86.3%) |
Income Below Poverty Among Married-Couple Families in Troy
The poverty statistics for married-couple families in Troy show that 5.1% or 129 of the total 2,523 families live below the poverty line. Families with 1 or 2 children have the highest poverty rate of 14.8%, comprising of 129 families. On the other hand, families with no children have the lowest poverty rate of 0.0%, which includes 0 families.
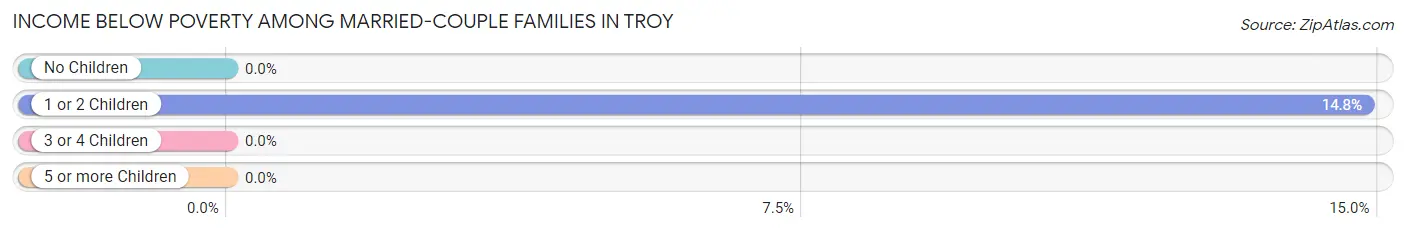
| Children | Above Poverty | Below Poverty |
| No Children | 1,483 (100.0%) | 0 (0.0%) |
| 1 or 2 Children | 741 (85.2%) | 129 (14.8%) |
| 3 or 4 Children | 141 (100.0%) | 0 (0.0%) |
| 5 or more Children | 29 (100.0%) | 0 (0.0%) |
| Total | 2,394 (94.9%) | 129 (5.1%) |
Income Below Poverty Among Single-Parent Households in Troy
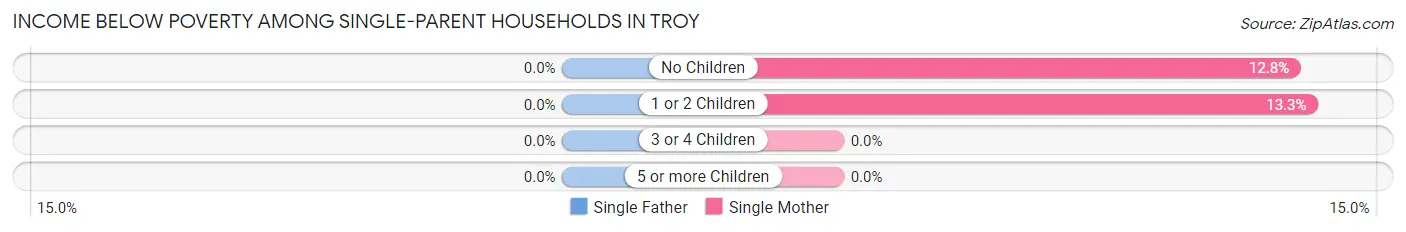
| Children | Single Father | Single Mother |
| No Children | 0 (0.0%) | 29 (12.8%) |
| 1 or 2 Children | 0 (0.0%) | 63 (13.3%) |
| 3 or 4 Children | 0 (0.0%) | 0 (0.0%) |
| 5 or more Children | 0 (0.0%) | 0 (0.0%) |
| Total | 0 (0.0%) | 92 (11.8%) |
Income Below Poverty Among Married-Couple vs Single-Parent Households in Troy
The poverty data for Troy shows that 129 of the married-couple family households (5.1%) and 92 of the single-parent households (8.3%) are living below the poverty level. Within the married-couple family households, those with 1 or 2 children have the highest poverty rate, with 129 households (14.8%) falling below the poverty line. Among the single-parent households, those with 1 or 2 children have the highest poverty rate, with 63 household (9.9%) living below poverty.
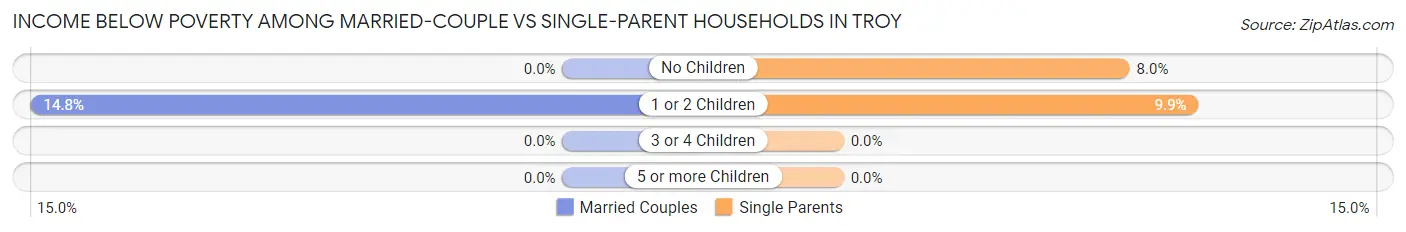
| Children | Married-Couple Families | Single-Parent Households |
| No Children | 0 (0.0%) | 29 (8.0%) |
| 1 or 2 Children | 129 (14.8%) | 63 (9.9%) |
| 3 or 4 Children | 0 (0.0%) | 0 (0.0%) |
| 5 or more Children | 0 (0.0%) | 0 (0.0%) |
| Total | 129 (5.1%) | 92 (8.3%) |
Race in Troy
The most populous races in Troy are White / Caucasian (12,038 | 92.9%), Two or more Races (592 | 4.6%), and Hispanic or Latino (397 | 3.1%).
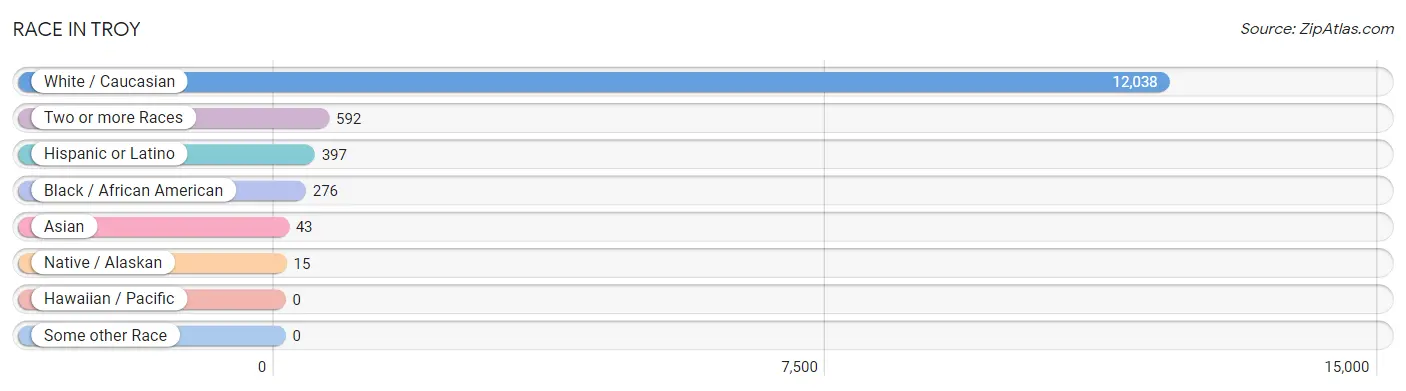
| Race | # Population | % Population |
| Asian | 43 | 0.3% |
| Black / African American | 276 | 2.1% |
| Hawaiian / Pacific | 0 | 0.0% |
| Hispanic or Latino | 397 | 3.1% |
| Native / Alaskan | 15 | 0.1% |
| White / Caucasian | 12,038 | 92.9% |
| Two or more Races | 592 | 4.6% |
| Some other Race | 0 | 0.0% |
| Total | 12,964 | 100.0% |
Ancestry in Troy
The most populous ancestries reported in Troy are German (3,988 | 30.8%), Irish (1,533 | 11.8%), English (1,174 | 9.1%), American (713 | 5.5%), and Italian (557 | 4.3%), together accounting for 61.5% of all Troy residents.
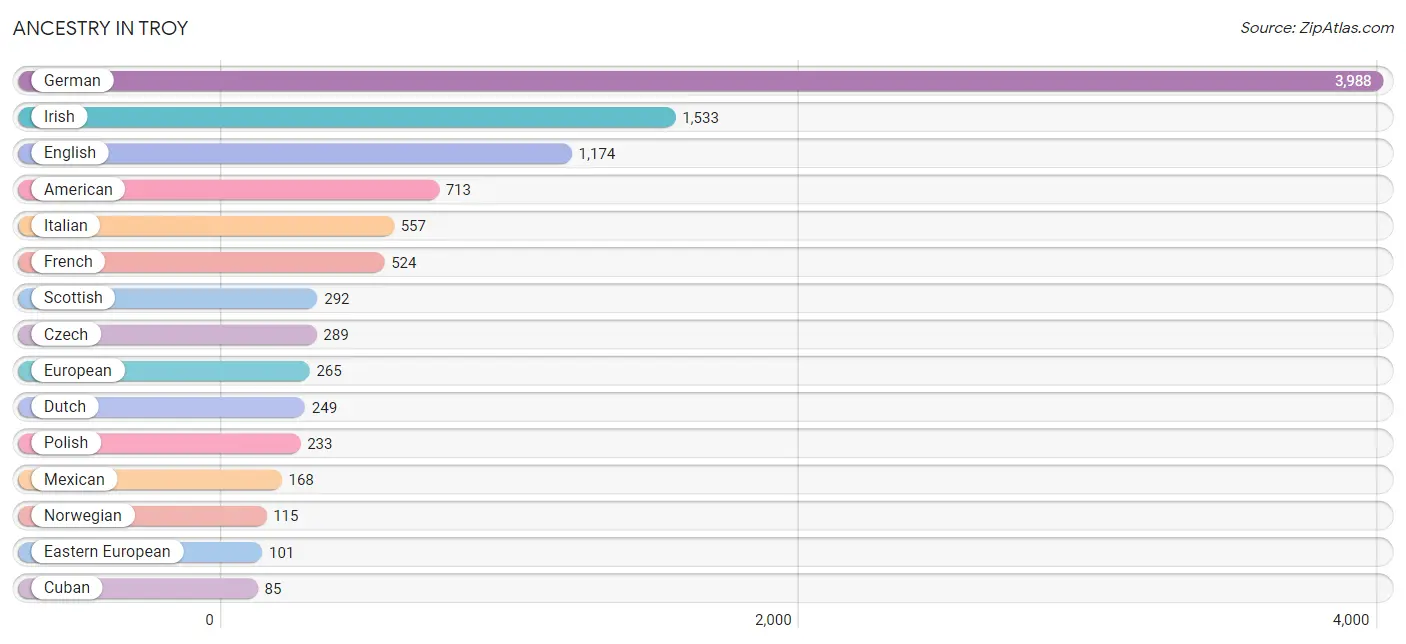
| Ancestry | # Population | % Population |
| American | 713 | 5.5% |
| Austrian | 9 | 0.1% |
| Bhutanese | 35 | 0.3% |
| Brazilian | 10 | 0.1% |
| British | 57 | 0.4% |
| Central American | 58 | 0.4% |
| Cherokee | 31 | 0.2% |
| Choctaw | 19 | 0.2% |
| Croatian | 15 | 0.1% |
| Cuban | 85 | 0.7% |
| Czech | 289 | 2.2% |
| Czechoslovakian | 13 | 0.1% |
| Danish | 18 | 0.1% |
| Dutch | 249 | 1.9% |
| Eastern European | 101 | 0.8% |
| English | 1,174 | 9.1% |
| European | 265 | 2.0% |
| Finnish | 6 | 0.1% |
| French | 524 | 4.0% |
| French Canadian | 14 | 0.1% |
| German | 3,988 | 30.8% |
| Hungarian | 40 | 0.3% |
| Irish | 1,533 | 11.8% |
| Italian | 557 | 4.3% |
| Korean | 43 | 0.3% |
| Mexican | 168 | 1.3% |
| Mexican American Indian | 14 | 0.1% |
| Nicaraguan | 58 | 0.4% |
| Norwegian | 115 | 0.9% |
| Osage | 20 | 0.2% |
| Polish | 233 | 1.8% |
| Russian | 21 | 0.2% |
| Scandinavian | 48 | 0.4% |
| Scotch-Irish | 77 | 0.6% |
| Scottish | 292 | 2.2% |
| Sioux | 21 | 0.2% |
| Spaniard | 46 | 0.4% |
| Swedish | 13 | 0.1% |
| Ukrainian | 20 | 0.2% |
| Welsh | 43 | 0.3% | View All 40 Rows |
Immigrants in Troy
The most numerous immigrant groups reported in Troy came from Asia (29 | 0.2%), Philippines (29 | 0.2%), South Eastern Asia (29 | 0.2%), Latin America (27 | 0.2%), and Central America (17 | 0.1%), together accounting for 1.0% of all Troy residents.
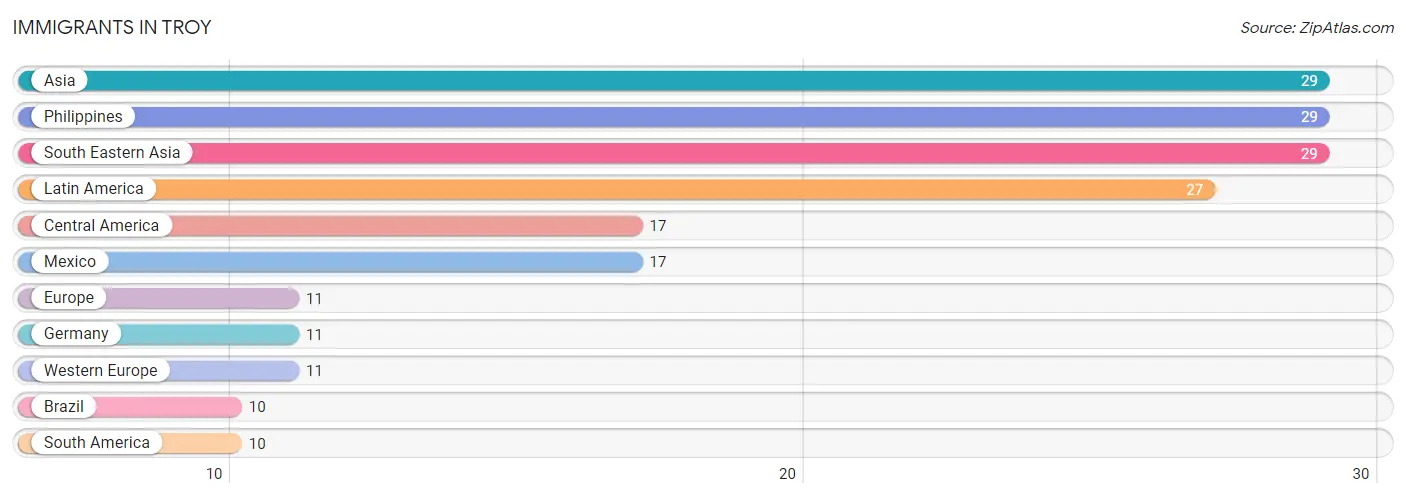
| Immigration Origin | # Population | % Population |
| Asia | 29 | 0.2% |
| Brazil | 10 | 0.1% |
| Central America | 17 | 0.1% |
| Europe | 11 | 0.1% |
| Germany | 11 | 0.1% |
| Latin America | 27 | 0.2% |
| Mexico | 17 | 0.1% |
| Philippines | 29 | 0.2% |
| South America | 10 | 0.1% |
| South Eastern Asia | 29 | 0.2% |
| Western Europe | 11 | 0.1% | View All 11 Rows |
Sex and Age in Troy
Sex and Age in Troy
The most populous age groups in Troy are 5 to 9 Years (703 | 11.4%) for men and 25 to 29 Years (572 | 8.4%) for women.
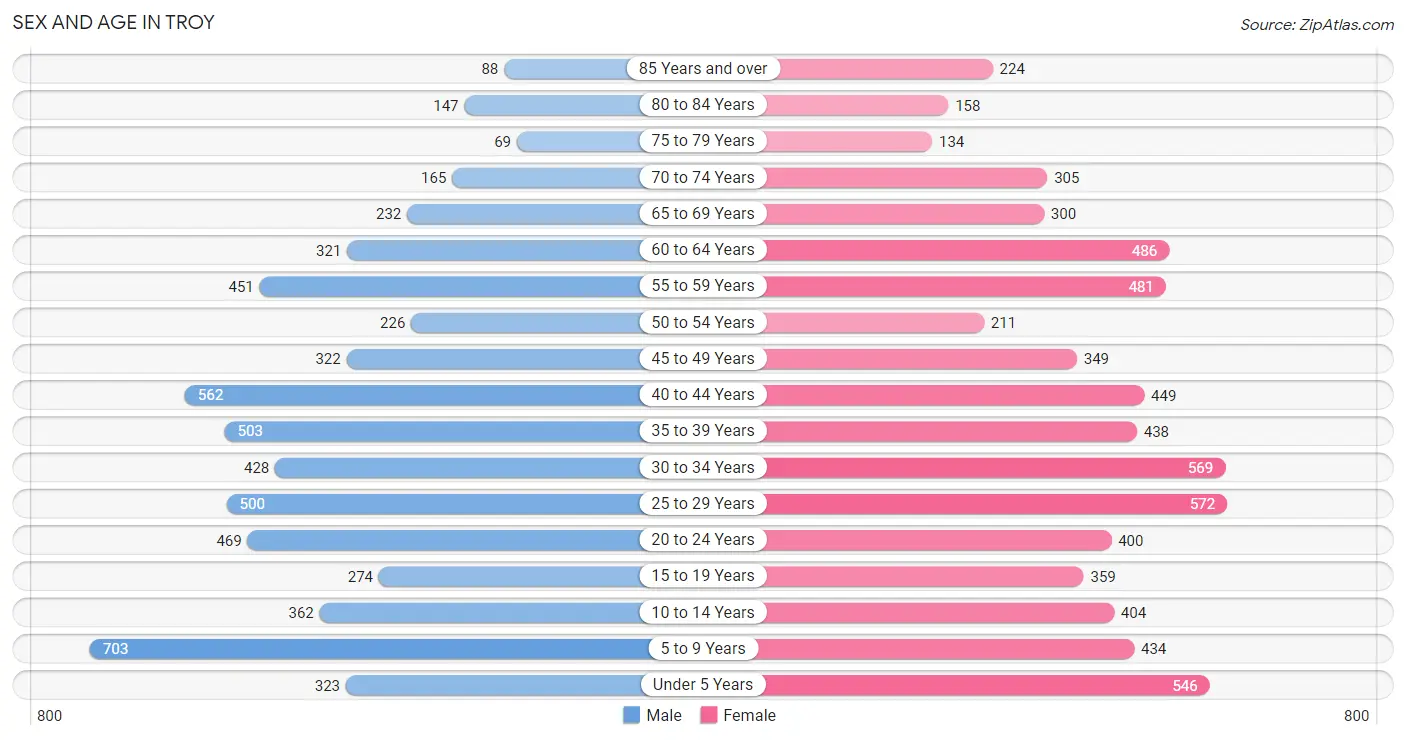
| Age Bracket | Male | Female |
| Under 5 Years | 323 (5.3%) | 546 (8.0%) |
| 5 to 9 Years | 703 (11.4%) | 434 (6.4%) |
| 10 to 14 Years | 362 (5.9%) | 404 (5.9%) |
| 15 to 19 Years | 274 (4.5%) | 359 (5.3%) |
| 20 to 24 Years | 469 (7.6%) | 400 (5.9%) |
| 25 to 29 Years | 500 (8.1%) | 572 (8.4%) |
| 30 to 34 Years | 428 (7.0%) | 569 (8.3%) |
| 35 to 39 Years | 503 (8.2%) | 438 (6.4%) |
| 40 to 44 Years | 562 (9.1%) | 449 (6.6%) |
| 45 to 49 Years | 322 (5.2%) | 349 (5.1%) |
| 50 to 54 Years | 226 (3.7%) | 211 (3.1%) |
| 55 to 59 Years | 451 (7.3%) | 481 (7.0%) |
| 60 to 64 Years | 321 (5.2%) | 486 (7.1%) |
| 65 to 69 Years | 232 (3.8%) | 300 (4.4%) |
| 70 to 74 Years | 165 (2.7%) | 305 (4.5%) |
| 75 to 79 Years | 69 (1.1%) | 134 (2.0%) |
| 80 to 84 Years | 147 (2.4%) | 158 (2.3%) |
| 85 Years and over | 88 (1.4%) | 224 (3.3%) |
| Total | 6,145 (100.0%) | 6,819 (100.0%) |
Families and Households in Troy
Median Family Size in Troy
The median family size in Troy is 2.84 persons per family, with married-couple families (2,523 | 69.4%) accounting for the largest median family size of 2.91 persons per family. On the other hand, single male/father families (335 | 9.2%) represent the smallest median family size with 2.45 persons per family.
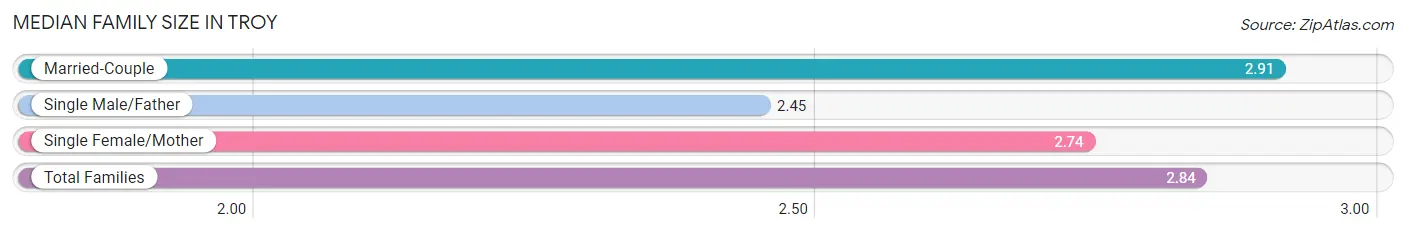
| Family Type | # Families | Family Size |
| Married-Couple | 2,523 (69.4%) | 2.91 |
| Single Male/Father | 335 (9.2%) | 2.45 |
| Single Female/Mother | 777 (21.4%) | 2.74 |
| Total Families | 3,635 (100.0%) | 2.84 |
Median Household Size in Troy
The median household size in Troy is 2.58 persons per household, with single female/mother households (777 | 16.0%) accounting for the largest median household size of 3.2 persons per household. non-family households (1,238 | 25.4%) represent the smallest median household size with 1.25 persons per household.
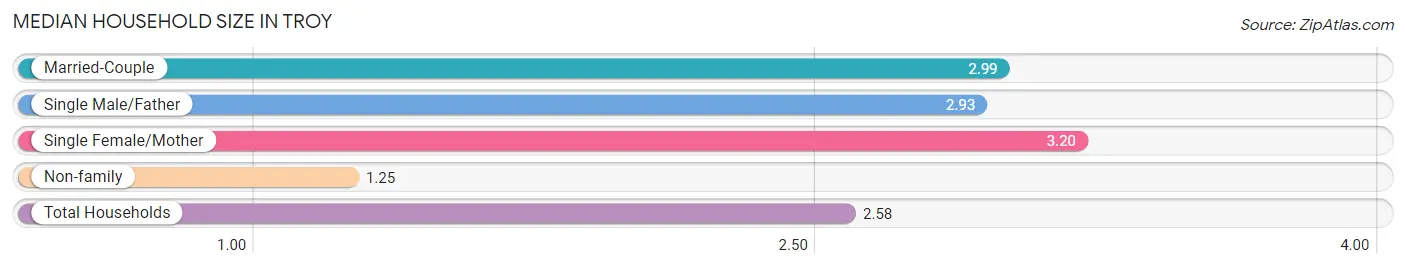
| Household Type | # Households | Household Size |
| Married-Couple | 2,523 (51.8%) | 2.99 |
| Single Male/Father | 335 (6.9%) | 2.93 |
| Single Female/Mother | 777 (16.0%) | 3.20 |
| Non-family | 1,238 (25.4%) | 1.25 |
| Total Households | 4,873 (100.0%) | 2.58 |
Household Size by Marriage Status in Troy
Out of a total of 4,873 households in Troy, 3,635 (74.6%) are family households, while 1,238 (25.4%) are nonfamily households. The most numerous type of family households are 2-person households, comprising 1,689, and the most common type of nonfamily households are 1-person households, comprising 982.
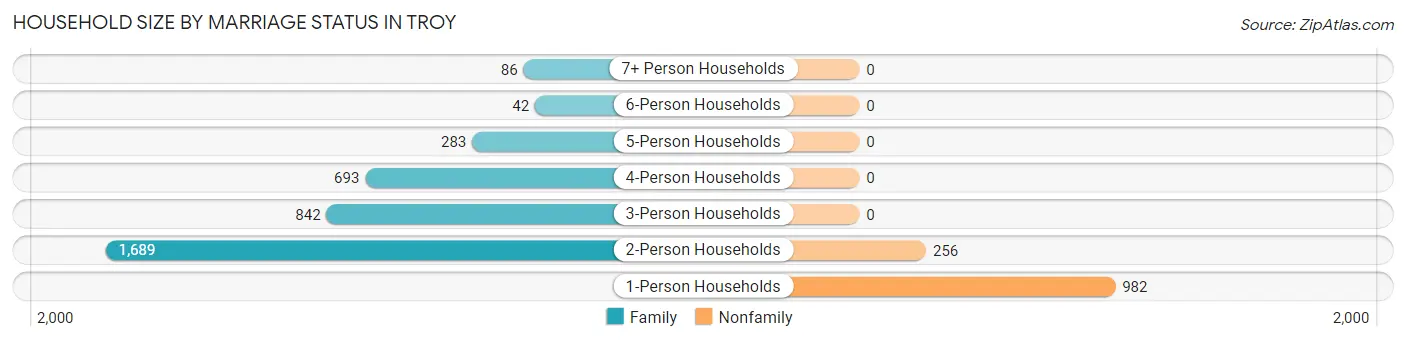
| Household Size | Family Households | Nonfamily Households |
| 1-Person Households | - | 982 (20.2%) |
| 2-Person Households | 1,689 (34.7%) | 256 (5.2%) |
| 3-Person Households | 842 (17.3%) | 0 (0.0%) |
| 4-Person Households | 693 (14.2%) | 0 (0.0%) |
| 5-Person Households | 283 (5.8%) | 0 (0.0%) |
| 6-Person Households | 42 (0.9%) | 0 (0.0%) |
| 7+ Person Households | 86 (1.8%) | 0 (0.0%) |
| Total | 3,635 (74.6%) | 1,238 (25.4%) |
Female Fertility in Troy
Fertility by Age in Troy
Average fertility rate in Troy is 57.0 births per 1,000 women. Women in the age bracket of 20 to 34 years have the highest fertility rate with 93.0 births per 1,000 women. Women in the age bracket of 20 to 34 years acount for 79.4% of all women with births.
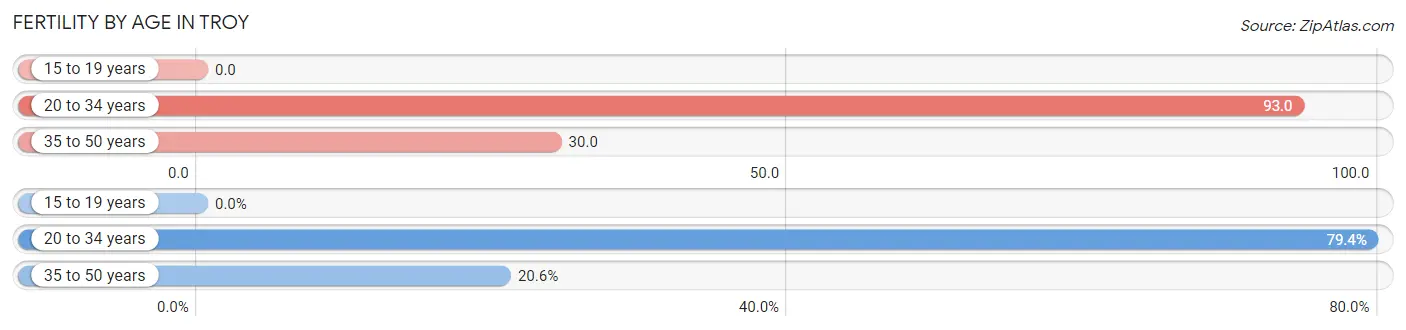
| Age Bracket | Women with Births | Births / 1,000 Women |
| 15 to 19 years | 0 (0.0%) | 0.0 |
| 20 to 34 years | 143 (79.4%) | 93.0 |
| 35 to 50 years | 37 (20.6%) | 30.0 |
| Total | 180 (100.0%) | 57.0 |
Fertility by Age by Marriage Status in Troy
76.1% of women with births (180) in Troy are married. The highest percentage of unmarried women with births falls into 20 to 34 years age bracket with 30.1% of them unmarried at the time of birth, while the lowest percentage of unmarried women with births belong to 35 to 50 years age bracket with 0.0% of them unmarried.
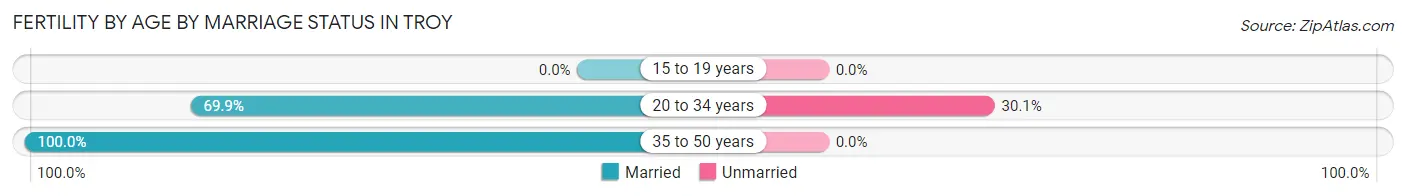
| Age Bracket | Married | Unmarried |
| 15 to 19 years | 0 (0.0%) | 0 (0.0%) |
| 20 to 34 years | 100 (69.9%) | 43 (30.1%) |
| 35 to 50 years | 37 (100.0%) | 0 (0.0%) |
| Total | 137 (76.1%) | 43 (23.9%) |
Fertility by Education in Troy
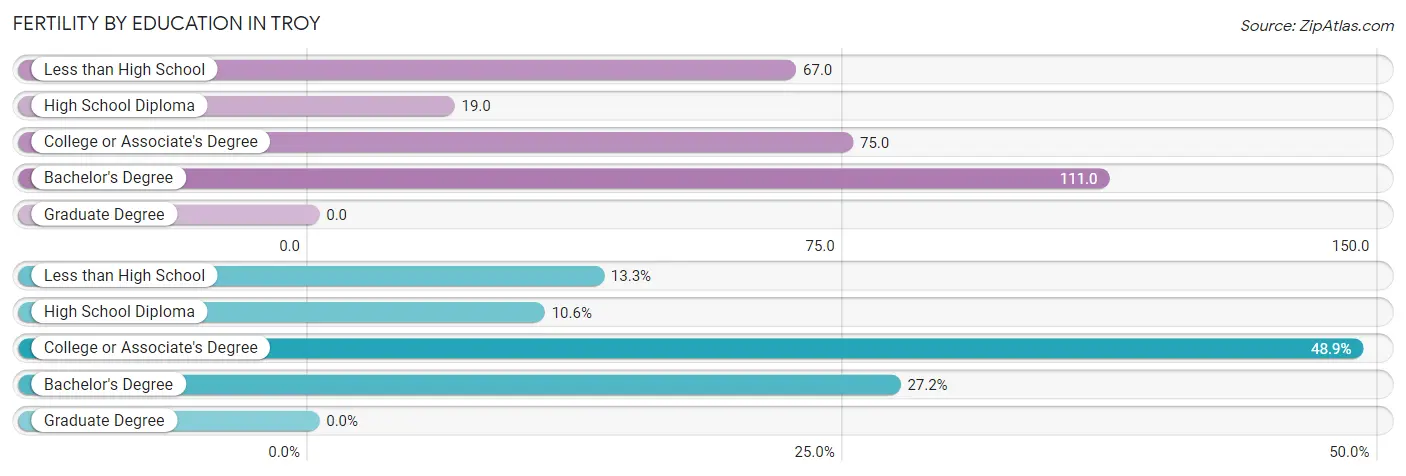
| Educational Attainment | Women with Births | Births / 1,000 Women |
| Less than High School | 24 (13.3%) | 67.0 |
| High School Diploma | 19 (10.6%) | 19.0 |
| College or Associate's Degree | 88 (48.9%) | 75.0 |
| Bachelor's Degree | 49 (27.2%) | 111.0 |
| Graduate Degree | 0 (0.0%) | 0.0 |
| Total | 180 (100.0%) | 57.0 |
Fertility by Education by Marriage Status in Troy
23.9% of women with births in Troy are unmarried. Women with the educational attainment of less than high school are most likely to be married with 100.0% of them married at childbirth, while women with the educational attainment of college or associate's degree are least likely to be married with 48.9% of them unmarried at childbirth.
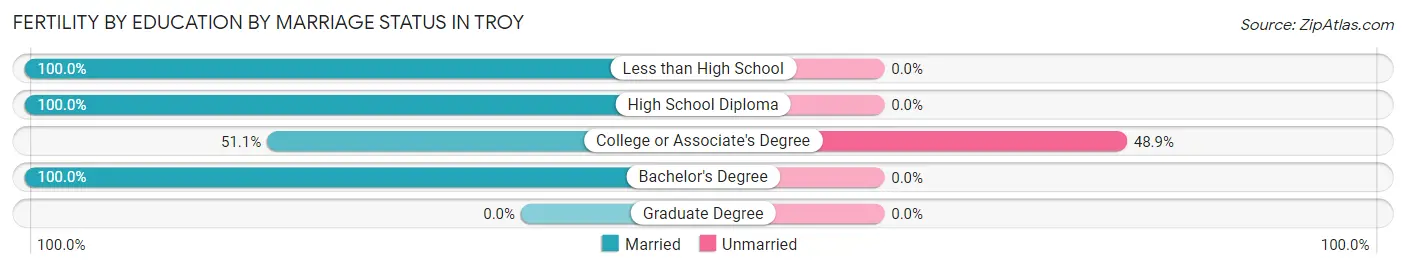
| Educational Attainment | Married | Unmarried |
| Less than High School | 24 (100.0%) | 0 (0.0%) |
| High School Diploma | 19 (100.0%) | 0 (0.0%) |
| College or Associate's Degree | 45 (51.1%) | 43 (48.9%) |
| Bachelor's Degree | 49 (100.0%) | 0 (0.0%) |
| Graduate Degree | 0 (0.0%) | 0 (0.0%) |
| Total | 137 (76.1%) | 43 (23.9%) |
Employment Characteristics in Troy
Employment by Class of Employer in Troy
Among the 6,364 employed individuals in Troy, private company employees (5,110 | 80.3%), not-for-profit organizations (494 | 7.8%), and local government employees (449 | 7.1%) make up the most common classes of employment.
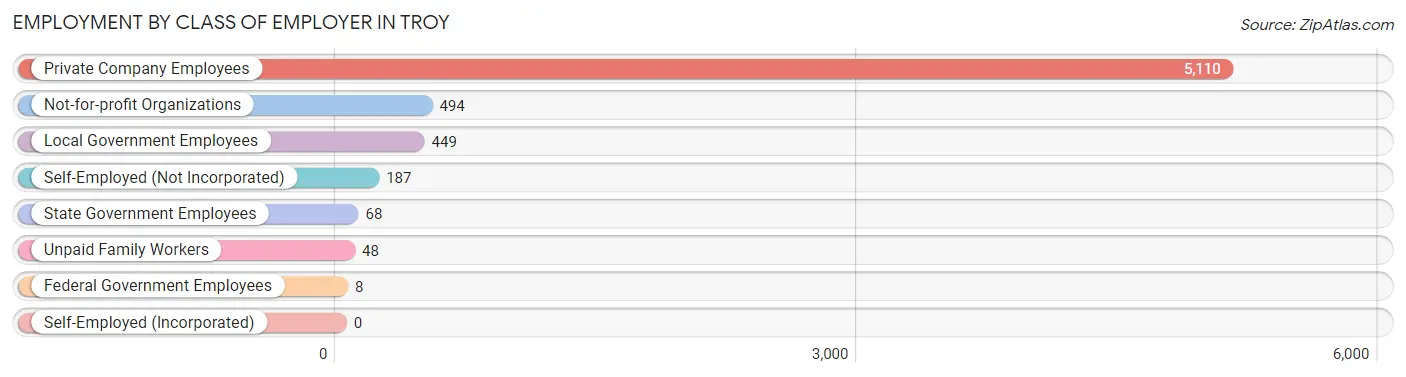
| Employer Class | # Employees | % Employees |
| Private Company Employees | 5,110 | 80.3% |
| Self-Employed (Incorporated) | 0 | 0.0% |
| Self-Employed (Not Incorporated) | 187 | 2.9% |
| Not-for-profit Organizations | 494 | 7.8% |
| Local Government Employees | 449 | 7.1% |
| State Government Employees | 68 | 1.1% |
| Federal Government Employees | 8 | 0.1% |
| Unpaid Family Workers | 48 | 0.7% |
| Total | 6,364 | 100.0% |
Employment Status by Age in Troy
According to the labor force statistics for Troy, out of the total population over 16 years of age (10,142), 65.3% or 6,623 individuals are in the labor force, with 1.8% or 119 of them unemployed. The age group with the highest labor force participation rate is 30 to 34 years, with 85.0% or 847 individuals in the labor force. Within the labor force, the 16 to 19 years age range has the highest percentage of unemployed individuals, with 20.6% or 67 of them being unemployed.
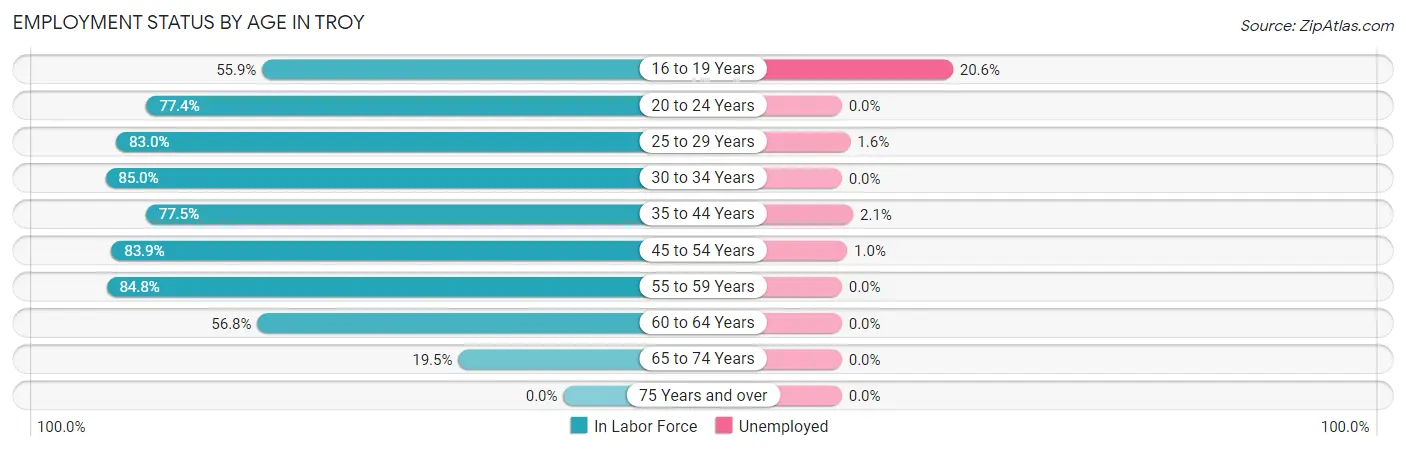
| Age Bracket | In Labor Force | Unemployed |
| 16 to 19 Years | 326 (55.9%) | 67 (20.6%) |
| 20 to 24 Years | 673 (77.4%) | 0 (0.0%) |
| 25 to 29 Years | 890 (83.0%) | 14 (1.6%) |
| 30 to 34 Years | 847 (85.0%) | 0 (0.0%) |
| 35 to 44 Years | 1,513 (77.5%) | 32 (2.1%) |
| 45 to 54 Years | 930 (83.9%) | 9 (1.0%) |
| 55 to 59 Years | 790 (84.8%) | 0 (0.0%) |
| 60 to 64 Years | 458 (56.8%) | 0 (0.0%) |
| 65 to 74 Years | 195 (19.5%) | 0 (0.0%) |
| 75 Years and over | 0 (0.0%) | 0 (0.0%) |
| Total | 6,623 (65.3%) | 119 (1.8%) |
Employment Status by Educational Attainment in Troy
According to labor force statistics for Troy, 79.0% of individuals (5,426) out of the total population between 25 and 64 years of age (6,868) are in the labor force, with 1.0% or 54 of them being unemployed. The group with the highest labor force participation rate are those with the educational attainment of bachelor's degree or higher, with 90.0% or 885 individuals in the labor force. Within the labor force, individuals with college / associate degree education have the highest percentage of unemployment, with 1.5% or 31 of them being unemployed.
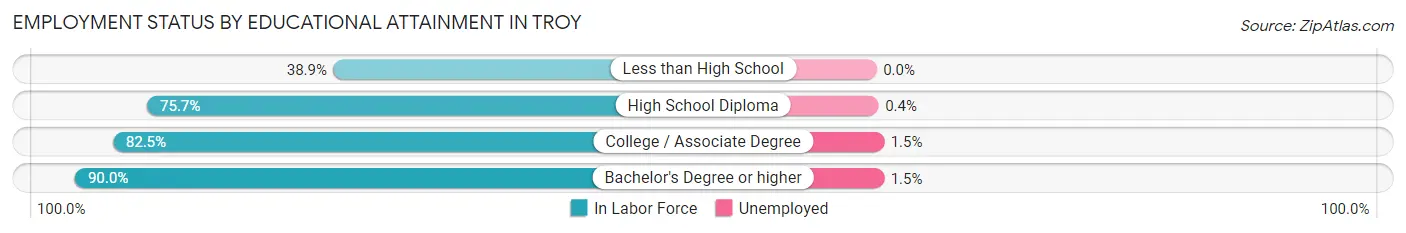
| Educational Attainment | In Labor Force | Unemployed |
| Less than High School | 89 (38.9%) | 0 (0.0%) |
| High School Diploma | 2,369 (75.7%) | 13 (0.4%) |
| College / Associate Degree | 2,084 (82.5%) | 38 (1.5%) |
| Bachelor's Degree or higher | 885 (90.0%) | 15 (1.5%) |
| Total | 5,426 (79.0%) | 69 (1.0%) |
Employment Occupations by Sex in Troy
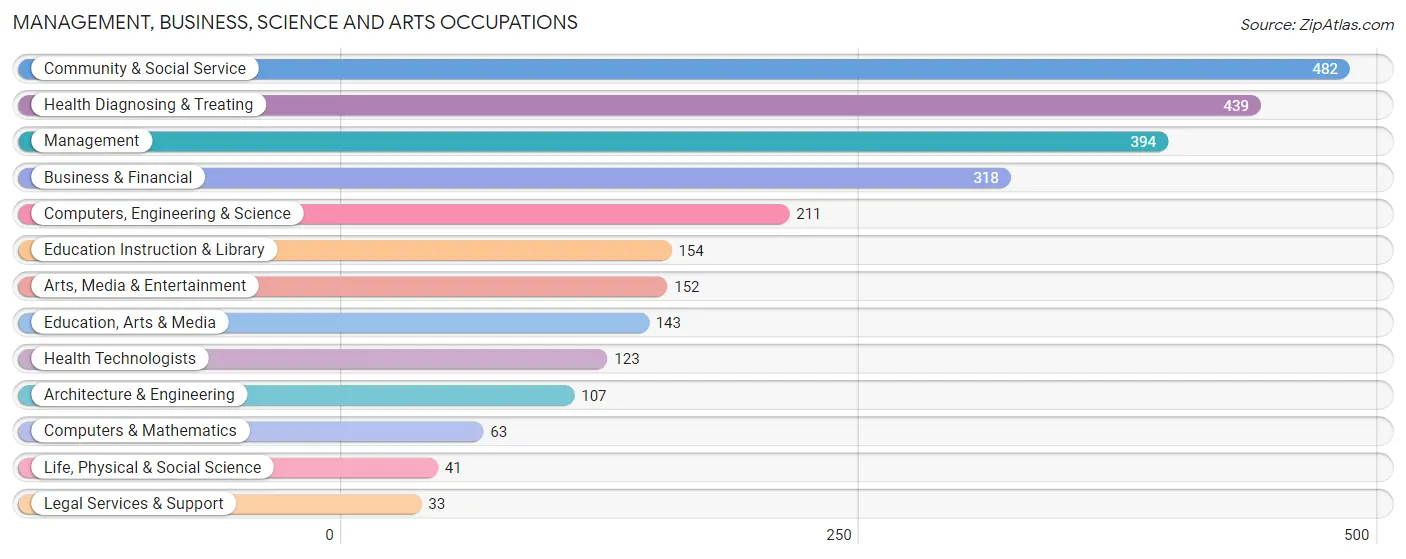
Management, Business, Science and Arts Occupations
The most common Management, Business, Science and Arts occupations in Troy are Community & Social Service (482 | 7.4%), Health Diagnosing & Treating (439 | 6.8%), Management (394 | 6.1%), Business & Financial (318 | 4.9%), and Computers, Engineering & Science (211 | 3.3%).
Management, Business, Science and Arts Occupations by Sex
Within the Management, Business, Science and Arts occupations in Troy, the most male-oriented occupations are Computers & Mathematics (100.0%), Architecture & Engineering (92.5%), and Computers, Engineering & Science (86.7%), while the most female-oriented occupations are Legal Services & Support (100.0%), Health Technologists (86.2%), and Health Diagnosing & Treating (86.1%).
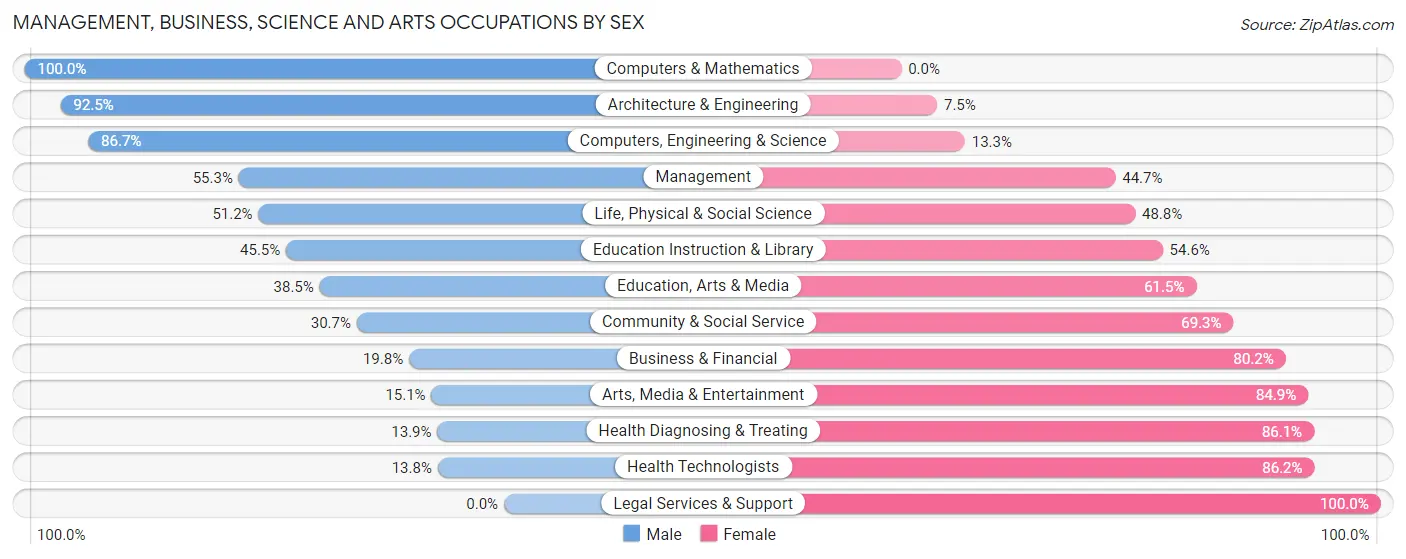
| Occupation | Male | Female |
| Management | 218 (55.3%) | 176 (44.7%) |
| Business & Financial | 63 (19.8%) | 255 (80.2%) |
| Computers, Engineering & Science | 183 (86.7%) | 28 (13.3%) |
| Computers & Mathematics | 63 (100.0%) | 0 (0.0%) |
| Architecture & Engineering | 99 (92.5%) | 8 (7.5%) |
| Life, Physical & Social Science | 21 (51.2%) | 20 (48.8%) |
| Community & Social Service | 148 (30.7%) | 334 (69.3%) |
| Education, Arts & Media | 55 (38.5%) | 88 (61.5%) |
| Legal Services & Support | 0 (0.0%) | 33 (100.0%) |
| Education Instruction & Library | 70 (45.5%) | 84 (54.5%) |
| Arts, Media & Entertainment | 23 (15.1%) | 129 (84.9%) |
| Health Diagnosing & Treating | 61 (13.9%) | 378 (86.1%) |
| Health Technologists | 17 (13.8%) | 106 (86.2%) |
| Total (Category) | 673 (36.5%) | 1,171 (63.5%) |
| Total (Overall) | 3,501 (53.9%) | 2,999 (46.1%) |
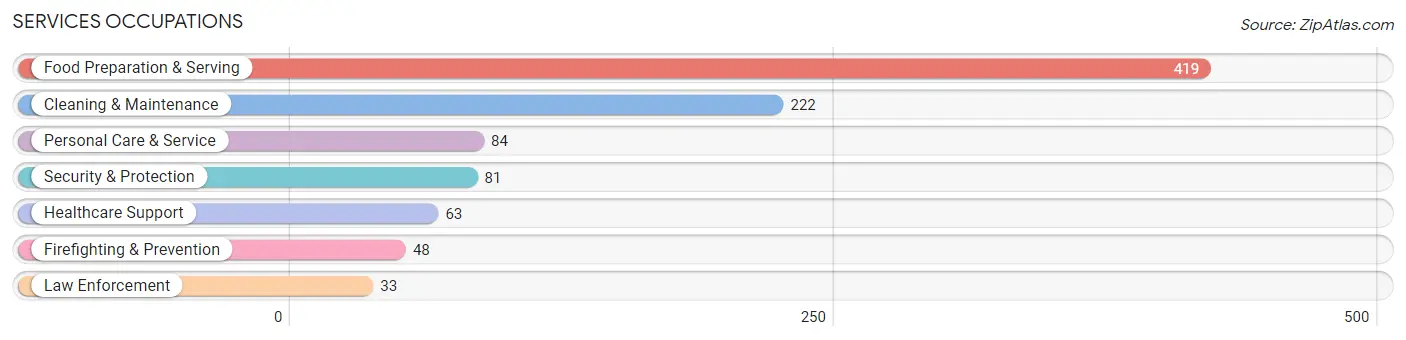
Services Occupations
The most common Services occupations in Troy are Food Preparation & Serving (419 | 6.5%), Cleaning & Maintenance (222 | 3.4%), Personal Care & Service (84 | 1.3%), Security & Protection (81 | 1.3%), and Healthcare Support (63 | 1.0%).
Services Occupations by Sex
Within the Services occupations in Troy, the most male-oriented occupations are Law Enforcement (100.0%), Security & Protection (79.0%), and Cleaning & Maintenance (68.5%), while the most female-oriented occupations are Healthcare Support (100.0%), Personal Care & Service (85.7%), and Food Preparation & Serving (56.1%).
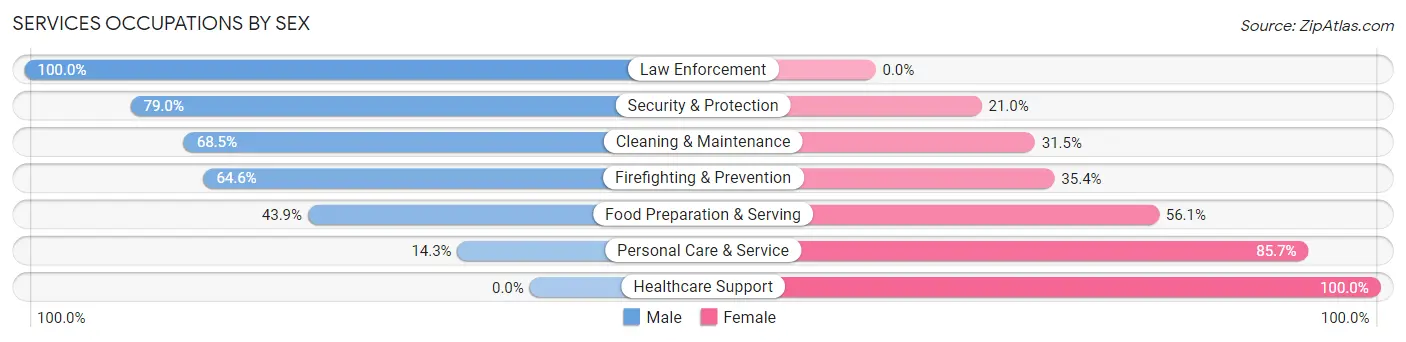
| Occupation | Male | Female |
| Healthcare Support | 0 (0.0%) | 63 (100.0%) |
| Security & Protection | 64 (79.0%) | 17 (21.0%) |
| Firefighting & Prevention | 31 (64.6%) | 17 (35.4%) |
| Law Enforcement | 33 (100.0%) | 0 (0.0%) |
| Food Preparation & Serving | 184 (43.9%) | 235 (56.1%) |
| Cleaning & Maintenance | 152 (68.5%) | 70 (31.5%) |
| Personal Care & Service | 12 (14.3%) | 72 (85.7%) |
| Total (Category) | 412 (47.4%) | 457 (52.6%) |
| Total (Overall) | 3,501 (53.9%) | 2,999 (46.1%) |
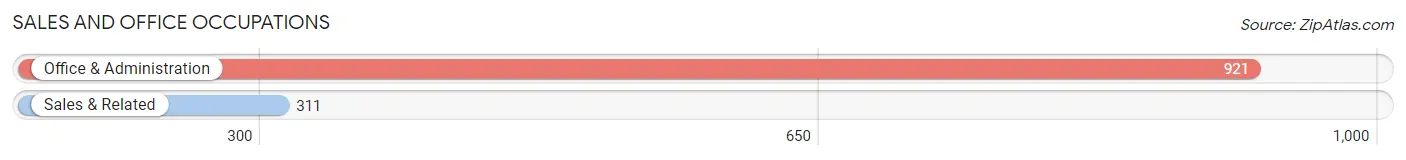
Sales and Office Occupations
The most common Sales and Office occupations in Troy are Office & Administration (921 | 14.2%), and Sales & Related (311 | 4.8%).
Sales and Office Occupations by Sex

| Occupation | Male | Female |
| Sales & Related | 139 (44.7%) | 172 (55.3%) |
| Office & Administration | 43 (4.7%) | 878 (95.3%) |
| Total (Category) | 182 (14.8%) | 1,050 (85.2%) |
| Total (Overall) | 3,501 (53.9%) | 2,999 (46.1%) |
Natural Resources, Construction and Maintenance Occupations
The most common Natural Resources, Construction and Maintenance occupations in Troy are Construction & Extraction (828 | 12.7%), Installation, Maintenance & Repair (175 | 2.7%), and Farming, Fishing & Forestry (33 | 0.5%).

Natural Resources, Construction and Maintenance Occupations by Sex

| Occupation | Male | Female |
| Farming, Fishing & Forestry | 20 (60.6%) | 13 (39.4%) |
| Construction & Extraction | 828 (100.0%) | 0 (0.0%) |
| Installation, Maintenance & Repair | 175 (100.0%) | 0 (0.0%) |
| Total (Category) | 1,023 (98.8%) | 13 (1.3%) |
| Total (Overall) | 3,501 (53.9%) | 2,999 (46.1%) |
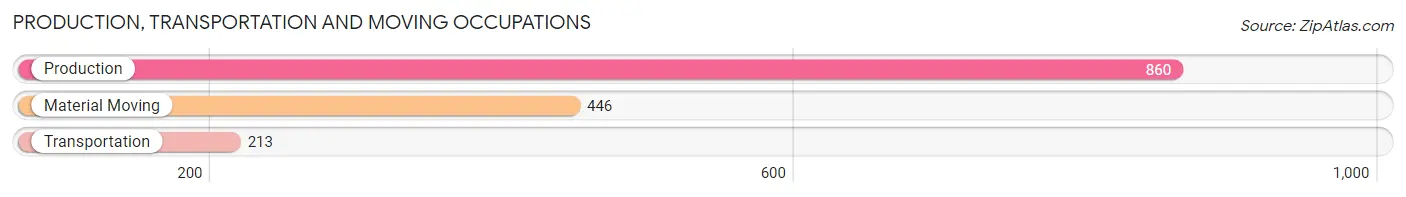
Production, Transportation and Moving Occupations
The most common Production, Transportation and Moving occupations in Troy are Production (860 | 13.2%), Material Moving (446 | 6.9%), and Transportation (213 | 3.3%).
Production, Transportation and Moving Occupations by Sex

| Occupation | Male | Female |
| Production | 728 (84.7%) | 132 (15.3%) |
| Transportation | 213 (100.0%) | 0 (0.0%) |
| Material Moving | 270 (60.5%) | 176 (39.5%) |
| Total (Category) | 1,211 (79.7%) | 308 (20.3%) |
| Total (Overall) | 3,501 (53.9%) | 2,999 (46.1%) |
Employment Industries by Sex in Troy
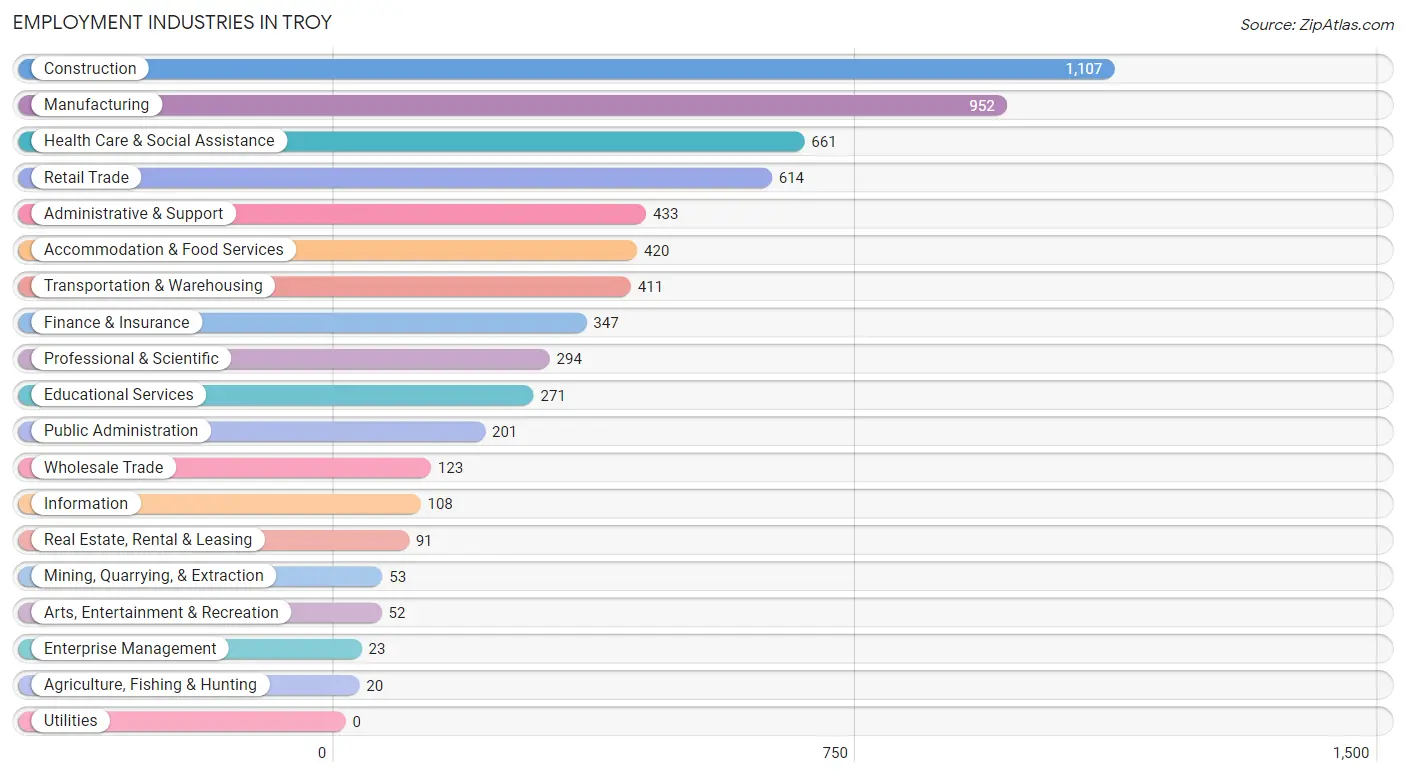
Employment Industries in Troy
The major employment industries in Troy include Construction (1,107 | 17.0%), Manufacturing (952 | 14.6%), Health Care & Social Assistance (661 | 10.2%), Retail Trade (614 | 9.5%), and Administrative & Support (433 | 6.7%).
Employment Industries by Sex in Troy
The Troy industries that see more men than women are Agriculture, Fishing & Hunting (100.0%), Enterprise Management (100.0%), and Arts, Entertainment & Recreation (100.0%), whereas the industries that tend to have a higher number of women are Mining, Quarrying, & Extraction (100.0%), Finance & Insurance (91.3%), and Professional & Scientific (88.1%).
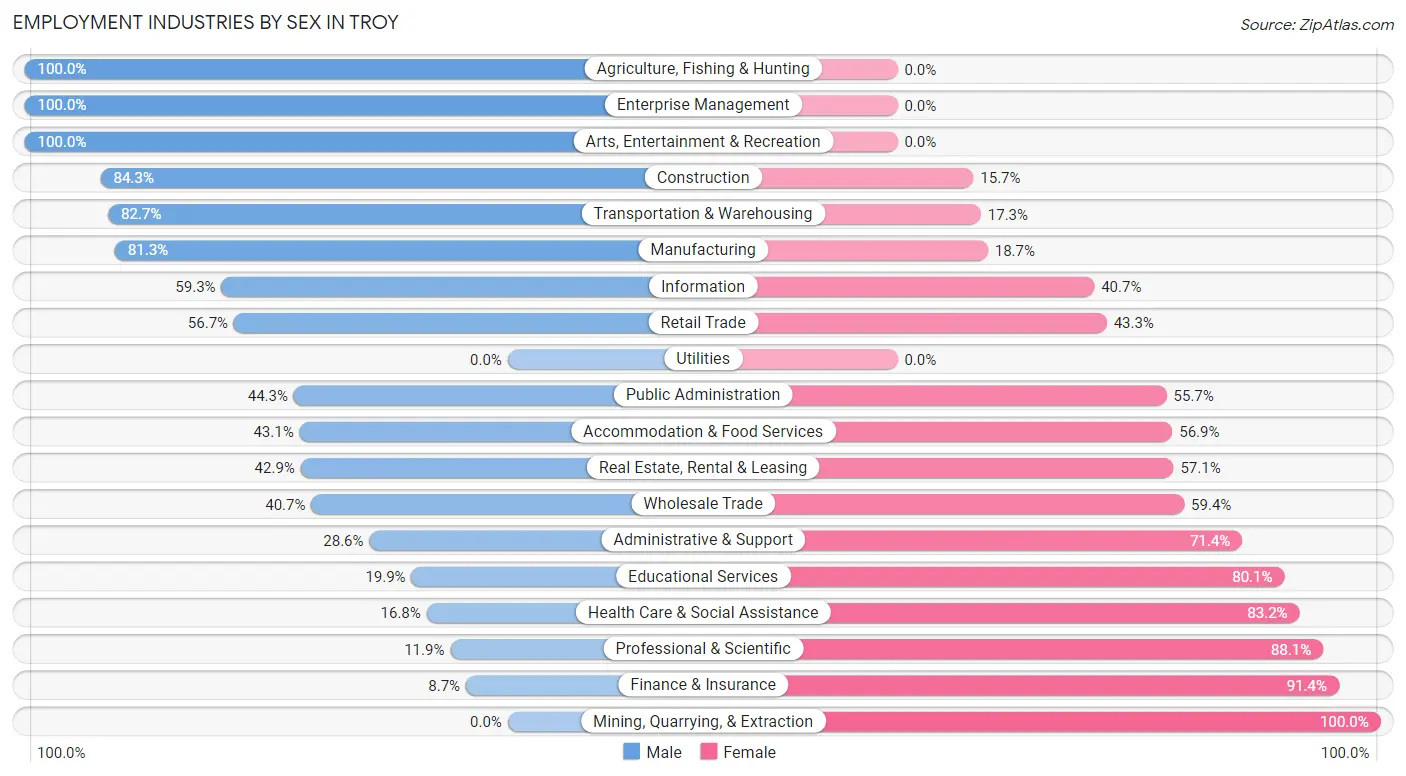
| Industry | Male | Female |
| Agriculture, Fishing & Hunting | 20 (100.0%) | 0 (0.0%) |
| Mining, Quarrying, & Extraction | 0 (0.0%) | 53 (100.0%) |
| Construction | 933 (84.3%) | 174 (15.7%) |
| Manufacturing | 774 (81.3%) | 178 (18.7%) |
| Wholesale Trade | 50 (40.6%) | 73 (59.4%) |
| Retail Trade | 348 (56.7%) | 266 (43.3%) |
| Transportation & Warehousing | 340 (82.7%) | 71 (17.3%) |
| Utilities | 0 (0.0%) | 0 (0.0%) |
| Information | 64 (59.3%) | 44 (40.7%) |
| Finance & Insurance | 30 (8.6%) | 317 (91.3%) |
| Real Estate, Rental & Leasing | 39 (42.9%) | 52 (57.1%) |
| Professional & Scientific | 35 (11.9%) | 259 (88.1%) |
| Enterprise Management | 23 (100.0%) | 0 (0.0%) |
| Administrative & Support | 124 (28.6%) | 309 (71.4%) |
| Educational Services | 54 (19.9%) | 217 (80.1%) |
| Health Care & Social Assistance | 111 (16.8%) | 550 (83.2%) |
| Arts, Entertainment & Recreation | 52 (100.0%) | 0 (0.0%) |
| Accommodation & Food Services | 181 (43.1%) | 239 (56.9%) |
| Public Administration | 89 (44.3%) | 112 (55.7%) |
| Total | 3,501 (53.9%) | 2,999 (46.1%) |
Education in Troy
School Enrollment in Troy
The most common levels of schooling among the 2,913 students in Troy are middle school (666 | 22.9%), elementary school (651 | 22.4%), and high school (601 | 20.6%).
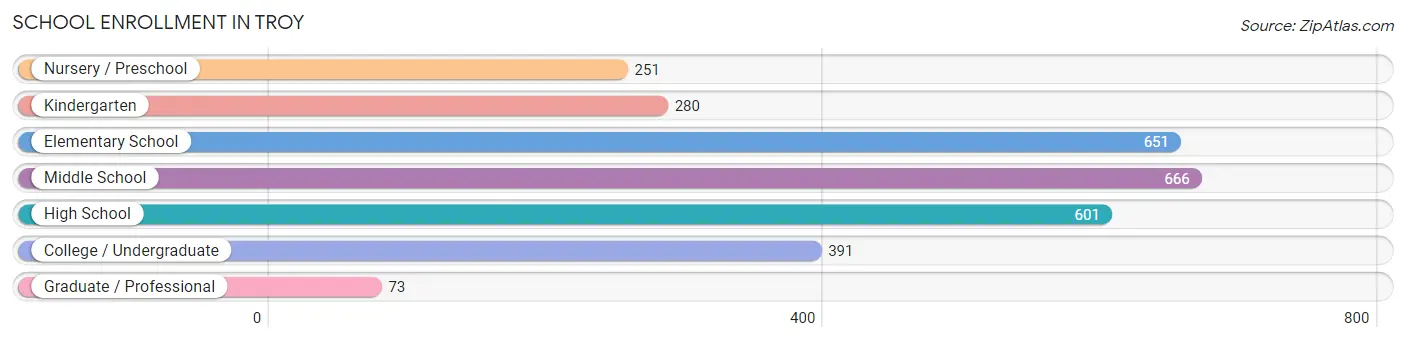
| School Level | # Students | % Students |
| Nursery / Preschool | 251 | 8.6% |
| Kindergarten | 280 | 9.6% |
| Elementary School | 651 | 22.4% |
| Middle School | 666 | 22.9% |
| High School | 601 | 20.6% |
| College / Undergraduate | 391 | 13.4% |
| Graduate / Professional | 73 | 2.5% |
| Total | 2,913 | 100.0% |
School Enrollment by Age by Funding Source in Troy
Out of a total of 2,913 students who are enrolled in schools in Troy, 370 (12.7%) attend a private institution, while the remaining 2,543 (87.3%) are enrolled in public schools. The age group of 20 to 24 year olds has the highest likelihood of being enrolled in private schools, with 141 (62.9% in the age bracket) enrolled. Conversely, the age group of 3 to 4 year olds has the lowest likelihood of being enrolled in a private school, with 113 (100.0% in the age bracket) attending a public institution.
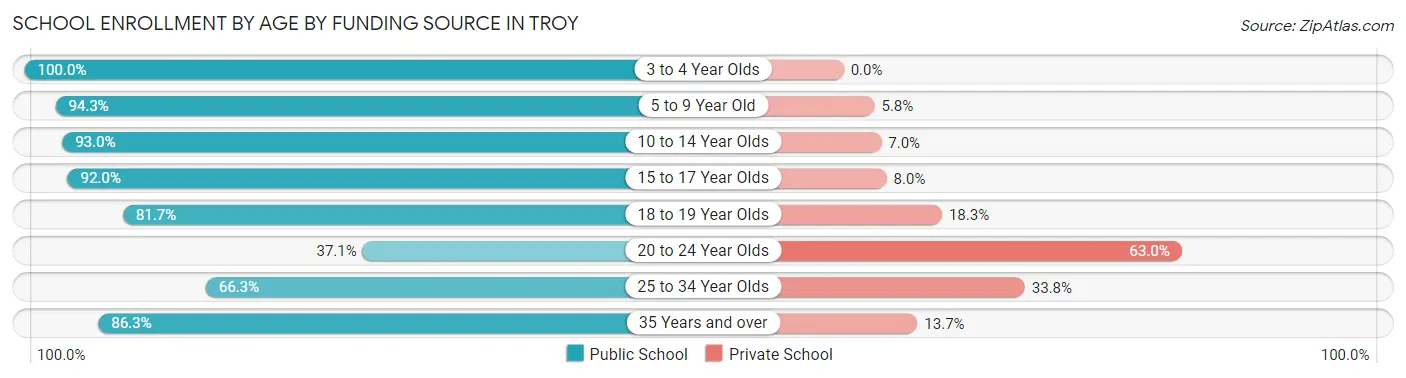
| Age Bracket | Public School | Private School |
| 3 to 4 Year Olds | 113 (100.0%) | 0 (0.0%) |
| 5 to 9 Year Old | 984 (94.3%) | 60 (5.8%) |
| 10 to 14 Year Olds | 662 (93.0%) | 50 (7.0%) |
| 15 to 17 Year Olds | 448 (92.0%) | 39 (8.0%) |
| 18 to 19 Year Olds | 58 (81.7%) | 13 (18.3%) |
| 20 to 24 Year Olds | 83 (37.0%) | 141 (62.9%) |
| 25 to 34 Year Olds | 106 (66.2%) | 54 (33.8%) |
| 35 Years and over | 88 (86.3%) | 14 (13.7%) |
| Total | 2,543 (87.3%) | 370 (12.7%) |
Educational Attainment by Field of Study in Troy
Education (267 | 22.6%), business (183 | 15.5%), arts & humanities (112 | 9.5%), science & technology (96 | 8.1%), and psychology (80 | 6.8%) are the most common fields of study among 1,184 individuals in Troy who have obtained a bachelor's degree or higher.
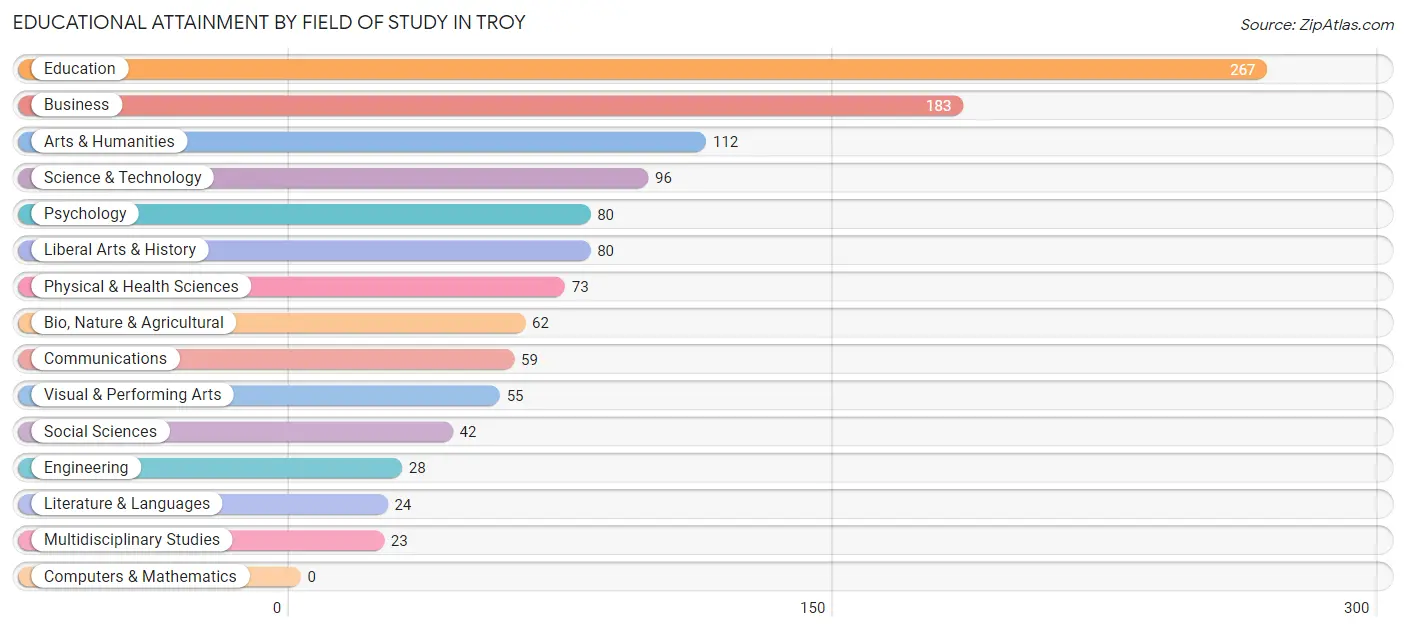
| Field of Study | # Graduates | % Graduates |
| Computers & Mathematics | 0 | 0.0% |
| Bio, Nature & Agricultural | 62 | 5.2% |
| Physical & Health Sciences | 73 | 6.2% |
| Psychology | 80 | 6.8% |
| Social Sciences | 42 | 3.5% |
| Engineering | 28 | 2.4% |
| Multidisciplinary Studies | 23 | 1.9% |
| Science & Technology | 96 | 8.1% |
| Business | 183 | 15.5% |
| Education | 267 | 22.6% |
| Literature & Languages | 24 | 2.0% |
| Liberal Arts & History | 80 | 6.8% |
| Visual & Performing Arts | 55 | 4.6% |
| Communications | 59 | 5.0% |
| Arts & Humanities | 112 | 9.5% |
| Total | 1,184 | 100.0% |
Transportation & Commute in Troy
Vehicle Availability by Sex in Troy
The most prevalent vehicle ownership categories in Troy are males with 2 vehicles (1,662, accounting for 48.4%) and females with 2 vehicles (1,491, making up 56.8%).
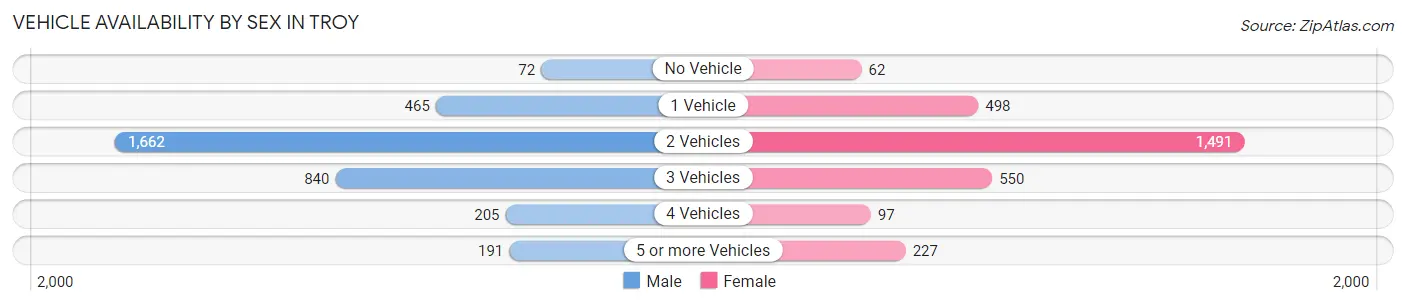
| Vehicles Available | Male | Female |
| No Vehicle | 72 (2.1%) | 62 (2.1%) |
| 1 Vehicle | 465 (13.5%) | 498 (17.0%) |
| 2 Vehicles | 1,662 (48.4%) | 1,491 (51.0%) |
| 3 Vehicles | 840 (24.4%) | 550 (18.8%) |
| 4 Vehicles | 205 (6.0%) | 97 (3.3%) |
| 5 or more Vehicles | 191 (5.6%) | 227 (7.8%) |
| Total | 3,435 (100.0%) | 2,925 (100.0%) |
Commute Time in Troy
The most frequently occuring commute durations in Troy are 20 to 24 minutes (873 commuters, 14.9%), 45 to 59 minutes (748 commuters, 12.8%), and 30 to 34 minutes (628 commuters, 10.7%).
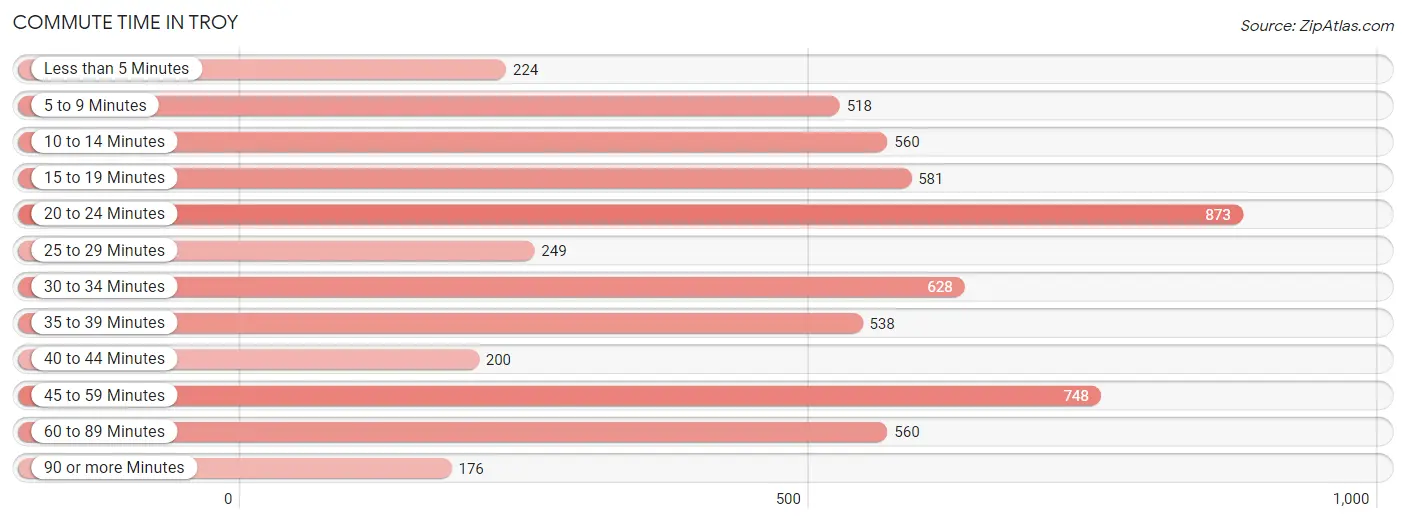
| Commute Time | # Commuters | % Commuters |
| Less than 5 Minutes | 224 | 3.8% |
| 5 to 9 Minutes | 518 | 8.8% |
| 10 to 14 Minutes | 560 | 9.6% |
| 15 to 19 Minutes | 581 | 9.9% |
| 20 to 24 Minutes | 873 | 14.9% |
| 25 to 29 Minutes | 249 | 4.3% |
| 30 to 34 Minutes | 628 | 10.7% |
| 35 to 39 Minutes | 538 | 9.2% |
| 40 to 44 Minutes | 200 | 3.4% |
| 45 to 59 Minutes | 748 | 12.8% |
| 60 to 89 Minutes | 560 | 9.6% |
| 90 or more Minutes | 176 | 3.0% |
Commute Time by Sex in Troy
The most common commute times in Troy are 20 to 24 minutes (534 commuters, 16.0%) for males and 20 to 24 minutes (339 commuters, 13.4%) for females.
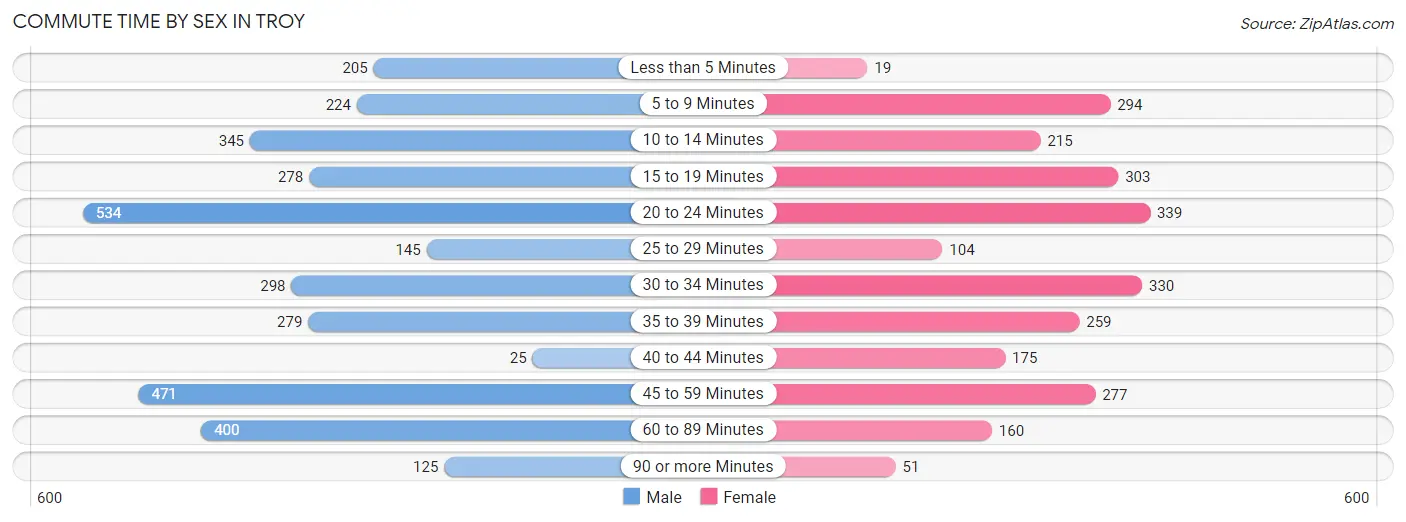
| Commute Time | Male | Female |
| Less than 5 Minutes | 205 (6.2%) | 19 (0.7%) |
| 5 to 9 Minutes | 224 (6.7%) | 294 (11.6%) |
| 10 to 14 Minutes | 345 (10.4%) | 215 (8.5%) |
| 15 to 19 Minutes | 278 (8.4%) | 303 (12.0%) |
| 20 to 24 Minutes | 534 (16.0%) | 339 (13.4%) |
| 25 to 29 Minutes | 145 (4.4%) | 104 (4.1%) |
| 30 to 34 Minutes | 298 (8.9%) | 330 (13.1%) |
| 35 to 39 Minutes | 279 (8.4%) | 259 (10.2%) |
| 40 to 44 Minutes | 25 (0.7%) | 175 (6.9%) |
| 45 to 59 Minutes | 471 (14.1%) | 277 (11.0%) |
| 60 to 89 Minutes | 400 (12.0%) | 160 (6.3%) |
| 90 or more Minutes | 125 (3.7%) | 51 (2.0%) |
Time of Departure to Work by Sex in Troy
The most frequent times of departure to work in Troy are 7:00 AM to 7:29 AM (526, 15.8%) for males and 7:00 AM to 7:29 AM (697, 27.6%) for females.
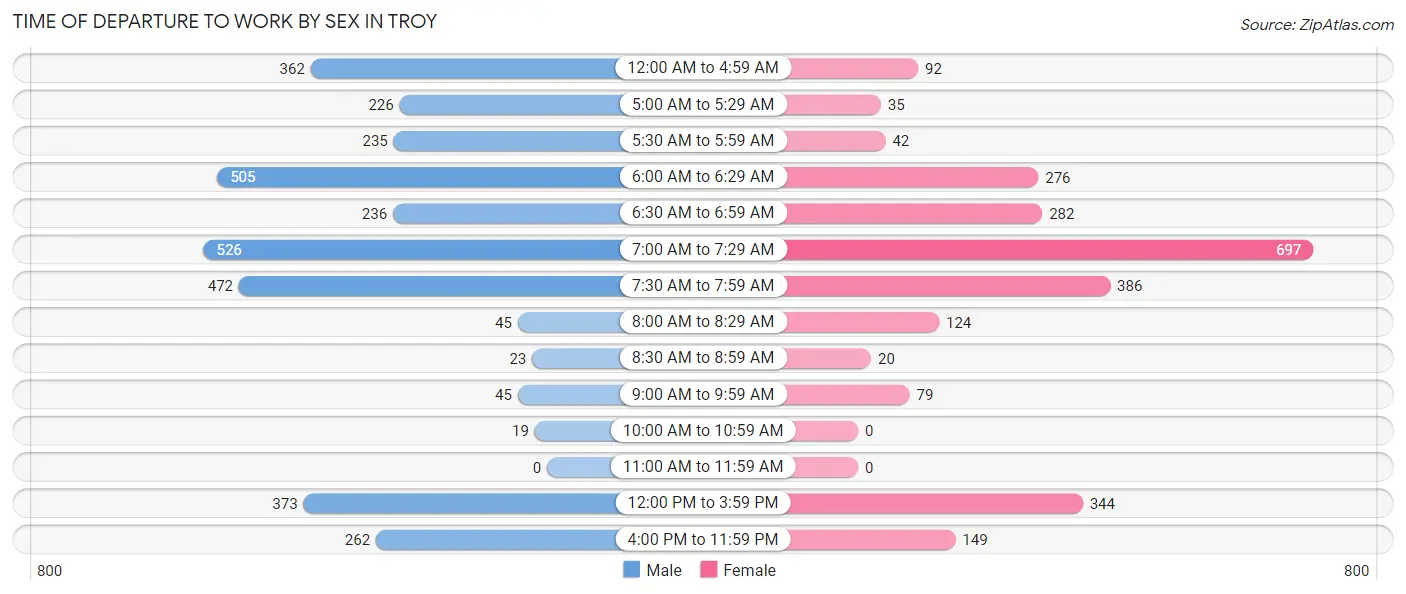
| Time of Departure | Male | Female |
| 12:00 AM to 4:59 AM | 362 (10.9%) | 92 (3.6%) |
| 5:00 AM to 5:29 AM | 226 (6.8%) | 35 (1.4%) |
| 5:30 AM to 5:59 AM | 235 (7.1%) | 42 (1.7%) |
| 6:00 AM to 6:29 AM | 505 (15.2%) | 276 (10.9%) |
| 6:30 AM to 6:59 AM | 236 (7.1%) | 282 (11.2%) |
| 7:00 AM to 7:29 AM | 526 (15.8%) | 697 (27.6%) |
| 7:30 AM to 7:59 AM | 472 (14.2%) | 386 (15.3%) |
| 8:00 AM to 8:29 AM | 45 (1.3%) | 124 (4.9%) |
| 8:30 AM to 8:59 AM | 23 (0.7%) | 20 (0.8%) |
| 9:00 AM to 9:59 AM | 45 (1.3%) | 79 (3.1%) |
| 10:00 AM to 10:59 AM | 19 (0.6%) | 0 (0.0%) |
| 11:00 AM to 11:59 AM | 0 (0.0%) | 0 (0.0%) |
| 12:00 PM to 3:59 PM | 373 (11.2%) | 344 (13.6%) |
| 4:00 PM to 11:59 PM | 262 (7.9%) | 149 (5.9%) |
| Total | 3,329 (100.0%) | 2,526 (100.0%) |
Housing Occupancy in Troy
Occupancy by Ownership in Troy
Of the total 4,873 dwellings in Troy, owner-occupied units account for 3,418 (70.1%), while renter-occupied units make up 1,455 (29.9%).
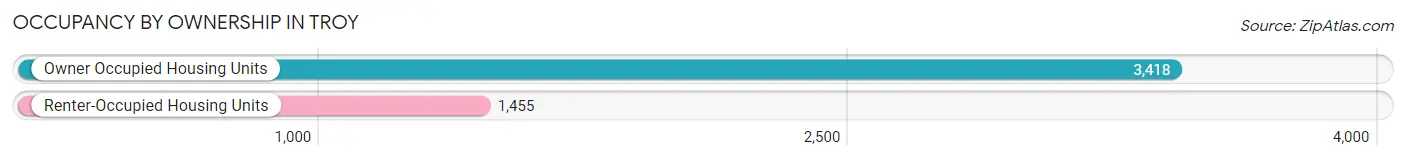
| Occupancy | # Housing Units | % Housing Units |
| Owner Occupied Housing Units | 3,418 | 70.1% |
| Renter-Occupied Housing Units | 1,455 | 29.9% |
| Total Occupied Housing Units | 4,873 | 100.0% |
Occupancy by Household Size in Troy
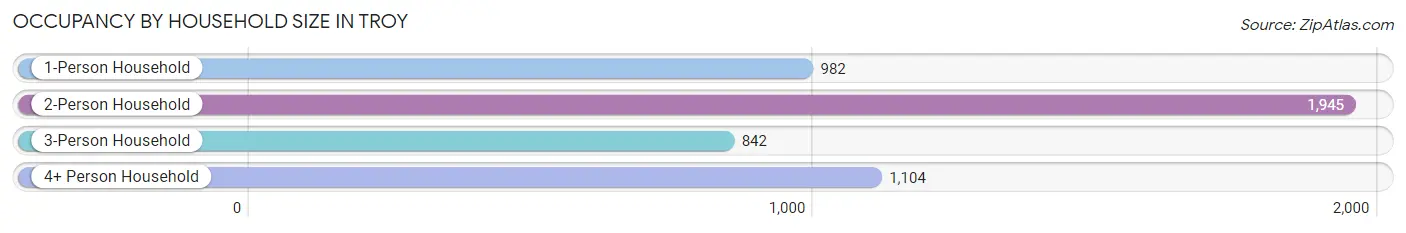
| Household Size | # Housing Units | % Housing Units |
| 1-Person Household | 982 | 20.2% |
| 2-Person Household | 1,945 | 39.9% |
| 3-Person Household | 842 | 17.3% |
| 4+ Person Household | 1,104 | 22.7% |
| Total Housing Units | 4,873 | 100.0% |
Occupancy by Ownership by Household Size in Troy
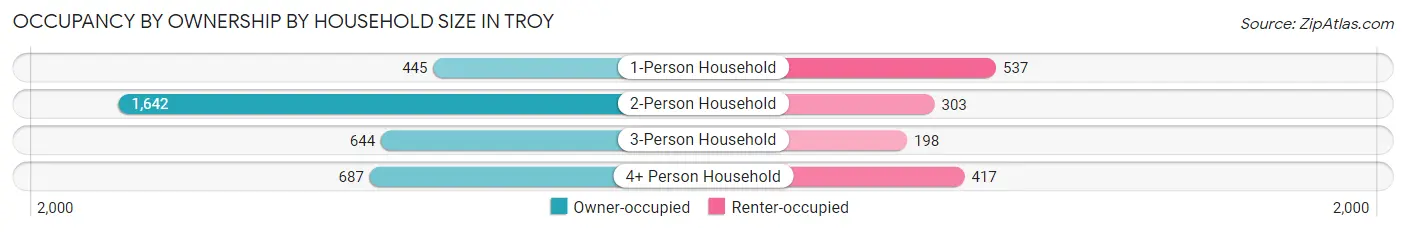
| Household Size | Owner-occupied | Renter-occupied |
| 1-Person Household | 445 (45.3%) | 537 (54.7%) |
| 2-Person Household | 1,642 (84.4%) | 303 (15.6%) |
| 3-Person Household | 644 (76.5%) | 198 (23.5%) |
| 4+ Person Household | 687 (62.2%) | 417 (37.8%) |
| Total Housing Units | 3,418 (70.1%) | 1,455 (29.9%) |
Occupancy by Educational Attainment in Troy
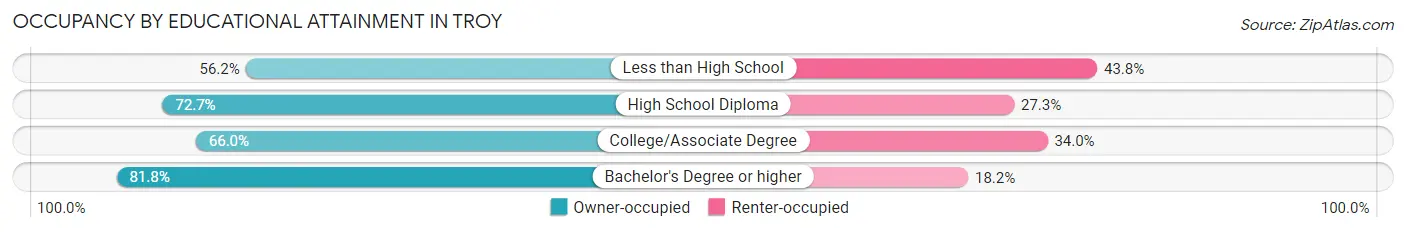
| Household Size | Owner-occupied | Renter-occupied |
| Less than High School | 154 (56.2%) | 120 (43.8%) |
| High School Diploma | 1,340 (72.7%) | 504 (27.3%) |
| College/Associate Degree | 1,381 (66.0%) | 710 (34.0%) |
| Bachelor's Degree or higher | 543 (81.8%) | 121 (18.2%) |
Occupancy by Age of Householder in Troy
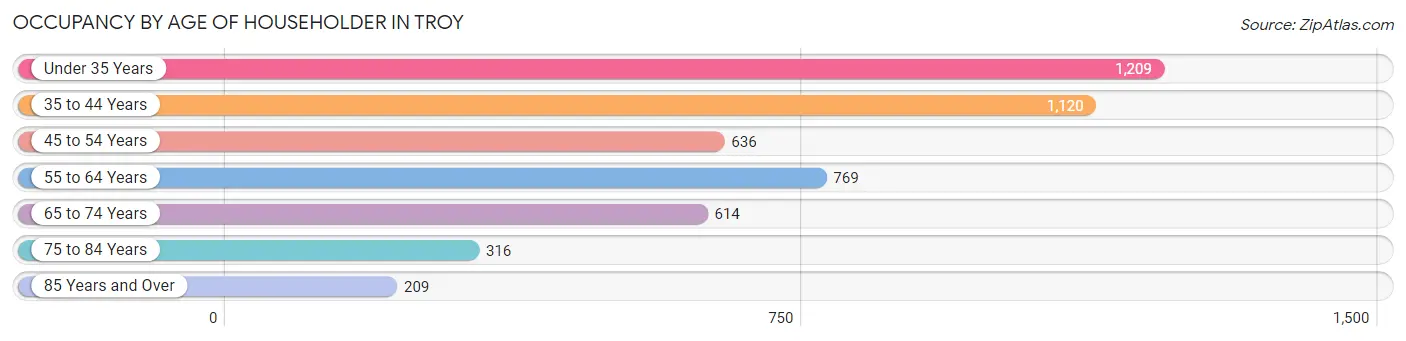
| Age Bracket | # Households | % Households |
| Under 35 Years | 1,209 | 24.8% |
| 35 to 44 Years | 1,120 | 23.0% |
| 45 to 54 Years | 636 | 13.1% |
| 55 to 64 Years | 769 | 15.8% |
| 65 to 74 Years | 614 | 12.6% |
| 75 to 84 Years | 316 | 6.5% |
| 85 Years and Over | 209 | 4.3% |
| Total | 4,873 | 100.0% |
Housing Finances in Troy
Median Income by Occupancy in Troy
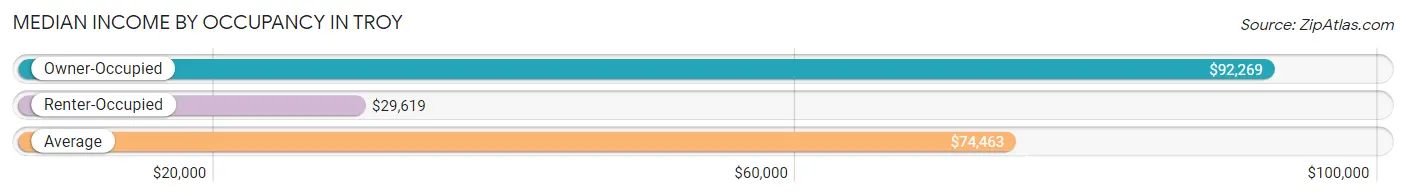
| Occupancy Type | # Households | Median Income |
| Owner-Occupied | 3,418 (70.1%) | $92,269 |
| Renter-Occupied | 1,455 (29.9%) | $29,619 |
| Average | 4,873 (100.0%) | $74,463 |
Occupancy by Householder Income Bracket in Troy
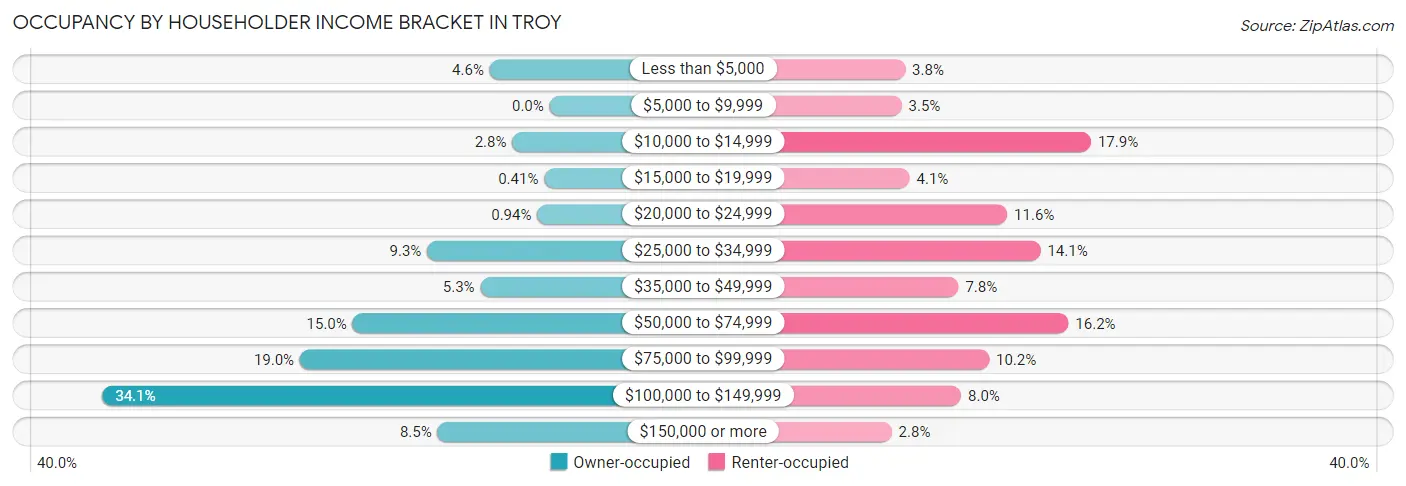
| Income Bracket | Owner-occupied | Renter-occupied |
| Less than $5,000 | 156 (4.6%) | 55 (3.8%) |
| $5,000 to $9,999 | 0 (0.0%) | 51 (3.5%) |
| $10,000 to $14,999 | 97 (2.8%) | 261 (17.9%) |
| $15,000 to $19,999 | 14 (0.4%) | 60 (4.1%) |
| $20,000 to $24,999 | 32 (0.9%) | 168 (11.6%) |
| $25,000 to $34,999 | 319 (9.3%) | 205 (14.1%) |
| $35,000 to $49,999 | 180 (5.3%) | 114 (7.8%) |
| $50,000 to $74,999 | 513 (15.0%) | 236 (16.2%) |
| $75,000 to $99,999 | 650 (19.0%) | 148 (10.2%) |
| $100,000 to $149,999 | 1,165 (34.1%) | 117 (8.0%) |
| $150,000 or more | 292 (8.5%) | 40 (2.8%) |
| Total | 3,418 (100.0%) | 1,455 (100.0%) |
Monthly Housing Cost Tiers in Troy
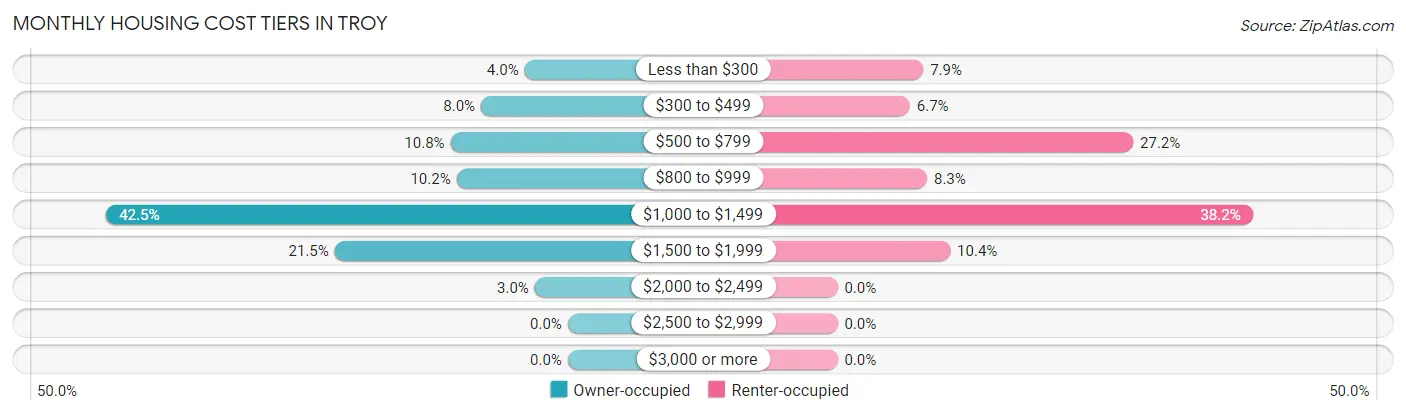
| Monthly Cost | Owner-occupied | Renter-occupied |
| Less than $300 | 136 (4.0%) | 115 (7.9%) |
| $300 to $499 | 273 (8.0%) | 97 (6.7%) |
| $500 to $799 | 369 (10.8%) | 396 (27.2%) |
| $800 to $999 | 350 (10.2%) | 120 (8.3%) |
| $1,000 to $1,499 | 1,452 (42.5%) | 556 (38.2%) |
| $1,500 to $1,999 | 734 (21.5%) | 151 (10.4%) |
| $2,000 to $2,499 | 104 (3.0%) | 0 (0.0%) |
| $2,500 to $2,999 | 0 (0.0%) | 0 (0.0%) |
| $3,000 or more | 0 (0.0%) | 0 (0.0%) |
| Total | 3,418 (100.0%) | 1,455 (100.0%) |
Physical Housing Characteristics in Troy
Housing Structures in Troy
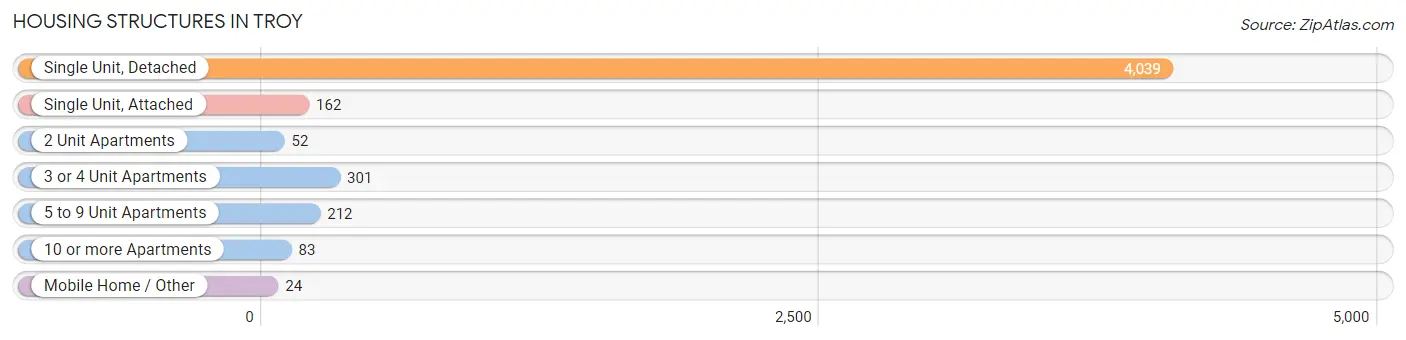
| Structure Type | # Housing Units | % Housing Units |
| Single Unit, Detached | 4,039 | 82.9% |
| Single Unit, Attached | 162 | 3.3% |
| 2 Unit Apartments | 52 | 1.1% |
| 3 or 4 Unit Apartments | 301 | 6.2% |
| 5 to 9 Unit Apartments | 212 | 4.3% |
| 10 or more Apartments | 83 | 1.7% |
| Mobile Home / Other | 24 | 0.5% |
| Total | 4,873 | 100.0% |
Housing Structures by Occupancy in Troy
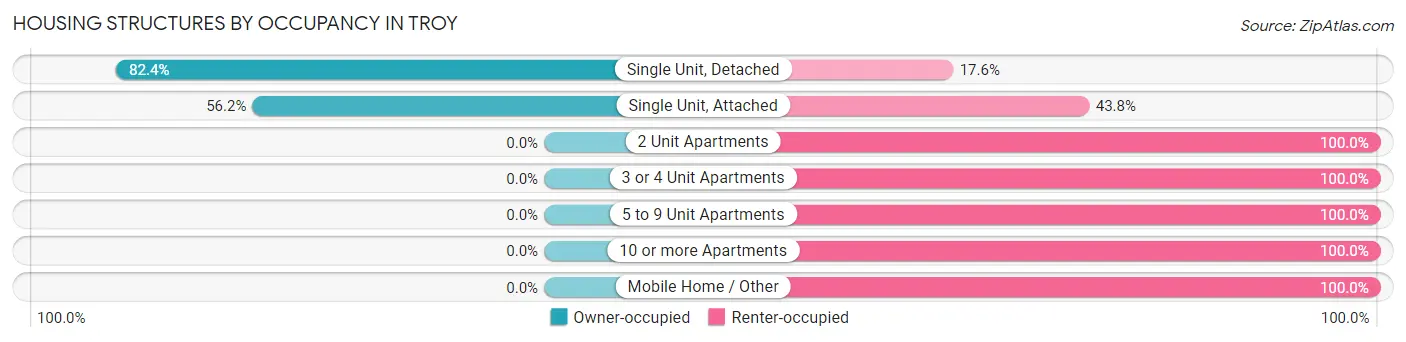
| Structure Type | Owner-occupied | Renter-occupied |
| Single Unit, Detached | 3,327 (82.4%) | 712 (17.6%) |
| Single Unit, Attached | 91 (56.2%) | 71 (43.8%) |
| 2 Unit Apartments | 0 (0.0%) | 52 (100.0%) |
| 3 or 4 Unit Apartments | 0 (0.0%) | 301 (100.0%) |
| 5 to 9 Unit Apartments | 0 (0.0%) | 212 (100.0%) |
| 10 or more Apartments | 0 (0.0%) | 83 (100.0%) |
| Mobile Home / Other | 0 (0.0%) | 24 (100.0%) |
| Total | 3,418 (70.1%) | 1,455 (29.9%) |
Housing Structures by Number of Rooms in Troy
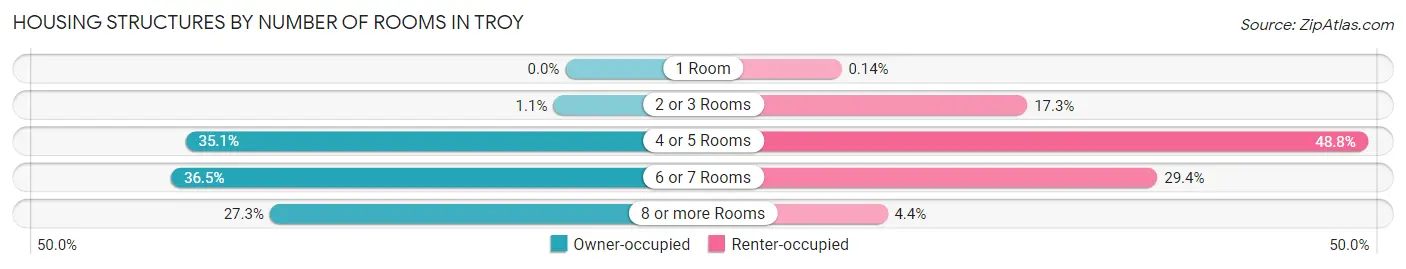
| Number of Rooms | Owner-occupied | Renter-occupied |
| 1 Room | 0 (0.0%) | 2 (0.1%) |
| 2 or 3 Rooms | 38 (1.1%) | 252 (17.3%) |
| 4 or 5 Rooms | 1,200 (35.1%) | 710 (48.8%) |
| 6 or 7 Rooms | 1,246 (36.4%) | 427 (29.3%) |
| 8 or more Rooms | 934 (27.3%) | 64 (4.4%) |
| Total | 3,418 (100.0%) | 1,455 (100.0%) |
Housing Structure by Heating Type in Troy
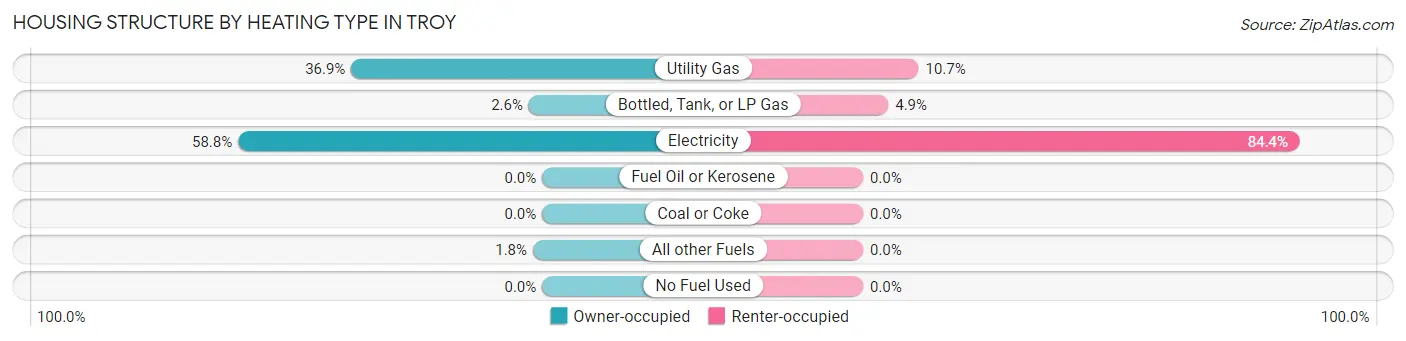
| Heating Type | Owner-occupied | Renter-occupied |
| Utility Gas | 1,261 (36.9%) | 156 (10.7%) |
| Bottled, Tank, or LP Gas | 88 (2.6%) | 71 (4.9%) |
| Electricity | 2,008 (58.8%) | 1,228 (84.4%) |
| Fuel Oil or Kerosene | 0 (0.0%) | 0 (0.0%) |
| Coal or Coke | 0 (0.0%) | 0 (0.0%) |
| All other Fuels | 61 (1.8%) | 0 (0.0%) |
| No Fuel Used | 0 (0.0%) | 0 (0.0%) |
| Total | 3,418 (100.0%) | 1,455 (100.0%) |
Household Vehicle Usage in Troy
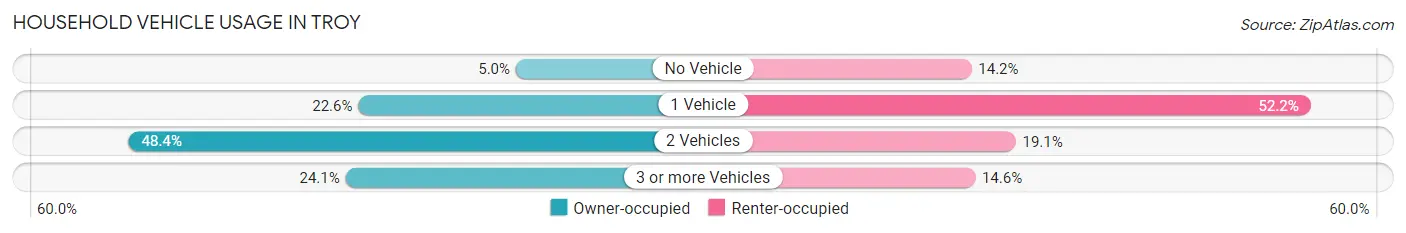
| Vehicles per Household | Owner-occupied | Renter-occupied |
| No Vehicle | 170 (5.0%) | 206 (14.2%) |
| 1 Vehicle | 773 (22.6%) | 759 (52.2%) |
| 2 Vehicles | 1,653 (48.4%) | 278 (19.1%) |
| 3 or more Vehicles | 822 (24.0%) | 212 (14.6%) |
| Total | 3,418 (100.0%) | 1,455 (100.0%) |
Real Estate & Mortgages in Troy
Real Estate and Mortgage Overview in Troy
| Characteristic | Without Mortgage | With Mortgage |
| Housing Units | 645 | 2,773 |
| Median Property Value | $186,300 | $196,600 |
| Median Household Income | $36,853 | $292 |
| Monthly Housing Costs | $518 | $0 |
| Real Estate Taxes | $1,592 | $36 |
Property Value by Mortgage Status in Troy
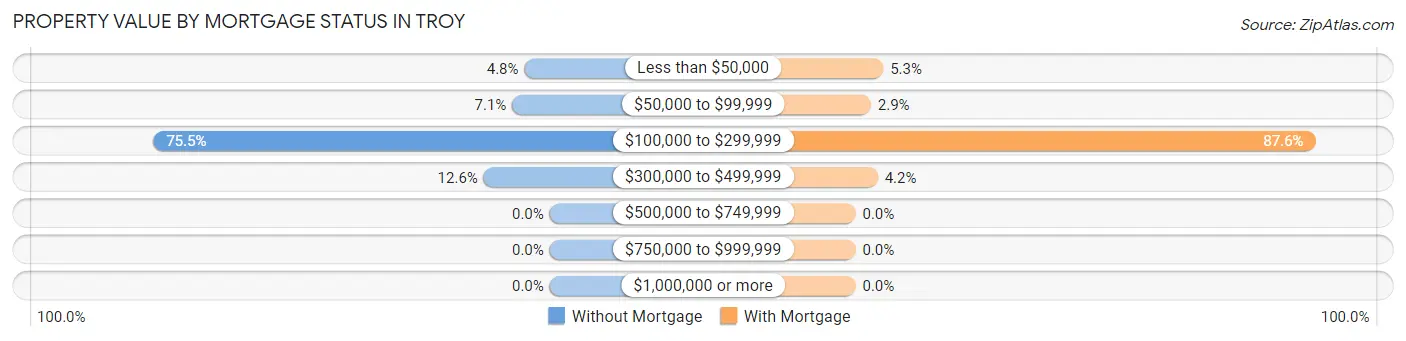
| Property Value | Without Mortgage | With Mortgage |
| Less than $50,000 | 31 (4.8%) | 146 (5.3%) |
| $50,000 to $99,999 | 46 (7.1%) | 81 (2.9%) |
| $100,000 to $299,999 | 487 (75.5%) | 2,429 (87.6%) |
| $300,000 to $499,999 | 81 (12.6%) | 117 (4.2%) |
| $500,000 to $749,999 | 0 (0.0%) | 0 (0.0%) |
| $750,000 to $999,999 | 0 (0.0%) | 0 (0.0%) |
| $1,000,000 or more | 0 (0.0%) | 0 (0.0%) |
| Total | 645 (100.0%) | 2,773 (100.0%) |
Household Income by Mortgage Status in Troy
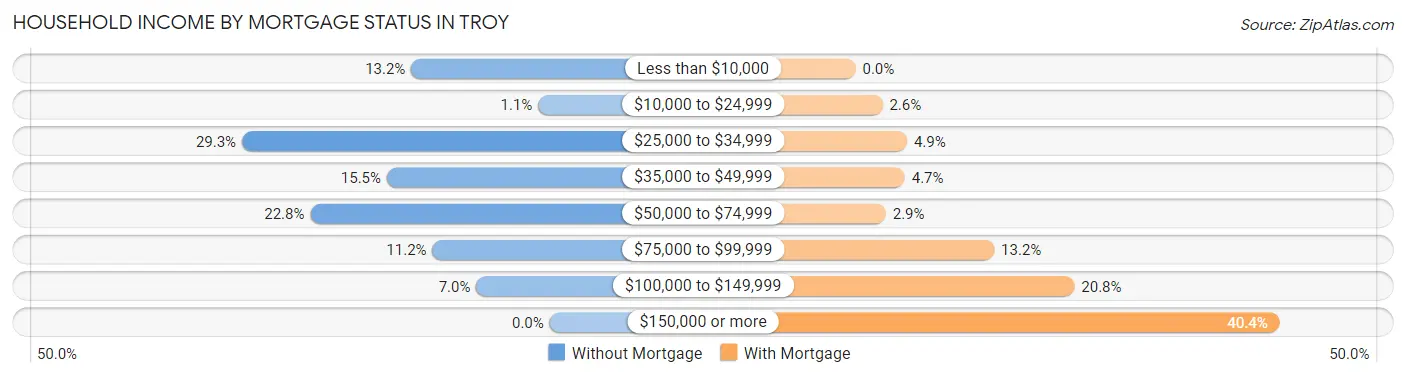
| Household Income | Without Mortgage | With Mortgage |
| Less than $10,000 | 85 (13.2%) | 0 (0.0%) |
| $10,000 to $24,999 | 7 (1.1%) | 71 (2.6%) |
| $25,000 to $34,999 | 189 (29.3%) | 136 (4.9%) |
| $35,000 to $49,999 | 100 (15.5%) | 130 (4.7%) |
| $50,000 to $74,999 | 147 (22.8%) | 80 (2.9%) |
| $75,000 to $99,999 | 72 (11.2%) | 366 (13.2%) |
| $100,000 to $149,999 | 45 (7.0%) | 578 (20.8%) |
| $150,000 or more | 0 (0.0%) | 1,120 (40.4%) |
| Total | 645 (100.0%) | 2,773 (100.0%) |
Property Value to Household Income Ratio in Troy
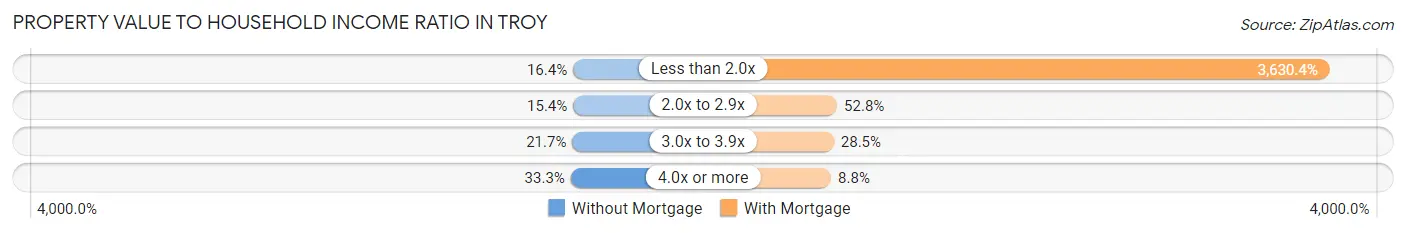
| Value-to-Income Ratio | Without Mortgage | With Mortgage |
| Less than 2.0x | 106 (16.4%) | 100,671 (3,630.4%) |
| 2.0x to 2.9x | 99 (15.3%) | 1,463 (52.8%) |
| 3.0x to 3.9x | 140 (21.7%) | 790 (28.5%) |
| 4.0x or more | 215 (33.3%) | 244 (8.8%) |
| Total | 645 (100.0%) | 2,773 (100.0%) |
Real Estate Taxes by Mortgage Status in Troy
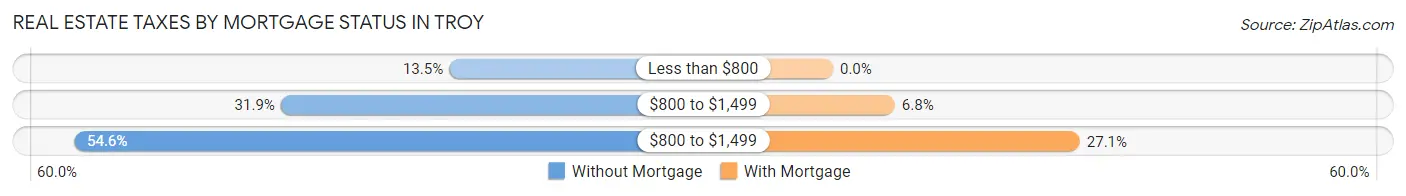
| Property Taxes | Without Mortgage | With Mortgage |
| Less than $800 | 87 (13.5%) | 0 (0.0%) |
| $800 to $1,499 | 206 (31.9%) | 188 (6.8%) |
| $800 to $1,499 | 352 (54.6%) | 750 (27.1%) |
| Total | 645 (100.0%) | 2,773 (100.0%) |
Health & Disability in Troy
Health Insurance Coverage by Age in Troy
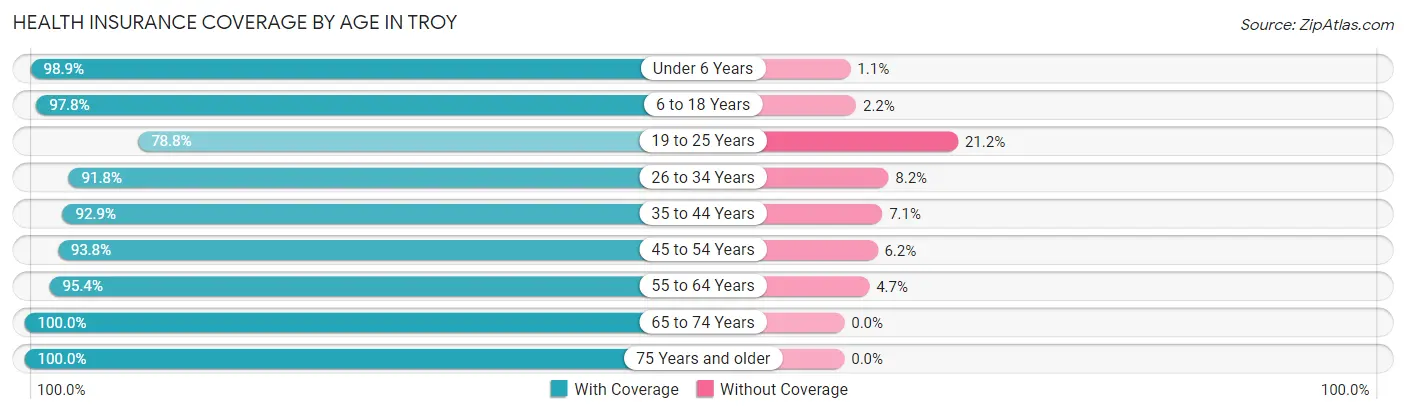
| Age Bracket | With Coverage | Without Coverage |
| Under 6 Years | 1,128 (98.9%) | 13 (1.1%) |
| 6 to 18 Years | 2,139 (97.8%) | 48 (2.2%) |
| 19 to 25 Years | 896 (78.8%) | 241 (21.2%) |
| 26 to 34 Years | 1,633 (91.8%) | 146 (8.2%) |
| 35 to 44 Years | 1,773 (92.9%) | 135 (7.1%) |
| 45 to 54 Years | 1,000 (93.8%) | 66 (6.2%) |
| 55 to 64 Years | 1,621 (95.4%) | 79 (4.6%) |
| 65 to 74 Years | 957 (100.0%) | 0 (0.0%) |
| 75 Years and older | 719 (100.0%) | 0 (0.0%) |
| Total | 11,866 (94.2%) | 728 (5.8%) |
Health Insurance Coverage by Citizenship Status in Troy
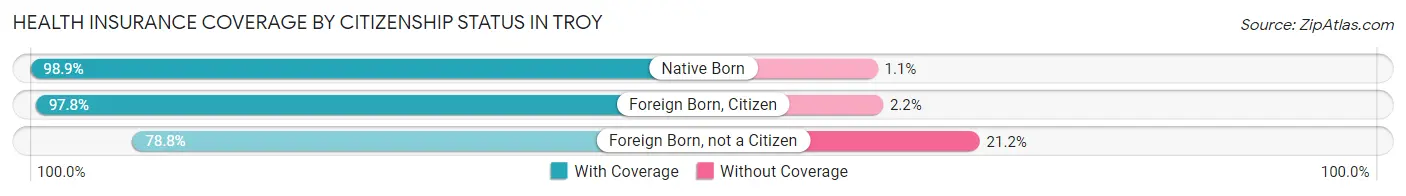
| Citizenship Status | With Coverage | Without Coverage |
| Native Born | 1,128 (98.9%) | 13 (1.1%) |
| Foreign Born, Citizen | 2,139 (97.8%) | 48 (2.2%) |
| Foreign Born, not a Citizen | 896 (78.8%) | 241 (21.2%) |
Health Insurance Coverage by Household Income in Troy
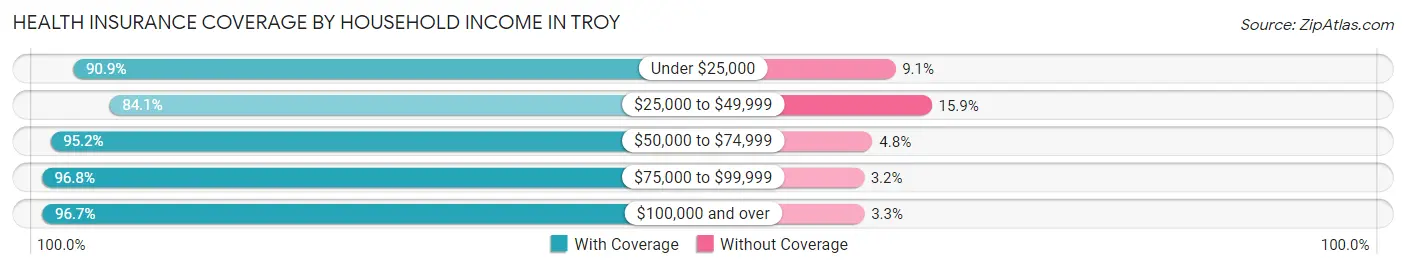
| Household Income | With Coverage | Without Coverage |
| Under $25,000 | 1,334 (90.9%) | 133 (9.1%) |
| $25,000 to $49,999 | 1,383 (84.1%) | 261 (15.9%) |
| $50,000 to $74,999 | 1,707 (95.2%) | 86 (4.8%) |
| $75,000 to $99,999 | 2,166 (96.8%) | 71 (3.2%) |
| $100,000 and over | 5,234 (96.7%) | 177 (3.3%) |
Public vs Private Health Insurance Coverage by Age in Troy
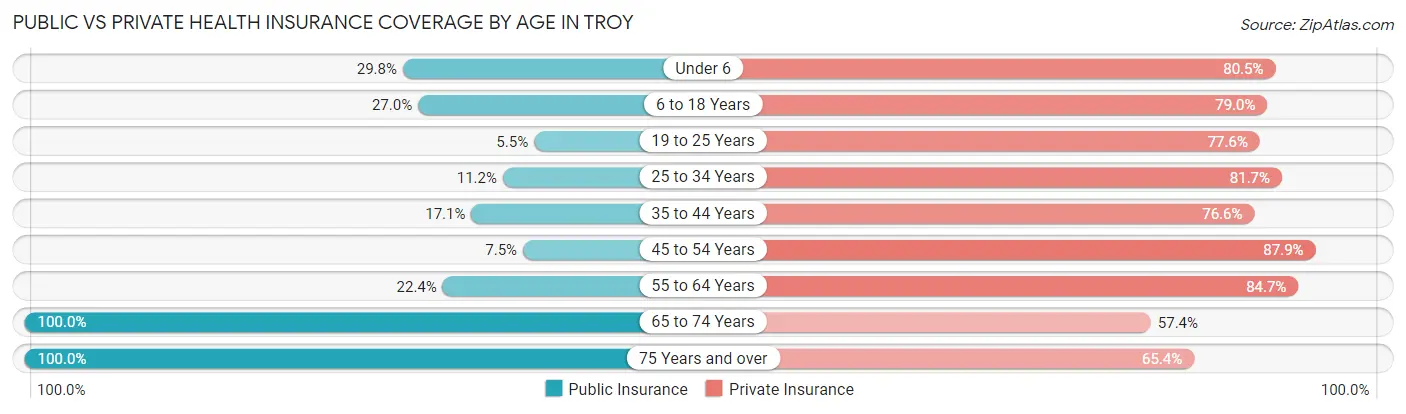
| Age Bracket | Public Insurance | Private Insurance |
| Under 6 | 340 (29.8%) | 918 (80.5%) |
| 6 to 18 Years | 590 (27.0%) | 1,727 (79.0%) |
| 19 to 25 Years | 62 (5.4%) | 882 (77.6%) |
| 25 to 34 Years | 200 (11.2%) | 1,453 (81.7%) |
| 35 to 44 Years | 326 (17.1%) | 1,461 (76.6%) |
| 45 to 54 Years | 80 (7.5%) | 937 (87.9%) |
| 55 to 64 Years | 381 (22.4%) | 1,440 (84.7%) |
| 65 to 74 Years | 957 (100.0%) | 549 (57.4%) |
| 75 Years and over | 719 (100.0%) | 470 (65.4%) |
| Total | 3,655 (29.0%) | 9,837 (78.1%) |
Disability Status by Sex by Age in Troy
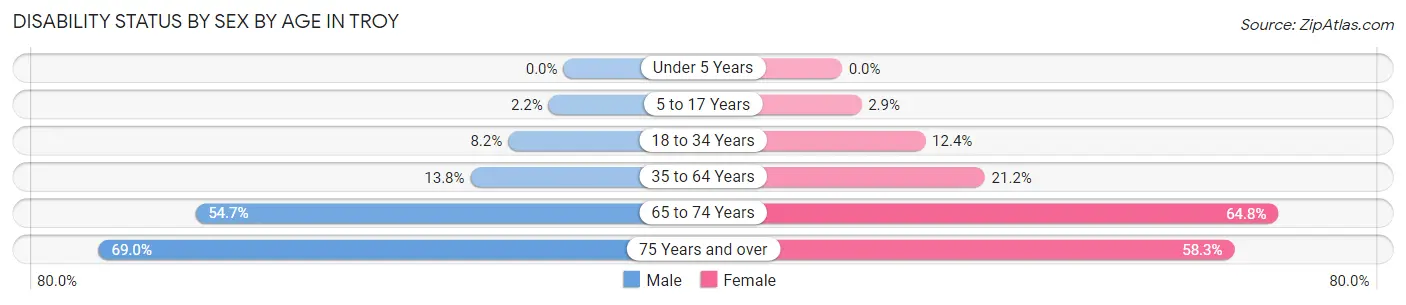
| Age Bracket | Male | Female |
| Under 5 Years | 0 (0.0%) | 0 (0.0%) |
| 5 to 17 Years | 28 (2.2%) | 32 (2.9%) |
| 18 to 34 Years | 113 (8.2%) | 199 (12.4%) |
| 35 to 64 Years | 318 (13.8%) | 503 (21.2%) |
| 65 to 74 Years | 211 (54.7%) | 370 (64.8%) |
| 75 Years and over | 167 (69.0%) | 278 (58.3%) |
Disability Class by Sex by Age in Troy
Disability Class: Hearing Difficulty
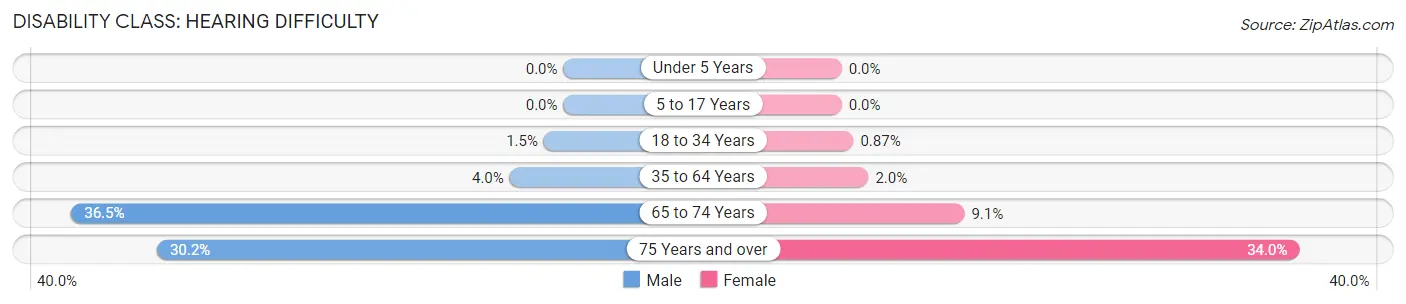
| Age Bracket | Male | Female |
| Under 5 Years | 0 (0.0%) | 0 (0.0%) |
| 5 to 17 Years | 0 (0.0%) | 0 (0.0%) |
| 18 to 34 Years | 20 (1.5%) | 14 (0.9%) |
| 35 to 64 Years | 92 (4.0%) | 47 (2.0%) |
| 65 to 74 Years | 141 (36.5%) | 52 (9.1%) |
| 75 Years and over | 73 (30.2%) | 162 (34.0%) |
Disability Class: Vision Difficulty
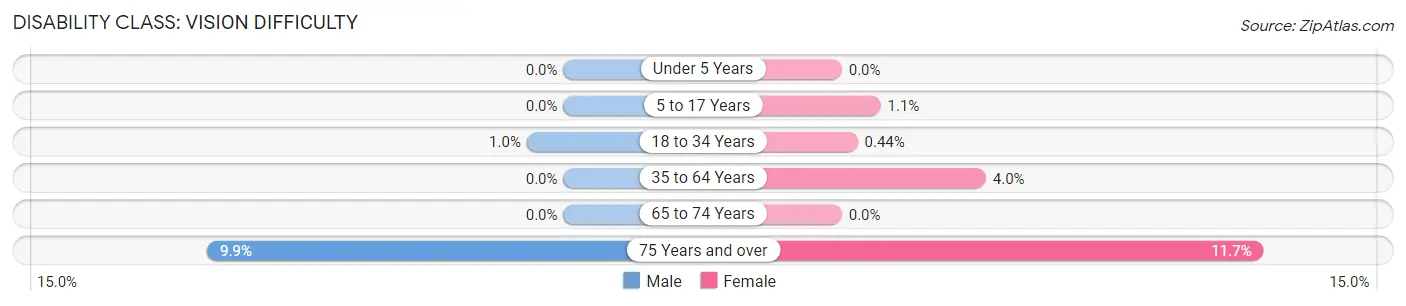
| Age Bracket | Male | Female |
| Under 5 Years | 0 (0.0%) | 0 (0.0%) |
| 5 to 17 Years | 0 (0.0%) | 12 (1.1%) |
| 18 to 34 Years | 14 (1.0%) | 7 (0.4%) |
| 35 to 64 Years | 0 (0.0%) | 95 (4.0%) |
| 65 to 74 Years | 0 (0.0%) | 0 (0.0%) |
| 75 Years and over | 24 (9.9%) | 56 (11.7%) |
Disability Class: Cognitive Difficulty
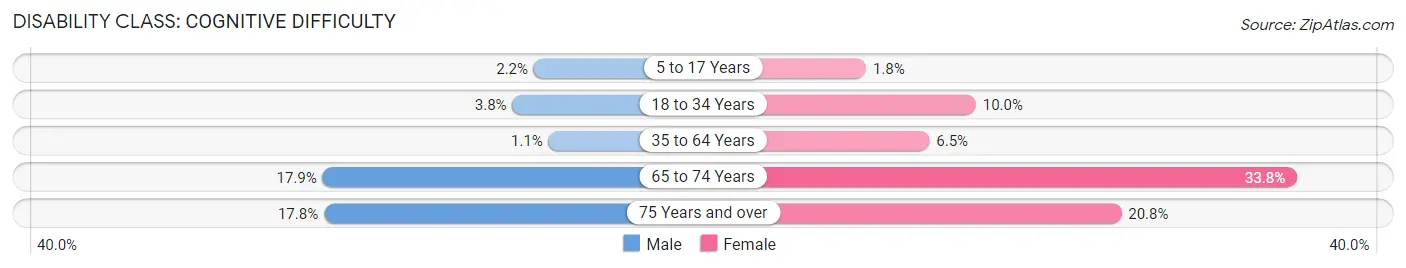
| Age Bracket | Male | Female |
| 5 to 17 Years | 28 (2.2%) | 20 (1.8%) |
| 18 to 34 Years | 52 (3.8%) | 160 (10.0%) |
| 35 to 64 Years | 25 (1.1%) | 154 (6.5%) |
| 65 to 74 Years | 69 (17.9%) | 193 (33.8%) |
| 75 Years and over | 43 (17.8%) | 99 (20.7%) |
Disability Class: Ambulatory Difficulty
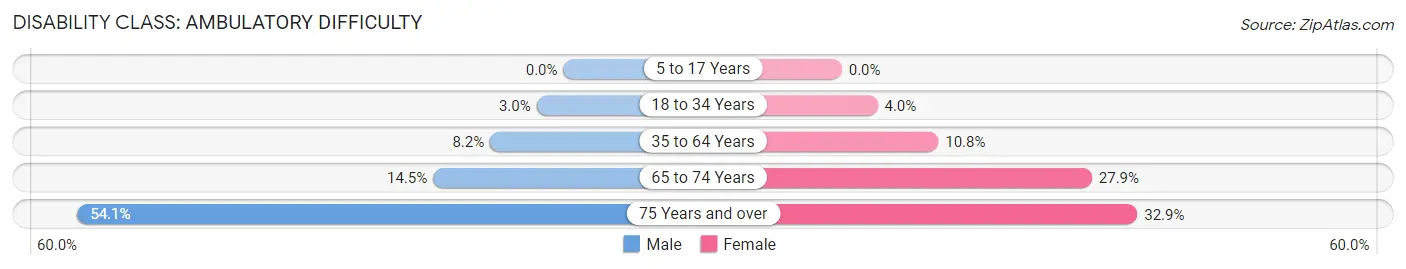
| Age Bracket | Male | Female |
| 5 to 17 Years | 0 (0.0%) | 0 (0.0%) |
| 18 to 34 Years | 41 (3.0%) | 64 (4.0%) |
| 35 to 64 Years | 188 (8.2%) | 255 (10.7%) |
| 65 to 74 Years | 56 (14.5%) | 159 (27.9%) |
| 75 Years and over | 131 (54.1%) | 157 (32.9%) |
Disability Class: Self-Care Difficulty
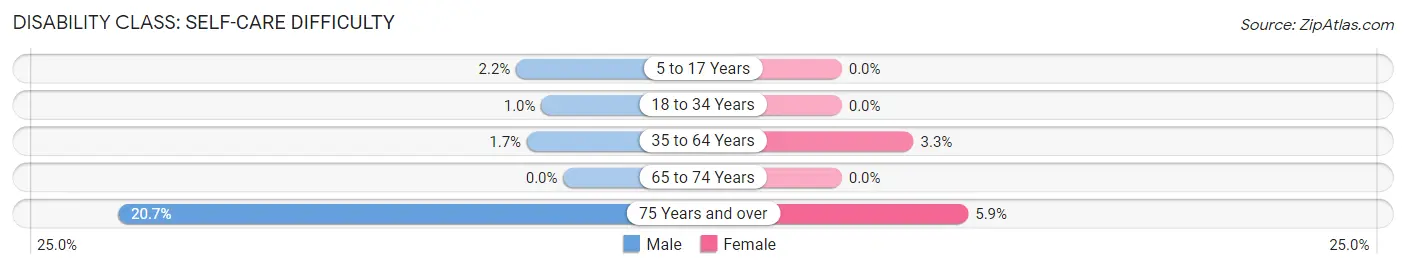
| Age Bracket | Male | Female |
| 5 to 17 Years | 28 (2.2%) | 0 (0.0%) |
| 18 to 34 Years | 14 (1.0%) | 0 (0.0%) |
| 35 to 64 Years | 39 (1.7%) | 79 (3.3%) |
| 65 to 74 Years | 0 (0.0%) | 0 (0.0%) |
| 75 Years and over | 50 (20.7%) | 28 (5.9%) |
Technology Access in Troy
Computing Device Access in Troy
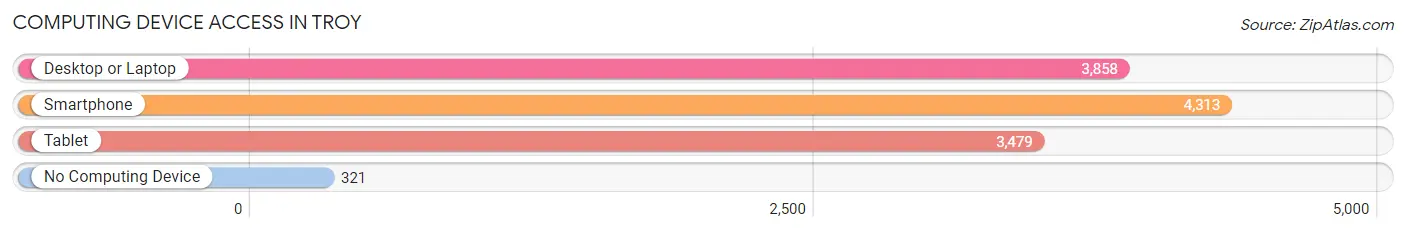
| Device Type | # Households | % Households |
| Desktop or Laptop | 3,858 | 79.2% |
| Smartphone | 4,313 | 88.5% |
| Tablet | 3,479 | 71.4% |
| No Computing Device | 321 | 6.6% |
| Total | 4,873 | 100.0% |
Internet Access in Troy
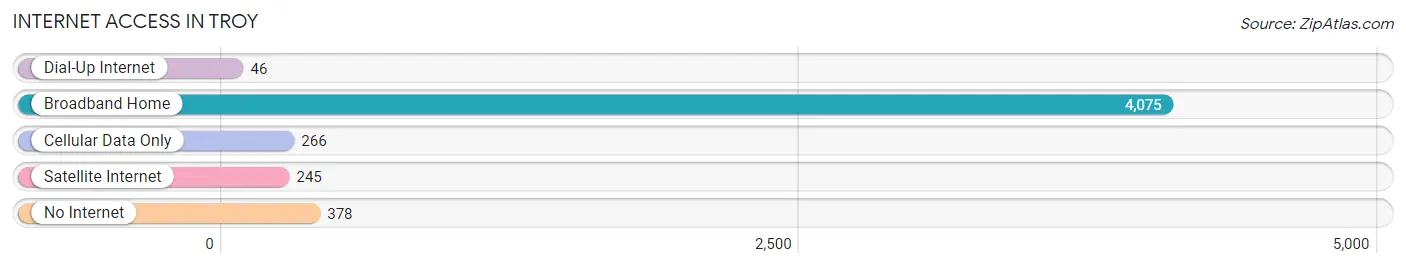
| Internet Type | # Households | % Households |
| Dial-Up Internet | 46 | 0.9% |
| Broadband Home | 4,075 | 83.6% |
| Cellular Data Only | 266 | 5.5% |
| Satellite Internet | 245 | 5.0% |
| No Internet | 378 | 7.8% |
| Total | 4,873 | 100.0% |
Troy Summary
Troy, Missouri is a small city located in Lincoln County, Missouri, United States. It is situated on the banks of the Cuivre River, approximately 40 miles northwest of St. Louis. The city has a population of 11,000 people and is the county seat of Lincoln County.
History
Troy was founded in 1819 by a group of settlers from Kentucky and Tennessee. The city was named after the ancient city of Troy in Greece. The settlers were attracted to the area due to its fertile soil and abundant natural resources. The city was incorporated in 1837 and quickly became a thriving agricultural center.
Troy was a major stop on the Hannibal and St. Joseph Railroad, which connected St. Louis to Kansas City. The railroad brought increased economic activity to the city and helped to spur its growth. The city was also home to several manufacturing plants, including a brick factory, a flour mill, and a furniture factory.
Geography
Troy is located in the eastern part of Lincoln County, Missouri. It is situated on the banks of the Cuivre River, approximately 40 miles northwest of St. Louis. The city has a total area of 4.3 square miles, all of which is land. The city is located in the Ozark Plateau region of Missouri and is surrounded by rolling hills and forests.
Economy
Troy’s economy is largely based on agriculture and manufacturing. The city is home to several large farms, which produce a variety of crops, including corn, soybeans, and wheat. The city is also home to several manufacturing plants, including a brick factory, a flour mill, and a furniture factory.
The city is also home to several retail stores, restaurants, and other businesses. The city is served by several major highways, including Interstate 70, which connects Troy to St. Louis and Kansas City.
Demographics
As of the 2010 census, Troy had a population of 11,000 people. The racial makeup of the city was 95.3% White, 1.2% African American, 0.4% Native American, 0.7% Asian, 0.1% Pacific Islander, 0.7% from other races, and 1.6% from two or more races. Hispanic or Latino of any race were 2.2% of the population.
The median income for a household in Troy was $41,944, and the median income for a family was $50,944. The per capita income for the city was $20,944. About 8.3% of families and 10.2% of the population were below the poverty line, including 14.2% of those under age 18 and 8.2% of those age 65 or over.
Troy is a small city with a rich history and a diverse economy. The city is home to several large farms and manufacturing plants, as well as a variety of retail stores, restaurants, and other businesses. The city is served by several major highways, which connect it to St. Louis and Kansas City. The city has a population of 11,000 people and is the county seat of Lincoln County.
Common Questions
What is Per Capita Income in Troy?
Per Capita income in Troy is $29,422.
What is the Median Family Income in Troy?
Median Family Income in Troy is $83,052.
What is the Median Household income in Troy?
Median Household Income in Troy is $74,463.
What is Income or Wage Gap in Troy?
Income or Wage Gap in Troy is 33.4%.
Women in Troy earn 66.6 cents for every dollar earned by a man.
What is Inequality or Gini Index in Troy?
Inequality or Gini Index in Troy is 0.37.
What is the Total Population of Troy?
Total Population of Troy is 12,964.
What is the Total Male Population of Troy?
Total Male Population of Troy is 6,145.
What is the Total Female Population of Troy?
Total Female Population of Troy is 6,819.
What is the Ratio of Males per 100 Females in Troy?
There are 90.12 Males per 100 Females in Troy.
What is the Ratio of Females per 100 Males in Troy?
There are 110.97 Females per 100 Males in Troy.
What is the Median Population Age in Troy?
Median Population Age in Troy is 35.5 Years.
What is the Average Family Size in Troy
Average Family Size in Troy is 2.8 People.
What is the Average Household Size in Troy
Average Household Size in Troy is 2.6 People.
How Large is the Labor Force in Troy?
There are 6,623 People in the Labor Forcein in Troy.
What is the Percentage of People in the Labor Force in Troy?
65.3% of People are in the Labor Force in Troy.
What is the Unemployment Rate in Troy?
Unemployment Rate in Troy is 1.8%.