Thayer, MO Map & Demographics
Thayer Map
Thayer Overview
$20,083
PER CAPITA INCOME
$52,589
AVG FAMILY INCOME
$35,357
AVG HOUSEHOLD INCOME
22.6%
WAGE / INCOME GAP [ % ]
77.4¢/ $1
WAGE / INCOME GAP [ $ ]
0.41
INEQUALITY / GINI INDEX
2,111
TOTAL POPULATION
942
MALE POPULATION
1,169
FEMALE POPULATION
80.58
MALES / 100 FEMALES
124.10
FEMALES / 100 MALES
41.8
MEDIAN AGE
3.1
AVG FAMILY SIZE
2.6
AVG HOUSEHOLD SIZE
693
LABOR FORCE [ PEOPLE ]
41.8%
PERCENT IN LABOR FORCE
4.2%
UNEMPLOYMENT RATE
Thayer Zip Codes
Thayer Area Codes
Income in Thayer
Income Overview in Thayer
Per Capita Income in Thayer is $20,083, while median incomes of families and households are $52,589 and $35,357 respectively.
| Characteristic | Number | Measure |
| Per Capita Income | 2,111 | $20,083 |
| Median Family Income | 542 | $52,589 |
| Mean Family Income | 542 | $51,473 |
| Median Household Income | 794 | $35,357 |
| Mean Household Income | 794 | $46,174 |
| Income Deficit | 542 | $0 |
| Wage / Income Gap (%) | 2,111 | 22.56% |
| Wage / Income Gap ($) | 2,111 | 77.44¢ per $1 |
| Gini / Inequality Index | 2,111 | 0.41 |
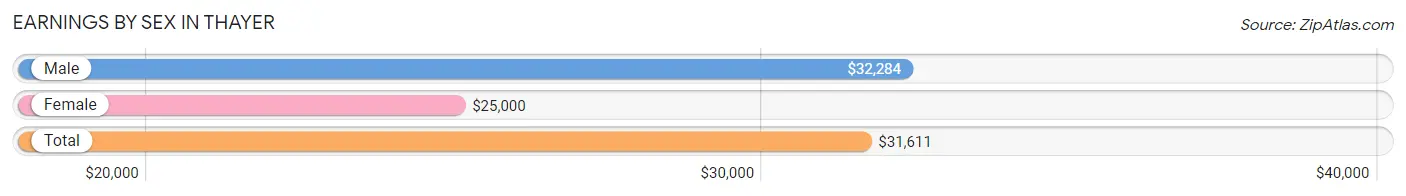
Earnings by Sex in Thayer
Average Earnings in Thayer are $31,611, $32,284 for men and $25,000 for women, a difference of 22.6%.
| Sex | Number | Average Earnings |
| Male | 347 (50.7%) | $32,284 |
| Female | 338 (49.3%) | $25,000 |
| Total | 685 (100.0%) | $31,611 |
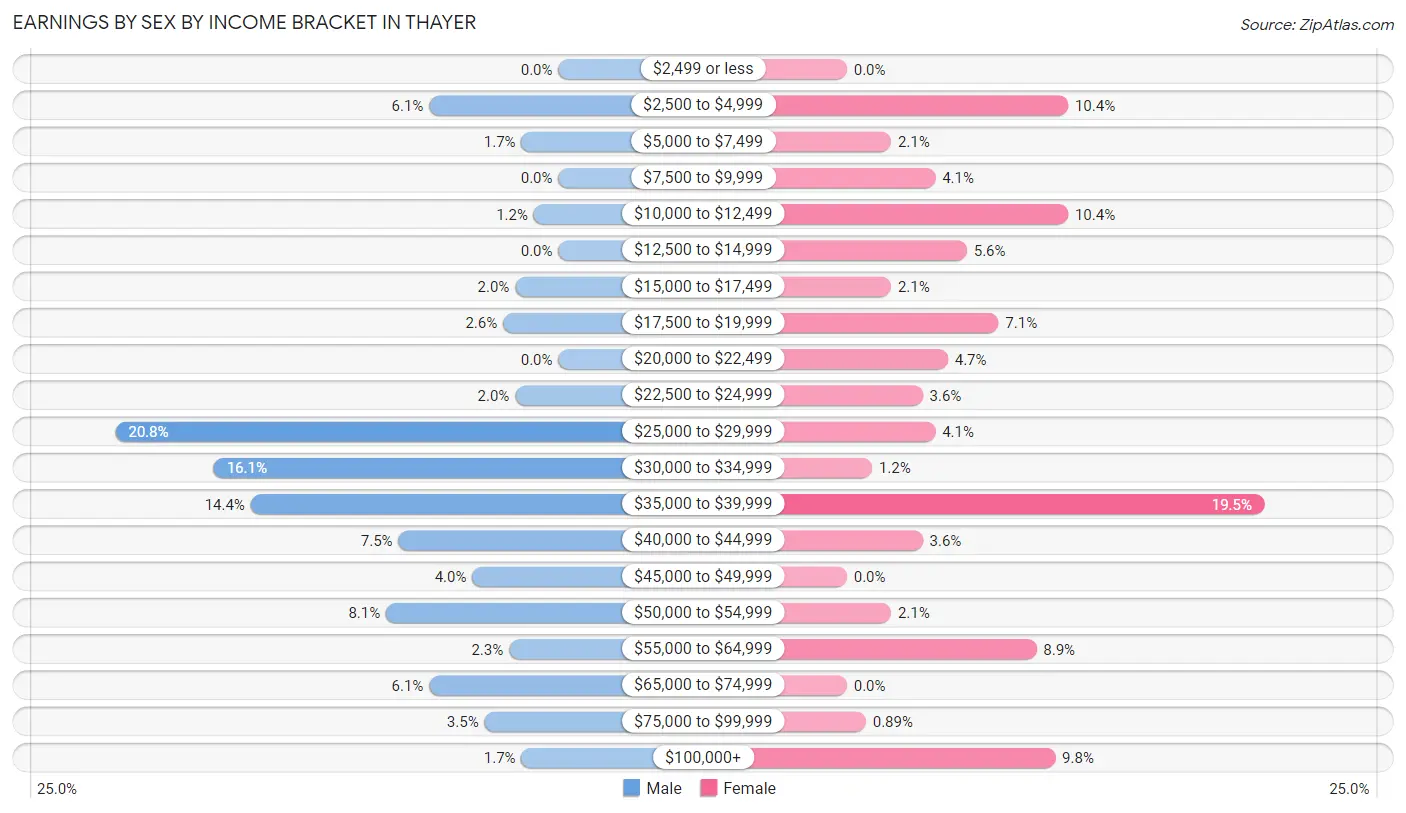
Earnings by Sex by Income Bracket in Thayer
The most common earnings brackets in Thayer are $25,000 to $29,999 for men (72 | 20.7%) and $35,000 to $39,999 for women (66 | 19.5%).
| Income | Male | Female |
| $2,499 or less | 0 (0.0%) | 0 (0.0%) |
| $2,500 to $4,999 | 21 (6.0%) | 35 (10.4%) |
| $5,000 to $7,499 | 6 (1.7%) | 7 (2.1%) |
| $7,500 to $9,999 | 0 (0.0%) | 14 (4.1%) |
| $10,000 to $12,499 | 4 (1.1%) | 35 (10.4%) |
| $12,500 to $14,999 | 0 (0.0%) | 19 (5.6%) |
| $15,000 to $17,499 | 7 (2.0%) | 7 (2.1%) |
| $17,500 to $19,999 | 9 (2.6%) | 24 (7.1%) |
| $20,000 to $22,499 | 0 (0.0%) | 16 (4.7%) |
| $22,500 to $24,999 | 7 (2.0%) | 12 (3.5%) |
| $25,000 to $29,999 | 72 (20.7%) | 14 (4.1%) |
| $30,000 to $34,999 | 56 (16.1%) | 4 (1.2%) |
| $35,000 to $39,999 | 50 (14.4%) | 66 (19.5%) |
| $40,000 to $44,999 | 26 (7.5%) | 12 (3.5%) |
| $45,000 to $49,999 | 14 (4.0%) | 0 (0.0%) |
| $50,000 to $54,999 | 28 (8.1%) | 7 (2.1%) |
| $55,000 to $64,999 | 8 (2.3%) | 30 (8.9%) |
| $65,000 to $74,999 | 21 (6.0%) | 0 (0.0%) |
| $75,000 to $99,999 | 12 (3.5%) | 3 (0.9%) |
| $100,000+ | 6 (1.7%) | 33 (9.8%) |
| Total | 347 (100.0%) | 338 (100.0%) |
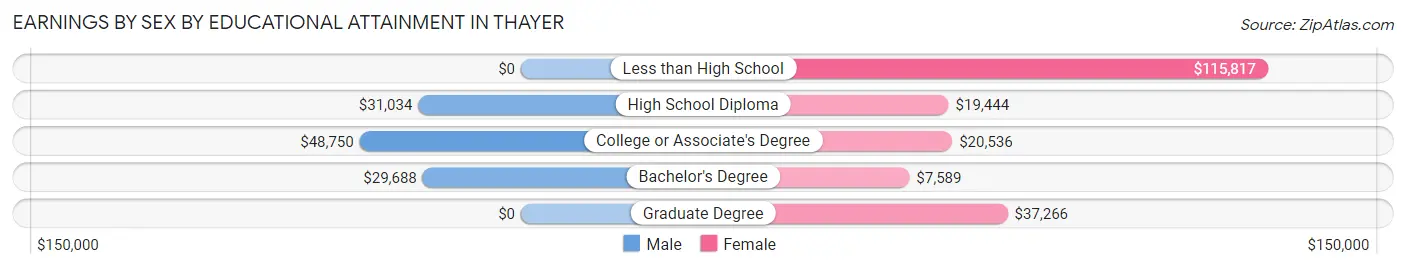
Earnings by Sex by Educational Attainment in Thayer
Average earnings in Thayer are $32,163 for men and $35,170 for women, a difference of 8.6%. Men with an educational attainment of college or associate's degree enjoy the highest average annual earnings of $48,750, while those with bachelor's degree education earn the least with $29,688. Women with an educational attainment of less than high school earn the most with the average annual earnings of $115,817, while those with bachelor's degree education have the smallest earnings of $7,589.
| Educational Attainment | Male Income | Female Income |
| Less than High School | - | - |
| High School Diploma | $31,034 | $19,444 |
| College or Associate's Degree | $48,750 | $20,536 |
| Bachelor's Degree | $29,688 | $7,589 |
| Graduate Degree | - | - |
| Total | $32,163 | $35,170 |
Family Income in Thayer
Family Income Brackets in Thayer
According to the Thayer family income data, there are 179 families falling into the $50,000 to $74,999 income range, which is the most common income bracket and makes up 33.0% of all families.

| Income Bracket | # Families | % Families |
| Less than $10,000 | 38 | 7.0% |
| $10,000 to $14,999 | 5 | 0.9% |
| $15,000 to $24,999 | 96 | 17.7% |
| $25,000 to $34,999 | 91 | 16.8% |
| $35,000 to $49,999 | 31 | 5.7% |
| $50,000 to $74,999 | 179 | 33.0% |
| $75,000 to $99,999 | 54 | 10.0% |
| $100,000 to $149,999 | 46 | 8.5% |
| $150,000 to $199,999 | 2 | 0.4% |
| $200,000+ | 0 | 0.0% |
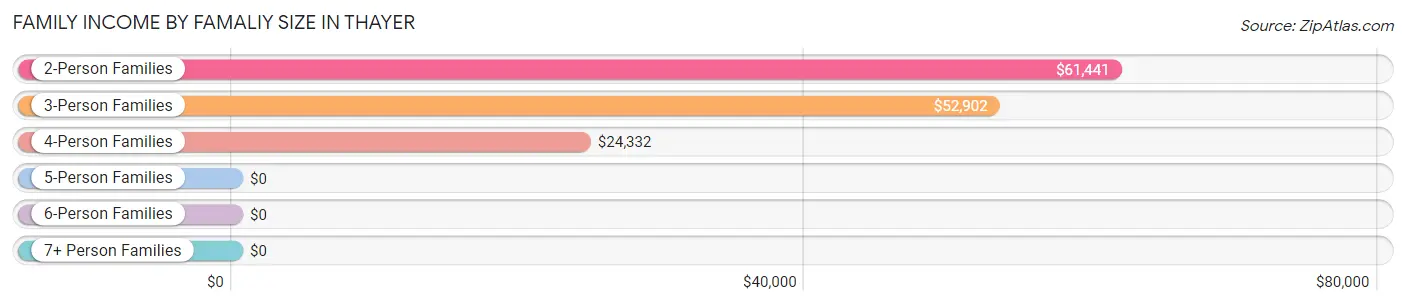
Family Income by Famaliy Size in Thayer
2-person families (284 | 52.4%) account for the highest median family income in Thayer with $61,441 per family, while 2-person families (284 | 52.4%) have the highest median income of $30,720 per family member.
| Income Bracket | # Families | Median Income |
| 2-Person Families | 284 (52.4%) | $61,441 |
| 3-Person Families | 67 (12.4%) | $52,902 |
| 4-Person Families | 149 (27.5%) | $24,332 |
| 5-Person Families | 0 (0.0%) | $0 |
| 6-Person Families | 28 (5.2%) | $0 |
| 7+ Person Families | 14 (2.6%) | $0 |
| Total | 542 (100.0%) | $52,589 |
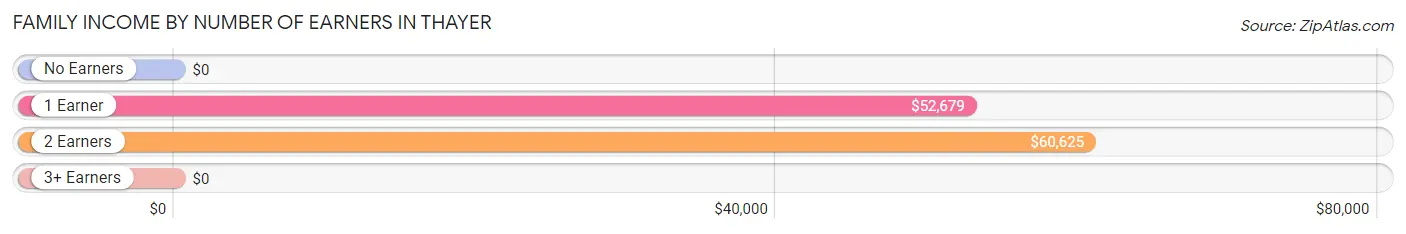
Family Income by Number of Earners in Thayer
| Number of Earners | # Families | Median Income |
| No Earners | 220 (40.6%) | $0 |
| 1 Earner | 180 (33.2%) | $52,679 |
| 2 Earners | 130 (24.0%) | $60,625 |
| 3+ Earners | 12 (2.2%) | $0 |
| Total | 542 (100.0%) | $52,589 |
Household Income in Thayer
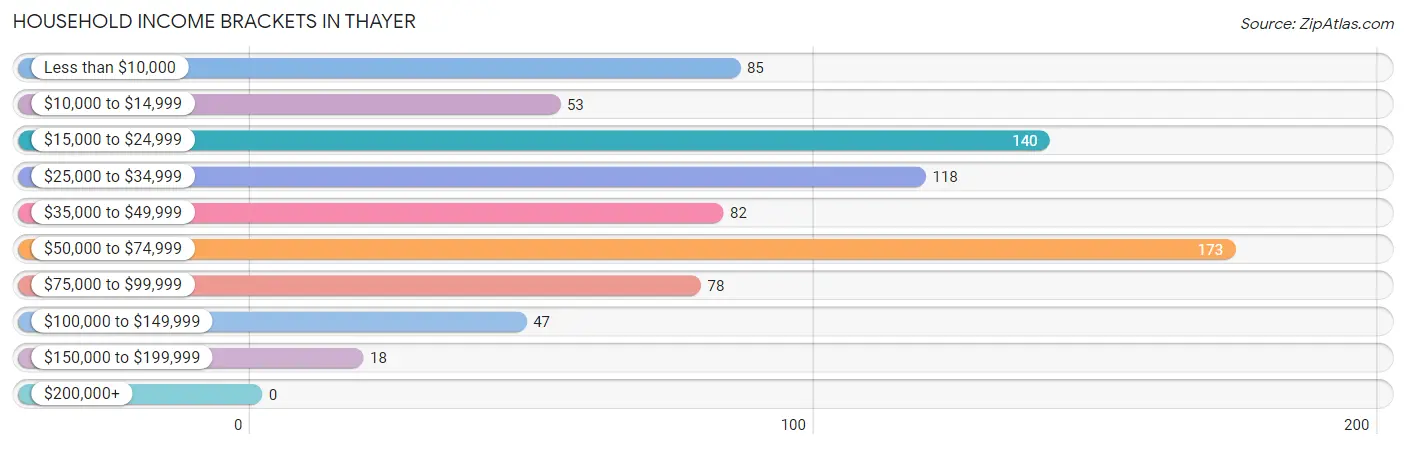
Household Income Brackets in Thayer
With 173 households falling in the category, the $50,000 to $74,999 income range is the most frequent in Thayer, accounting for 21.8% of all households.
| Income Bracket | # Households | % Households |
| Less than $10,000 | 85 | 10.7% |
| $10,000 to $14,999 | 53 | 6.7% |
| $15,000 to $24,999 | 140 | 17.6% |
| $25,000 to $34,999 | 118 | 14.9% |
| $35,000 to $49,999 | 82 | 10.3% |
| $50,000 to $74,999 | 173 | 21.8% |
| $75,000 to $99,999 | 78 | 9.8% |
| $100,000 to $149,999 | 47 | 5.9% |
| $150,000 to $199,999 | 18 | 2.3% |
| $200,000+ | 0 | 0.0% |
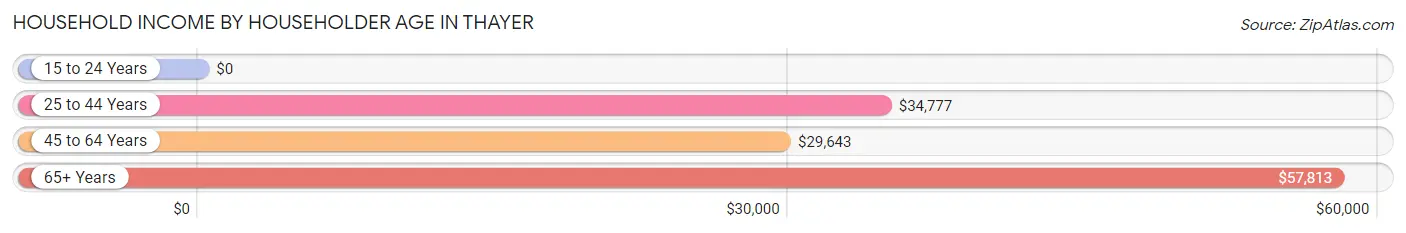
Household Income by Householder Age in Thayer
The median household income in Thayer is $35,357, with the highest median household income of $57,813 found in the 65+ years age bracket for the primary householder. A total of 285 households (35.9%) fall into this category. Meanwhile, the 15 to 24 years age bracket for the primary householder has the lowest median household income of $0, with 22 households (2.8%) in this group.
| Income Bracket | # Households | Median Income |
| 15 to 24 Years | 22 (2.8%) | $0 |
| 25 to 44 Years | 223 (28.1%) | $34,777 |
| 45 to 64 Years | 264 (33.3%) | $29,643 |
| 65+ Years | 285 (35.9%) | $57,813 |
| Total | 794 (100.0%) | $35,357 |
Poverty in Thayer
Income Below Poverty by Sex and Age in Thayer
With 23.2% poverty level for males and 42.8% for females among the residents of Thayer, 5 year old males and 6 to 11 year old females are the most vulnerable to poverty, with 20 males (100.0%) and 78 females (100.0%) in their respective age groups living below the poverty level.
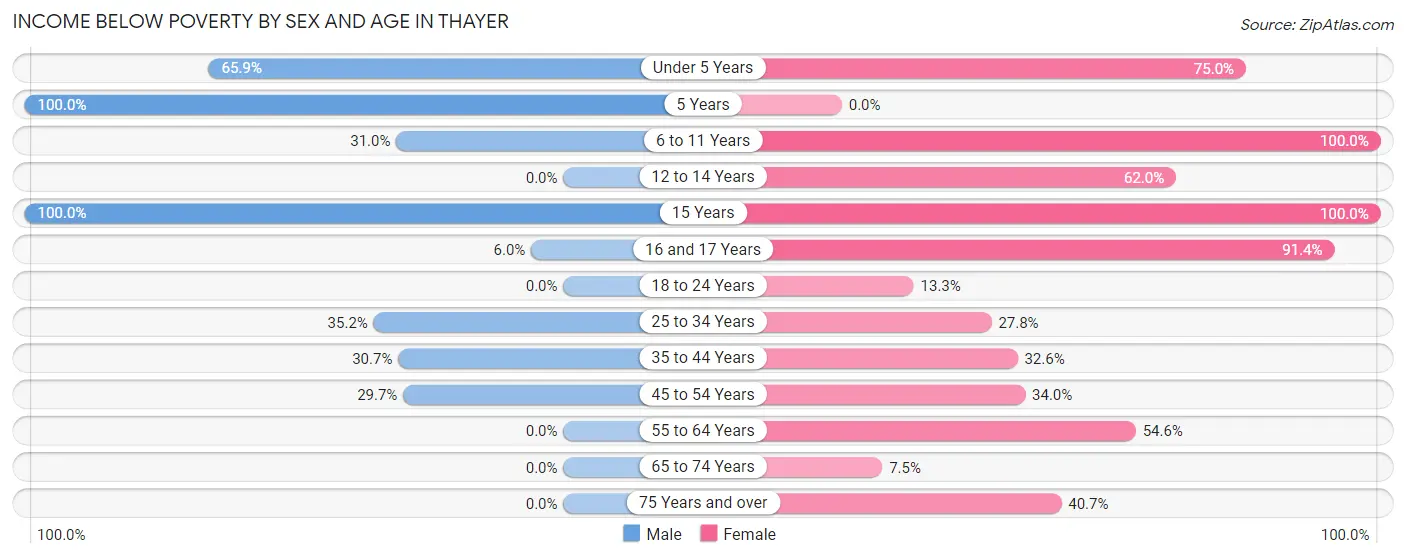
| Age Bracket | Male | Female |
| Under 5 Years | 27 (65.8%) | 21 (75.0%) |
| 5 Years | 20 (100.0%) | 0 (0.0%) |
| 6 to 11 Years | 40 (31.0%) | 78 (100.0%) |
| 12 to 14 Years | 0 (0.0%) | 49 (62.0%) |
| 15 Years | 25 (100.0%) | 14 (100.0%) |
| 16 and 17 Years | 4 (6.0%) | 64 (91.4%) |
| 18 to 24 Years | 0 (0.0%) | 10 (13.3%) |
| 25 to 34 Years | 25 (35.2%) | 15 (27.8%) |
| 35 to 44 Years | 61 (30.6%) | 75 (32.6%) |
| 45 to 54 Years | 11 (29.7%) | 33 (34.0%) |
| 55 to 64 Years | 0 (0.0%) | 66 (54.5%) |
| 65 to 74 Years | 0 (0.0%) | 13 (7.5%) |
| 75 Years and over | 0 (0.0%) | 44 (40.7%) |
| Total | 213 (23.2%) | 482 (42.8%) |
Income Above Poverty by Sex and Age in Thayer
According to the poverty statistics in Thayer, males aged 12 to 14 years and females aged 65 to 74 years are the age groups that are most secure financially, with 100.0% of males and 92.5% of females in these age groups living above the poverty line.
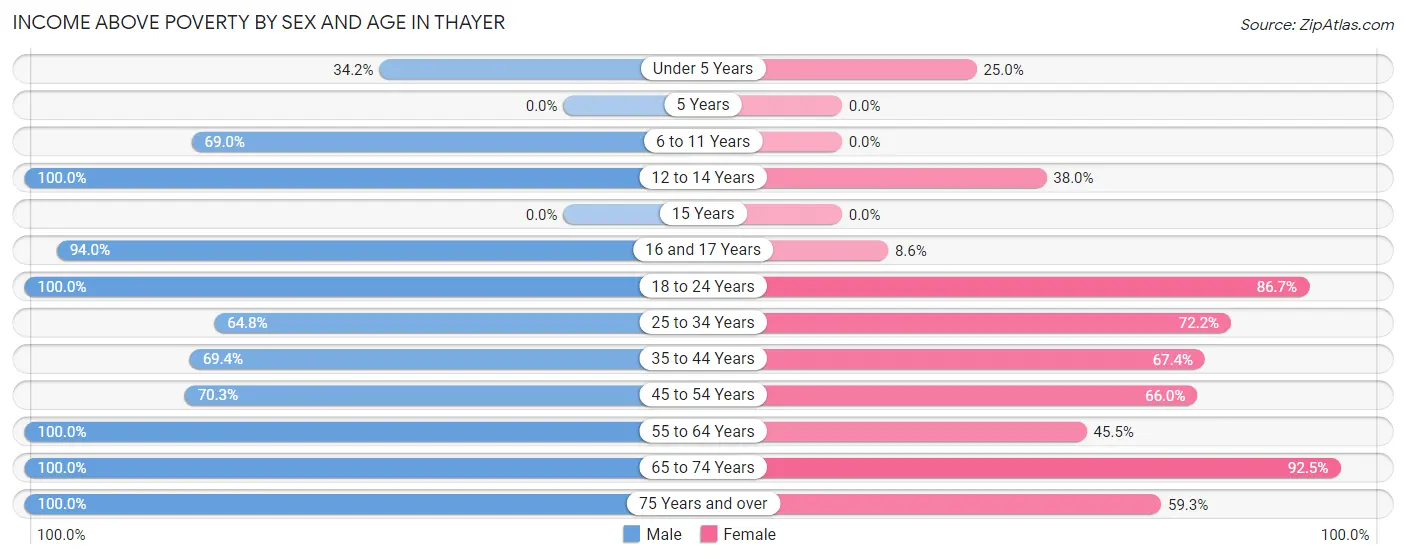
| Age Bracket | Male | Female |
| Under 5 Years | 14 (34.2%) | 7 (25.0%) |
| 5 Years | 0 (0.0%) | 0 (0.0%) |
| 6 to 11 Years | 89 (69.0%) | 0 (0.0%) |
| 12 to 14 Years | 40 (100.0%) | 30 (38.0%) |
| 15 Years | 0 (0.0%) | 0 (0.0%) |
| 16 and 17 Years | 63 (94.0%) | 6 (8.6%) |
| 18 to 24 Years | 5 (100.0%) | 65 (86.7%) |
| 25 to 34 Years | 46 (64.8%) | 39 (72.2%) |
| 35 to 44 Years | 138 (69.4%) | 155 (67.4%) |
| 45 to 54 Years | 26 (70.3%) | 64 (66.0%) |
| 55 to 64 Years | 106 (100.0%) | 55 (45.5%) |
| 65 to 74 Years | 125 (100.0%) | 160 (92.5%) |
| 75 Years and over | 52 (100.0%) | 64 (59.3%) |
| Total | 704 (76.8%) | 645 (57.2%) |
Income Below Poverty Among Married-Couple Families in Thayer
The poverty statistics for married-couple families in Thayer show that 15.8% or 57 of the total 362 families live below the poverty line. Families with 3 or 4 children have the highest poverty rate of 100.0%, comprising of 28 families. On the other hand, families with no children have the lowest poverty rate of 1.6%, which includes 4 families.
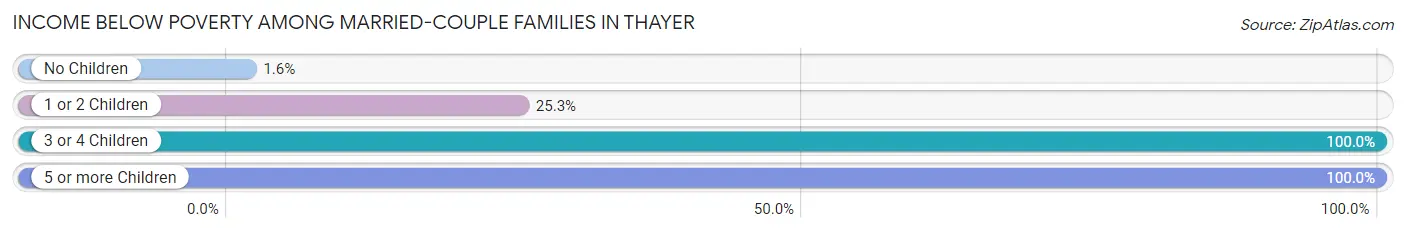
| Children | Above Poverty | Below Poverty |
| No Children | 246 (98.4%) | 4 (1.6%) |
| 1 or 2 Children | 59 (74.7%) | 20 (25.3%) |
| 3 or 4 Children | 0 (0.0%) | 28 (100.0%) |
| 5 or more Children | 0 (0.0%) | 5 (100.0%) |
| Total | 305 (84.3%) | 57 (15.8%) |
Income Below Poverty Among Single-Parent Households in Thayer
According to the poverty data in Thayer, 16.1% or 10 single-father households and 78.8% or 93 single-mother households are living below the poverty line. Among single-father households, those with no children have the highest poverty rate, with 4 households (22.2%) experiencing poverty. Likewise, among single-mother households, those with 3 or 4 children have the highest poverty rate, with 79 households (89.8%) falling below the poverty line.
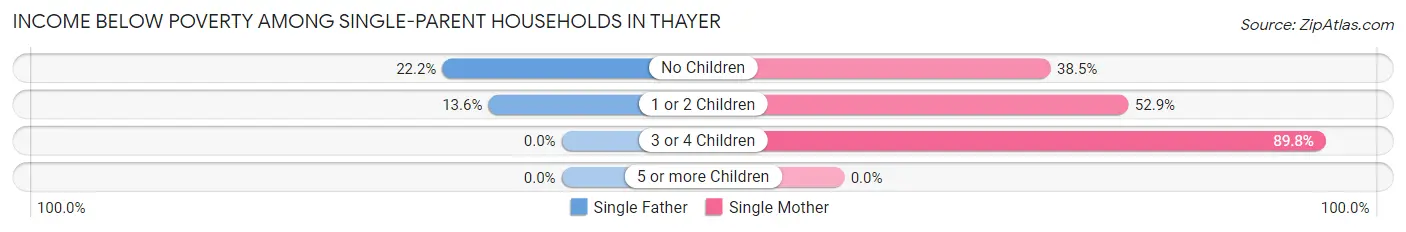
| Children | Single Father | Single Mother |
| No Children | 4 (22.2%) | 5 (38.5%) |
| 1 or 2 Children | 6 (13.6%) | 9 (52.9%) |
| 3 or 4 Children | 0 (0.0%) | 79 (89.8%) |
| 5 or more Children | 0 (0.0%) | 0 (0.0%) |
| Total | 10 (16.1%) | 93 (78.8%) |
Income Below Poverty Among Married-Couple vs Single-Parent Households in Thayer
The poverty data for Thayer shows that 57 of the married-couple family households (15.8%) and 103 of the single-parent households (57.2%) are living below the poverty level. Within the married-couple family households, those with 3 or 4 children have the highest poverty rate, with 28 households (100.0%) falling below the poverty line. Among the single-parent households, those with 3 or 4 children have the highest poverty rate, with 79 household (89.8%) living below poverty.
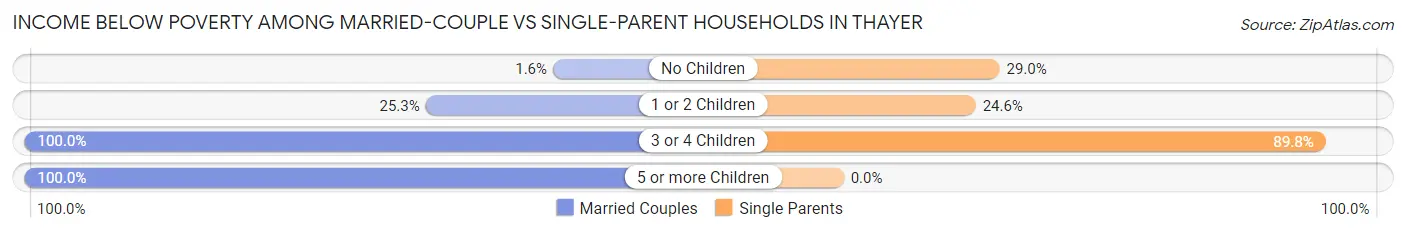
| Children | Married-Couple Families | Single-Parent Households |
| No Children | 4 (1.6%) | 9 (29.0%) |
| 1 or 2 Children | 20 (25.3%) | 15 (24.6%) |
| 3 or 4 Children | 28 (100.0%) | 79 (89.8%) |
| 5 or more Children | 5 (100.0%) | 0 (0.0%) |
| Total | 57 (15.8%) | 103 (57.2%) |
Race in Thayer
The most populous races in Thayer are White / Caucasian (1,946 | 92.2%), Two or more Races (161 | 7.6%), and Hispanic or Latino (51 | 2.4%).
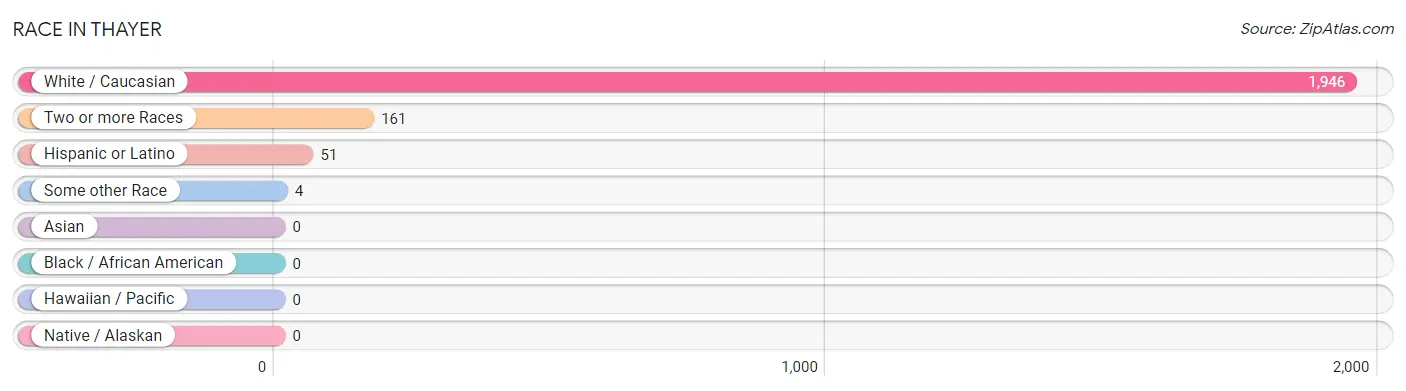
| Race | # Population | % Population |
| Asian | 0 | 0.0% |
| Black / African American | 0 | 0.0% |
| Hawaiian / Pacific | 0 | 0.0% |
| Hispanic or Latino | 51 | 2.4% |
| Native / Alaskan | 0 | 0.0% |
| White / Caucasian | 1,946 | 92.2% |
| Two or more Races | 161 | 7.6% |
| Some other Race | 4 | 0.2% |
| Total | 2,111 | 100.0% |
Ancestry in Thayer
The most populous ancestries reported in Thayer are English (462 | 21.9%), Irish (412 | 19.5%), German (260 | 12.3%), American (116 | 5.5%), and Scottish (83 | 3.9%), together accounting for 63.2% of all Thayer residents.
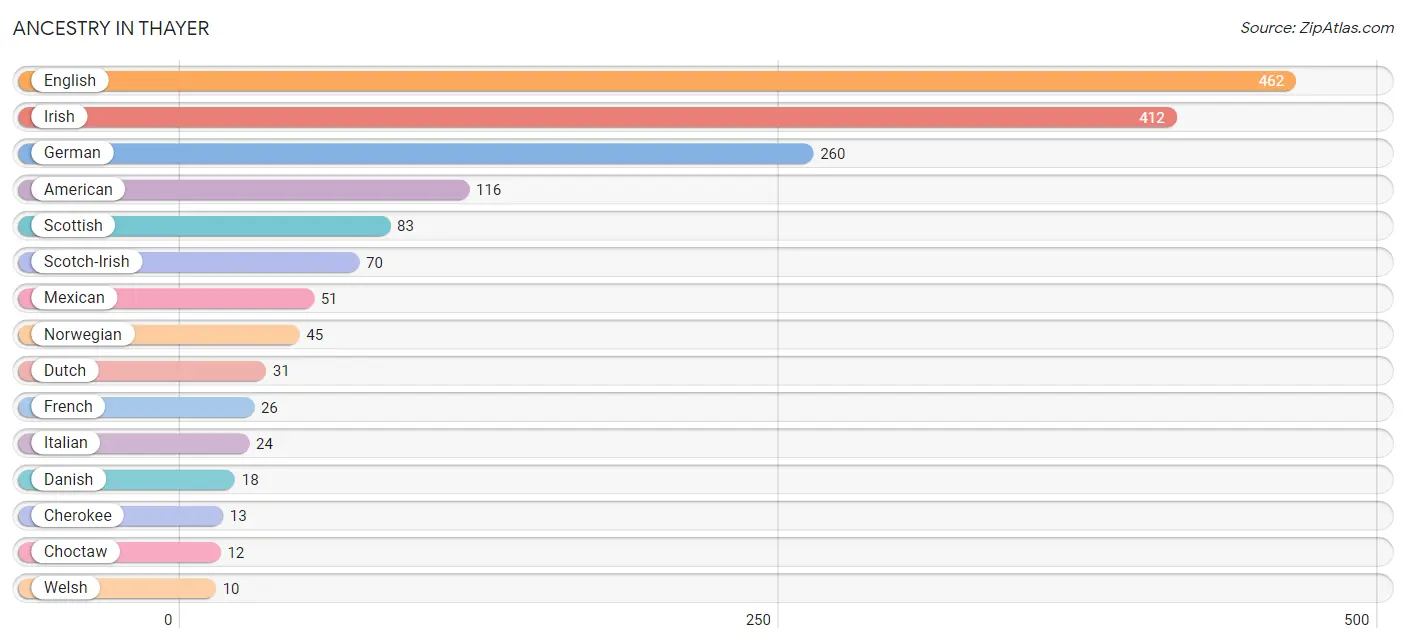
| Ancestry | # Population | % Population |
| American | 116 | 5.5% |
| Cherokee | 13 | 0.6% |
| Choctaw | 12 | 0.6% |
| Danish | 18 | 0.9% |
| Dutch | 31 | 1.5% |
| English | 462 | 21.9% |
| French | 26 | 1.2% |
| French Canadian | 8 | 0.4% |
| German | 260 | 12.3% |
| Greek | 4 | 0.2% |
| Hungarian | 8 | 0.4% |
| Irish | 412 | 19.5% |
| Italian | 24 | 1.1% |
| Korean | 3 | 0.1% |
| Mexican | 51 | 2.4% |
| Native Hawaiian | 6 | 0.3% |
| Norwegian | 45 | 2.1% |
| Russian | 4 | 0.2% |
| Scotch-Irish | 70 | 3.3% |
| Scottish | 83 | 3.9% |
| Welsh | 10 | 0.5% | View All 21 Rows |
Immigrants in Thayer
The most numerous immigrant groups reported in Thayer came from Asia (8 | 0.4%), Eastern Asia (5 | 0.2%), Japan (5 | 0.2%), Philippines (3 | 0.1%), and South Eastern Asia (3 | 0.1%), together accounting for 1.1% of all Thayer residents.
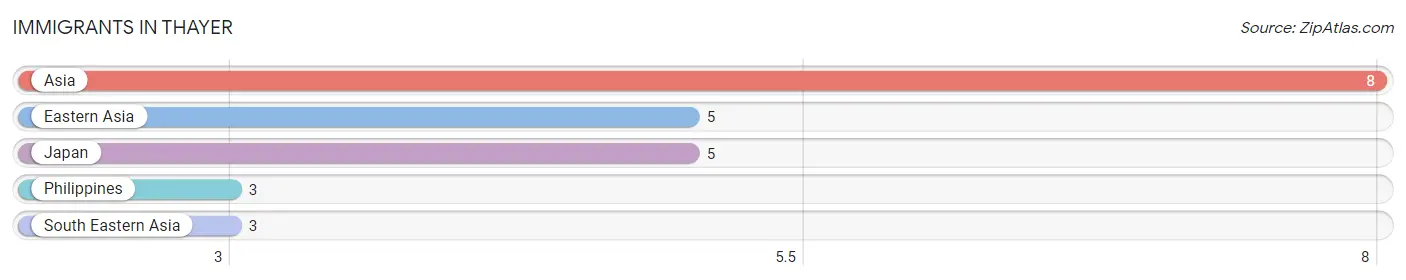
| Immigration Origin | # Population | % Population |
| Asia | 8 | 0.4% |
| Eastern Asia | 5 | 0.2% |
| Japan | 5 | 0.2% |
| Philippines | 3 | 0.1% |
| South Eastern Asia | 3 | 0.1% | View All 5 Rows |
Sex and Age in Thayer
Sex and Age in Thayer
The most populous age groups in Thayer are 40 to 44 Years (136 | 14.4%) for men and 40 to 44 Years (123 | 10.5%) for women.
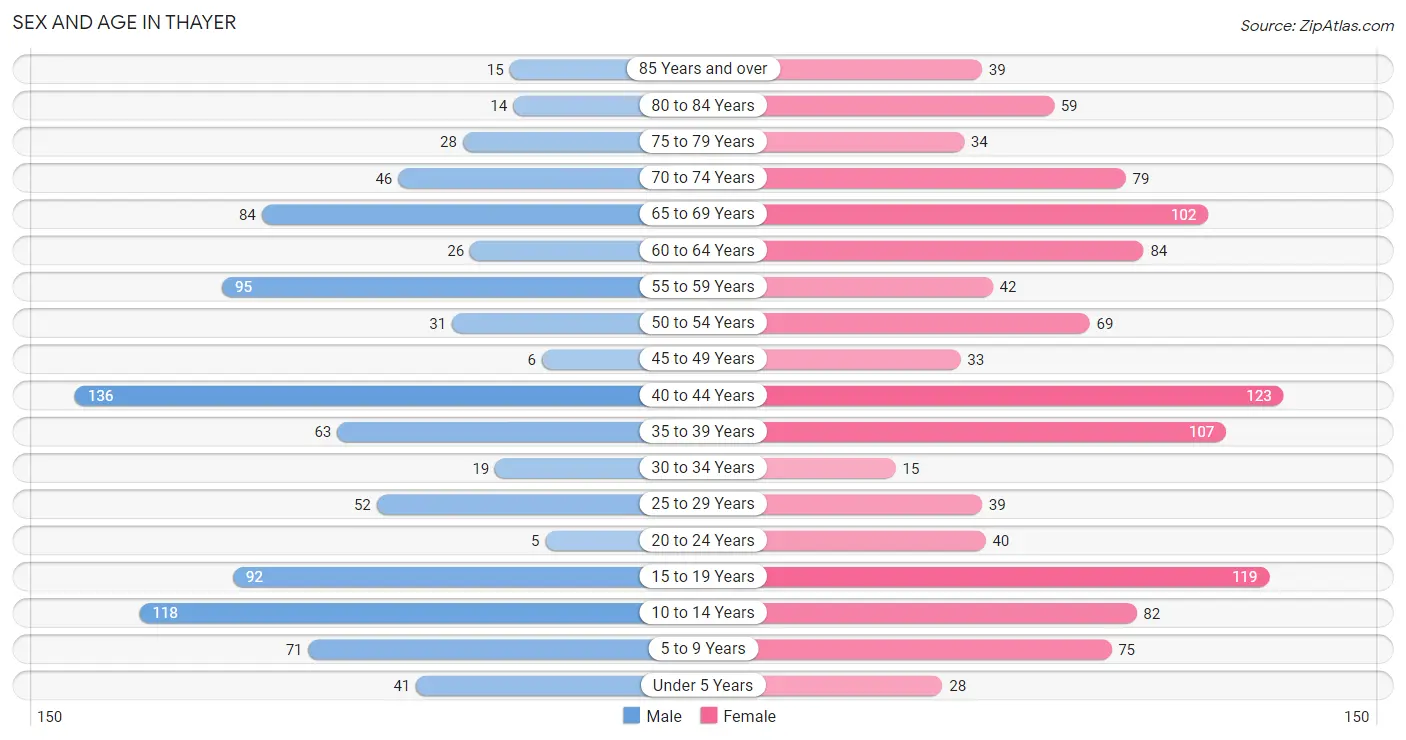
| Age Bracket | Male | Female |
| Under 5 Years | 41 (4.3%) | 28 (2.4%) |
| 5 to 9 Years | 71 (7.5%) | 75 (6.4%) |
| 10 to 14 Years | 118 (12.5%) | 82 (7.0%) |
| 15 to 19 Years | 92 (9.8%) | 119 (10.2%) |
| 20 to 24 Years | 5 (0.5%) | 40 (3.4%) |
| 25 to 29 Years | 52 (5.5%) | 39 (3.3%) |
| 30 to 34 Years | 19 (2.0%) | 15 (1.3%) |
| 35 to 39 Years | 63 (6.7%) | 107 (9.1%) |
| 40 to 44 Years | 136 (14.4%) | 123 (10.5%) |
| 45 to 49 Years | 6 (0.6%) | 33 (2.8%) |
| 50 to 54 Years | 31 (3.3%) | 69 (5.9%) |
| 55 to 59 Years | 95 (10.1%) | 42 (3.6%) |
| 60 to 64 Years | 26 (2.8%) | 84 (7.2%) |
| 65 to 69 Years | 84 (8.9%) | 102 (8.7%) |
| 70 to 74 Years | 46 (4.9%) | 79 (6.8%) |
| 75 to 79 Years | 28 (3.0%) | 34 (2.9%) |
| 80 to 84 Years | 14 (1.5%) | 59 (5.1%) |
| 85 Years and over | 15 (1.6%) | 39 (3.3%) |
| Total | 942 (100.0%) | 1,169 (100.0%) |
Families and Households in Thayer
Median Family Size in Thayer
The median family size in Thayer is 3.10 persons per family, with single female/mother families (118 | 21.8%) accounting for the largest median family size of 4 persons per family. On the other hand, single male/father families (62 | 11.4%) represent the smallest median family size with 2.84 persons per family.
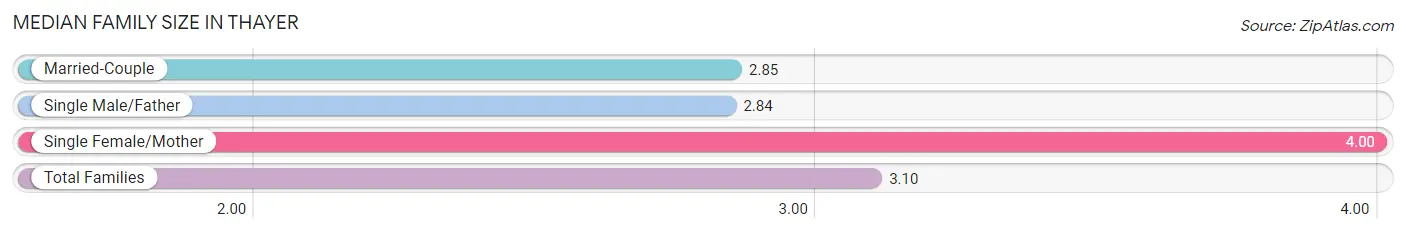
| Family Type | # Families | Family Size |
| Married-Couple | 362 (66.8%) | 2.85 |
| Single Male/Father | 62 (11.4%) | 2.84 |
| Single Female/Mother | 118 (21.8%) | 4.00 |
| Total Families | 542 (100.0%) | 3.10 |
Median Household Size in Thayer
The median household size in Thayer is 2.56 persons per household, with single female/mother households (118 | 14.9%) accounting for the largest median household size of 4.42 persons per household. non-family households (252 | 31.7%) represent the smallest median household size with 1.13 persons per household.
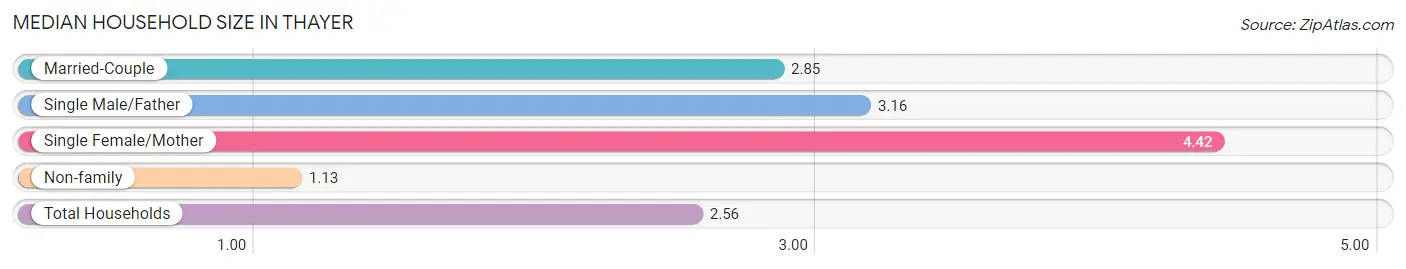
| Household Type | # Households | Household Size |
| Married-Couple | 362 (45.6%) | 2.85 |
| Single Male/Father | 62 (7.8%) | 3.16 |
| Single Female/Mother | 118 (14.9%) | 4.42 |
| Non-family | 252 (31.7%) | 1.13 |
| Total Households | 794 (100.0%) | 2.56 |
Household Size by Marriage Status in Thayer
Out of a total of 794 households in Thayer, 542 (68.3%) are family households, while 252 (31.7%) are nonfamily households. The most numerous type of family households are 2-person households, comprising 284, and the most common type of nonfamily households are 1-person households, comprising 229.
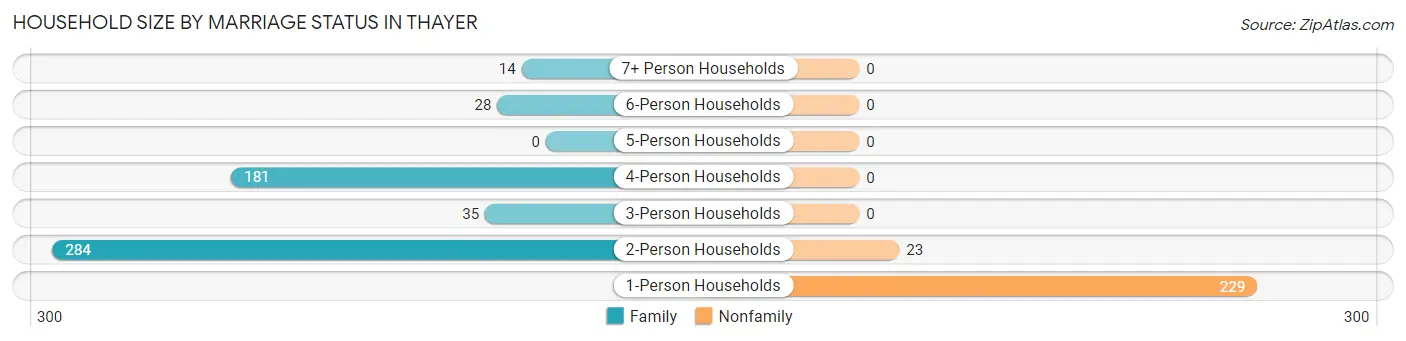
| Household Size | Family Households | Nonfamily Households |
| 1-Person Households | - | 229 (28.8%) |
| 2-Person Households | 284 (35.8%) | 23 (2.9%) |
| 3-Person Households | 35 (4.4%) | 0 (0.0%) |
| 4-Person Households | 181 (22.8%) | 0 (0.0%) |
| 5-Person Households | 0 (0.0%) | 0 (0.0%) |
| 6-Person Households | 28 (3.5%) | 0 (0.0%) |
| 7+ Person Households | 14 (1.8%) | 0 (0.0%) |
| Total | 542 (68.3%) | 252 (31.7%) |
Female Fertility in Thayer
Fertility by Age in Thayer
| Age Bracket | Women with Births | Births / 1,000 Women |
| 15 to 19 years | 0 (0.0%) | 0.0 |
| 20 to 34 years | 0 (0.0%) | 0.0 |
| 35 to 50 years | 0 (0.0%) | 0.0 |
| Total | 0 (0.0%) | 0.0 |
Fertility by Age by Marriage Status in Thayer
| Age Bracket | Married | Unmarried |
| 15 to 19 years | 0 (0.0%) | 0 (0.0%) |
| 20 to 34 years | 0 (0.0%) | 0 (0.0%) |
| 35 to 50 years | 0 (0.0%) | 0 (0.0%) |
| Total | 0 (0.0%) | 0 (0.0%) |
Fertility by Education in Thayer
| Educational Attainment | Women with Births | Births / 1,000 Women |
| Less than High School | 0 (0.0%) | 0.0 |
| High School Diploma | 0 (0.0%) | 0.0 |
| College or Associate's Degree | 0 (0.0%) | 0.0 |
| Bachelor's Degree | 0 (0.0%) | 0.0 |
| Graduate Degree | 0 (0.0%) | 0.0 |
| Total | 0 (0.0%) | 0.0 |
Fertility by Education by Marriage Status in Thayer
| Educational Attainment | Married | Unmarried |
| Less than High School | 0 (0.0%) | 0 (0.0%) |
| High School Diploma | 0 (0.0%) | 0 (0.0%) |
| College or Associate's Degree | 0 (0.0%) | 0 (0.0%) |
| Bachelor's Degree | 0 (0.0%) | 0 (0.0%) |
| Graduate Degree | 0 (0.0%) | 0 (0.0%) |
| Total | 0 (0.0%) | 0 (0.0%) |
Employment Characteristics in Thayer
Employment by Class of Employer in Thayer
Among the 663 employed individuals in Thayer, private company employees (378 | 57.0%), not-for-profit organizations (101 | 15.2%), and local government employees (41 | 6.2%) make up the most common classes of employment.
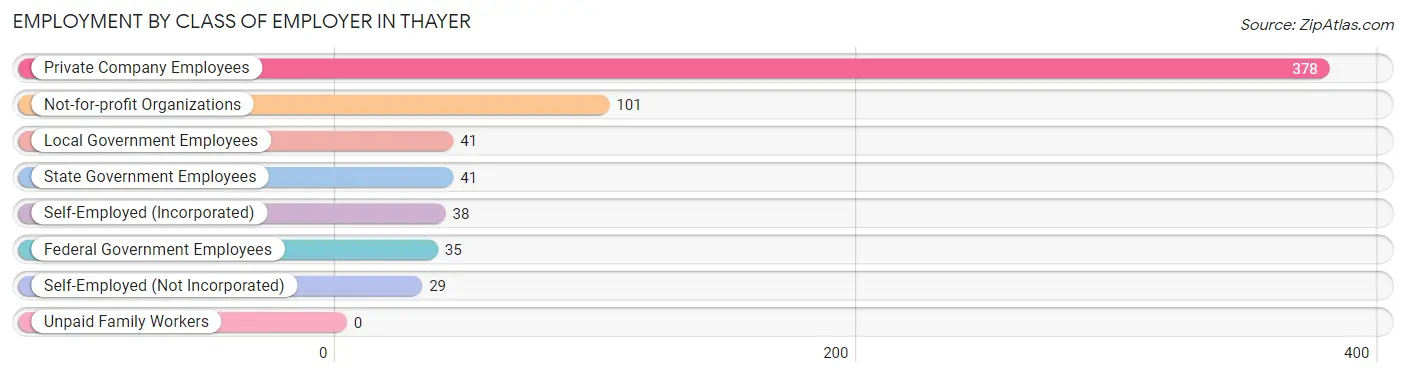
| Employer Class | # Employees | % Employees |
| Private Company Employees | 378 | 57.0% |
| Self-Employed (Incorporated) | 38 | 5.7% |
| Self-Employed (Not Incorporated) | 29 | 4.4% |
| Not-for-profit Organizations | 101 | 15.2% |
| Local Government Employees | 41 | 6.2% |
| State Government Employees | 41 | 6.2% |
| Federal Government Employees | 35 | 5.3% |
| Unpaid Family Workers | 0 | 0.0% |
| Total | 663 | 100.0% |
Employment Status by Age in Thayer
According to the labor force statistics for Thayer, out of the total population over 16 years of age (1,657), 41.8% or 693 individuals are in the labor force, with 4.2% or 29 of them unemployed. The age group with the highest labor force participation rate is 25 to 29 years, with 91.2% or 83 individuals in the labor force. Within the labor force, the 16 to 19 years age range has the highest percentage of unemployed individuals, with 48.3% or 14 of them being unemployed.
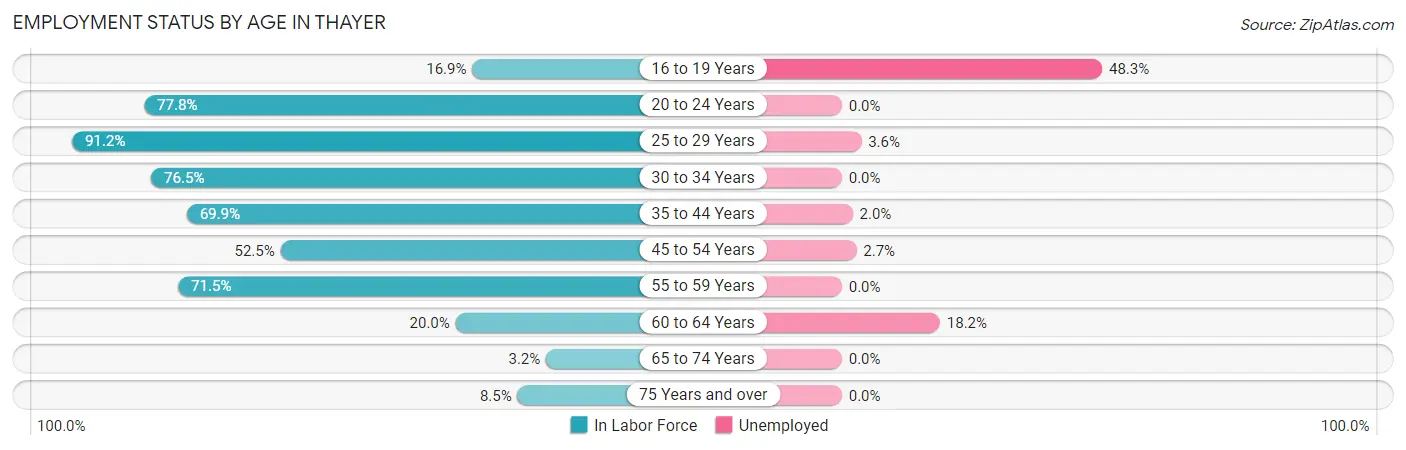
| Age Bracket | In Labor Force | Unemployed |
| 16 to 19 Years | 29 (16.9%) | 14 (48.3%) |
| 20 to 24 Years | 35 (77.8%) | 0 (0.0%) |
| 25 to 29 Years | 83 (91.2%) | 3 (3.6%) |
| 30 to 34 Years | 26 (76.5%) | 0 (0.0%) |
| 35 to 44 Years | 300 (69.9%) | 6 (2.0%) |
| 45 to 54 Years | 73 (52.5%) | 2 (2.7%) |
| 55 to 59 Years | 98 (71.5%) | 0 (0.0%) |
| 60 to 64 Years | 22 (20.0%) | 4 (18.2%) |
| 65 to 74 Years | 10 (3.2%) | 0 (0.0%) |
| 75 Years and over | 16 (8.5%) | 0 (0.0%) |
| Total | 693 (41.8%) | 29 (4.2%) |
Employment Status by Educational Attainment in Thayer
According to labor force statistics for Thayer, 64.0% of individuals (602) out of the total population between 25 and 64 years of age (940) are in the labor force, with 2.5% or 15 of them being unemployed. The group with the highest labor force participation rate are those with the educational attainment of bachelor's degree or higher, with 93.7% or 179 individuals in the labor force. Within the labor force, individuals with high school diploma education have the highest percentage of unemployment, with 3.8% or 7 of them being unemployed.
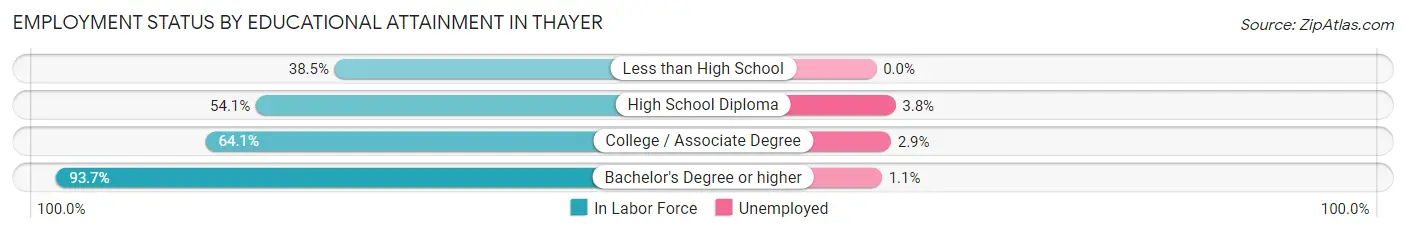
| Educational Attainment | In Labor Force | Unemployed |
| Less than High School | 35 (38.5%) | 0 (0.0%) |
| High School Diploma | 183 (54.1%) | 13 (3.8%) |
| College / Associate Degree | 205 (64.1%) | 9 (2.9%) |
| Bachelor's Degree or higher | 179 (93.7%) | 2 (1.1%) |
| Total | 602 (64.0%) | 24 (2.5%) |
Employment Occupations by Sex in Thayer
Management, Business, Science and Arts Occupations
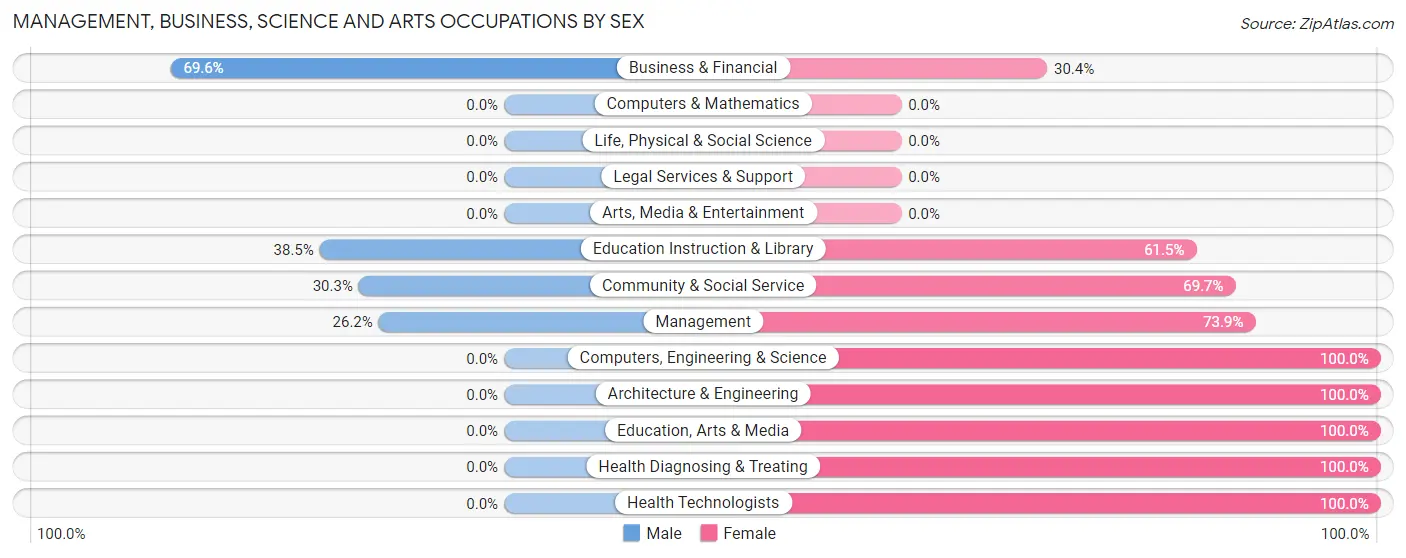
The most common Management, Business, Science and Arts occupations in Thayer are Community & Social Service (66 | 10.0%), Management (65 | 9.8%), Education Instruction & Library (52 | 7.8%), Health Diagnosing & Treating (38 | 5.7%), and Health Technologists (27 | 4.1%).
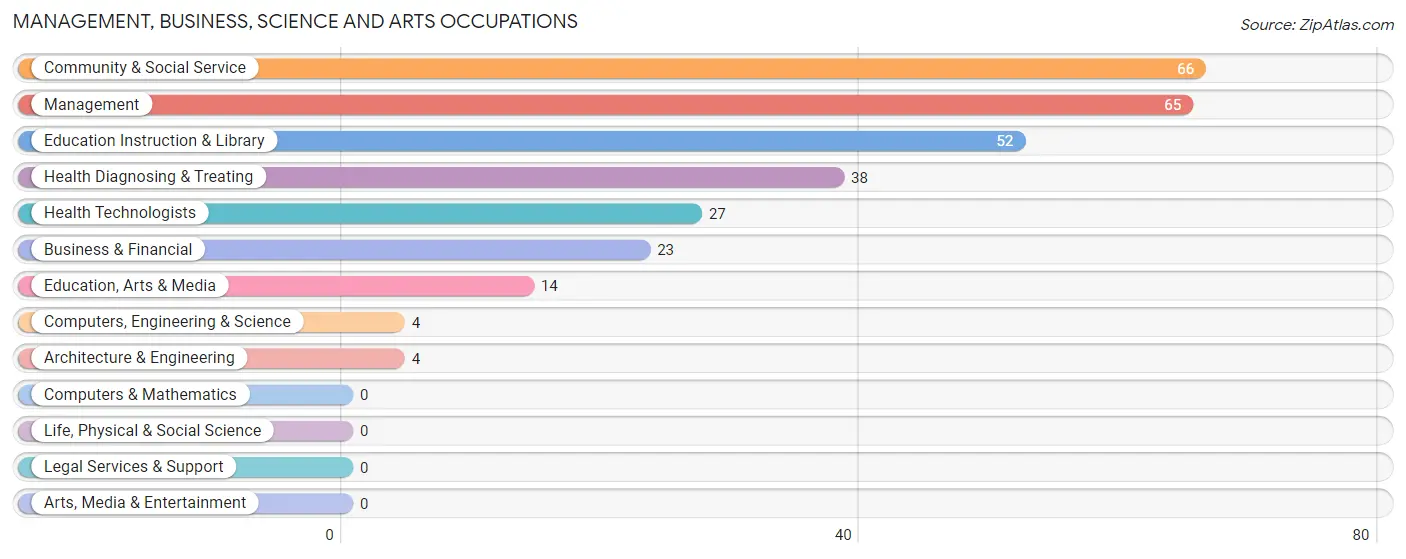
Management, Business, Science and Arts Occupations by Sex
Within the Management, Business, Science and Arts occupations in Thayer, the most male-oriented occupations are Business & Financial (69.6%), Education Instruction & Library (38.5%), and Community & Social Service (30.3%), while the most female-oriented occupations are Computers, Engineering & Science (100.0%), Architecture & Engineering (100.0%), and Education, Arts & Media (100.0%).
| Occupation | Male | Female |
| Management | 17 (26.2%) | 48 (73.9%) |
| Business & Financial | 16 (69.6%) | 7 (30.4%) |
| Computers, Engineering & Science | 0 (0.0%) | 4 (100.0%) |
| Computers & Mathematics | 0 (0.0%) | 0 (0.0%) |
| Architecture & Engineering | 0 (0.0%) | 4 (100.0%) |
| Life, Physical & Social Science | 0 (0.0%) | 0 (0.0%) |
| Community & Social Service | 20 (30.3%) | 46 (69.7%) |
| Education, Arts & Media | 0 (0.0%) | 14 (100.0%) |
| Legal Services & Support | 0 (0.0%) | 0 (0.0%) |
| Education Instruction & Library | 20 (38.5%) | 32 (61.5%) |
| Arts, Media & Entertainment | 0 (0.0%) | 0 (0.0%) |
| Health Diagnosing & Treating | 0 (0.0%) | 38 (100.0%) |
| Health Technologists | 0 (0.0%) | 27 (100.0%) |
| Total (Category) | 53 (27.0%) | 143 (73.0%) |
| Total (Overall) | 334 (50.4%) | 329 (49.6%) |
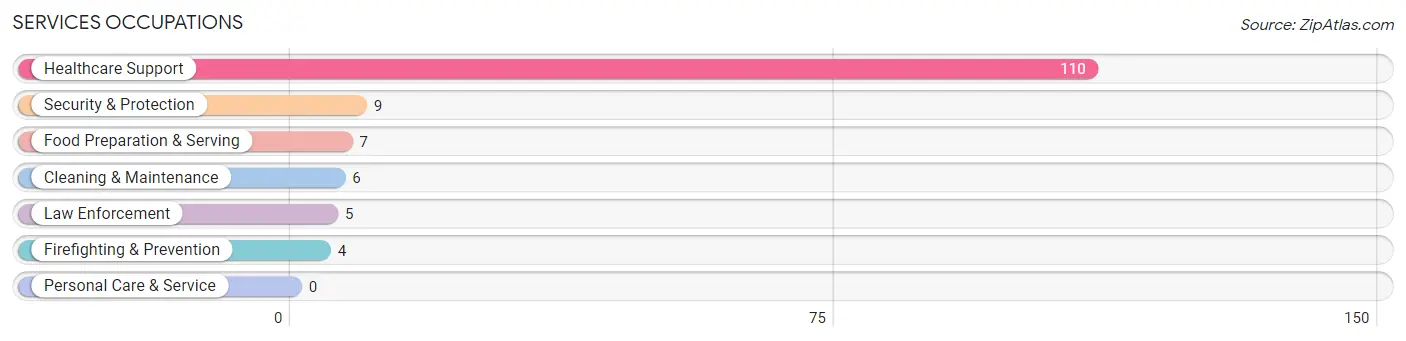
Services Occupations
The most common Services occupations in Thayer are Healthcare Support (110 | 16.6%), Security & Protection (9 | 1.4%), Food Preparation & Serving (7 | 1.1%), Cleaning & Maintenance (6 | 0.9%), and Law Enforcement (5 | 0.7%).
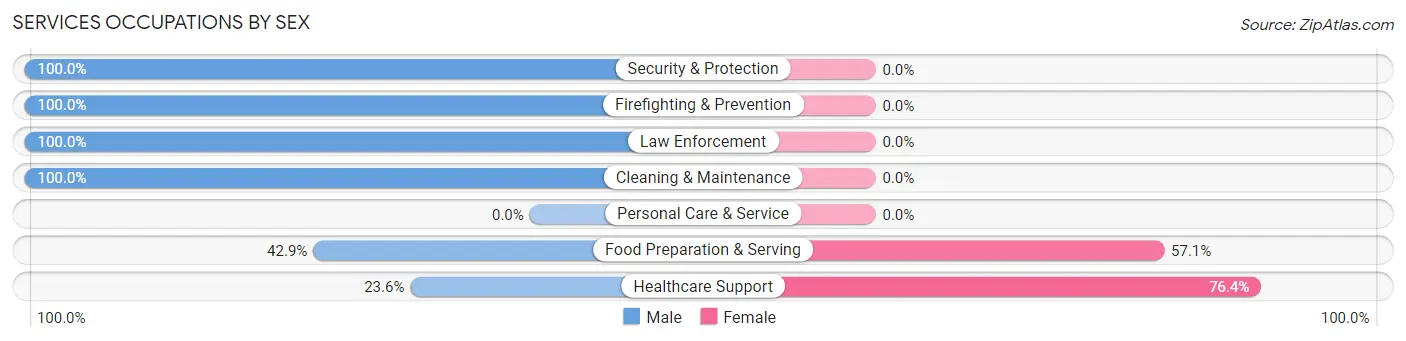
Services Occupations by Sex
Within the Services occupations in Thayer, the most male-oriented occupations are Security & Protection (100.0%), Firefighting & Prevention (100.0%), and Law Enforcement (100.0%), while the most female-oriented occupations are Healthcare Support (76.4%), and Food Preparation & Serving (57.1%).
| Occupation | Male | Female |
| Healthcare Support | 26 (23.6%) | 84 (76.4%) |
| Security & Protection | 9 (100.0%) | 0 (0.0%) |
| Firefighting & Prevention | 4 (100.0%) | 0 (0.0%) |
| Law Enforcement | 5 (100.0%) | 0 (0.0%) |
| Food Preparation & Serving | 3 (42.9%) | 4 (57.1%) |
| Cleaning & Maintenance | 6 (100.0%) | 0 (0.0%) |
| Personal Care & Service | 0 (0.0%) | 0 (0.0%) |
| Total (Category) | 44 (33.3%) | 88 (66.7%) |
| Total (Overall) | 334 (50.4%) | 329 (49.6%) |
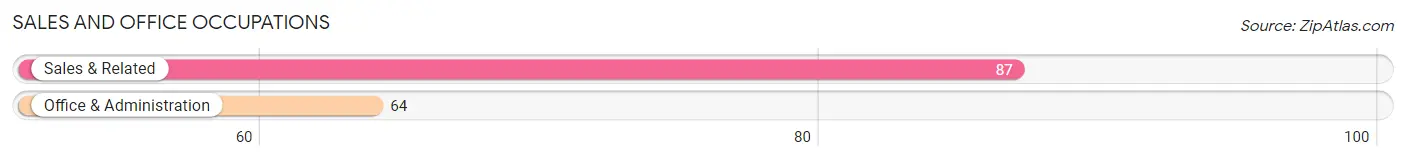
Sales and Office Occupations
The most common Sales and Office occupations in Thayer are Sales & Related (87 | 13.1%), and Office & Administration (64 | 9.7%).
Sales and Office Occupations by Sex
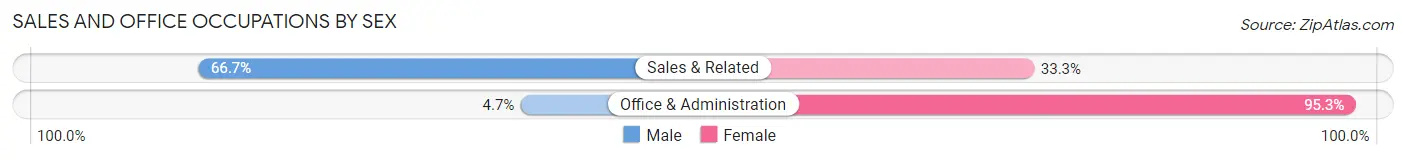
| Occupation | Male | Female |
| Sales & Related | 58 (66.7%) | 29 (33.3%) |
| Office & Administration | 3 (4.7%) | 61 (95.3%) |
| Total (Category) | 61 (40.4%) | 90 (59.6%) |
| Total (Overall) | 334 (50.4%) | 329 (49.6%) |
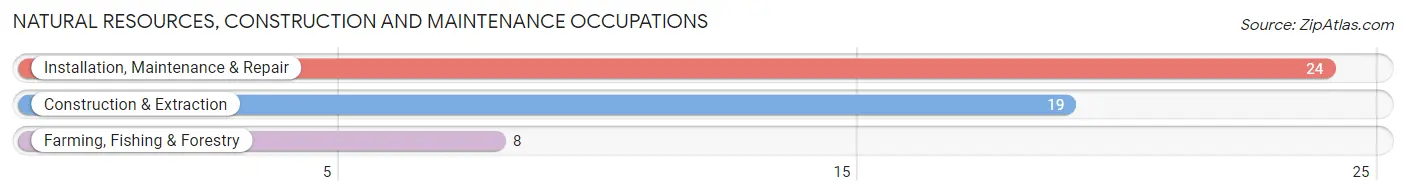
Natural Resources, Construction and Maintenance Occupations
The most common Natural Resources, Construction and Maintenance occupations in Thayer are Installation, Maintenance & Repair (24 | 3.6%), Construction & Extraction (19 | 2.9%), and Farming, Fishing & Forestry (8 | 1.2%).
Natural Resources, Construction and Maintenance Occupations by Sex
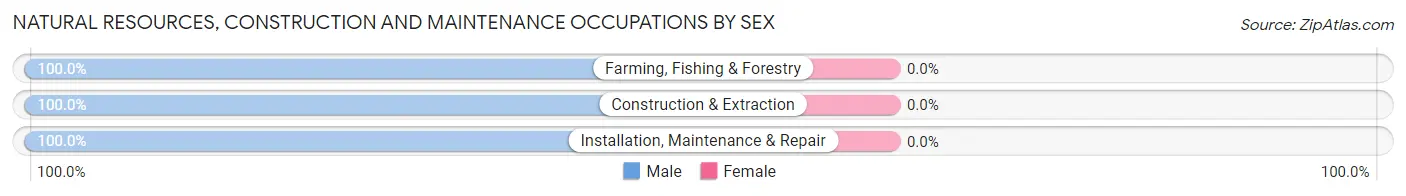
| Occupation | Male | Female |
| Farming, Fishing & Forestry | 8 (100.0%) | 0 (0.0%) |
| Construction & Extraction | 19 (100.0%) | 0 (0.0%) |
| Installation, Maintenance & Repair | 24 (100.0%) | 0 (0.0%) |
| Total (Category) | 51 (100.0%) | 0 (0.0%) |
| Total (Overall) | 334 (50.4%) | 329 (49.6%) |
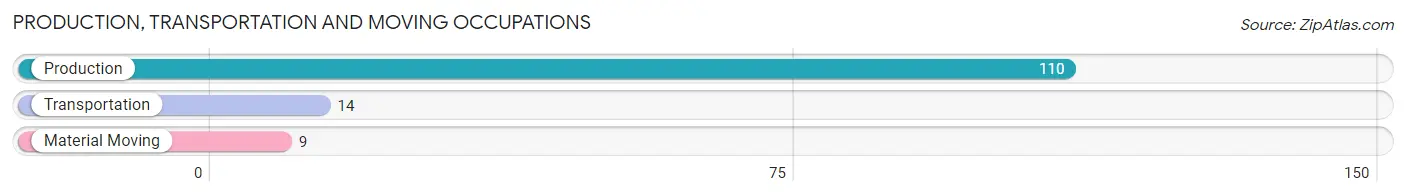
Production, Transportation and Moving Occupations
The most common Production, Transportation and Moving occupations in Thayer are Production (110 | 16.6%), Transportation (14 | 2.1%), and Material Moving (9 | 1.4%).
Production, Transportation and Moving Occupations by Sex
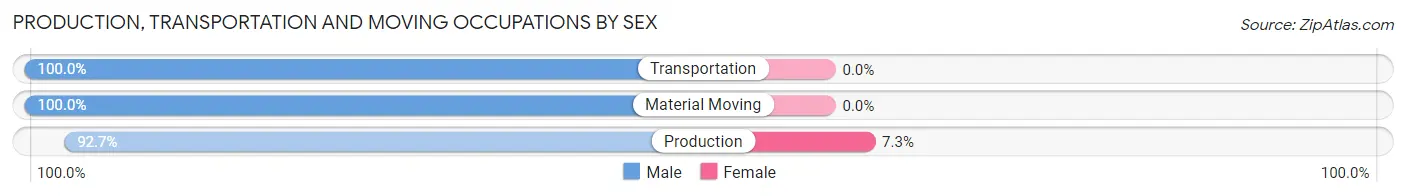
| Occupation | Male | Female |
| Production | 102 (92.7%) | 8 (7.3%) |
| Transportation | 14 (100.0%) | 0 (0.0%) |
| Material Moving | 9 (100.0%) | 0 (0.0%) |
| Total (Category) | 125 (94.0%) | 8 (6.0%) |
| Total (Overall) | 334 (50.4%) | 329 (49.6%) |
Employment Industries by Sex in Thayer
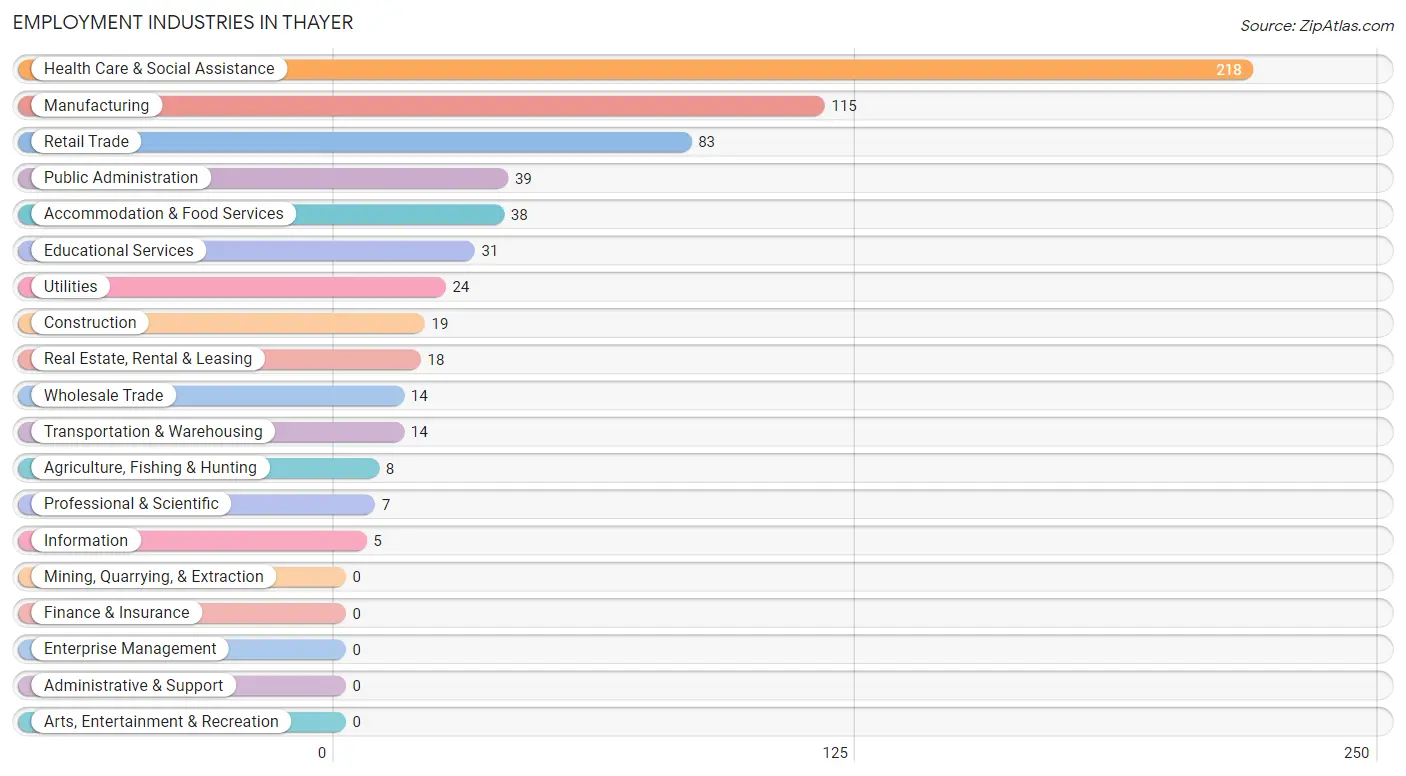
Employment Industries in Thayer
The major employment industries in Thayer include Health Care & Social Assistance (218 | 32.9%), Manufacturing (115 | 17.3%), Retail Trade (83 | 12.5%), Public Administration (39 | 5.9%), and Accommodation & Food Services (38 | 5.7%).
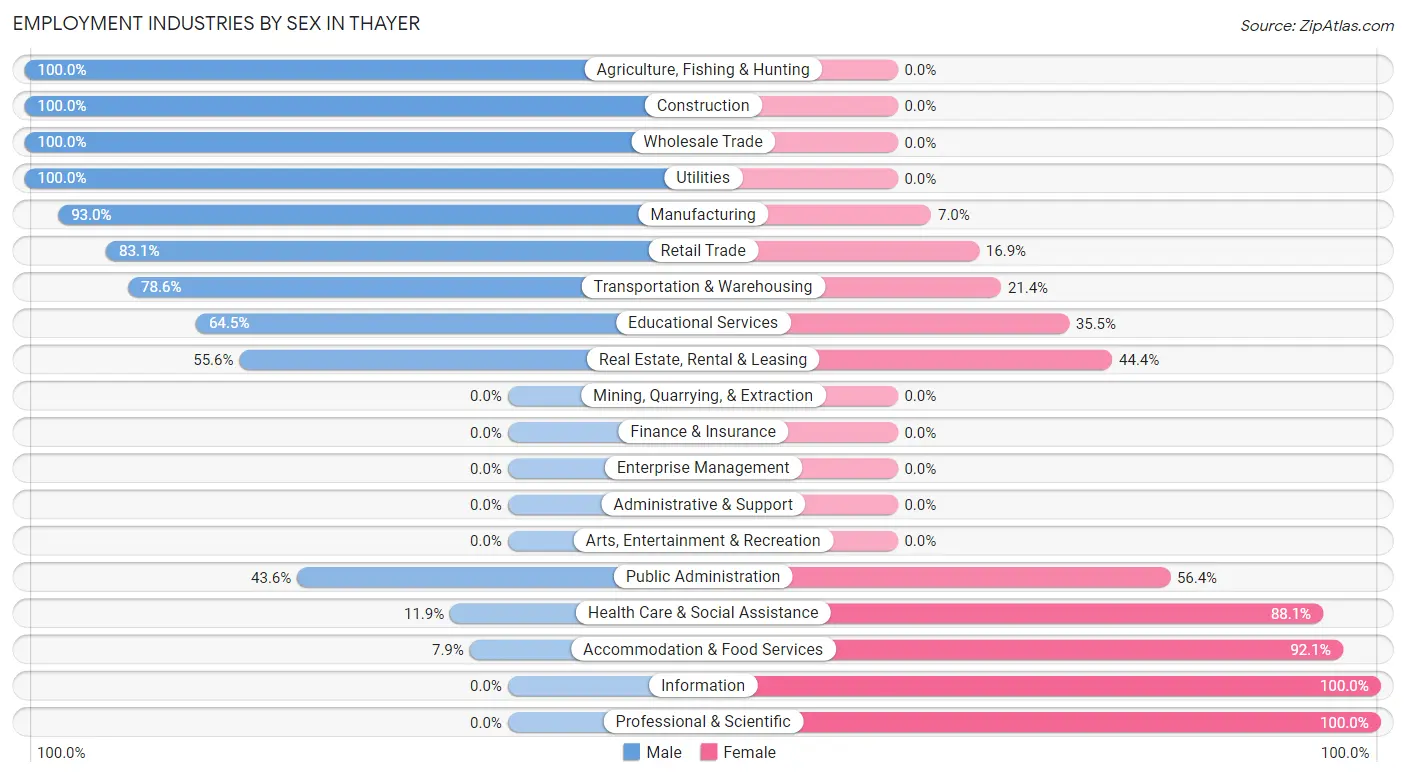
Employment Industries by Sex in Thayer
The Thayer industries that see more men than women are Agriculture, Fishing & Hunting (100.0%), Construction (100.0%), and Wholesale Trade (100.0%), whereas the industries that tend to have a higher number of women are Information (100.0%), Professional & Scientific (100.0%), and Accommodation & Food Services (92.1%).
| Industry | Male | Female |
| Agriculture, Fishing & Hunting | 8 (100.0%) | 0 (0.0%) |
| Mining, Quarrying, & Extraction | 0 (0.0%) | 0 (0.0%) |
| Construction | 19 (100.0%) | 0 (0.0%) |
| Manufacturing | 107 (93.0%) | 8 (7.0%) |
| Wholesale Trade | 14 (100.0%) | 0 (0.0%) |
| Retail Trade | 69 (83.1%) | 14 (16.9%) |
| Transportation & Warehousing | 11 (78.6%) | 3 (21.4%) |
| Utilities | 24 (100.0%) | 0 (0.0%) |
| Information | 0 (0.0%) | 5 (100.0%) |
| Finance & Insurance | 0 (0.0%) | 0 (0.0%) |
| Real Estate, Rental & Leasing | 10 (55.6%) | 8 (44.4%) |
| Professional & Scientific | 0 (0.0%) | 7 (100.0%) |
| Enterprise Management | 0 (0.0%) | 0 (0.0%) |
| Administrative & Support | 0 (0.0%) | 0 (0.0%) |
| Educational Services | 20 (64.5%) | 11 (35.5%) |
| Health Care & Social Assistance | 26 (11.9%) | 192 (88.1%) |
| Arts, Entertainment & Recreation | 0 (0.0%) | 0 (0.0%) |
| Accommodation & Food Services | 3 (7.9%) | 35 (92.1%) |
| Public Administration | 17 (43.6%) | 22 (56.4%) |
| Total | 334 (50.4%) | 329 (49.6%) |
Education in Thayer
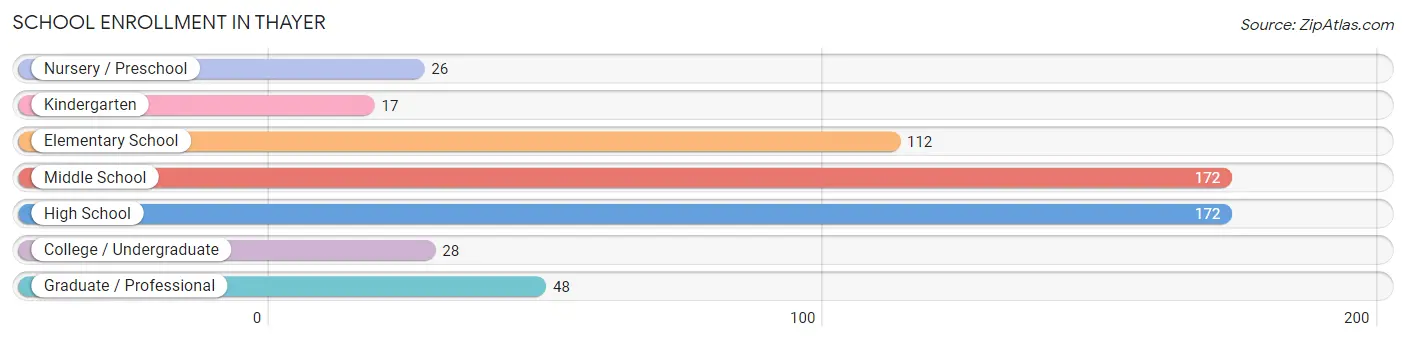
School Enrollment in Thayer
The most common levels of schooling among the 575 students in Thayer are middle school (172 | 29.9%), high school (172 | 29.9%), and elementary school (112 | 19.5%).
| School Level | # Students | % Students |
| Nursery / Preschool | 26 | 4.5% |
| Kindergarten | 17 | 3.0% |
| Elementary School | 112 | 19.5% |
| Middle School | 172 | 29.9% |
| High School | 172 | 29.9% |
| College / Undergraduate | 28 | 4.9% |
| Graduate / Professional | 48 | 8.4% |
| Total | 575 | 100.0% |
School Enrollment by Age by Funding Source in Thayer
Out of a total of 575 students who are enrolled in schools in Thayer, 18 (3.1%) attend a private institution, while the remaining 557 (96.9%) are enrolled in public schools. The age group of 10 to 14 year olds has the highest likelihood of being enrolled in private schools, with 14 (7.0% in the age bracket) enrolled. Conversely, the age group of 3 to 4 year olds has the lowest likelihood of being enrolled in a private school, with 26 (100.0% in the age bracket) attending a public institution.
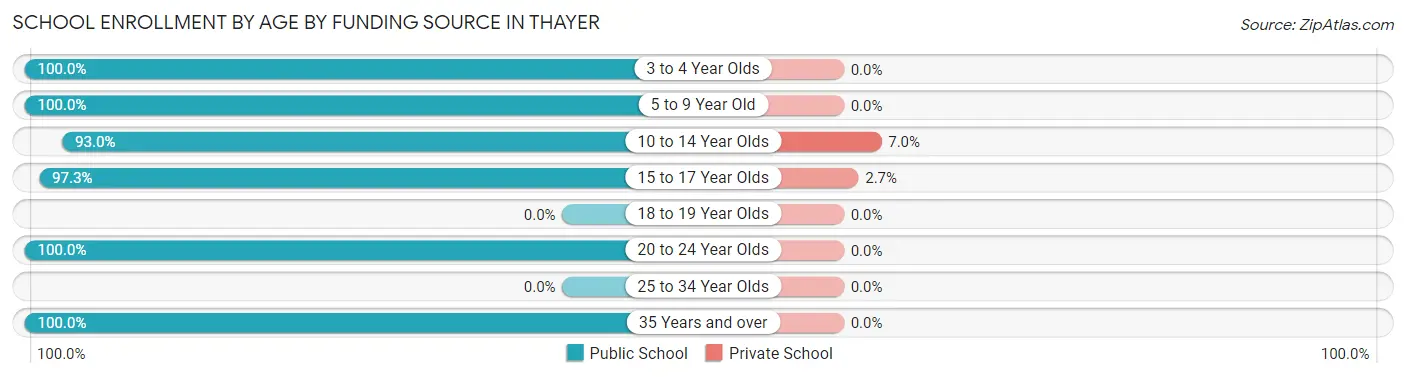
| Age Bracket | Public School | Private School |
| 3 to 4 Year Olds | 26 (100.0%) | 0 (0.0%) |
| 5 to 9 Year Old | 126 (100.0%) | 0 (0.0%) |
| 10 to 14 Year Olds | 186 (93.0%) | 14 (7.0%) |
| 15 to 17 Year Olds | 143 (97.3%) | 4 (2.7%) |
| 18 to 19 Year Olds | 0 (0.0%) | 0 (0.0%) |
| 20 to 24 Year Olds | 8 (100.0%) | 0 (0.0%) |
| 25 to 34 Year Olds | 0 (0.0%) | 0 (0.0%) |
| 35 Years and over | 68 (100.0%) | 0 (0.0%) |
| Total | 557 (96.9%) | 18 (3.1%) |
Educational Attainment by Field of Study in Thayer
Education (154 | 39.4%), psychology (57 | 14.6%), social sciences (57 | 14.6%), arts & humanities (33 | 8.4%), and business (26 | 6.7%) are the most common fields of study among 391 individuals in Thayer who have obtained a bachelor's degree or higher.
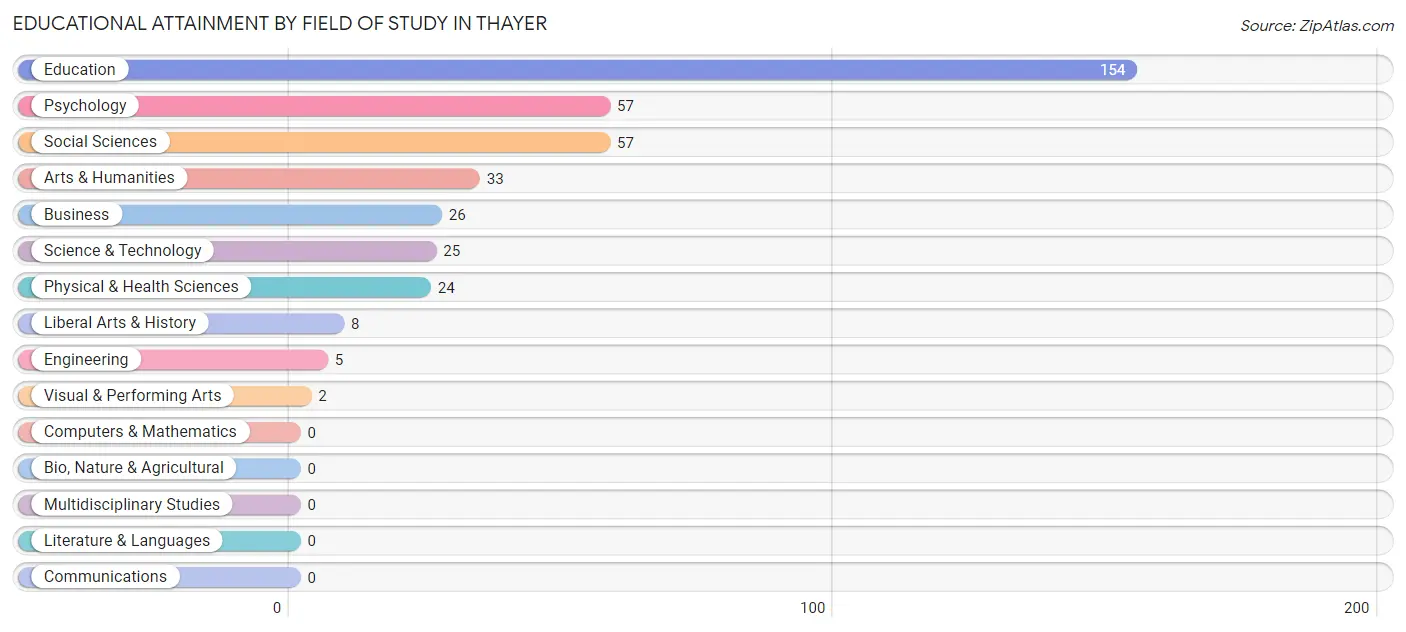
| Field of Study | # Graduates | % Graduates |
| Computers & Mathematics | 0 | 0.0% |
| Bio, Nature & Agricultural | 0 | 0.0% |
| Physical & Health Sciences | 24 | 6.1% |
| Psychology | 57 | 14.6% |
| Social Sciences | 57 | 14.6% |
| Engineering | 5 | 1.3% |
| Multidisciplinary Studies | 0 | 0.0% |
| Science & Technology | 25 | 6.4% |
| Business | 26 | 6.7% |
| Education | 154 | 39.4% |
| Literature & Languages | 0 | 0.0% |
| Liberal Arts & History | 8 | 2.1% |
| Visual & Performing Arts | 2 | 0.5% |
| Communications | 0 | 0.0% |
| Arts & Humanities | 33 | 8.4% |
| Total | 391 | 100.0% |
Transportation & Commute in Thayer
Vehicle Availability by Sex in Thayer
The most prevalent vehicle ownership categories in Thayer are males with 1 vehicle (114, accounting for 34.1%) and females with 1 vehicle (102, making up 34.6%).
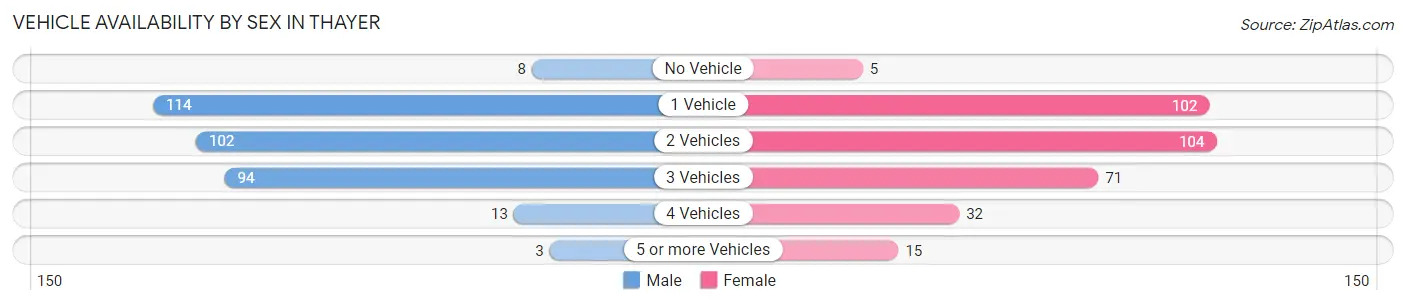
| Vehicles Available | Male | Female |
| No Vehicle | 8 (2.4%) | 5 (1.5%) |
| 1 Vehicle | 114 (34.1%) | 102 (31.0%) |
| 2 Vehicles | 102 (30.5%) | 104 (31.6%) |
| 3 Vehicles | 94 (28.1%) | 71 (21.6%) |
| 4 Vehicles | 13 (3.9%) | 32 (9.7%) |
| 5 or more Vehicles | 3 (0.9%) | 15 (4.6%) |
| Total | 334 (100.0%) | 329 (100.0%) |
Commute Time in Thayer
The most frequently occuring commute durations in Thayer are 5 to 9 minutes (235 commuters, 37.4%), 30 to 34 minutes (114 commuters, 18.1%), and 10 to 14 minutes (49 commuters, 7.8%).
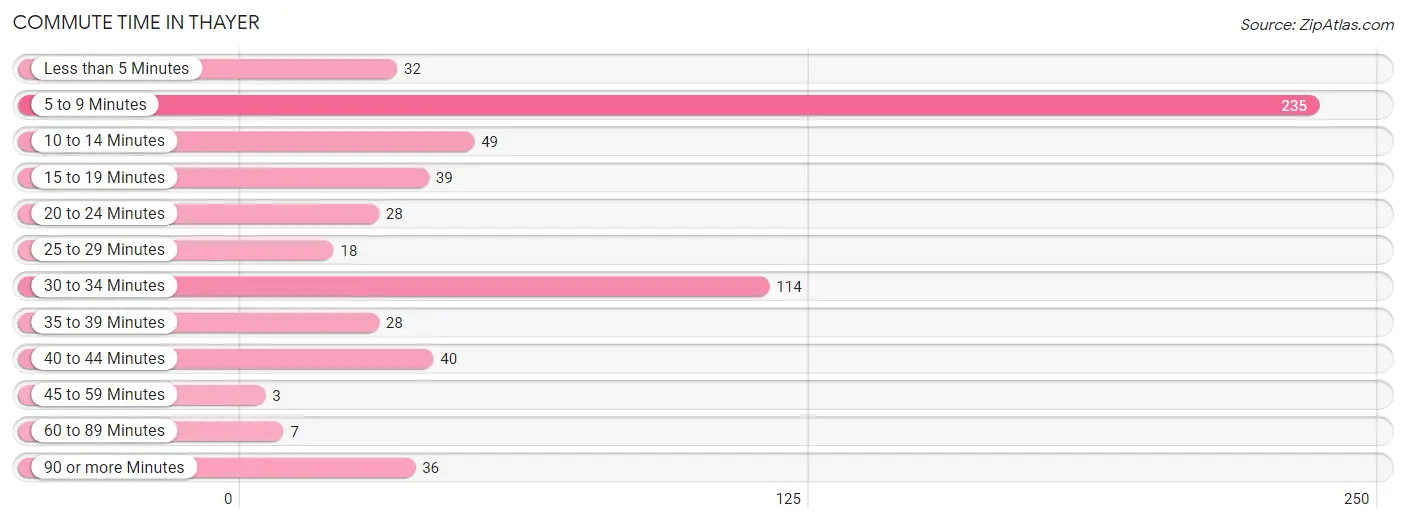
| Commute Time | # Commuters | % Commuters |
| Less than 5 Minutes | 32 | 5.1% |
| 5 to 9 Minutes | 235 | 37.4% |
| 10 to 14 Minutes | 49 | 7.8% |
| 15 to 19 Minutes | 39 | 6.2% |
| 20 to 24 Minutes | 28 | 4.4% |
| 25 to 29 Minutes | 18 | 2.9% |
| 30 to 34 Minutes | 114 | 18.1% |
| 35 to 39 Minutes | 28 | 4.4% |
| 40 to 44 Minutes | 40 | 6.4% |
| 45 to 59 Minutes | 3 | 0.5% |
| 60 to 89 Minutes | 7 | 1.1% |
| 90 or more Minutes | 36 | 5.7% |
Commute Time by Sex in Thayer
The most common commute times in Thayer are 5 to 9 minutes (104 commuters, 33.1%) for males and 5 to 9 minutes (131 commuters, 41.6%) for females.
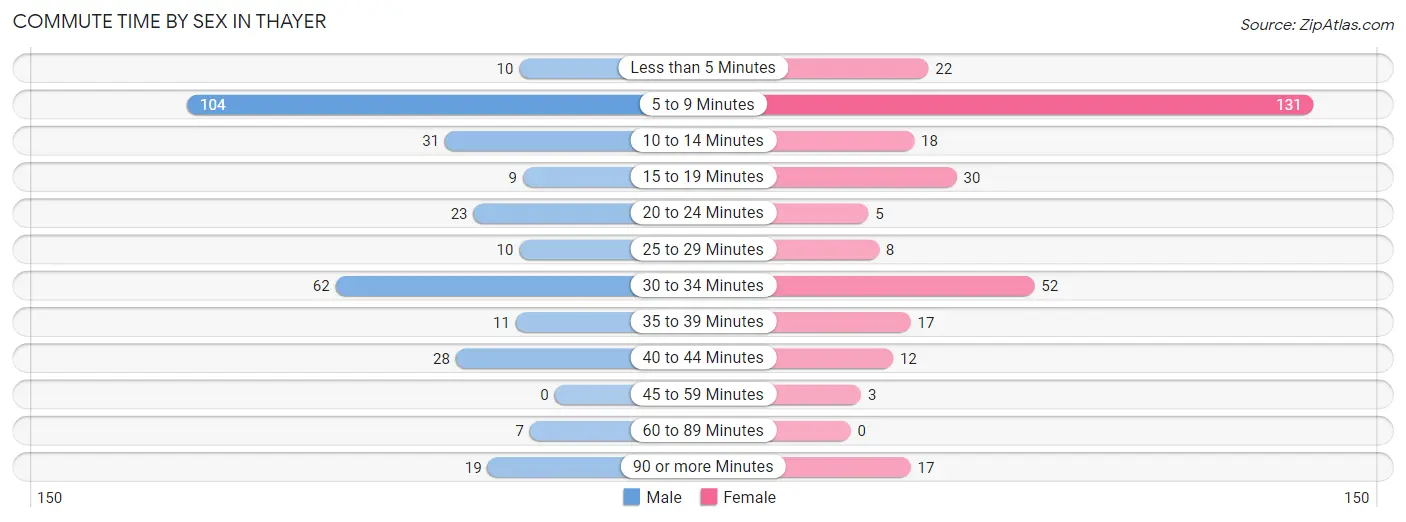
| Commute Time | Male | Female |
| Less than 5 Minutes | 10 (3.2%) | 22 (7.0%) |
| 5 to 9 Minutes | 104 (33.1%) | 131 (41.6%) |
| 10 to 14 Minutes | 31 (9.9%) | 18 (5.7%) |
| 15 to 19 Minutes | 9 (2.9%) | 30 (9.5%) |
| 20 to 24 Minutes | 23 (7.3%) | 5 (1.6%) |
| 25 to 29 Minutes | 10 (3.2%) | 8 (2.5%) |
| 30 to 34 Minutes | 62 (19.8%) | 52 (16.5%) |
| 35 to 39 Minutes | 11 (3.5%) | 17 (5.4%) |
| 40 to 44 Minutes | 28 (8.9%) | 12 (3.8%) |
| 45 to 59 Minutes | 0 (0.0%) | 3 (0.9%) |
| 60 to 89 Minutes | 7 (2.2%) | 0 (0.0%) |
| 90 or more Minutes | 19 (6.0%) | 17 (5.4%) |
Time of Departure to Work by Sex in Thayer
The most frequent times of departure to work in Thayer are 12:00 AM to 4:59 AM (85, 27.1%) for males and 7:30 AM to 7:59 AM (81, 25.7%) for females.
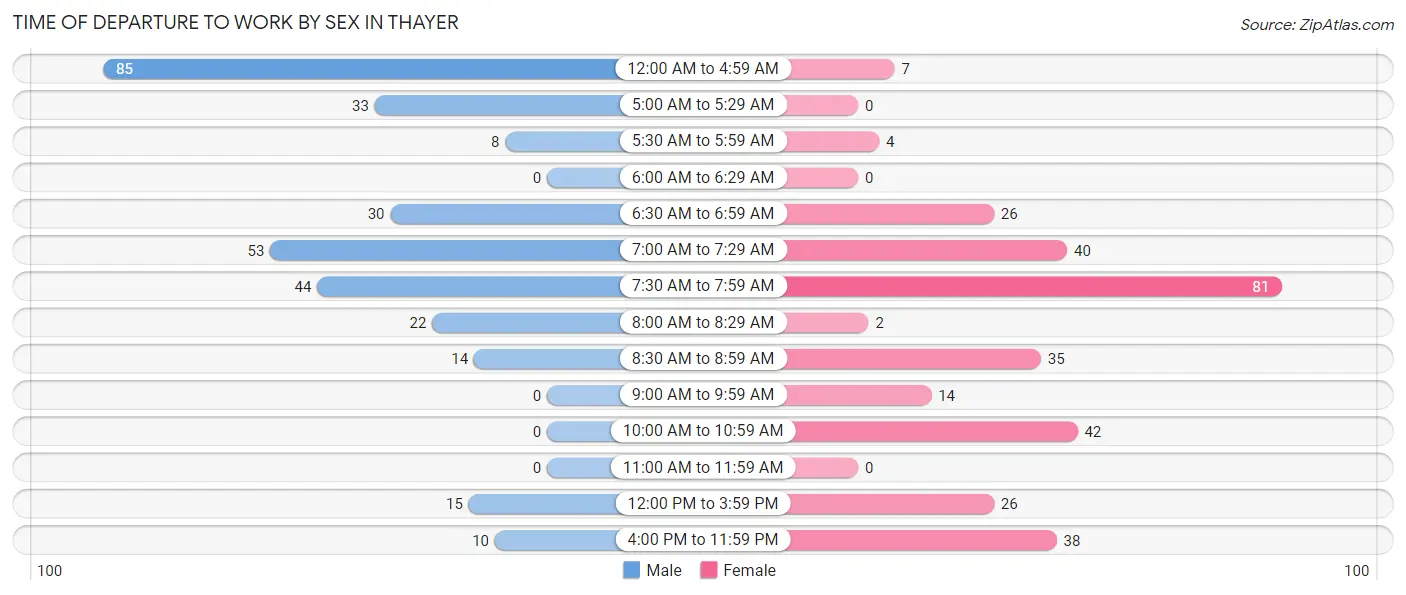
| Time of Departure | Male | Female |
| 12:00 AM to 4:59 AM | 85 (27.1%) | 7 (2.2%) |
| 5:00 AM to 5:29 AM | 33 (10.5%) | 0 (0.0%) |
| 5:30 AM to 5:59 AM | 8 (2.5%) | 4 (1.3%) |
| 6:00 AM to 6:29 AM | 0 (0.0%) | 0 (0.0%) |
| 6:30 AM to 6:59 AM | 30 (9.6%) | 26 (8.3%) |
| 7:00 AM to 7:29 AM | 53 (16.9%) | 40 (12.7%) |
| 7:30 AM to 7:59 AM | 44 (14.0%) | 81 (25.7%) |
| 8:00 AM to 8:29 AM | 22 (7.0%) | 2 (0.6%) |
| 8:30 AM to 8:59 AM | 14 (4.5%) | 35 (11.1%) |
| 9:00 AM to 9:59 AM | 0 (0.0%) | 14 (4.4%) |
| 10:00 AM to 10:59 AM | 0 (0.0%) | 42 (13.3%) |
| 11:00 AM to 11:59 AM | 0 (0.0%) | 0 (0.0%) |
| 12:00 PM to 3:59 PM | 15 (4.8%) | 26 (8.3%) |
| 4:00 PM to 11:59 PM | 10 (3.2%) | 38 (12.1%) |
| Total | 314 (100.0%) | 315 (100.0%) |
Housing Occupancy in Thayer
Occupancy by Ownership in Thayer
Of the total 794 dwellings in Thayer, owner-occupied units account for 482 (60.7%), while renter-occupied units make up 312 (39.3%).
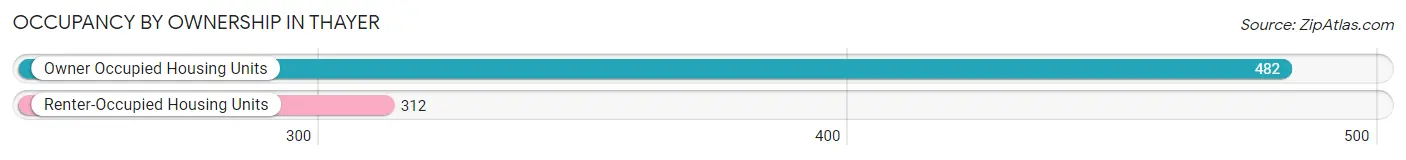
| Occupancy | # Housing Units | % Housing Units |
| Owner Occupied Housing Units | 482 | 60.7% |
| Renter-Occupied Housing Units | 312 | 39.3% |
| Total Occupied Housing Units | 794 | 100.0% |
Occupancy by Household Size in Thayer
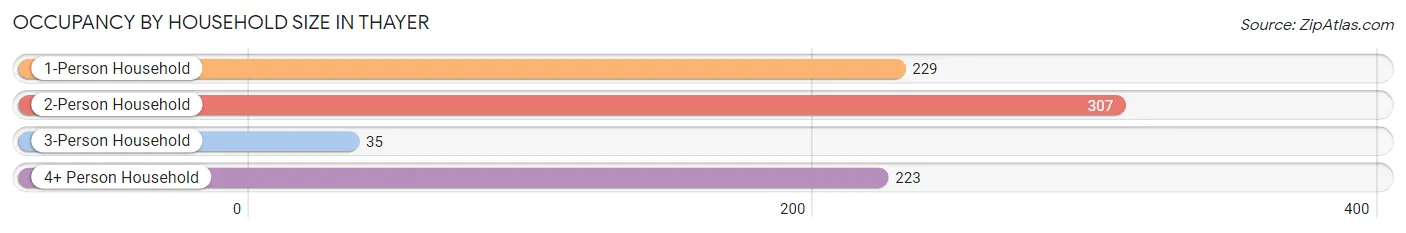
| Household Size | # Housing Units | % Housing Units |
| 1-Person Household | 229 | 28.8% |
| 2-Person Household | 307 | 38.7% |
| 3-Person Household | 35 | 4.4% |
| 4+ Person Household | 223 | 28.1% |
| Total Housing Units | 794 | 100.0% |
Occupancy by Ownership by Household Size in Thayer
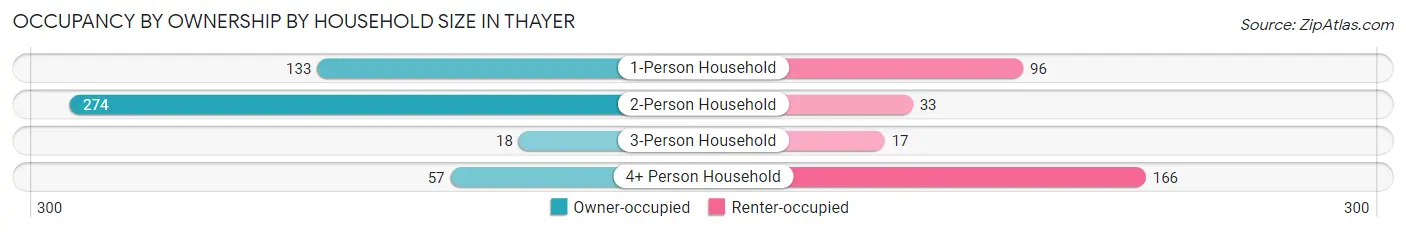
| Household Size | Owner-occupied | Renter-occupied |
| 1-Person Household | 133 (58.1%) | 96 (41.9%) |
| 2-Person Household | 274 (89.2%) | 33 (10.7%) |
| 3-Person Household | 18 (51.4%) | 17 (48.6%) |
| 4+ Person Household | 57 (25.6%) | 166 (74.4%) |
| Total Housing Units | 482 (60.7%) | 312 (39.3%) |
Occupancy by Educational Attainment in Thayer
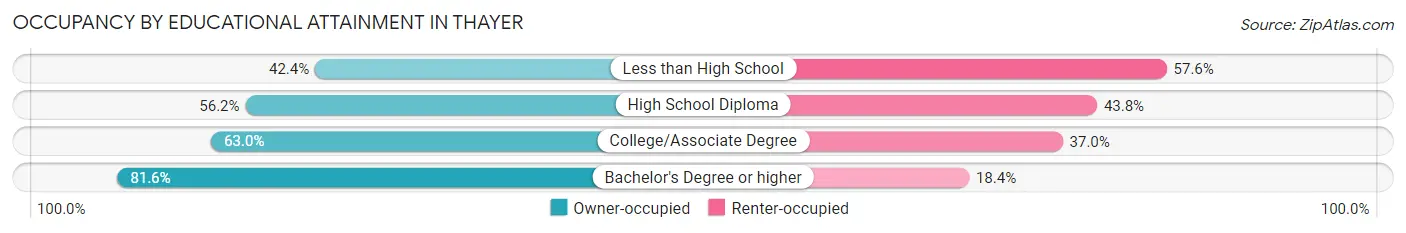
| Household Size | Owner-occupied | Renter-occupied |
| Less than High School | 42 (42.4%) | 57 (57.6%) |
| High School Diploma | 176 (56.2%) | 137 (43.8%) |
| College/Associate Degree | 162 (63.0%) | 95 (37.0%) |
| Bachelor's Degree or higher | 102 (81.6%) | 23 (18.4%) |
Occupancy by Age of Householder in Thayer
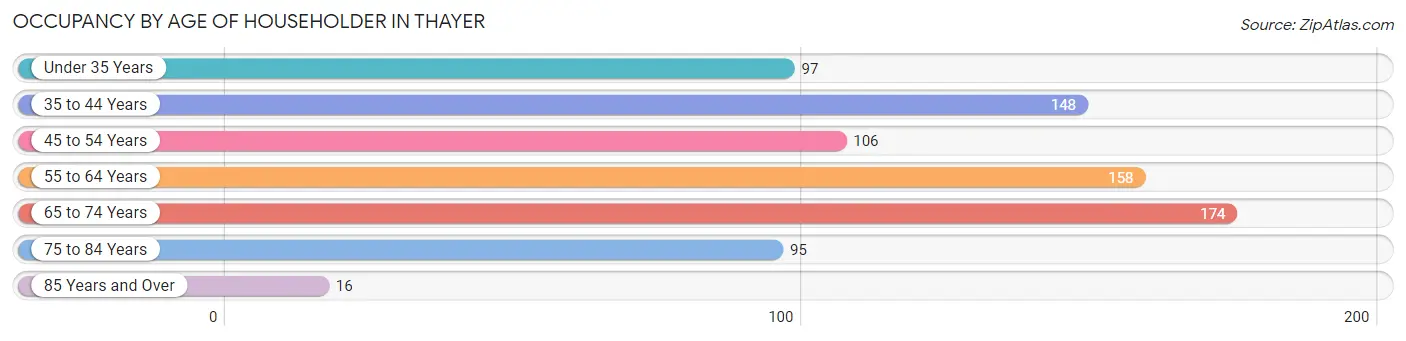
| Age Bracket | # Households | % Households |
| Under 35 Years | 97 | 12.2% |
| 35 to 44 Years | 148 | 18.6% |
| 45 to 54 Years | 106 | 13.4% |
| 55 to 64 Years | 158 | 19.9% |
| 65 to 74 Years | 174 | 21.9% |
| 75 to 84 Years | 95 | 12.0% |
| 85 Years and Over | 16 | 2.0% |
| Total | 794 | 100.0% |
Housing Finances in Thayer
Median Income by Occupancy in Thayer
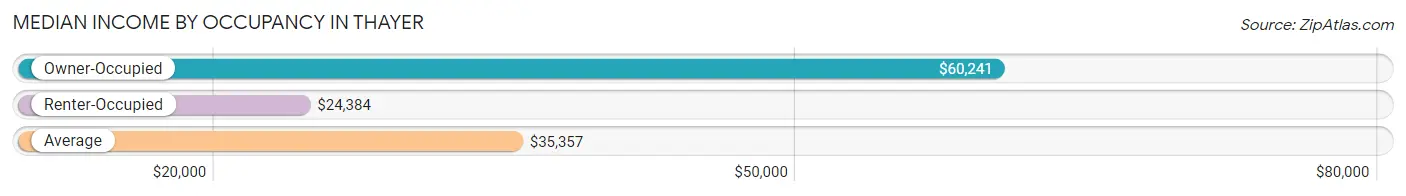
| Occupancy Type | # Households | Median Income |
| Owner-Occupied | 482 (60.7%) | $60,241 |
| Renter-Occupied | 312 (39.3%) | $24,384 |
| Average | 794 (100.0%) | $35,357 |
Occupancy by Householder Income Bracket in Thayer
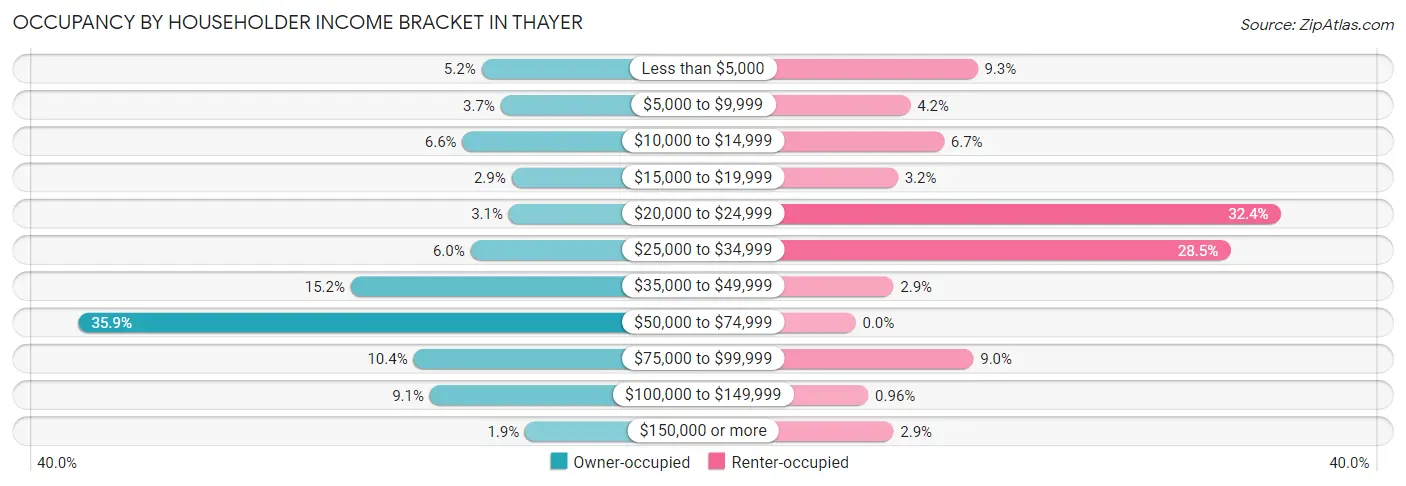
| Income Bracket | Owner-occupied | Renter-occupied |
| Less than $5,000 | 25 (5.2%) | 29 (9.3%) |
| $5,000 to $9,999 | 18 (3.7%) | 13 (4.2%) |
| $10,000 to $14,999 | 32 (6.6%) | 21 (6.7%) |
| $15,000 to $19,999 | 14 (2.9%) | 10 (3.2%) |
| $20,000 to $24,999 | 15 (3.1%) | 101 (32.4%) |
| $25,000 to $34,999 | 29 (6.0%) | 89 (28.5%) |
| $35,000 to $49,999 | 73 (15.1%) | 9 (2.9%) |
| $50,000 to $74,999 | 173 (35.9%) | 0 (0.0%) |
| $75,000 to $99,999 | 50 (10.4%) | 28 (9.0%) |
| $100,000 to $149,999 | 44 (9.1%) | 3 (1.0%) |
| $150,000 or more | 9 (1.9%) | 9 (2.9%) |
| Total | 482 (100.0%) | 312 (100.0%) |
Monthly Housing Cost Tiers in Thayer
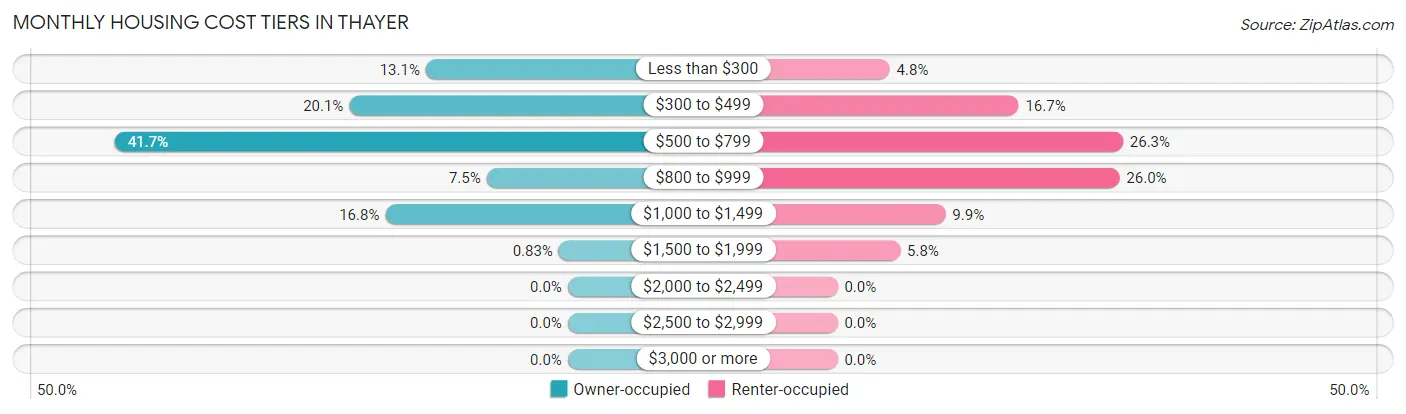
| Monthly Cost | Owner-occupied | Renter-occupied |
| Less than $300 | 63 (13.1%) | 15 (4.8%) |
| $300 to $499 | 97 (20.1%) | 52 (16.7%) |
| $500 to $799 | 201 (41.7%) | 82 (26.3%) |
| $800 to $999 | 36 (7.5%) | 81 (26.0%) |
| $1,000 to $1,499 | 81 (16.8%) | 31 (9.9%) |
| $1,500 to $1,999 | 4 (0.8%) | 18 (5.8%) |
| $2,000 to $2,499 | 0 (0.0%) | 0 (0.0%) |
| $2,500 to $2,999 | 0 (0.0%) | 0 (0.0%) |
| $3,000 or more | 0 (0.0%) | 0 (0.0%) |
| Total | 482 (100.0%) | 312 (100.0%) |
Physical Housing Characteristics in Thayer
Housing Structures in Thayer
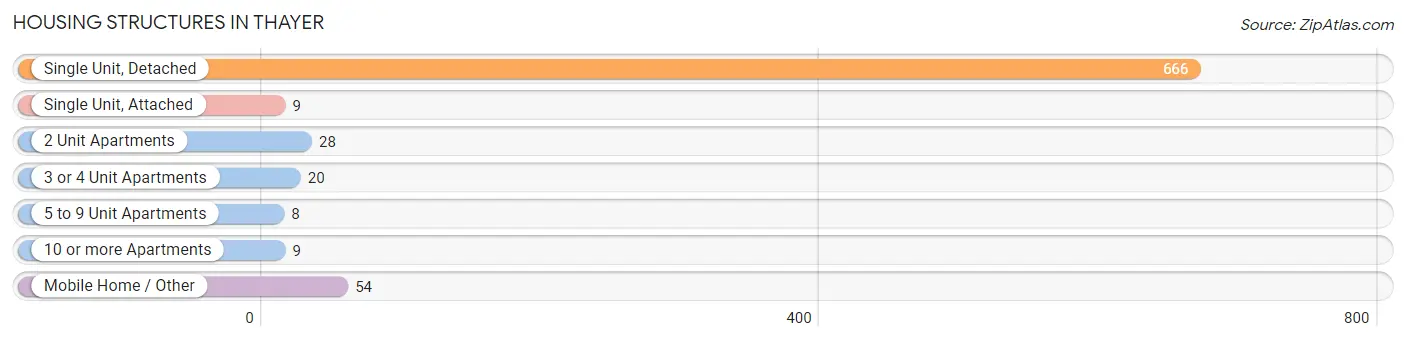
| Structure Type | # Housing Units | % Housing Units |
| Single Unit, Detached | 666 | 83.9% |
| Single Unit, Attached | 9 | 1.1% |
| 2 Unit Apartments | 28 | 3.5% |
| 3 or 4 Unit Apartments | 20 | 2.5% |
| 5 to 9 Unit Apartments | 8 | 1.0% |
| 10 or more Apartments | 9 | 1.1% |
| Mobile Home / Other | 54 | 6.8% |
| Total | 794 | 100.0% |
Housing Structures by Occupancy in Thayer
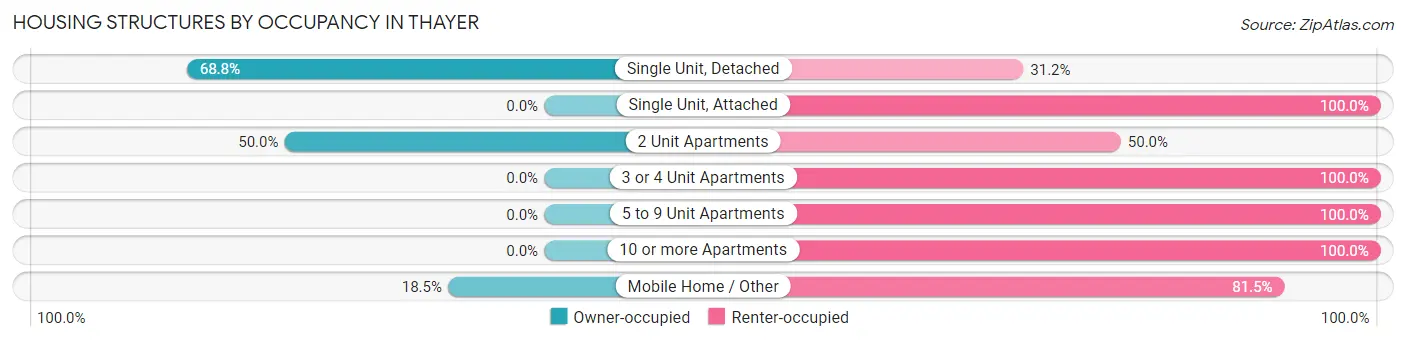
| Structure Type | Owner-occupied | Renter-occupied |
| Single Unit, Detached | 458 (68.8%) | 208 (31.2%) |
| Single Unit, Attached | 0 (0.0%) | 9 (100.0%) |
| 2 Unit Apartments | 14 (50.0%) | 14 (50.0%) |
| 3 or 4 Unit Apartments | 0 (0.0%) | 20 (100.0%) |
| 5 to 9 Unit Apartments | 0 (0.0%) | 8 (100.0%) |
| 10 or more Apartments | 0 (0.0%) | 9 (100.0%) |
| Mobile Home / Other | 10 (18.5%) | 44 (81.5%) |
| Total | 482 (60.7%) | 312 (39.3%) |
Housing Structures by Number of Rooms in Thayer
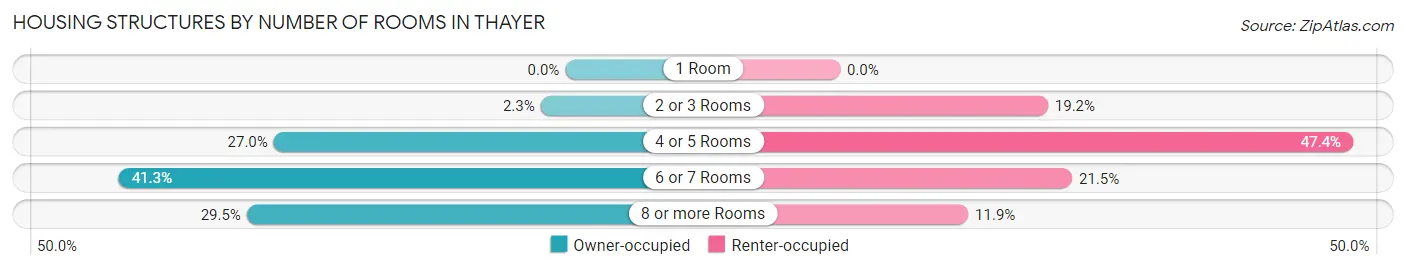
| Number of Rooms | Owner-occupied | Renter-occupied |
| 1 Room | 0 (0.0%) | 0 (0.0%) |
| 2 or 3 Rooms | 11 (2.3%) | 60 (19.2%) |
| 4 or 5 Rooms | 130 (27.0%) | 148 (47.4%) |
| 6 or 7 Rooms | 199 (41.3%) | 67 (21.5%) |
| 8 or more Rooms | 142 (29.5%) | 37 (11.9%) |
| Total | 482 (100.0%) | 312 (100.0%) |
Housing Structure by Heating Type in Thayer
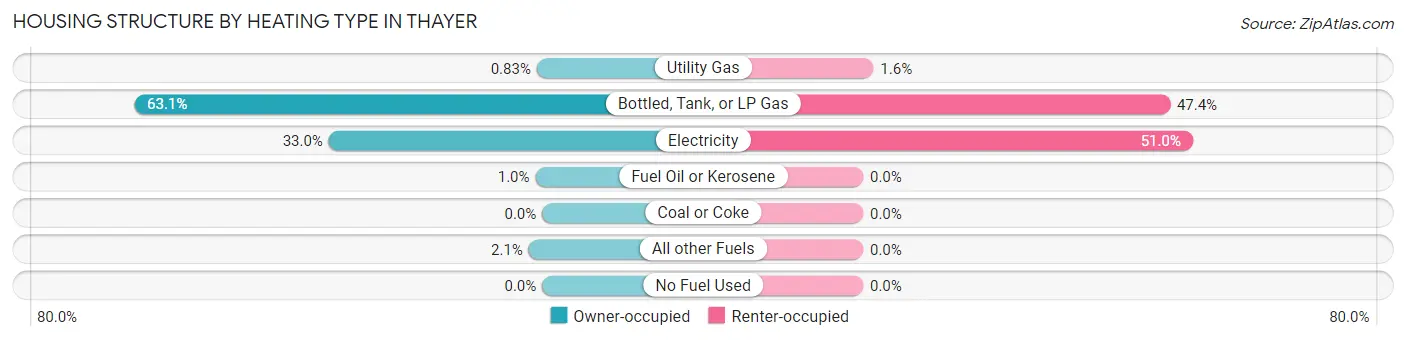
| Heating Type | Owner-occupied | Renter-occupied |
| Utility Gas | 4 (0.8%) | 5 (1.6%) |
| Bottled, Tank, or LP Gas | 304 (63.1%) | 148 (47.4%) |
| Electricity | 159 (33.0%) | 159 (51.0%) |
| Fuel Oil or Kerosene | 5 (1.0%) | 0 (0.0%) |
| Coal or Coke | 0 (0.0%) | 0 (0.0%) |
| All other Fuels | 10 (2.1%) | 0 (0.0%) |
| No Fuel Used | 0 (0.0%) | 0 (0.0%) |
| Total | 482 (100.0%) | 312 (100.0%) |
Household Vehicle Usage in Thayer
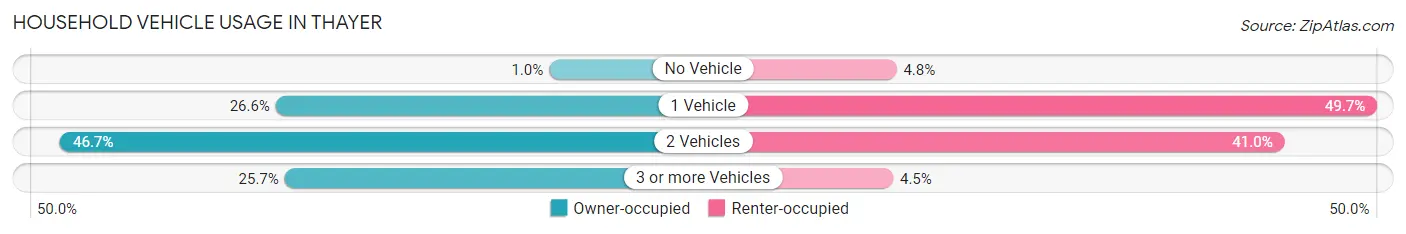
| Vehicles per Household | Owner-occupied | Renter-occupied |
| No Vehicle | 5 (1.0%) | 15 (4.8%) |
| 1 Vehicle | 128 (26.6%) | 155 (49.7%) |
| 2 Vehicles | 225 (46.7%) | 128 (41.0%) |
| 3 or more Vehicles | 124 (25.7%) | 14 (4.5%) |
| Total | 482 (100.0%) | 312 (100.0%) |
Real Estate & Mortgages in Thayer
Real Estate and Mortgage Overview in Thayer
| Characteristic | Without Mortgage | With Mortgage |
| Housing Units | 298 | 184 |
| Median Property Value | $69,400 | $95,000 |
| Median Household Income | $50,278 | $7 |
| Monthly Housing Costs | $479 | $0 |
| Real Estate Taxes | $473 | $14 |
Property Value by Mortgage Status in Thayer
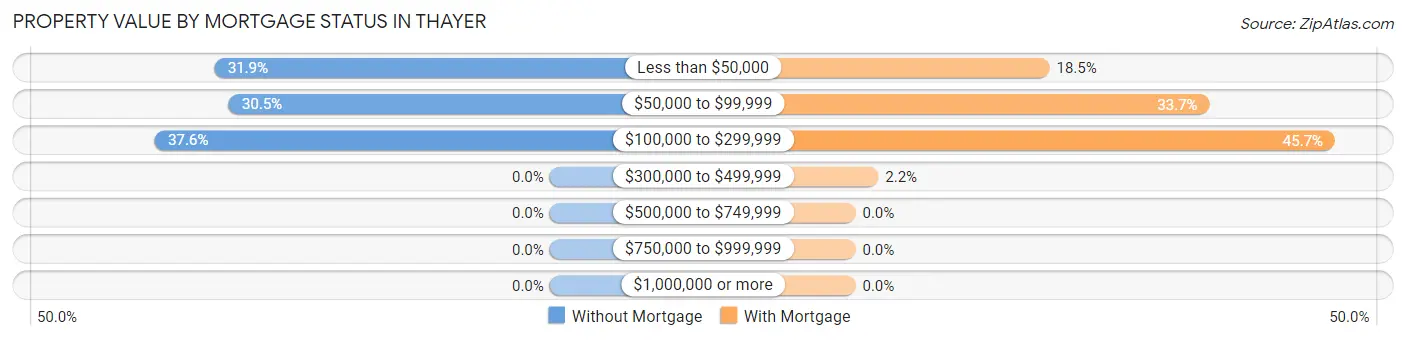
| Property Value | Without Mortgage | With Mortgage |
| Less than $50,000 | 95 (31.9%) | 34 (18.5%) |
| $50,000 to $99,999 | 91 (30.5%) | 62 (33.7%) |
| $100,000 to $299,999 | 112 (37.6%) | 84 (45.7%) |
| $300,000 to $499,999 | 0 (0.0%) | 4 (2.2%) |
| $500,000 to $749,999 | 0 (0.0%) | 0 (0.0%) |
| $750,000 to $999,999 | 0 (0.0%) | 0 (0.0%) |
| $1,000,000 or more | 0 (0.0%) | 0 (0.0%) |
| Total | 298 (100.0%) | 184 (100.0%) |
Household Income by Mortgage Status in Thayer
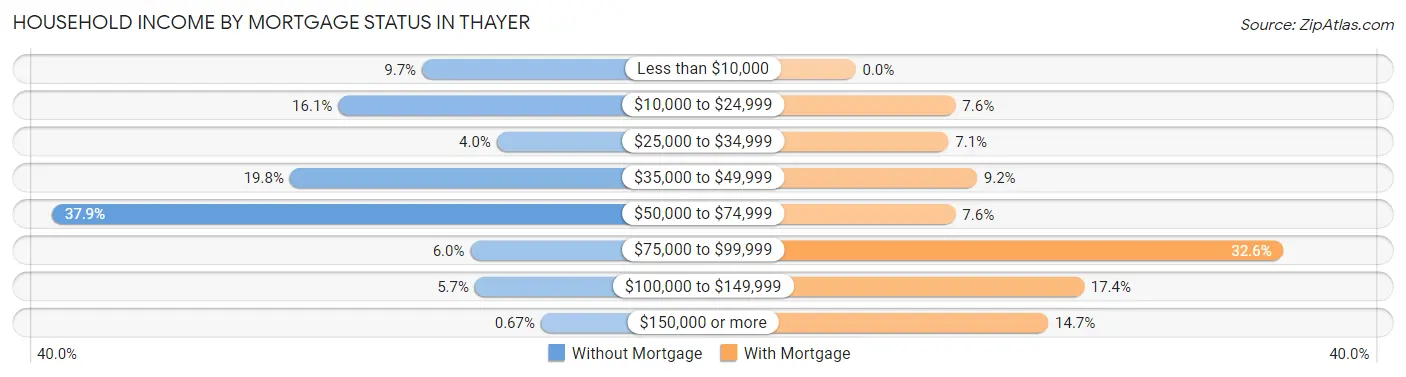
| Household Income | Without Mortgage | With Mortgage |
| Less than $10,000 | 29 (9.7%) | 0 (0.0%) |
| $10,000 to $24,999 | 48 (16.1%) | 14 (7.6%) |
| $25,000 to $34,999 | 12 (4.0%) | 13 (7.1%) |
| $35,000 to $49,999 | 59 (19.8%) | 17 (9.2%) |
| $50,000 to $74,999 | 113 (37.9%) | 14 (7.6%) |
| $75,000 to $99,999 | 18 (6.0%) | 60 (32.6%) |
| $100,000 to $149,999 | 17 (5.7%) | 32 (17.4%) |
| $150,000 or more | 2 (0.7%) | 27 (14.7%) |
| Total | 298 (100.0%) | 184 (100.0%) |
Property Value to Household Income Ratio in Thayer
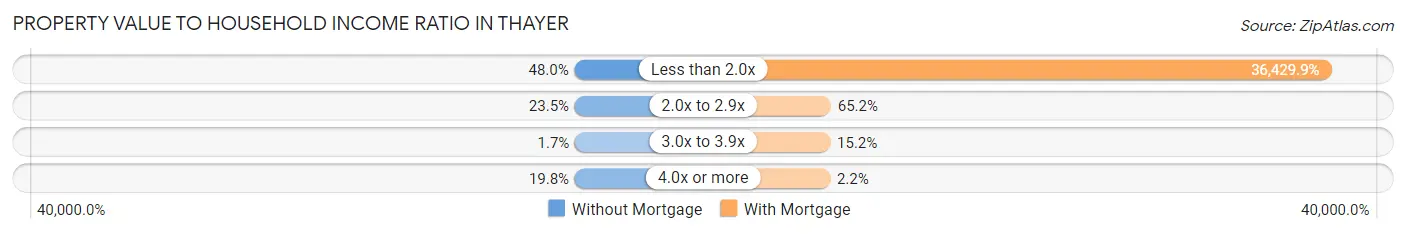
| Value-to-Income Ratio | Without Mortgage | With Mortgage |
| Less than 2.0x | 143 (48.0%) | 67,031 (36,429.9%) |
| 2.0x to 2.9x | 70 (23.5%) | 120 (65.2%) |
| 3.0x to 3.9x | 5 (1.7%) | 28 (15.2%) |
| 4.0x or more | 59 (19.8%) | 4 (2.2%) |
| Total | 298 (100.0%) | 184 (100.0%) |
Real Estate Taxes by Mortgage Status in Thayer
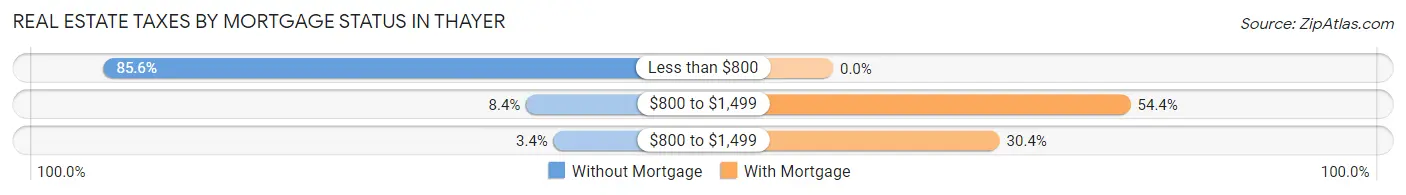
| Property Taxes | Without Mortgage | With Mortgage |
| Less than $800 | 255 (85.6%) | 0 (0.0%) |
| $800 to $1,499 | 25 (8.4%) | 100 (54.3%) |
| $800 to $1,499 | 10 (3.4%) | 56 (30.4%) |
| Total | 298 (100.0%) | 184 (100.0%) |
Health & Disability in Thayer
Health Insurance Coverage by Age in Thayer
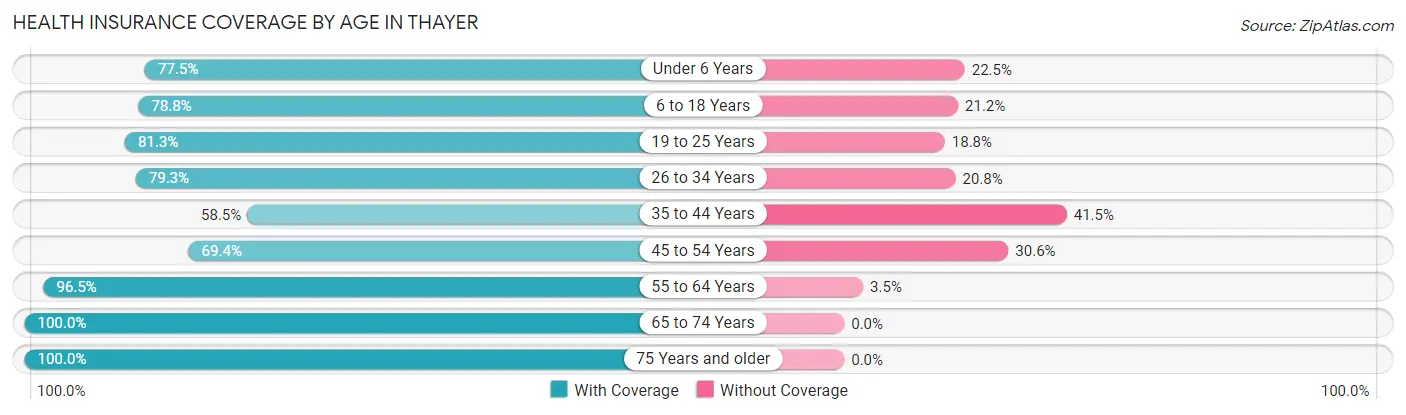
| Age Bracket | With Coverage | Without Coverage |
| Under 6 Years | 69 (77.5%) | 20 (22.5%) |
| 6 to 18 Years | 423 (78.8%) | 114 (21.2%) |
| 19 to 25 Years | 52 (81.2%) | 12 (18.8%) |
| 26 to 34 Years | 84 (79.2%) | 22 (20.7%) |
| 35 to 44 Years | 251 (58.5%) | 178 (41.5%) |
| 45 to 54 Years | 93 (69.4%) | 41 (30.6%) |
| 55 to 64 Years | 219 (96.5%) | 8 (3.5%) |
| 65 to 74 Years | 298 (100.0%) | 0 (0.0%) |
| 75 Years and older | 160 (100.0%) | 0 (0.0%) |
| Total | 1,649 (80.7%) | 395 (19.3%) |
Health Insurance Coverage by Citizenship Status in Thayer
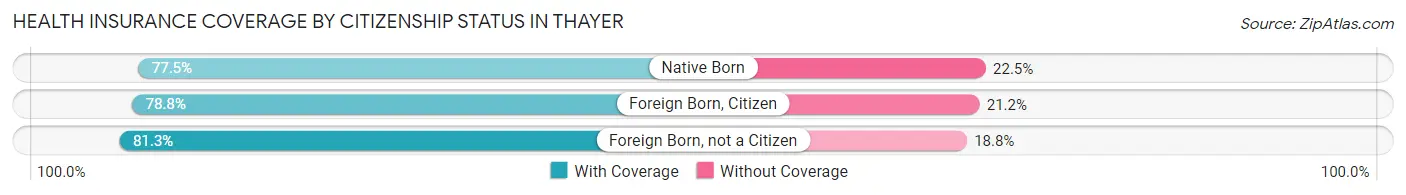
| Citizenship Status | With Coverage | Without Coverage |
| Native Born | 69 (77.5%) | 20 (22.5%) |
| Foreign Born, Citizen | 423 (78.8%) | 114 (21.2%) |
| Foreign Born, not a Citizen | 52 (81.2%) | 12 (18.8%) |
Health Insurance Coverage by Household Income in Thayer
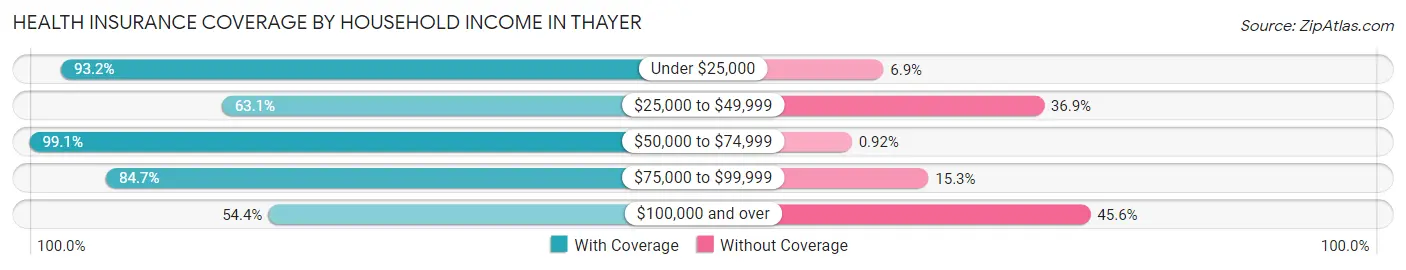
| Household Income | With Coverage | Without Coverage |
| Under $25,000 | 544 (93.1%) | 40 (6.9%) |
| $25,000 to $49,999 | 316 (63.1%) | 185 (36.9%) |
| $50,000 to $74,999 | 431 (99.1%) | 4 (0.9%) |
| $75,000 to $99,999 | 194 (84.7%) | 35 (15.3%) |
| $100,000 and over | 156 (54.4%) | 131 (45.6%) |
Public vs Private Health Insurance Coverage by Age in Thayer
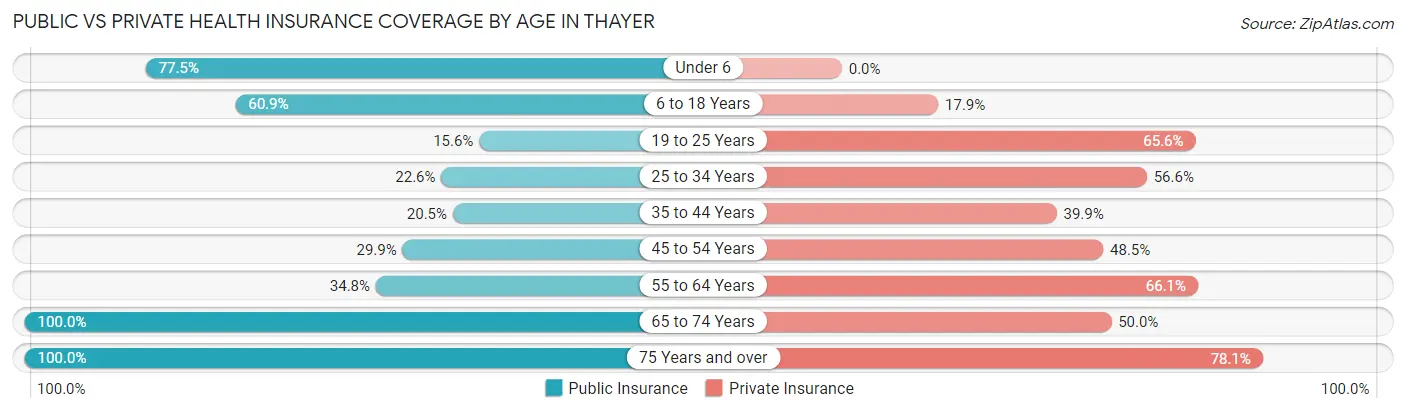
| Age Bracket | Public Insurance | Private Insurance |
| Under 6 | 69 (77.5%) | 0 (0.0%) |
| 6 to 18 Years | 327 (60.9%) | 96 (17.9%) |
| 19 to 25 Years | 10 (15.6%) | 42 (65.6%) |
| 25 to 34 Years | 24 (22.6%) | 60 (56.6%) |
| 35 to 44 Years | 88 (20.5%) | 171 (39.9%) |
| 45 to 54 Years | 40 (29.8%) | 65 (48.5%) |
| 55 to 64 Years | 79 (34.8%) | 150 (66.1%) |
| 65 to 74 Years | 298 (100.0%) | 149 (50.0%) |
| 75 Years and over | 160 (100.0%) | 125 (78.1%) |
| Total | 1,095 (53.6%) | 858 (42.0%) |
Disability Status by Sex by Age in Thayer
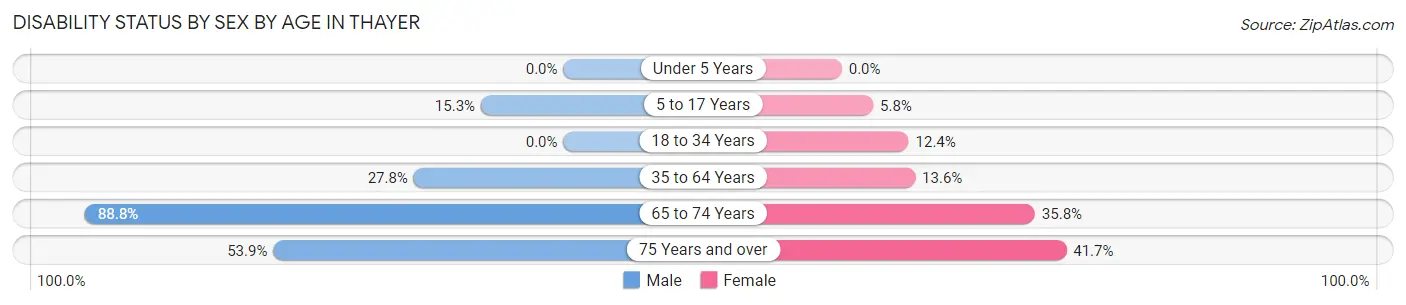
| Age Bracket | Male | Female |
| Under 5 Years | 0 (0.0%) | 0 (0.0%) |
| 5 to 17 Years | 43 (15.3%) | 14 (5.8%) |
| 18 to 34 Years | 0 (0.0%) | 16 (12.4%) |
| 35 to 64 Years | 95 (27.8%) | 61 (13.6%) |
| 65 to 74 Years | 111 (88.8%) | 62 (35.8%) |
| 75 Years and over | 28 (53.8%) | 45 (41.7%) |
Disability Class by Sex by Age in Thayer
Disability Class: Hearing Difficulty
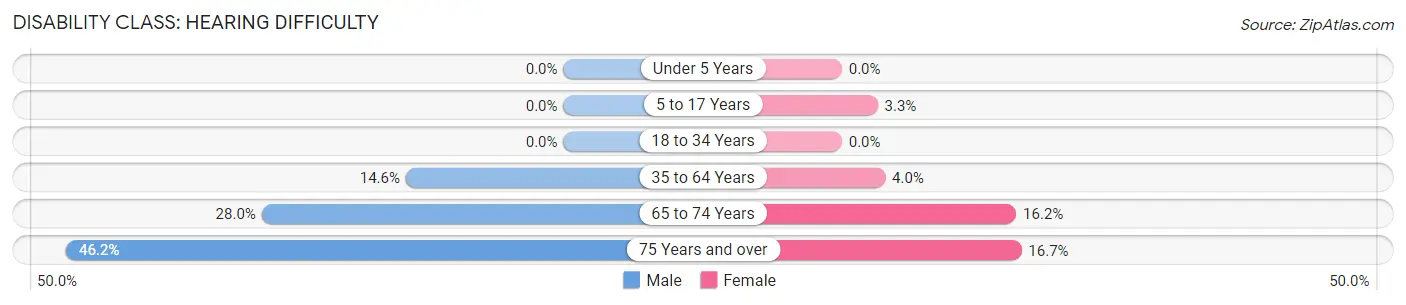
| Age Bracket | Male | Female |
| Under 5 Years | 0 (0.0%) | 0 (0.0%) |
| 5 to 17 Years | 0 (0.0%) | 8 (3.3%) |
| 18 to 34 Years | 0 (0.0%) | 0 (0.0%) |
| 35 to 64 Years | 50 (14.6%) | 18 (4.0%) |
| 65 to 74 Years | 35 (28.0%) | 28 (16.2%) |
| 75 Years and over | 24 (46.2%) | 18 (16.7%) |
Disability Class: Vision Difficulty
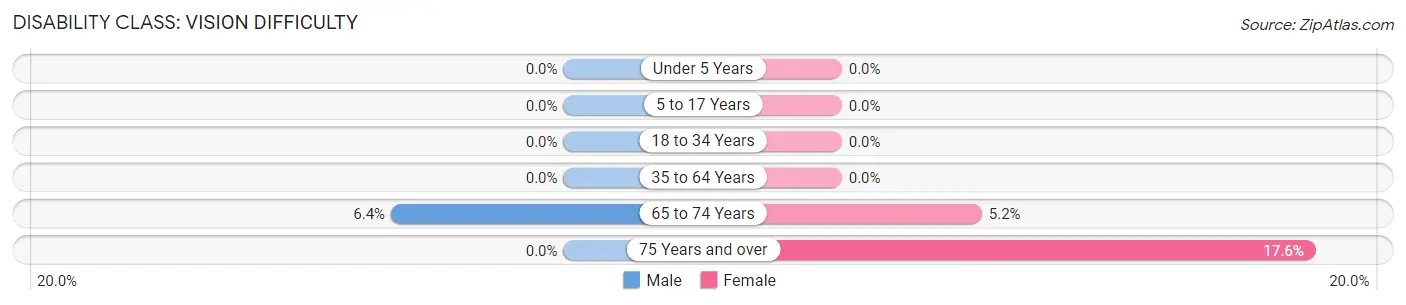
| Age Bracket | Male | Female |
| Under 5 Years | 0 (0.0%) | 0 (0.0%) |
| 5 to 17 Years | 0 (0.0%) | 0 (0.0%) |
| 18 to 34 Years | 0 (0.0%) | 0 (0.0%) |
| 35 to 64 Years | 0 (0.0%) | 0 (0.0%) |
| 65 to 74 Years | 8 (6.4%) | 9 (5.2%) |
| 75 Years and over | 0 (0.0%) | 19 (17.6%) |
Disability Class: Cognitive Difficulty
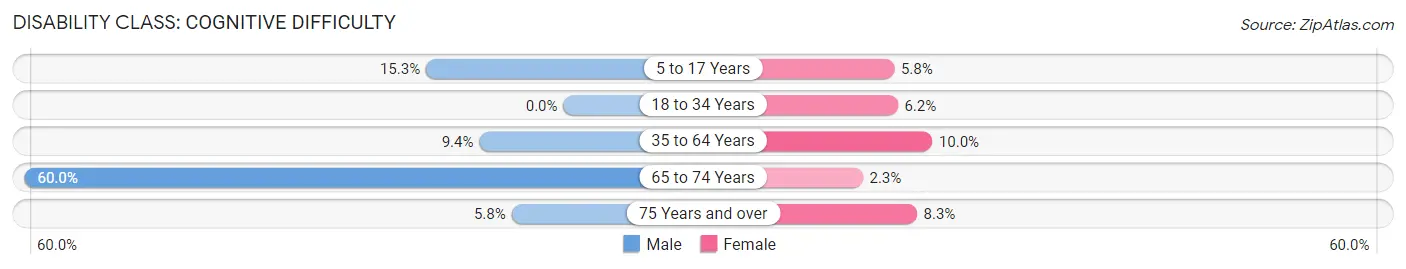
| Age Bracket | Male | Female |
| 5 to 17 Years | 43 (15.3%) | 14 (5.8%) |
| 18 to 34 Years | 0 (0.0%) | 8 (6.2%) |
| 35 to 64 Years | 32 (9.4%) | 45 (10.0%) |
| 65 to 74 Years | 75 (60.0%) | 4 (2.3%) |
| 75 Years and over | 3 (5.8%) | 9 (8.3%) |
Disability Class: Ambulatory Difficulty
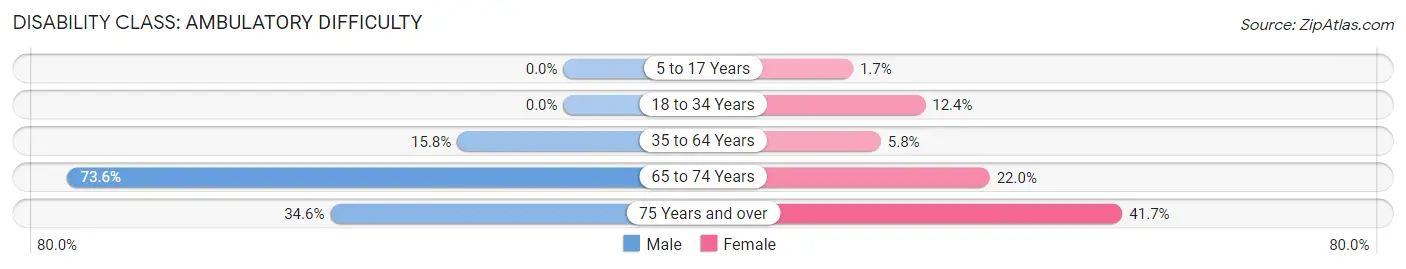
| Age Bracket | Male | Female |
| 5 to 17 Years | 0 (0.0%) | 4 (1.7%) |
| 18 to 34 Years | 0 (0.0%) | 16 (12.4%) |
| 35 to 64 Years | 54 (15.8%) | 26 (5.8%) |
| 65 to 74 Years | 92 (73.6%) | 38 (22.0%) |
| 75 Years and over | 18 (34.6%) | 45 (41.7%) |
Disability Class: Self-Care Difficulty
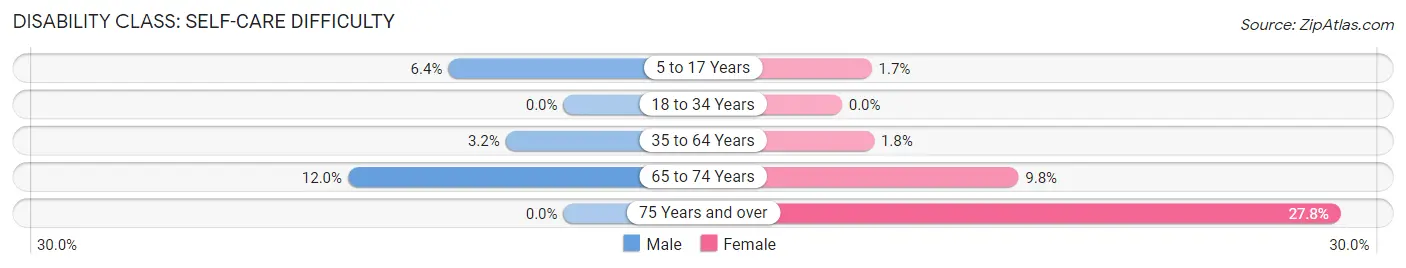
| Age Bracket | Male | Female |
| 5 to 17 Years | 18 (6.4%) | 4 (1.7%) |
| 18 to 34 Years | 0 (0.0%) | 0 (0.0%) |
| 35 to 64 Years | 11 (3.2%) | 8 (1.8%) |
| 65 to 74 Years | 15 (12.0%) | 17 (9.8%) |
| 75 Years and over | 0 (0.0%) | 30 (27.8%) |
Technology Access in Thayer
Computing Device Access in Thayer
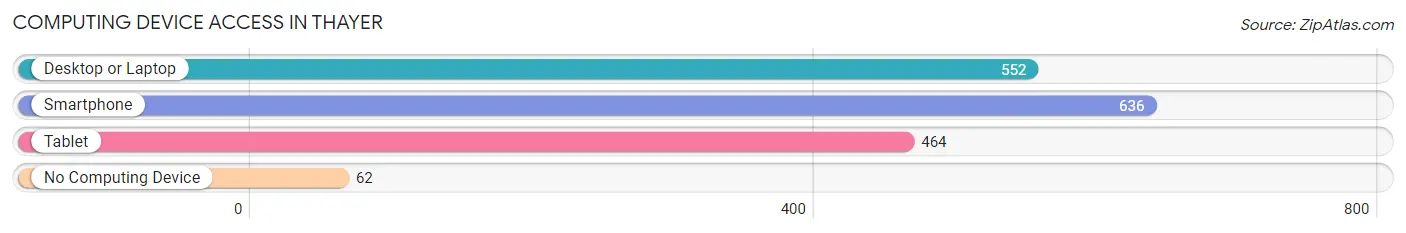
| Device Type | # Households | % Households |
| Desktop or Laptop | 552 | 69.5% |
| Smartphone | 636 | 80.1% |
| Tablet | 464 | 58.4% |
| No Computing Device | 62 | 7.8% |
| Total | 794 | 100.0% |
Internet Access in Thayer
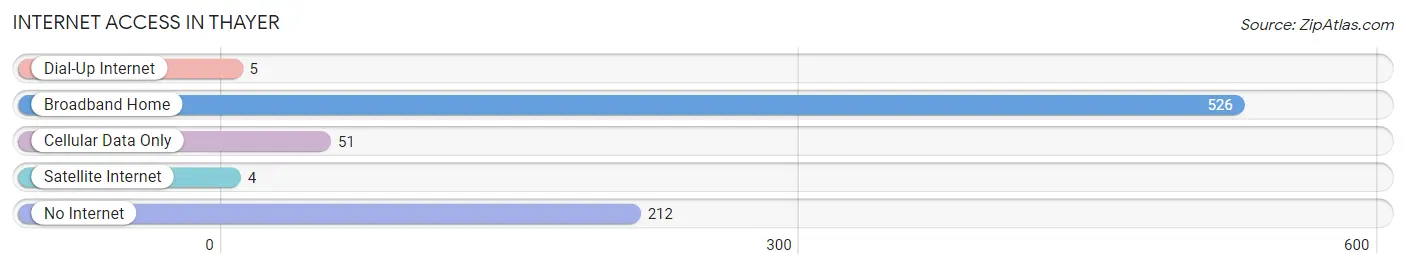
| Internet Type | # Households | % Households |
| Dial-Up Internet | 5 | 0.6% |
| Broadband Home | 526 | 66.2% |
| Cellular Data Only | 51 | 6.4% |
| Satellite Internet | 4 | 0.5% |
| No Internet | 212 | 26.7% |
| Total | 794 | 100.0% |
Thayer Summary
Thayer is a city located in Oregon County, Missouri, United States. The population was 2,717 at the 2010 census. It is the county seat of Oregon County. Thayer is located in the Ozark Mountains region of Missouri.
History
Thayer was founded in 1883 by the Thayer brothers, who were looking for a place to build a railroad. The town was named after one of the brothers, John Thayer. The railroad was completed in 1884 and the town was incorporated in 1887.
The town grew quickly and by the early 1900s, it had become a major hub for the timber industry. The town was also home to several sawmills, a flour mill, and a brick factory.
In the 1920s, Thayer was a popular tourist destination. The town was home to several resorts, including the Thayer Hotel, which was built in 1924. The hotel was a popular destination for tourists from St. Louis and other nearby cities.
In the 1950s, Thayer began to decline as the timber industry moved away from the area. The town's population decreased and many of the businesses closed.
Geography
Thayer is located at 36°45'25" North, 91°25'45" West (36.756944, -91.429167). According to the United States Census Bureau, the city has a total area of 2.2 square miles (5.7 km2), all land.
Economy
Thayer's economy is largely based on agriculture and tourism. The town is home to several farms, which produce a variety of crops, including corn, soybeans, and wheat. The town is also home to several tourist attractions, including the Thayer Hotel, which is listed on the National Register of Historic Places.
Demographics
As of the census of 2010, there were 2,717 people, 1,093 households, and 717 families residing in the city. The population density was 1,228.2 people per square mile (474.2/km2). There were 1,223 housing units at an average density of 551.2 per square mile (212.9/km2). The racial makeup of the city was 97.2% White, 0.3% African American, 0.3% Native American, 0.2% Asian, 0.1% Pacific Islander, 0.7% from other races, and 1.2% from two or more races. Hispanic or Latino of any race were 1.7% of the population.
There were 1,093 households, out of which 28.2% had children under the age of 18 living with them, 48.2% were married couples living together, 13.2% had a female householder with no husband present, and 33.7% were non-families. 29.2% of all households were made up of individuals, and 14.7% had someone living alone who was 65 years of age or older. The average household size was 2.41 and the average family size was 2.94.
In the city, the population was spread out, with 24.2% under the age of 18, 8.2% from 18 to 24, 24.3% from 25 to 44, 24.2% from 45 to 64, and 19.1% who were 65 years of age or older. The median age was 39 years. For every 100 females, there were 87.3 males. For every 100 females age 18 and over, there were 83.2 males.
The median income for a household in the city was $25,938, and the median income for a family was $31,250. Males had a median income of $25,000 versus $17,500 for females. The per capita income for the city was $13,945. About 17.2% of families and 20.2% of the population were below the poverty line, including 28.2% of those under age 18 and 16.2% of those age 65 or over.
Common Questions
What is Per Capita Income in Thayer?
Per Capita income in Thayer is $20,083.
What is the Median Family Income in Thayer?
Median Family Income in Thayer is $52,589.
What is the Median Household income in Thayer?
Median Household Income in Thayer is $35,357.
What is Income or Wage Gap in Thayer?
Income or Wage Gap in Thayer is 22.6%.
Women in Thayer earn 77.4 cents for every dollar earned by a man.
What is Inequality or Gini Index in Thayer?
Inequality or Gini Index in Thayer is 0.41.
What is the Total Population of Thayer?
Total Population of Thayer is 2,111.
What is the Total Male Population of Thayer?
Total Male Population of Thayer is 942.
What is the Total Female Population of Thayer?
Total Female Population of Thayer is 1,169.
What is the Ratio of Males per 100 Females in Thayer?
There are 80.58 Males per 100 Females in Thayer.
What is the Ratio of Females per 100 Males in Thayer?
There are 124.10 Females per 100 Males in Thayer.
What is the Median Population Age in Thayer?
Median Population Age in Thayer is 41.8 Years.
What is the Average Family Size in Thayer
Average Family Size in Thayer is 3.1 People.
What is the Average Household Size in Thayer
Average Household Size in Thayer is 2.6 People.
How Large is the Labor Force in Thayer?
There are 693 People in the Labor Forcein in Thayer.
What is the Percentage of People in the Labor Force in Thayer?
41.8% of People are in the Labor Force in Thayer.
What is the Unemployment Rate in Thayer?
Unemployment Rate in Thayer is 4.2%.