Sugar Creek, MO Map & Demographics
Sugar Creek Map
Sugar Creek Overview
$27,865
PER CAPITA INCOME
$64,200
AVG FAMILY INCOME
$55,201
AVG HOUSEHOLD INCOME
28.5%
WAGE / INCOME GAP [ % ]
71.5¢/ $1
WAGE / INCOME GAP [ $ ]
$12,445
FAMILY INCOME DEFICIT
0.42
INEQUALITY / GINI INDEX
3,247
TOTAL POPULATION
1,676
MALE POPULATION
1,571
FEMALE POPULATION
106.68
MALES / 100 FEMALES
93.74
FEMALES / 100 MALES
43.9
MEDIAN AGE
3.2
AVG FAMILY SIZE
2.5
AVG HOUSEHOLD SIZE
1,624
LABOR FORCE [ PEOPLE ]
61.6%
PERCENT IN LABOR FORCE
5.8%
UNEMPLOYMENT RATE
Sugar Creek Area Codes
Income in Sugar Creek
Income Overview in Sugar Creek
Per Capita Income in Sugar Creek is $27,865, while median incomes of families and households are $64,200 and $55,201 respectively.
| Characteristic | Number | Measure |
| Per Capita Income | 3,247 | $27,865 |
| Median Family Income | 754 | $64,200 |
| Mean Family Income | 754 | $73,345 |
| Median Household Income | 1,299 | $55,201 |
| Mean Household Income | 1,299 | $66,871 |
| Income Deficit | 754 | $12,445 |
| Wage / Income Gap (%) | 3,247 | 28.54% |
| Wage / Income Gap ($) | 3,247 | 71.46¢ per $1 |
| Gini / Inequality Index | 3,247 | 0.42 |
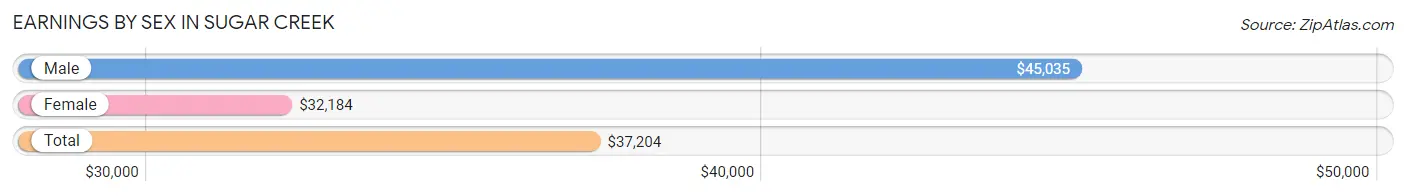
Earnings by Sex in Sugar Creek
Average Earnings in Sugar Creek are $37,204, $45,035 for men and $32,184 for women, a difference of 28.5%.
| Sex | Number | Average Earnings |
| Male | 865 (51.8%) | $45,035 |
| Female | 805 (48.2%) | $32,184 |
| Total | 1,670 (100.0%) | $37,204 |
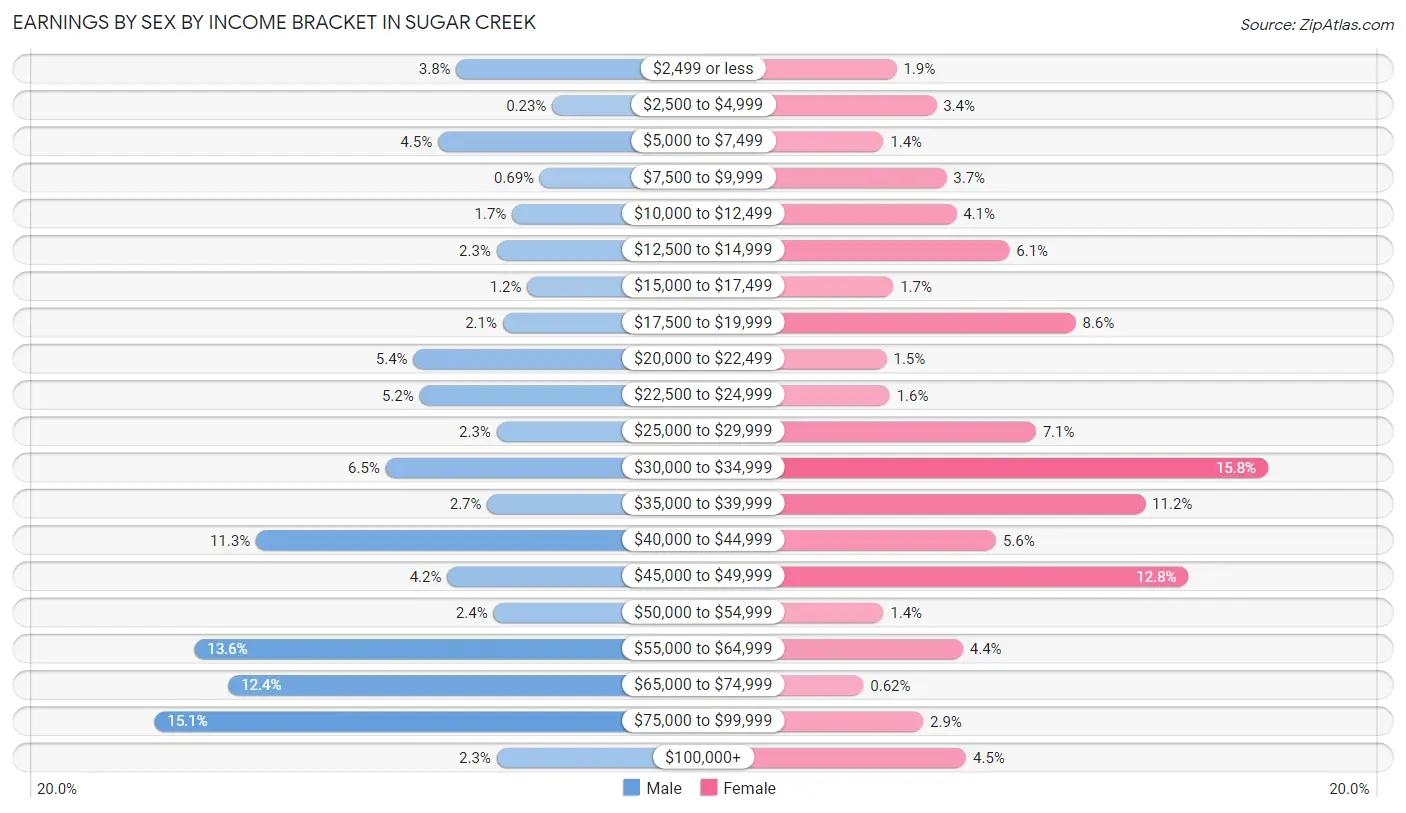
Earnings by Sex by Income Bracket in Sugar Creek
The most common earnings brackets in Sugar Creek are $75,000 to $99,999 for men (131 | 15.1%) and $30,000 to $34,999 for women (127 | 15.8%).
| Income | Male | Female |
| $2,499 or less | 33 (3.8%) | 15 (1.9%) |
| $2,500 to $4,999 | 2 (0.2%) | 27 (3.4%) |
| $5,000 to $7,499 | 39 (4.5%) | 11 (1.4%) |
| $7,500 to $9,999 | 6 (0.7%) | 30 (3.7%) |
| $10,000 to $12,499 | 15 (1.7%) | 33 (4.1%) |
| $12,500 to $14,999 | 20 (2.3%) | 49 (6.1%) |
| $15,000 to $17,499 | 10 (1.2%) | 14 (1.7%) |
| $17,500 to $19,999 | 18 (2.1%) | 69 (8.6%) |
| $20,000 to $22,499 | 47 (5.4%) | 12 (1.5%) |
| $22,500 to $24,999 | 45 (5.2%) | 13 (1.6%) |
| $25,000 to $29,999 | 20 (2.3%) | 57 (7.1%) |
| $30,000 to $34,999 | 56 (6.5%) | 127 (15.8%) |
| $35,000 to $39,999 | 23 (2.7%) | 90 (11.2%) |
| $40,000 to $44,999 | 98 (11.3%) | 45 (5.6%) |
| $45,000 to $49,999 | 36 (4.2%) | 103 (12.8%) |
| $50,000 to $54,999 | 21 (2.4%) | 11 (1.4%) |
| $55,000 to $64,999 | 118 (13.6%) | 35 (4.3%) |
| $65,000 to $74,999 | 107 (12.4%) | 5 (0.6%) |
| $75,000 to $99,999 | 131 (15.1%) | 23 (2.9%) |
| $100,000+ | 20 (2.3%) | 36 (4.5%) |
| Total | 865 (100.0%) | 805 (100.0%) |
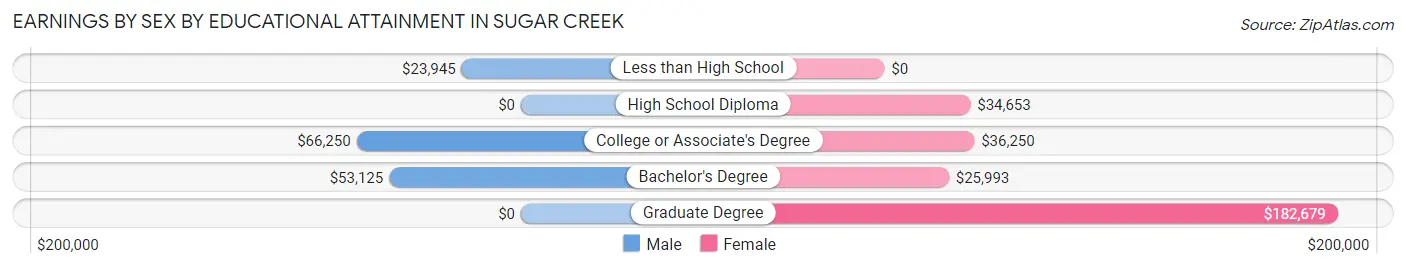
Earnings by Sex by Educational Attainment in Sugar Creek
Average earnings in Sugar Creek are $53,095 for men and $32,763 for women, a difference of 38.3%. Men with an educational attainment of college or associate's degree enjoy the highest average annual earnings of $66,250, while those with less than high school education earn the least with $23,945. Women with an educational attainment of graduate degree earn the most with the average annual earnings of $182,679, while those with bachelor's degree education have the smallest earnings of $25,993.
| Educational Attainment | Male Income | Female Income |
| Less than High School | $23,945 | $0 |
| High School Diploma | - | - |
| College or Associate's Degree | $66,250 | $36,250 |
| Bachelor's Degree | $53,125 | $25,993 |
| Graduate Degree | - | - |
| Total | $53,095 | $32,763 |
Family Income in Sugar Creek
Family Income Brackets in Sugar Creek
According to the Sugar Creek family income data, there are 250 families falling into the $50,000 to $74,999 income range, which is the most common income bracket and makes up 33.2% of all families. Conversely, the $150,000 to $199,999 income bracket is the least frequent group with only 17 families (2.2%) belonging to this category.
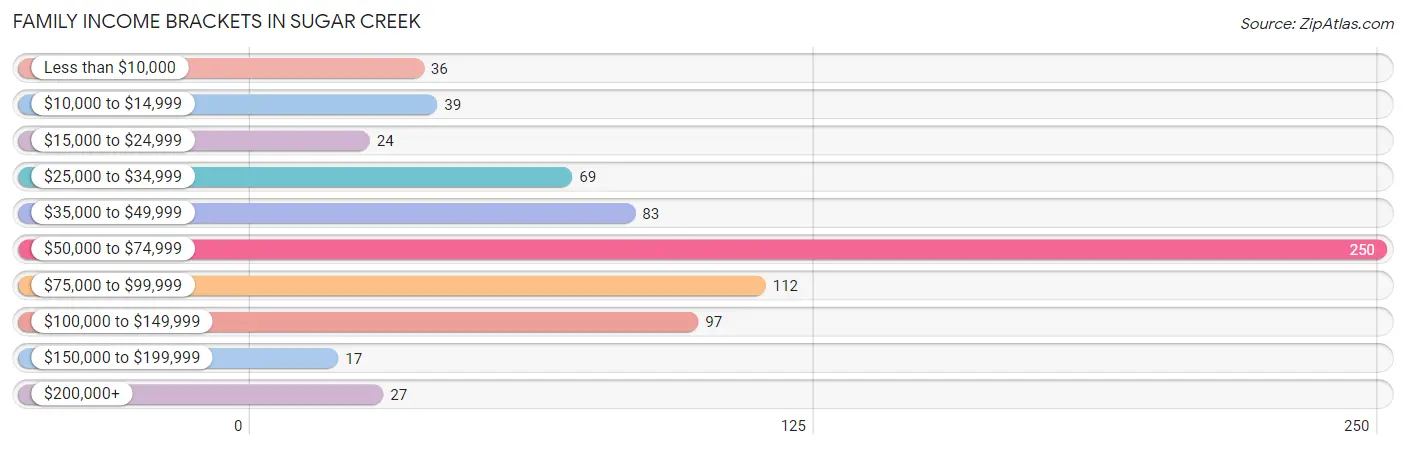
| Income Bracket | # Families | % Families |
| Less than $10,000 | 36 | 4.8% |
| $10,000 to $14,999 | 39 | 5.2% |
| $15,000 to $24,999 | 24 | 3.2% |
| $25,000 to $34,999 | 69 | 9.2% |
| $35,000 to $49,999 | 83 | 11.0% |
| $50,000 to $74,999 | 250 | 33.2% |
| $75,000 to $99,999 | 112 | 14.9% |
| $100,000 to $149,999 | 97 | 12.9% |
| $150,000 to $199,999 | 17 | 2.3% |
| $200,000+ | 27 | 3.6% |
Family Income by Famaliy Size in Sugar Creek
4-person families (97 | 12.9%) account for the highest median family income in Sugar Creek with $92,578 per family, while 2-person families (288 | 38.2%) have the highest median income of $31,500 per family member.
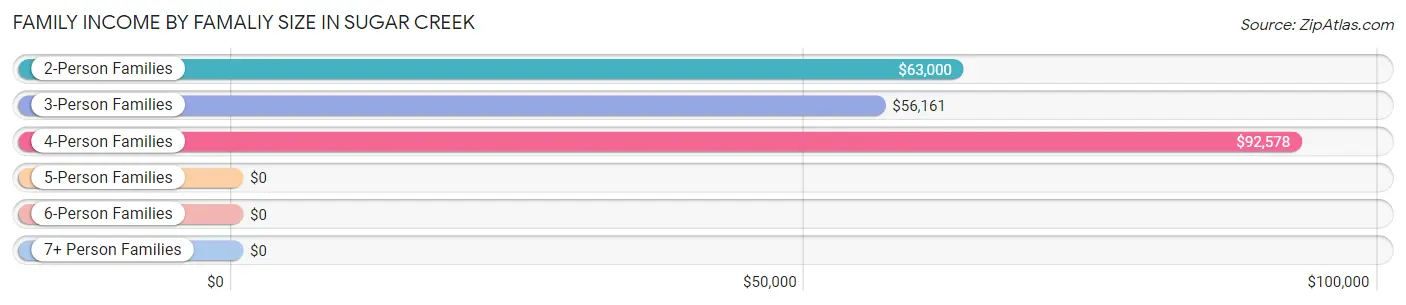
| Income Bracket | # Families | Median Income |
| 2-Person Families | 288 (38.2%) | $63,000 |
| 3-Person Families | 288 (38.2%) | $56,161 |
| 4-Person Families | 97 (12.9%) | $92,578 |
| 5-Person Families | 51 (6.8%) | $0 |
| 6-Person Families | 30 (4.0%) | $0 |
| 7+ Person Families | 0 (0.0%) | $0 |
| Total | 754 (100.0%) | $64,200 |
Family Income by Number of Earners in Sugar Creek
The median family income in Sugar Creek is $64,200, with families comprising 3+ earners (74) having the highest median family income of $133,333, while families with no earners (190) have the lowest median family income of $30,263, accounting for 9.8% and 25.2% of families, respectively.
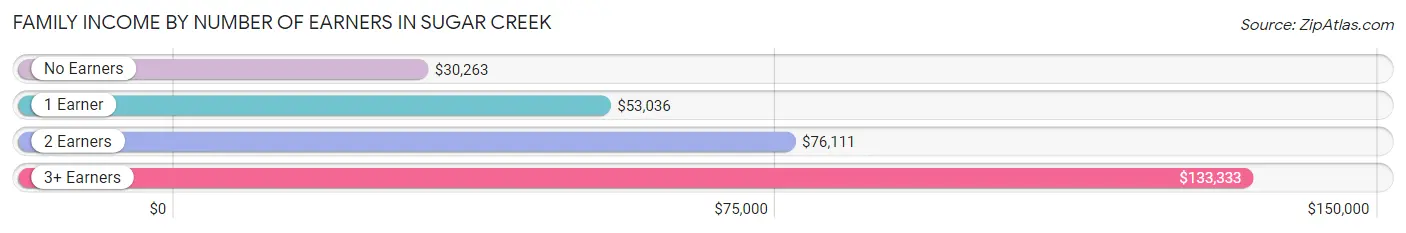
| Number of Earners | # Families | Median Income |
| No Earners | 190 (25.2%) | $30,263 |
| 1 Earner | 162 (21.5%) | $53,036 |
| 2 Earners | 328 (43.5%) | $76,111 |
| 3+ Earners | 74 (9.8%) | $133,333 |
| Total | 754 (100.0%) | $64,200 |
Household Income in Sugar Creek
Household Income Brackets in Sugar Creek
With 300 households falling in the category, the $50,000 to $74,999 income range is the most frequent in Sugar Creek, accounting for 23.1% of all households. In contrast, only 5 households (0.4%) fall into the $10,000 to $14,999 income bracket, making it the least populous group.
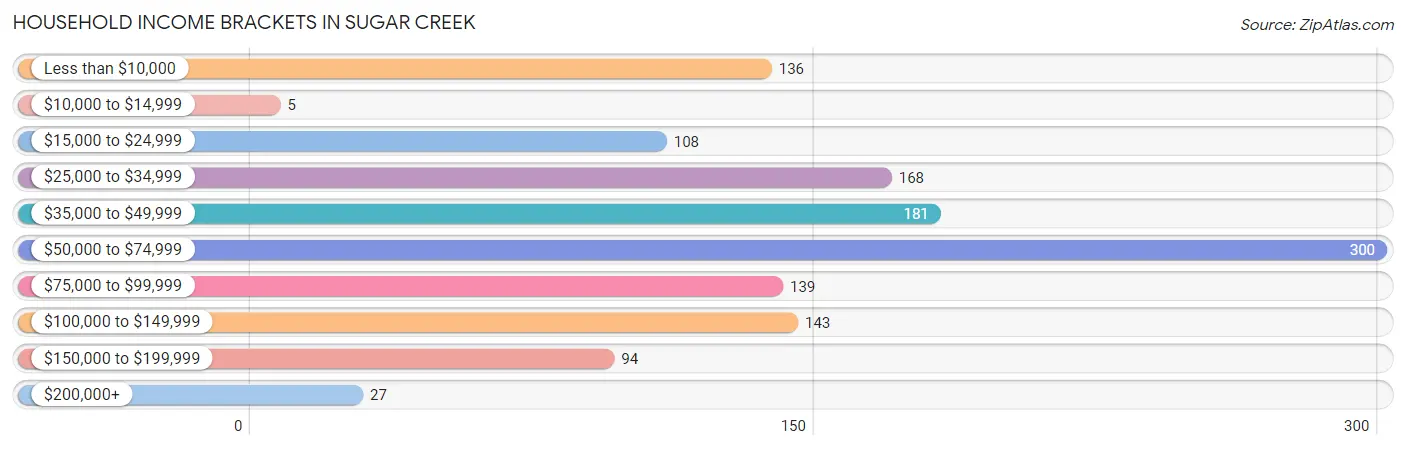
| Income Bracket | # Households | % Households |
| Less than $10,000 | 136 | 10.5% |
| $10,000 to $14,999 | 5 | 0.4% |
| $15,000 to $24,999 | 108 | 8.3% |
| $25,000 to $34,999 | 168 | 12.9% |
| $35,000 to $49,999 | 181 | 13.9% |
| $50,000 to $74,999 | 300 | 23.1% |
| $75,000 to $99,999 | 139 | 10.7% |
| $100,000 to $149,999 | 143 | 11.0% |
| $150,000 to $199,999 | 94 | 7.2% |
| $200,000+ | 27 | 2.1% |
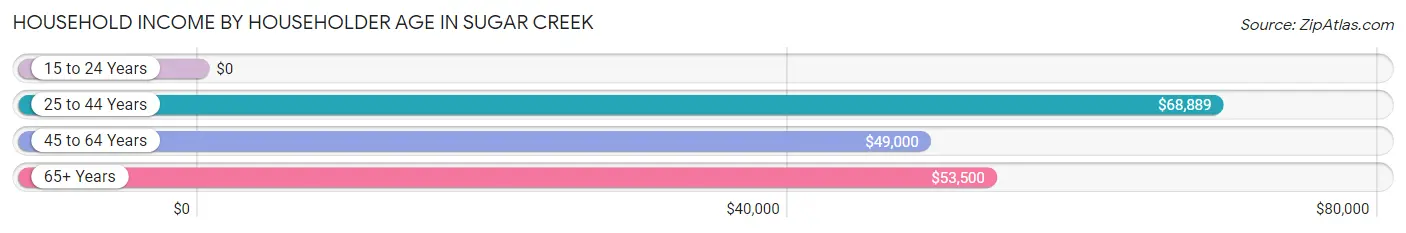
Household Income by Householder Age in Sugar Creek
The median household income in Sugar Creek is $55,201, with the highest median household income of $68,889 found in the 25 to 44 years age bracket for the primary householder. A total of 326 households (25.1%) fall into this category. Meanwhile, the 15 to 24 years age bracket for the primary householder has the lowest median household income of $0, with 37 households (2.9%) in this group.
| Income Bracket | # Households | Median Income |
| 15 to 24 Years | 37 (2.9%) | $0 |
| 25 to 44 Years | 326 (25.1%) | $68,889 |
| 45 to 64 Years | 620 (47.7%) | $49,000 |
| 65+ Years | 316 (24.3%) | $53,500 |
| Total | 1,299 (100.0%) | $55,201 |
Poverty in Sugar Creek
Income Below Poverty by Sex and Age in Sugar Creek
With 7.2% poverty level for males and 13.5% for females among the residents of Sugar Creek, 25 to 34 year old males and 15 year old females are the most vulnerable to poverty, with 48 males (22.4%) and 36 females (100.0%) in their respective age groups living below the poverty level.
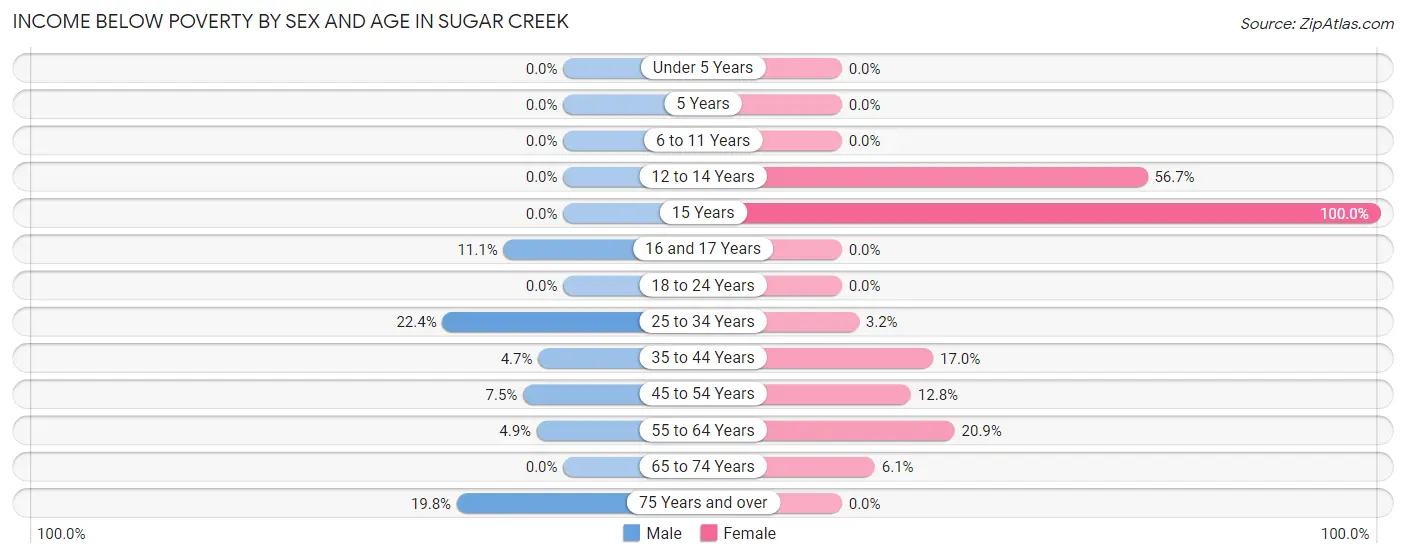
| Age Bracket | Male | Female |
| Under 5 Years | 0 (0.0%) | 0 (0.0%) |
| 5 Years | 0 (0.0%) | 0 (0.0%) |
| 6 to 11 Years | 0 (0.0%) | 0 (0.0%) |
| 12 to 14 Years | 0 (0.0%) | 59 (56.7%) |
| 15 Years | 0 (0.0%) | 36 (100.0%) |
| 16 and 17 Years | 6 (11.1%) | 0 (0.0%) |
| 18 to 24 Years | 0 (0.0%) | 0 (0.0%) |
| 25 to 34 Years | 48 (22.4%) | 6 (3.2%) |
| 35 to 44 Years | 8 (4.6%) | 30 (17.0%) |
| 45 to 54 Years | 26 (7.4%) | 34 (12.8%) |
| 55 to 64 Years | 14 (4.9%) | 40 (20.9%) |
| 65 to 74 Years | 0 (0.0%) | 7 (6.1%) |
| 75 Years and over | 16 (19.8%) | 0 (0.0%) |
| Total | 118 (7.2%) | 212 (13.5%) |
Income Above Poverty by Sex and Age in Sugar Creek
According to the poverty statistics in Sugar Creek, males aged under 5 years and females aged under 5 years are the age groups that are most secure financially, with 100.0% of males and 100.0% of females in these age groups living above the poverty line.
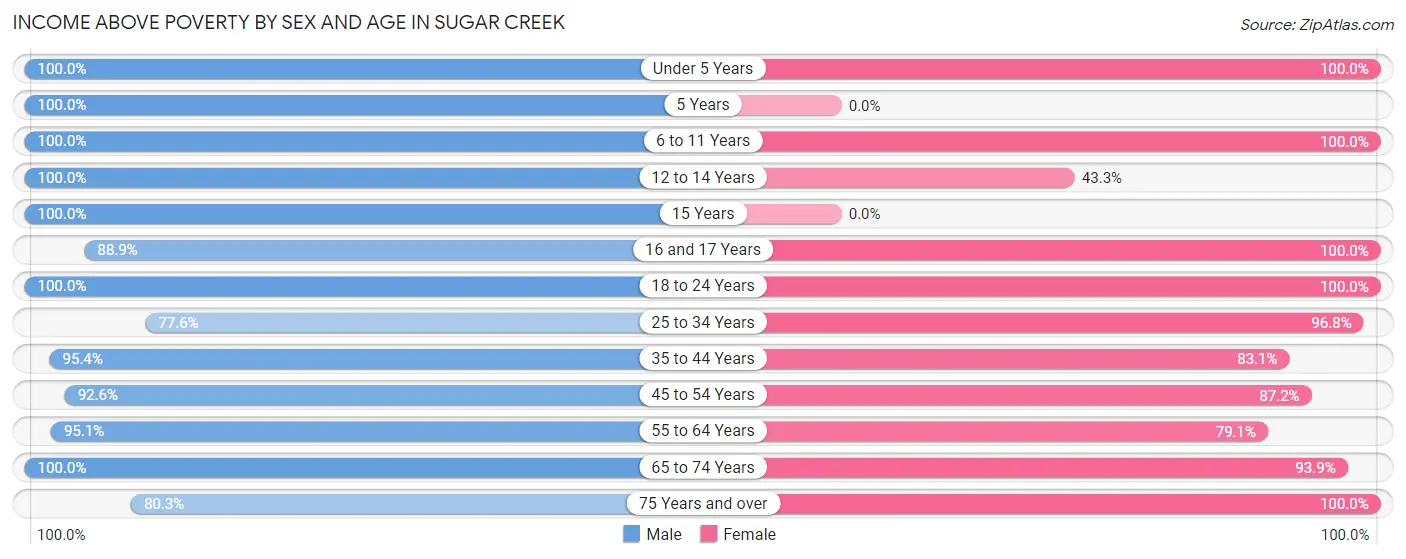
| Age Bracket | Male | Female |
| Under 5 Years | 49 (100.0%) | 132 (100.0%) |
| 5 Years | 31 (100.0%) | 0 (0.0%) |
| 6 to 11 Years | 104 (100.0%) | 77 (100.0%) |
| 12 to 14 Years | 16 (100.0%) | 45 (43.3%) |
| 15 Years | 29 (100.0%) | 0 (0.0%) |
| 16 and 17 Years | 48 (88.9%) | 42 (100.0%) |
| 18 to 24 Years | 63 (100.0%) | 164 (100.0%) |
| 25 to 34 Years | 166 (77.6%) | 183 (96.8%) |
| 35 to 44 Years | 164 (95.4%) | 147 (83.1%) |
| 45 to 54 Years | 323 (92.5%) | 231 (87.2%) |
| 55 to 64 Years | 272 (95.1%) | 151 (79.1%) |
| 65 to 74 Years | 195 (100.0%) | 107 (93.9%) |
| 75 Years and over | 65 (80.2%) | 80 (100.0%) |
| Total | 1,525 (92.8%) | 1,359 (86.5%) |
Income Below Poverty Among Married-Couple Families in Sugar Creek
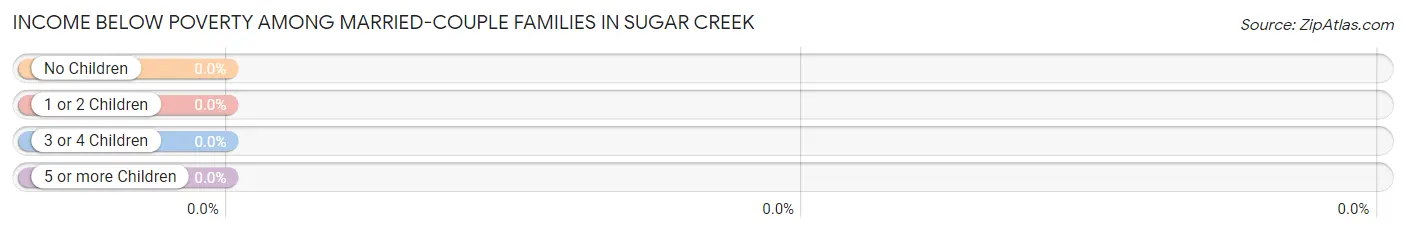
| Children | Above Poverty | Below Poverty |
| No Children | 303 (100.0%) | 0 (0.0%) |
| 1 or 2 Children | 206 (100.0%) | 0 (0.0%) |
| 3 or 4 Children | 13 (100.0%) | 0 (0.0%) |
| 5 or more Children | 0 (0.0%) | 0 (0.0%) |
| Total | 522 (100.0%) | 0 (0.0%) |
Income Below Poverty Among Single-Parent Households in Sugar Creek
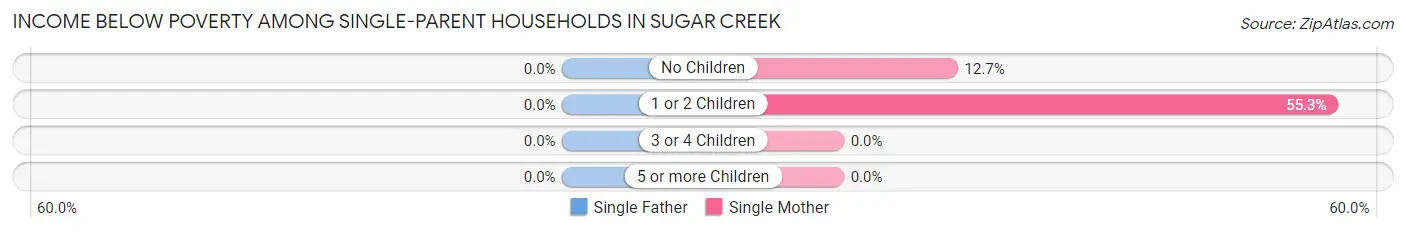
| Children | Single Father | Single Mother |
| No Children | 0 (0.0%) | 7 (12.7%) |
| 1 or 2 Children | 0 (0.0%) | 68 (55.3%) |
| 3 or 4 Children | 0 (0.0%) | 0 (0.0%) |
| 5 or more Children | 0 (0.0%) | 0 (0.0%) |
| Total | 0 (0.0%) | 75 (42.1%) |
Income Below Poverty Among Married-Couple vs Single-Parent Households in Sugar Creek
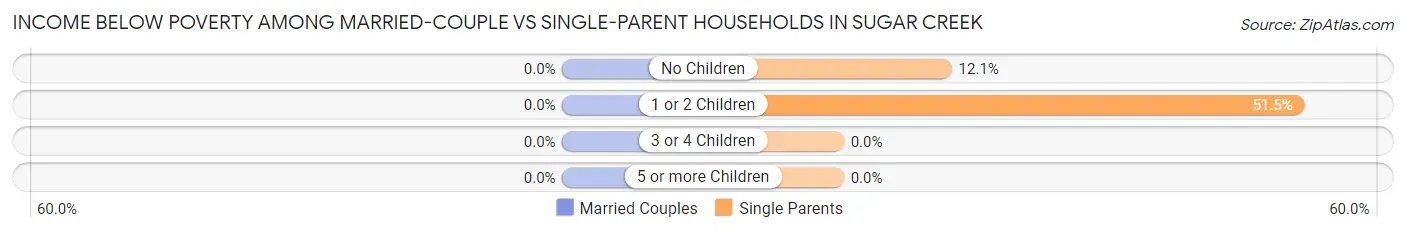
| Children | Married-Couple Families | Single-Parent Households |
| No Children | 0 (0.0%) | 7 (12.1%) |
| 1 or 2 Children | 0 (0.0%) | 68 (51.5%) |
| 3 or 4 Children | 0 (0.0%) | 0 (0.0%) |
| 5 or more Children | 0 (0.0%) | 0 (0.0%) |
| Total | 0 (0.0%) | 75 (32.3%) |
Race in Sugar Creek
The most populous races in Sugar Creek are White / Caucasian (2,744 | 84.5%), Two or more Races (308 | 9.5%), and Hispanic or Latino (201 | 6.2%).
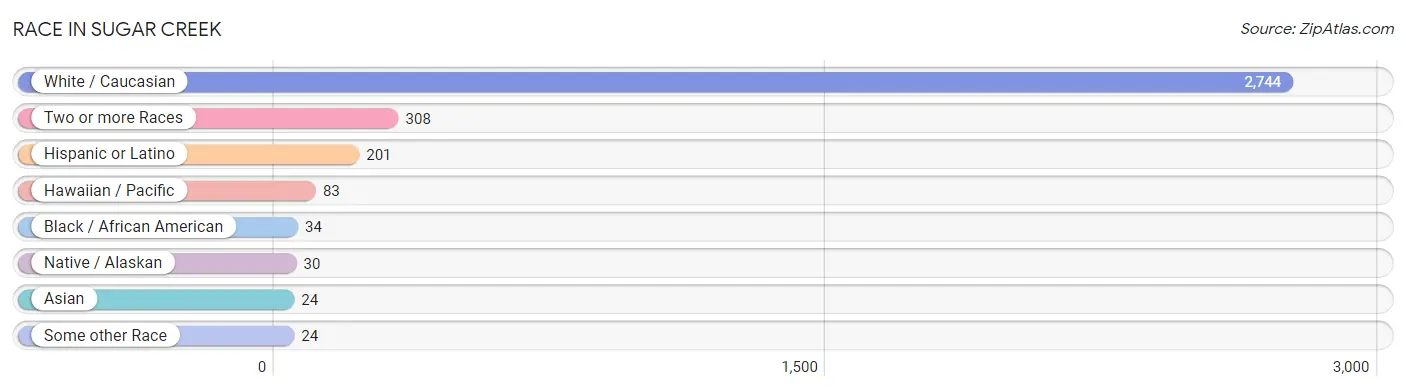
| Race | # Population | % Population |
| Asian | 24 | 0.7% |
| Black / African American | 34 | 1.1% |
| Hawaiian / Pacific | 83 | 2.6% |
| Hispanic or Latino | 201 | 6.2% |
| Native / Alaskan | 30 | 0.9% |
| White / Caucasian | 2,744 | 84.5% |
| Two or more Races | 308 | 9.5% |
| Some other Race | 24 | 0.7% |
| Total | 3,247 | 100.0% |
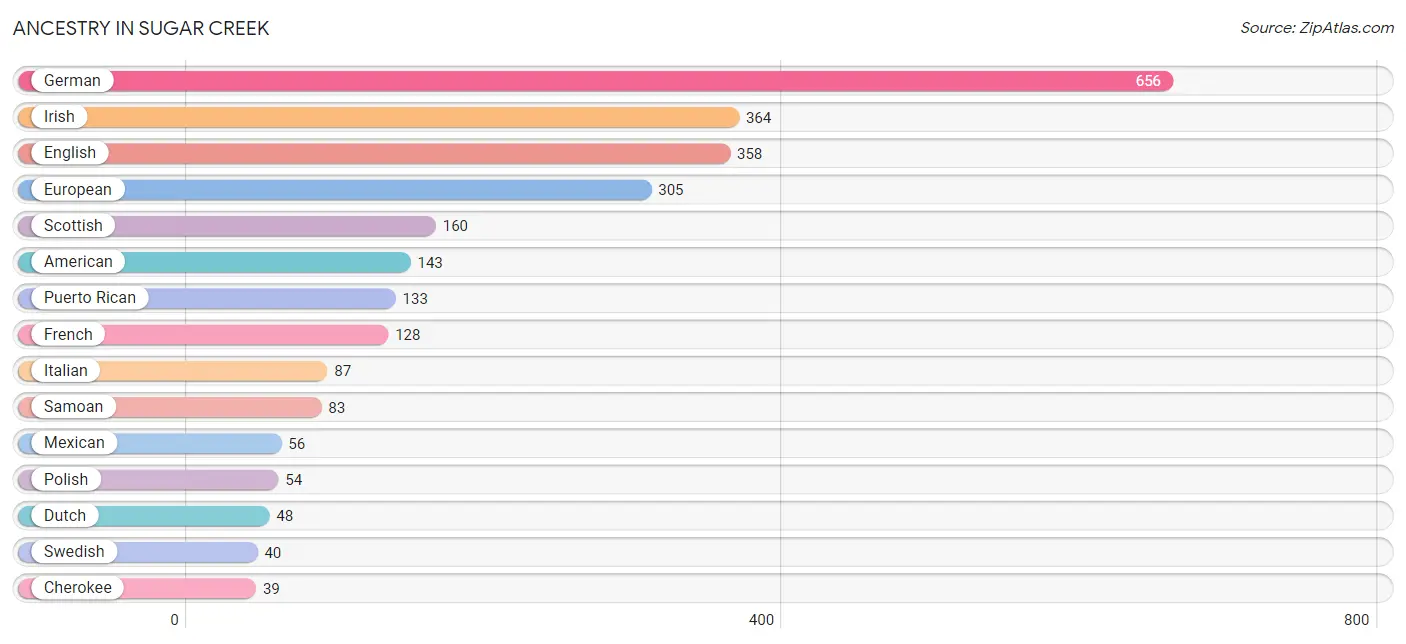
Ancestry in Sugar Creek
The most populous ancestries reported in Sugar Creek are German (656 | 20.2%), Irish (364 | 11.2%), English (358 | 11.0%), European (305 | 9.4%), and Scottish (160 | 4.9%), together accounting for 56.8% of all Sugar Creek residents.
| Ancestry | # Population | % Population |
| American | 143 | 4.4% |
| Austrian | 11 | 0.3% |
| Bahamian | 13 | 0.4% |
| Cherokee | 39 | 1.2% |
| Czech | 23 | 0.7% |
| Dutch | 48 | 1.5% |
| Ecuadorian | 6 | 0.2% |
| English | 358 | 11.0% |
| European | 305 | 9.4% |
| French | 128 | 3.9% |
| French Canadian | 37 | 1.1% |
| German | 656 | 20.2% |
| Irish | 364 | 11.2% |
| Italian | 87 | 2.7% |
| Mexican | 56 | 1.7% |
| Norwegian | 15 | 0.5% |
| Polish | 54 | 1.7% |
| Puerto Rican | 133 | 4.1% |
| Samoan | 83 | 2.6% |
| Scandinavian | 9 | 0.3% |
| Scotch-Irish | 35 | 1.1% |
| Scottish | 160 | 4.9% |
| Slovak | 23 | 0.7% |
| South American | 6 | 0.2% |
| Swedish | 40 | 1.2% |
| Swiss | 30 | 0.9% |
| Welsh | 25 | 0.8% | View All 27 Rows |
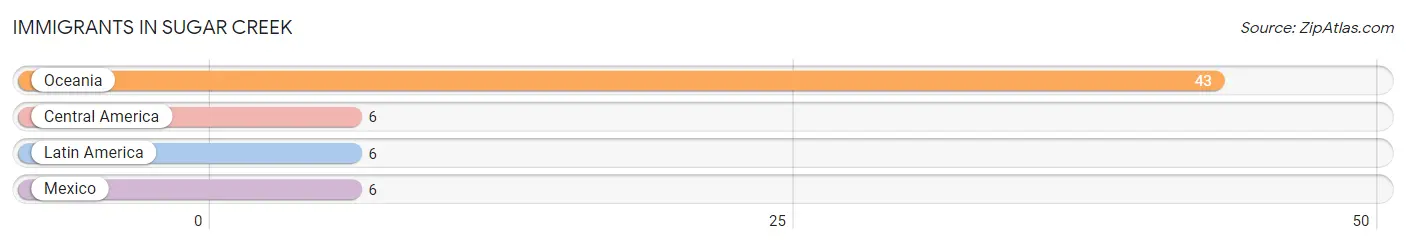
Immigrants in Sugar Creek
The most numerous immigrant groups reported in Sugar Creek came from Oceania (43 | 1.3%), Central America (6 | 0.2%), Latin America (6 | 0.2%), and Mexico (6 | 0.2%), together accounting for 1.9% of all Sugar Creek residents.
| Immigration Origin | # Population | % Population |
| Central America | 6 | 0.2% |
| Latin America | 6 | 0.2% |
| Mexico | 6 | 0.2% |
| Oceania | 43 | 1.3% | View All 4 Rows |
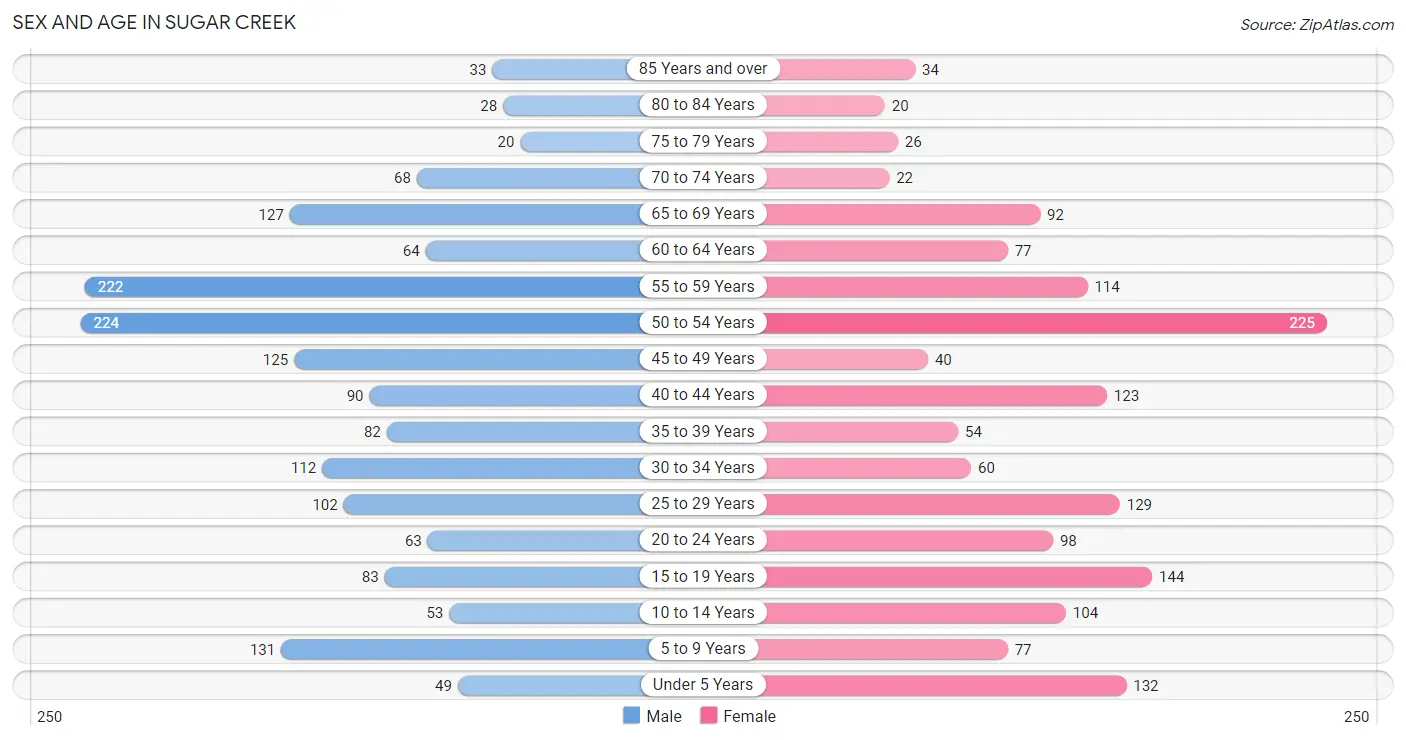
Sex and Age in Sugar Creek
Sex and Age in Sugar Creek
The most populous age groups in Sugar Creek are 50 to 54 Years (224 | 13.4%) for men and 50 to 54 Years (225 | 14.3%) for women.
| Age Bracket | Male | Female |
| Under 5 Years | 49 (2.9%) | 132 (8.4%) |
| 5 to 9 Years | 131 (7.8%) | 77 (4.9%) |
| 10 to 14 Years | 53 (3.2%) | 104 (6.6%) |
| 15 to 19 Years | 83 (5.0%) | 144 (9.2%) |
| 20 to 24 Years | 63 (3.8%) | 98 (6.2%) |
| 25 to 29 Years | 102 (6.1%) | 129 (8.2%) |
| 30 to 34 Years | 112 (6.7%) | 60 (3.8%) |
| 35 to 39 Years | 82 (4.9%) | 54 (3.4%) |
| 40 to 44 Years | 90 (5.4%) | 123 (7.8%) |
| 45 to 49 Years | 125 (7.5%) | 40 (2.5%) |
| 50 to 54 Years | 224 (13.4%) | 225 (14.3%) |
| 55 to 59 Years | 222 (13.3%) | 114 (7.3%) |
| 60 to 64 Years | 64 (3.8%) | 77 (4.9%) |
| 65 to 69 Years | 127 (7.6%) | 92 (5.9%) |
| 70 to 74 Years | 68 (4.1%) | 22 (1.4%) |
| 75 to 79 Years | 20 (1.2%) | 26 (1.7%) |
| 80 to 84 Years | 28 (1.7%) | 20 (1.3%) |
| 85 Years and over | 33 (2.0%) | 34 (2.2%) |
| Total | 1,676 (100.0%) | 1,571 (100.0%) |
Families and Households in Sugar Creek
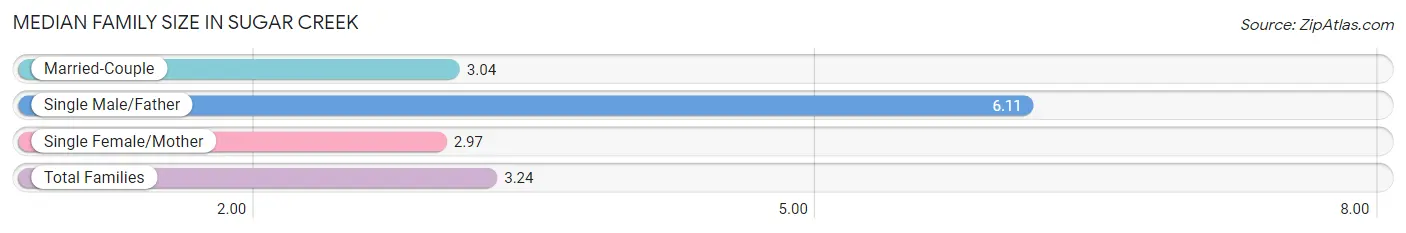
Median Family Size in Sugar Creek
The median family size in Sugar Creek is 3.24 persons per family, with single male/father families (54 | 7.2%) accounting for the largest median family size of 6.11 persons per family. On the other hand, single female/mother families (178 | 23.6%) represent the smallest median family size with 2.97 persons per family.
| Family Type | # Families | Family Size |
| Married-Couple | 522 (69.2%) | 3.04 |
| Single Male/Father | 54 (7.2%) | 6.11 |
| Single Female/Mother | 178 (23.6%) | 2.97 |
| Total Families | 754 (100.0%) | 3.24 |
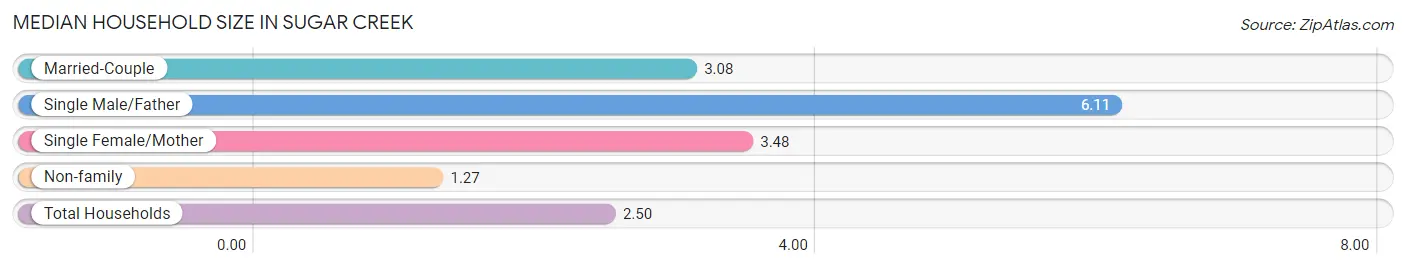
Median Household Size in Sugar Creek
The median household size in Sugar Creek is 2.50 persons per household, with single male/father households (54 | 4.2%) accounting for the largest median household size of 6.11 persons per household. non-family households (545 | 42.0%) represent the smallest median household size with 1.27 persons per household.
| Household Type | # Households | Household Size |
| Married-Couple | 522 (40.2%) | 3.08 |
| Single Male/Father | 54 (4.2%) | 6.11 |
| Single Female/Mother | 178 (13.7%) | 3.48 |
| Non-family | 545 (42.0%) | 1.27 |
| Total Households | 1,299 (100.0%) | 2.50 |
Household Size by Marriage Status in Sugar Creek
Out of a total of 1,299 households in Sugar Creek, 754 (58.0%) are family households, while 545 (42.0%) are nonfamily households. The most numerous type of family households are 2-person households, comprising 288, and the most common type of nonfamily households are 1-person households, comprising 407.
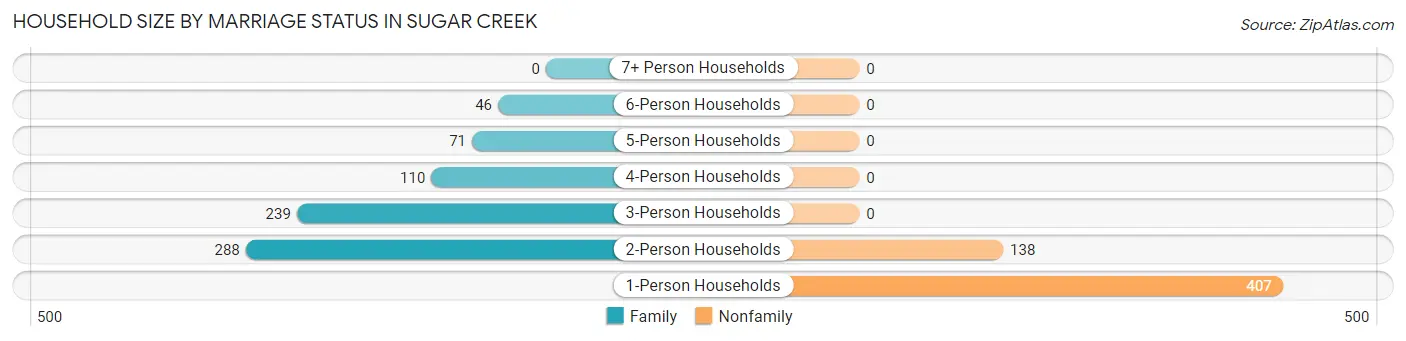
| Household Size | Family Households | Nonfamily Households |
| 1-Person Households | - | 407 (31.3%) |
| 2-Person Households | 288 (22.2%) | 138 (10.6%) |
| 3-Person Households | 239 (18.4%) | 0 (0.0%) |
| 4-Person Households | 110 (8.5%) | 0 (0.0%) |
| 5-Person Households | 71 (5.5%) | 0 (0.0%) |
| 6-Person Households | 46 (3.5%) | 0 (0.0%) |
| 7+ Person Households | 0 (0.0%) | 0 (0.0%) |
| Total | 754 (58.0%) | 545 (42.0%) |
Female Fertility in Sugar Creek
Fertility by Age in Sugar Creek
Average fertility rate in Sugar Creek is 12.0 births per 1,000 women. Women in the age bracket of 20 to 34 years have the highest fertility rate with 28.0 births per 1,000 women. Women in the age bracket of 20 to 34 years acount for 100.0% of all women with births.
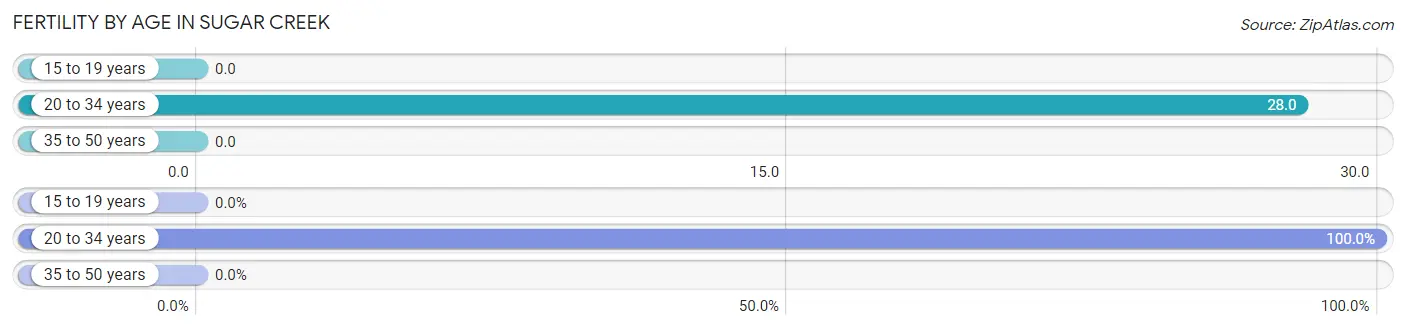
| Age Bracket | Women with Births | Births / 1,000 Women |
| 15 to 19 years | 0 (0.0%) | 0.0 |
| 20 to 34 years | 8 (100.0%) | 28.0 |
| 35 to 50 years | 0 (0.0%) | 0.0 |
| Total | 8 (100.0%) | 12.0 |
Fertility by Age by Marriage Status in Sugar Creek
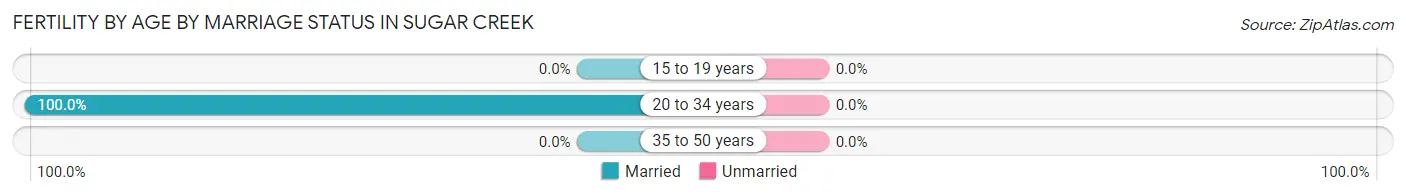
| Age Bracket | Married | Unmarried |
| 15 to 19 years | 0 (0.0%) | 0 (0.0%) |
| 20 to 34 years | 8 (100.0%) | 0 (0.0%) |
| 35 to 50 years | 0 (0.0%) | 0 (0.0%) |
| Total | 8 (100.0%) | 0 (0.0%) |
Fertility by Education in Sugar Creek
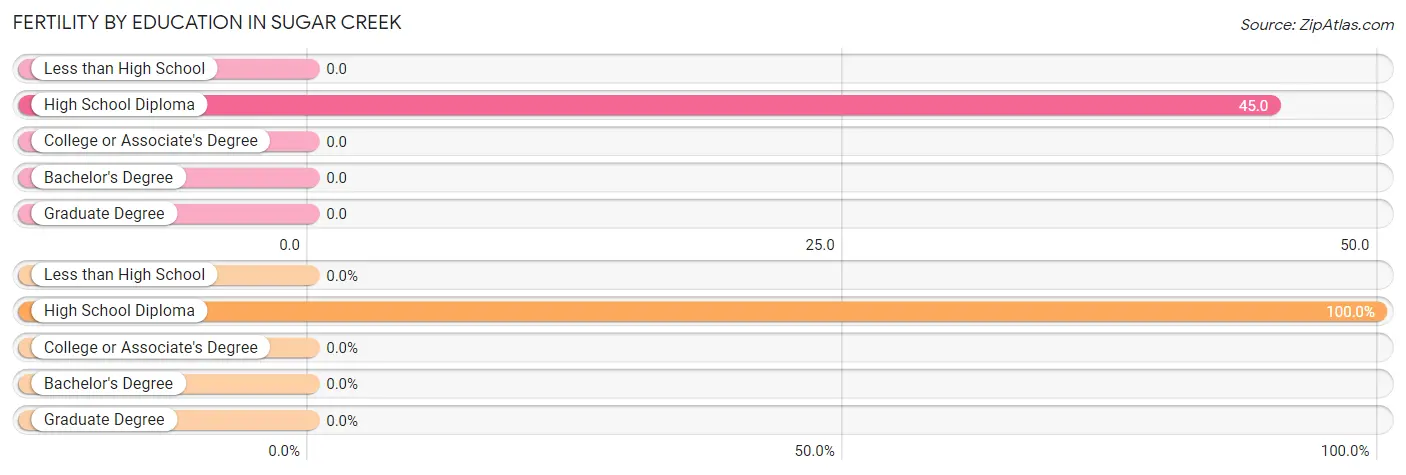
| Educational Attainment | Women with Births | Births / 1,000 Women |
| Less than High School | 0 (0.0%) | 0.0 |
| High School Diploma | 8 (100.0%) | 45.0 |
| College or Associate's Degree | 0 (0.0%) | 0.0 |
| Bachelor's Degree | 0 (0.0%) | 0.0 |
| Graduate Degree | 0 (0.0%) | 0.0 |
| Total | 8 (100.0%) | 12.0 |
Fertility by Education by Marriage Status in Sugar Creek
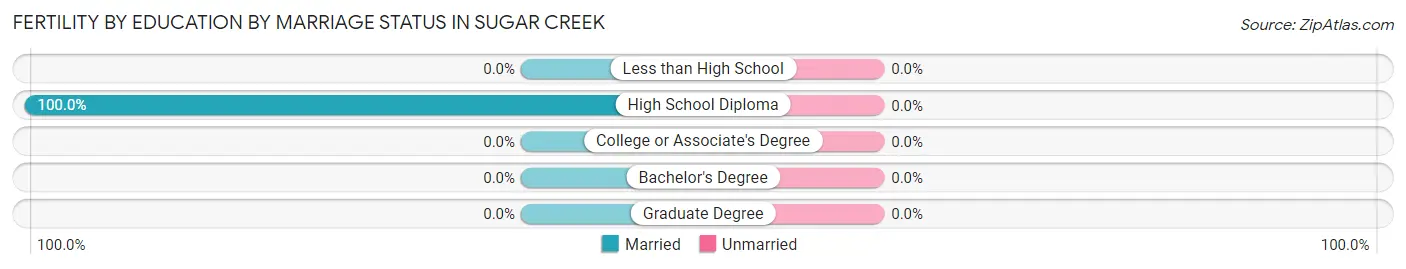
| Educational Attainment | Married | Unmarried |
| Less than High School | 0 (0.0%) | 0 (0.0%) |
| High School Diploma | 8 (100.0%) | 0 (0.0%) |
| College or Associate's Degree | 0 (0.0%) | 0 (0.0%) |
| Bachelor's Degree | 0 (0.0%) | 0 (0.0%) |
| Graduate Degree | 0 (0.0%) | 0 (0.0%) |
| Total | 8 (100.0%) | 0 (0.0%) |
Employment Characteristics in Sugar Creek
Employment by Class of Employer in Sugar Creek
Among the 1,514 employed individuals in Sugar Creek, private company employees (1,059 | 70.0%), self-employed (not incorporated) (151 | 10.0%), and not-for-profit organizations (114 | 7.5%) make up the most common classes of employment.
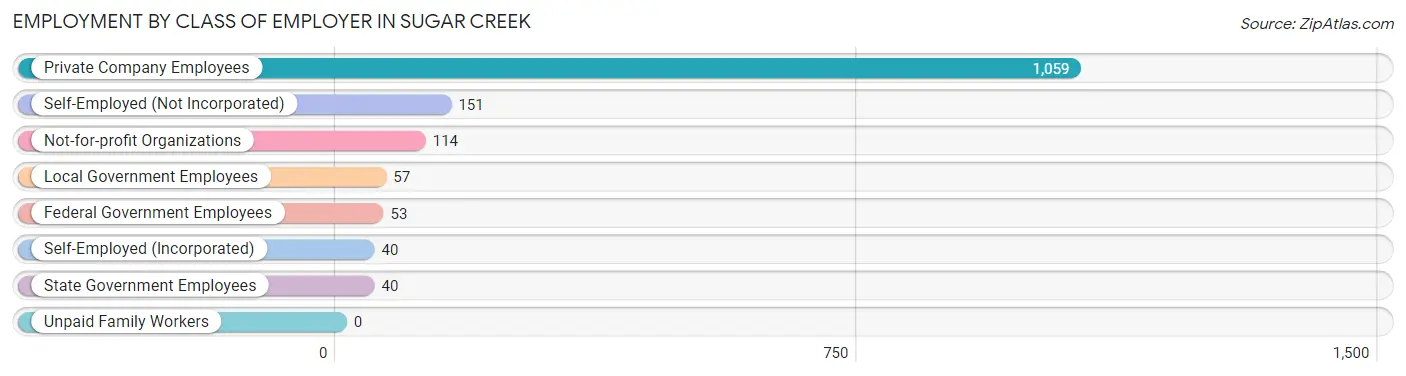
| Employer Class | # Employees | % Employees |
| Private Company Employees | 1,059 | 70.0% |
| Self-Employed (Incorporated) | 40 | 2.6% |
| Self-Employed (Not Incorporated) | 151 | 10.0% |
| Not-for-profit Organizations | 114 | 7.5% |
| Local Government Employees | 57 | 3.8% |
| State Government Employees | 40 | 2.6% |
| Federal Government Employees | 53 | 3.5% |
| Unpaid Family Workers | 0 | 0.0% |
| Total | 1,514 | 100.0% |
Employment Status by Age in Sugar Creek
According to the labor force statistics for Sugar Creek, out of the total population over 16 years of age (2,636), 61.6% or 1,624 individuals are in the labor force, with 5.8% or 94 of them unemployed. The age group with the highest labor force participation rate is 55 to 59 years, with 86.0% or 289 individuals in the labor force. Within the labor force, the 30 to 34 years age range has the highest percentage of unemployed individuals, with 27.1% or 38 of them being unemployed.
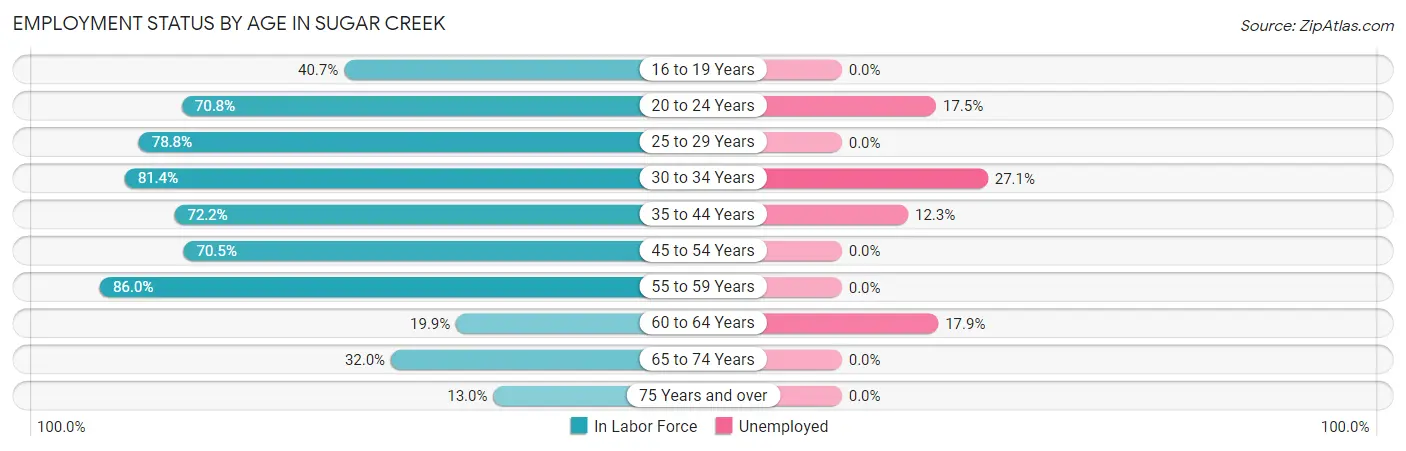
| Age Bracket | In Labor Force | Unemployed |
| 16 to 19 Years | 66 (40.7%) | 0 (0.0%) |
| 20 to 24 Years | 114 (70.8%) | 20 (17.5%) |
| 25 to 29 Years | 182 (78.8%) | 0 (0.0%) |
| 30 to 34 Years | 140 (81.4%) | 38 (27.1%) |
| 35 to 44 Years | 252 (72.2%) | 31 (12.3%) |
| 45 to 54 Years | 433 (70.5%) | 0 (0.0%) |
| 55 to 59 Years | 289 (86.0%) | 0 (0.0%) |
| 60 to 64 Years | 28 (19.9%) | 5 (17.9%) |
| 65 to 74 Years | 99 (32.0%) | 0 (0.0%) |
| 75 Years and over | 21 (13.0%) | 0 (0.0%) |
| Total | 1,624 (61.6%) | 94 (5.8%) |
Employment Status by Educational Attainment in Sugar Creek
According to labor force statistics for Sugar Creek, 71.8% of individuals (1,323) out of the total population between 25 and 64 years of age (1,843) are in the labor force, with 5.6% or 74 of them being unemployed. The group with the highest labor force participation rate are those with the educational attainment of bachelor's degree or higher, with 86.0% or 277 individuals in the labor force. Within the labor force, individuals with bachelor's degree or higher education have the highest percentage of unemployment, with 8.7% or 24 of them being unemployed.
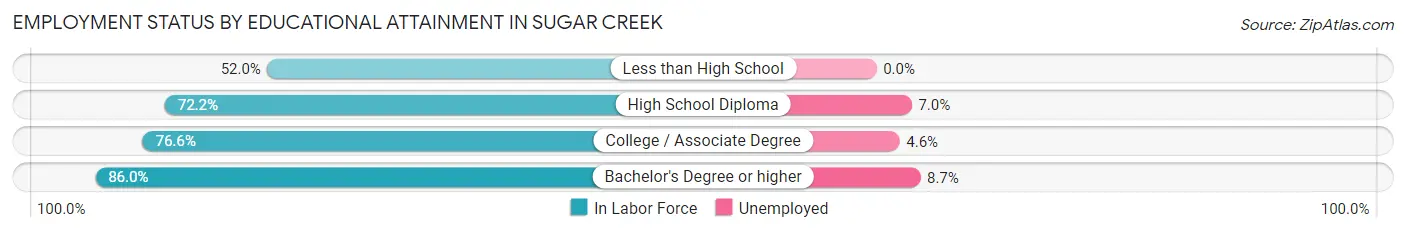
| Educational Attainment | In Labor Force | Unemployed |
| Less than High School | 192 (52.0%) | 0 (0.0%) |
| High School Diploma | 446 (72.2%) | 43 (7.0%) |
| College / Associate Degree | 409 (76.6%) | 25 (4.6%) |
| Bachelor's Degree or higher | 277 (86.0%) | 28 (8.7%) |
| Total | 1,323 (71.8%) | 103 (5.6%) |
Employment Occupations by Sex in Sugar Creek
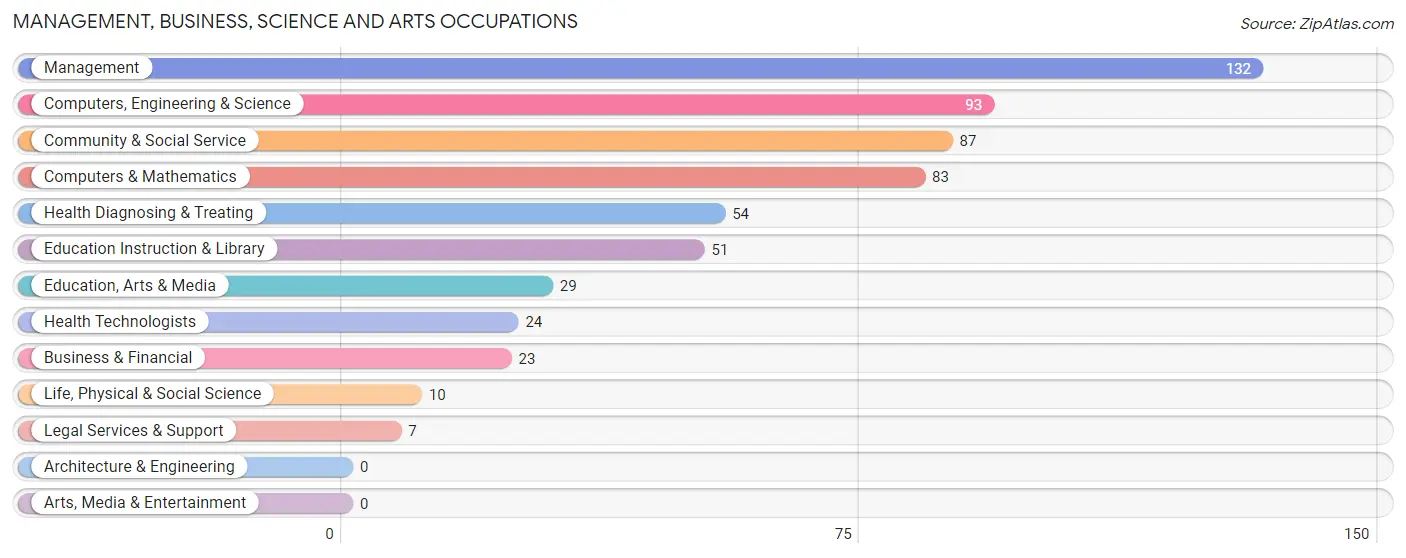
Management, Business, Science and Arts Occupations
The most common Management, Business, Science and Arts occupations in Sugar Creek are Management (132 | 8.6%), Computers, Engineering & Science (93 | 6.1%), Community & Social Service (87 | 5.7%), Computers & Mathematics (83 | 5.4%), and Health Diagnosing & Treating (54 | 3.5%).
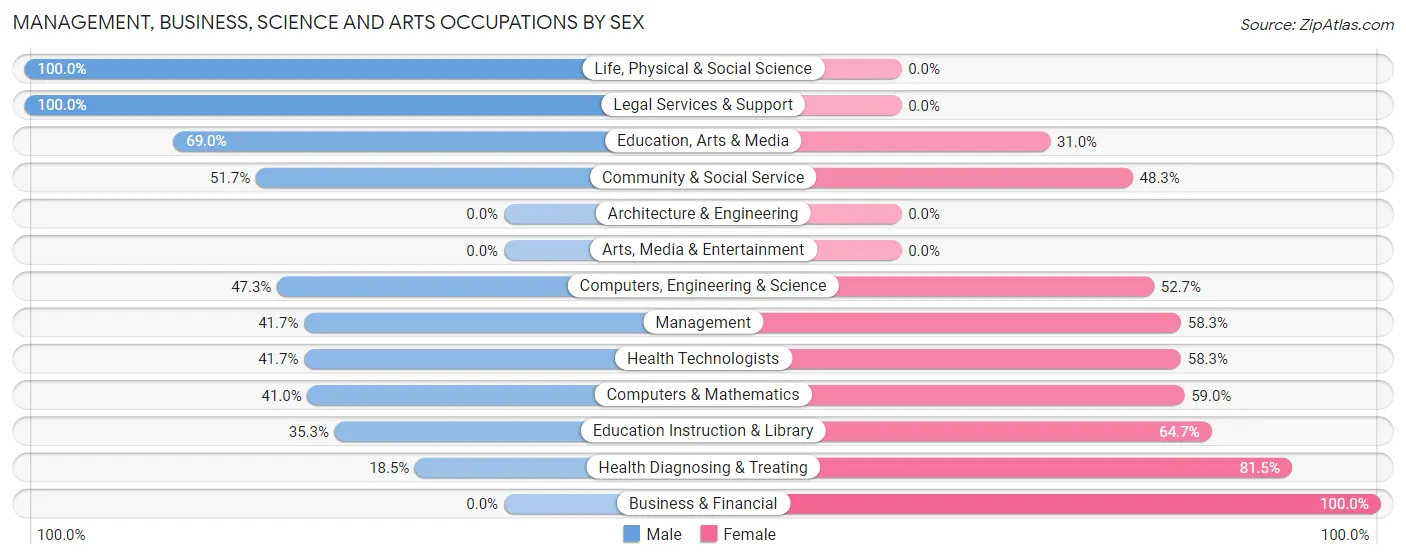
Management, Business, Science and Arts Occupations by Sex
Within the Management, Business, Science and Arts occupations in Sugar Creek, the most male-oriented occupations are Life, Physical & Social Science (100.0%), Legal Services & Support (100.0%), and Education, Arts & Media (69.0%), while the most female-oriented occupations are Business & Financial (100.0%), Health Diagnosing & Treating (81.5%), and Education Instruction & Library (64.7%).
| Occupation | Male | Female |
| Management | 55 (41.7%) | 77 (58.3%) |
| Business & Financial | 0 (0.0%) | 23 (100.0%) |
| Computers, Engineering & Science | 44 (47.3%) | 49 (52.7%) |
| Computers & Mathematics | 34 (41.0%) | 49 (59.0%) |
| Architecture & Engineering | 0 (0.0%) | 0 (0.0%) |
| Life, Physical & Social Science | 10 (100.0%) | 0 (0.0%) |
| Community & Social Service | 45 (51.7%) | 42 (48.3%) |
| Education, Arts & Media | 20 (69.0%) | 9 (31.0%) |
| Legal Services & Support | 7 (100.0%) | 0 (0.0%) |
| Education Instruction & Library | 18 (35.3%) | 33 (64.7%) |
| Arts, Media & Entertainment | 0 (0.0%) | 0 (0.0%) |
| Health Diagnosing & Treating | 10 (18.5%) | 44 (81.5%) |
| Health Technologists | 10 (41.7%) | 14 (58.3%) |
| Total (Category) | 154 (39.6%) | 235 (60.4%) |
| Total (Overall) | 820 (53.6%) | 710 (46.4%) |
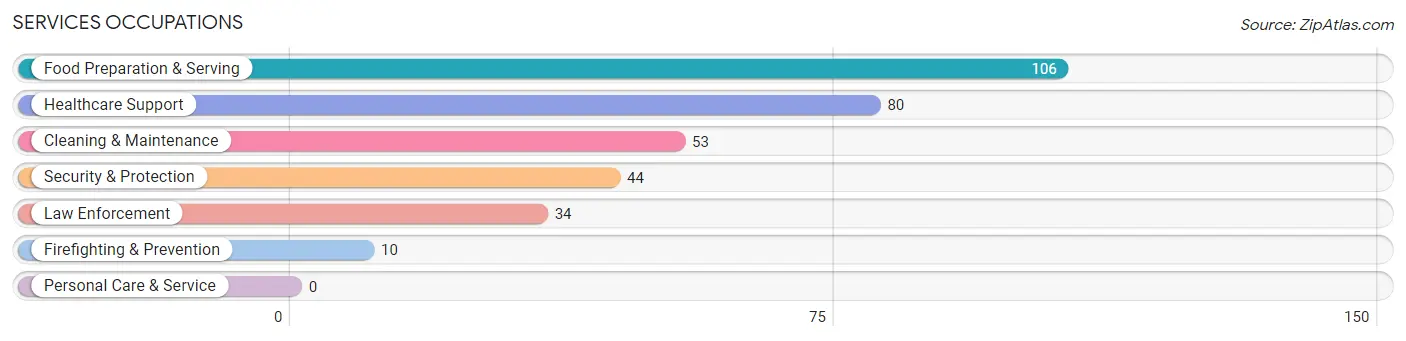
Services Occupations
The most common Services occupations in Sugar Creek are Food Preparation & Serving (106 | 6.9%), Healthcare Support (80 | 5.2%), Cleaning & Maintenance (53 | 3.5%), Security & Protection (44 | 2.9%), and Law Enforcement (34 | 2.2%).
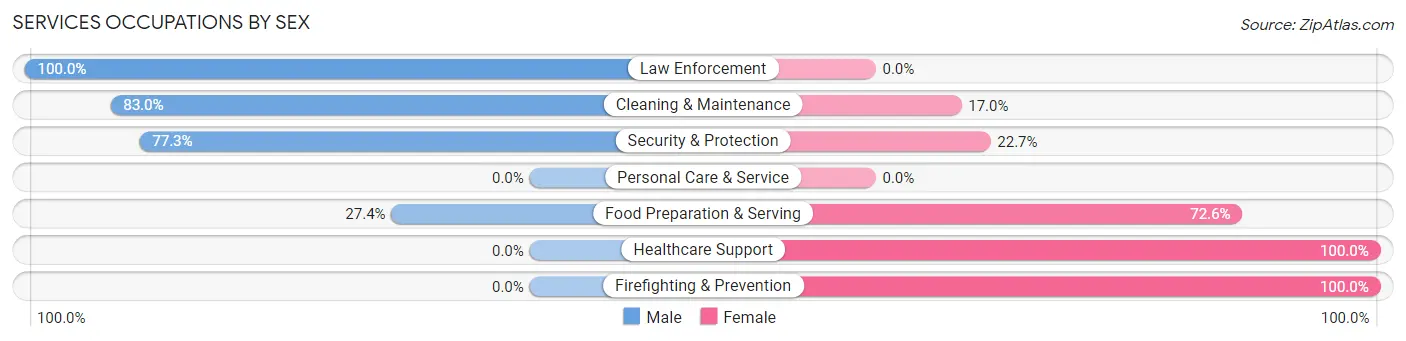
Services Occupations by Sex
Within the Services occupations in Sugar Creek, the most male-oriented occupations are Law Enforcement (100.0%), Cleaning & Maintenance (83.0%), and Security & Protection (77.3%), while the most female-oriented occupations are Healthcare Support (100.0%), Firefighting & Prevention (100.0%), and Food Preparation & Serving (72.6%).
| Occupation | Male | Female |
| Healthcare Support | 0 (0.0%) | 80 (100.0%) |
| Security & Protection | 34 (77.3%) | 10 (22.7%) |
| Firefighting & Prevention | 0 (0.0%) | 10 (100.0%) |
| Law Enforcement | 34 (100.0%) | 0 (0.0%) |
| Food Preparation & Serving | 29 (27.4%) | 77 (72.6%) |
| Cleaning & Maintenance | 44 (83.0%) | 9 (17.0%) |
| Personal Care & Service | 0 (0.0%) | 0 (0.0%) |
| Total (Category) | 107 (37.8%) | 176 (62.2%) |
| Total (Overall) | 820 (53.6%) | 710 (46.4%) |
Sales and Office Occupations
The most common Sales and Office occupations in Sugar Creek are Office & Administration (184 | 12.0%), and Sales & Related (87 | 5.7%).
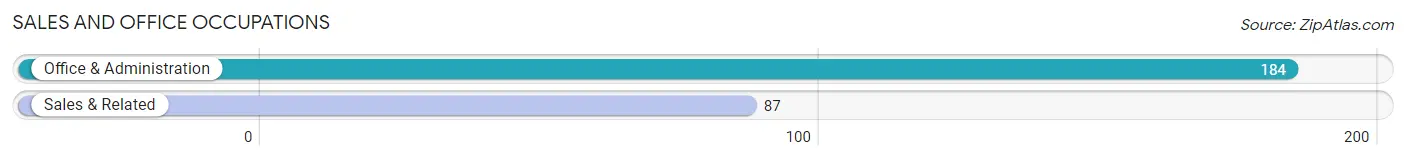
Sales and Office Occupations by Sex

| Occupation | Male | Female |
| Sales & Related | 45 (51.7%) | 42 (48.3%) |
| Office & Administration | 10 (5.4%) | 174 (94.6%) |
| Total (Category) | 55 (20.3%) | 216 (79.7%) |
| Total (Overall) | 820 (53.6%) | 710 (46.4%) |
Natural Resources, Construction and Maintenance Occupations
The most common Natural Resources, Construction and Maintenance occupations in Sugar Creek are Construction & Extraction (176 | 11.5%), and Installation, Maintenance & Repair (53 | 3.5%).
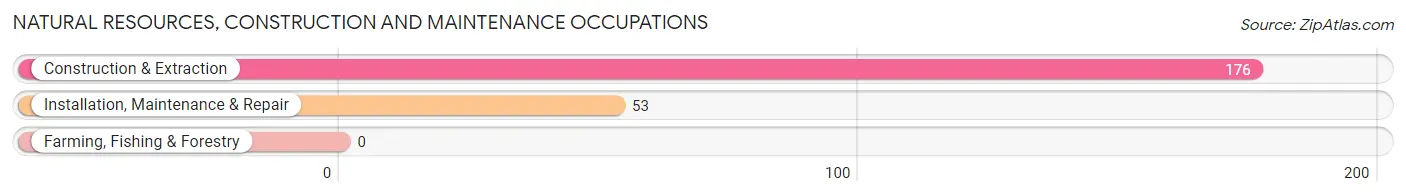
Natural Resources, Construction and Maintenance Occupations by Sex

| Occupation | Male | Female |
| Farming, Fishing & Forestry | 0 (0.0%) | 0 (0.0%) |
| Construction & Extraction | 174 (98.9%) | 2 (1.1%) |
| Installation, Maintenance & Repair | 53 (100.0%) | 0 (0.0%) |
| Total (Category) | 227 (99.1%) | 2 (0.9%) |
| Total (Overall) | 820 (53.6%) | 710 (46.4%) |
Production, Transportation and Moving Occupations
The most common Production, Transportation and Moving occupations in Sugar Creek are Production (179 | 11.7%), Material Moving (96 | 6.3%), and Transportation (83 | 5.4%).
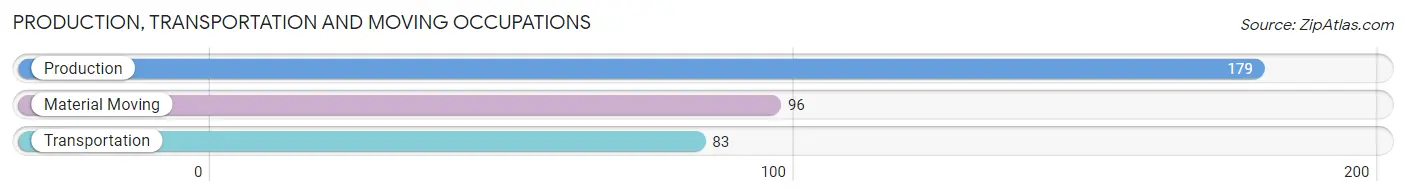
Production, Transportation and Moving Occupations by Sex
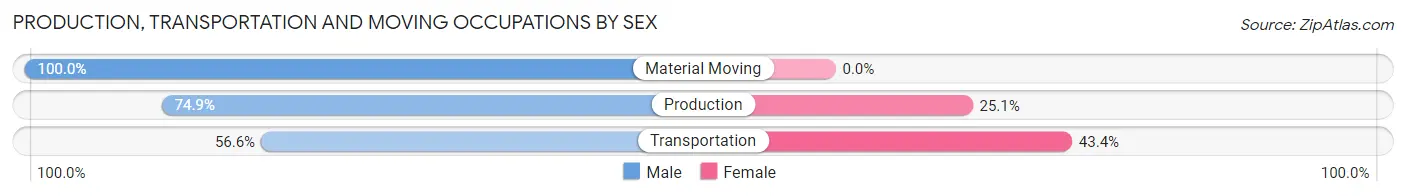
| Occupation | Male | Female |
| Production | 134 (74.9%) | 45 (25.1%) |
| Transportation | 47 (56.6%) | 36 (43.4%) |
| Material Moving | 96 (100.0%) | 0 (0.0%) |
| Total (Category) | 277 (77.4%) | 81 (22.6%) |
| Total (Overall) | 820 (53.6%) | 710 (46.4%) |
Employment Industries by Sex in Sugar Creek
Employment Industries in Sugar Creek
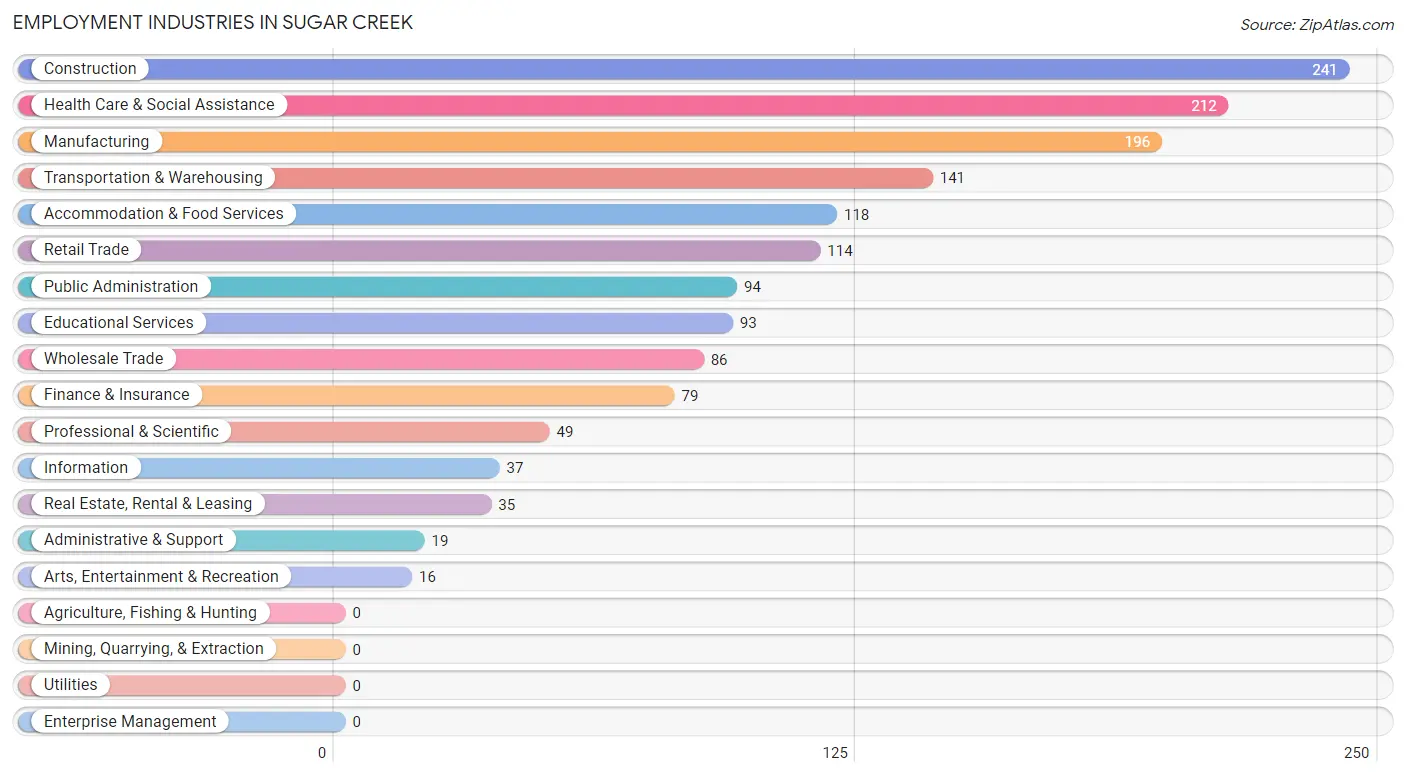
The major employment industries in Sugar Creek include Construction (241 | 15.8%), Health Care & Social Assistance (212 | 13.9%), Manufacturing (196 | 12.8%), Transportation & Warehousing (141 | 9.2%), and Accommodation & Food Services (118 | 7.7%).
Employment Industries by Sex in Sugar Creek
The Sugar Creek industries that see more men than women are Information (100.0%), Real Estate, Rental & Leasing (100.0%), and Arts, Entertainment & Recreation (100.0%), whereas the industries that tend to have a higher number of women are Finance & Insurance (93.7%), Health Care & Social Assistance (90.1%), and Educational Services (69.9%).
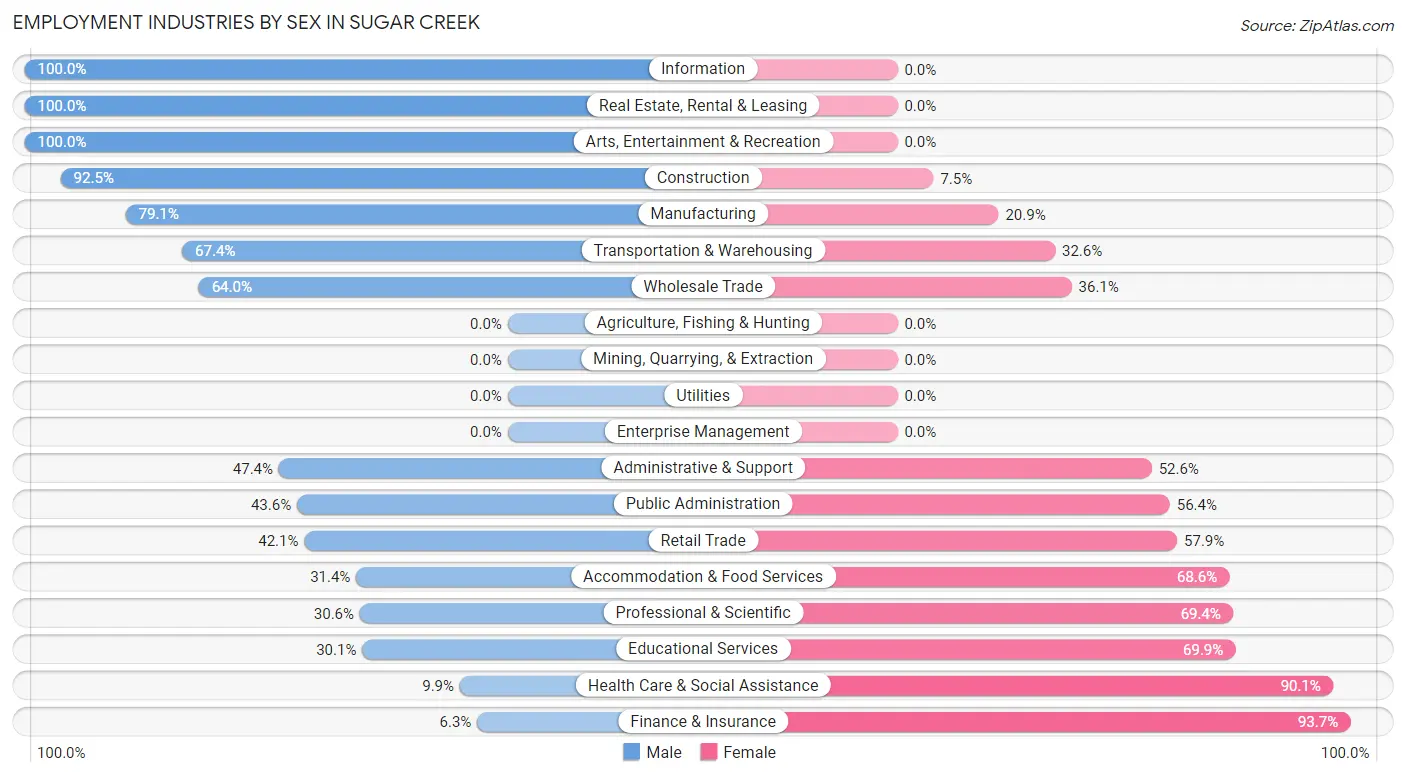
| Industry | Male | Female |
| Agriculture, Fishing & Hunting | 0 (0.0%) | 0 (0.0%) |
| Mining, Quarrying, & Extraction | 0 (0.0%) | 0 (0.0%) |
| Construction | 223 (92.5%) | 18 (7.5%) |
| Manufacturing | 155 (79.1%) | 41 (20.9%) |
| Wholesale Trade | 55 (63.9%) | 31 (36.0%) |
| Retail Trade | 48 (42.1%) | 66 (57.9%) |
| Transportation & Warehousing | 95 (67.4%) | 46 (32.6%) |
| Utilities | 0 (0.0%) | 0 (0.0%) |
| Information | 37 (100.0%) | 0 (0.0%) |
| Finance & Insurance | 5 (6.3%) | 74 (93.7%) |
| Real Estate, Rental & Leasing | 35 (100.0%) | 0 (0.0%) |
| Professional & Scientific | 15 (30.6%) | 34 (69.4%) |
| Enterprise Management | 0 (0.0%) | 0 (0.0%) |
| Administrative & Support | 9 (47.4%) | 10 (52.6%) |
| Educational Services | 28 (30.1%) | 65 (69.9%) |
| Health Care & Social Assistance | 21 (9.9%) | 191 (90.1%) |
| Arts, Entertainment & Recreation | 16 (100.0%) | 0 (0.0%) |
| Accommodation & Food Services | 37 (31.4%) | 81 (68.6%) |
| Public Administration | 41 (43.6%) | 53 (56.4%) |
| Total | 820 (53.6%) | 710 (46.4%) |
Education in Sugar Creek
School Enrollment in Sugar Creek
The most common levels of schooling among the 681 students in Sugar Creek are high school (189 | 27.8%), middle school (137 | 20.1%), and elementary school (105 | 15.4%).
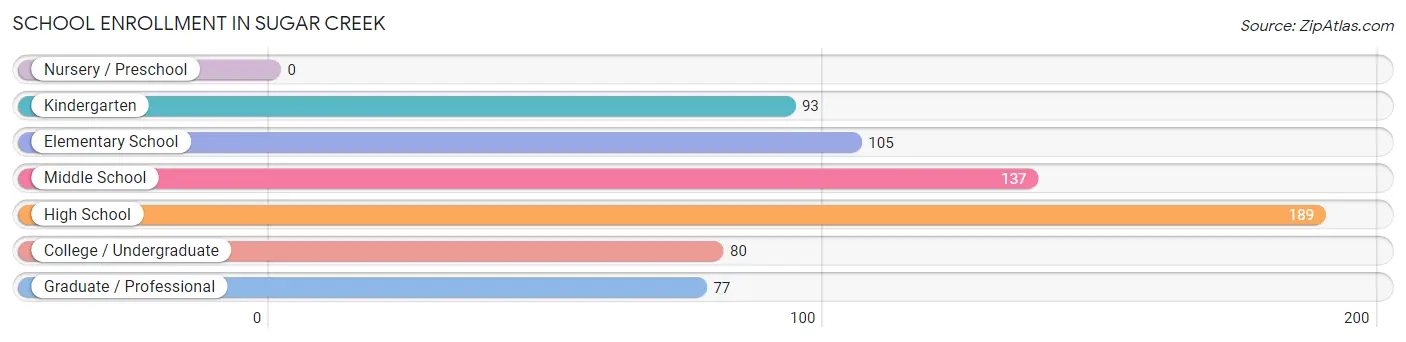
| School Level | # Students | % Students |
| Nursery / Preschool | 0 | 0.0% |
| Kindergarten | 93 | 13.7% |
| Elementary School | 105 | 15.4% |
| Middle School | 137 | 20.1% |
| High School | 189 | 27.8% |
| College / Undergraduate | 80 | 11.7% |
| Graduate / Professional | 77 | 11.3% |
| Total | 681 | 100.0% |
School Enrollment by Age by Funding Source in Sugar Creek
Out of a total of 681 students who are enrolled in schools in Sugar Creek, 95 (14.0%) attend a private institution, while the remaining 586 (86.0%) are enrolled in public schools. The age group of 15 to 17 year olds has the highest likelihood of being enrolled in private schools, with 42 (29.0% in the age bracket) enrolled. Conversely, the age group of 18 to 19 year olds has the lowest likelihood of being enrolled in a private school, with 66 (100.0% in the age bracket) attending a public institution.
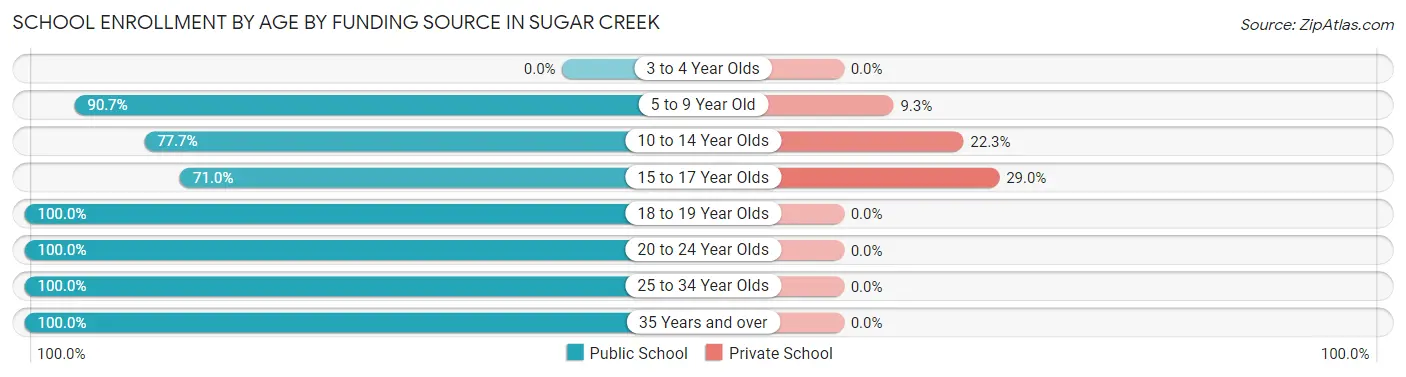
| Age Bracket | Public School | Private School |
| 3 to 4 Year Olds | 0 (0.0%) | 0 (0.0%) |
| 5 to 9 Year Old | 176 (90.7%) | 18 (9.3%) |
| 10 to 14 Year Olds | 122 (77.7%) | 35 (22.3%) |
| 15 to 17 Year Olds | 103 (71.0%) | 42 (29.0%) |
| 18 to 19 Year Olds | 66 (100.0%) | 0 (0.0%) |
| 20 to 24 Year Olds | 23 (100.0%) | 0 (0.0%) |
| 25 to 34 Year Olds | 53 (100.0%) | 0 (0.0%) |
| 35 Years and over | 43 (100.0%) | 0 (0.0%) |
| Total | 586 (86.0%) | 95 (14.0%) |
Educational Attainment by Field of Study in Sugar Creek
Visual & performing arts (109 | 24.7%), education (77 | 17.4%), business (59 | 13.4%), arts & humanities (51 | 11.5%), and social sciences (42 | 9.5%) are the most common fields of study among 442 individuals in Sugar Creek who have obtained a bachelor's degree or higher.
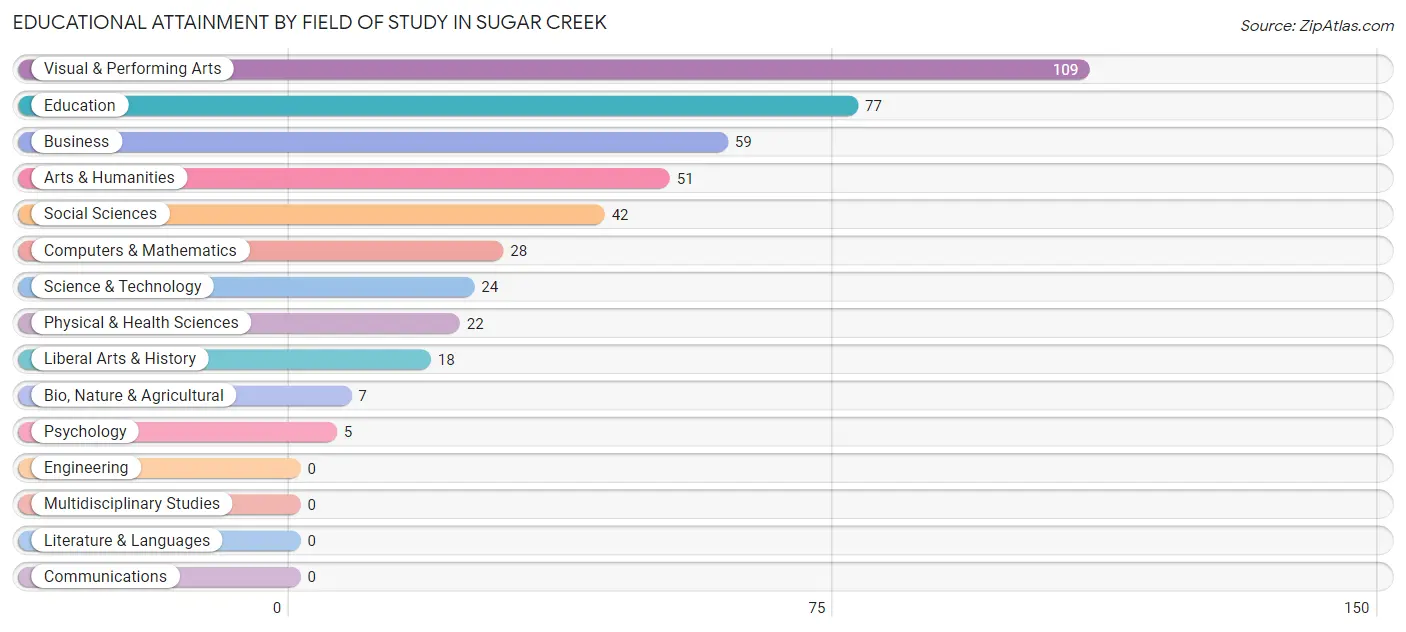
| Field of Study | # Graduates | % Graduates |
| Computers & Mathematics | 28 | 6.3% |
| Bio, Nature & Agricultural | 7 | 1.6% |
| Physical & Health Sciences | 22 | 5.0% |
| Psychology | 5 | 1.1% |
| Social Sciences | 42 | 9.5% |
| Engineering | 0 | 0.0% |
| Multidisciplinary Studies | 0 | 0.0% |
| Science & Technology | 24 | 5.4% |
| Business | 59 | 13.4% |
| Education | 77 | 17.4% |
| Literature & Languages | 0 | 0.0% |
| Liberal Arts & History | 18 | 4.1% |
| Visual & Performing Arts | 109 | 24.7% |
| Communications | 0 | 0.0% |
| Arts & Humanities | 51 | 11.5% |
| Total | 442 | 100.0% |
Transportation & Commute in Sugar Creek
Vehicle Availability by Sex in Sugar Creek
The most prevalent vehicle ownership categories in Sugar Creek are males with 2 vehicles (403, accounting for 50.1%) and females with 2 vehicles (329, making up 56.8%).
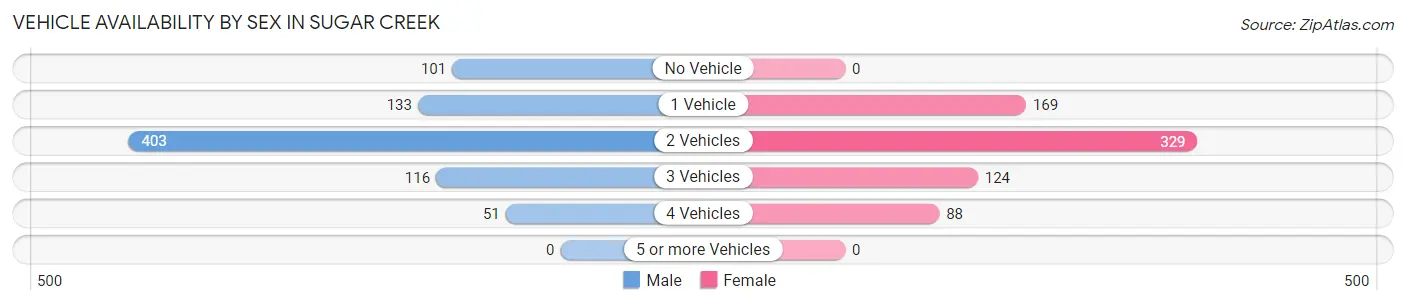
| Vehicles Available | Male | Female |
| No Vehicle | 101 (12.6%) | 0 (0.0%) |
| 1 Vehicle | 133 (16.5%) | 169 (23.8%) |
| 2 Vehicles | 403 (50.1%) | 329 (46.3%) |
| 3 Vehicles | 116 (14.4%) | 124 (17.5%) |
| 4 Vehicles | 51 (6.3%) | 88 (12.4%) |
| 5 or more Vehicles | 0 (0.0%) | 0 (0.0%) |
| Total | 804 (100.0%) | 710 (100.0%) |
Commute Time in Sugar Creek
The most frequently occuring commute durations in Sugar Creek are 30 to 34 minutes (357 commuters, 24.2%), 15 to 19 minutes (256 commuters, 17.4%), and 10 to 14 minutes (168 commuters, 11.4%).
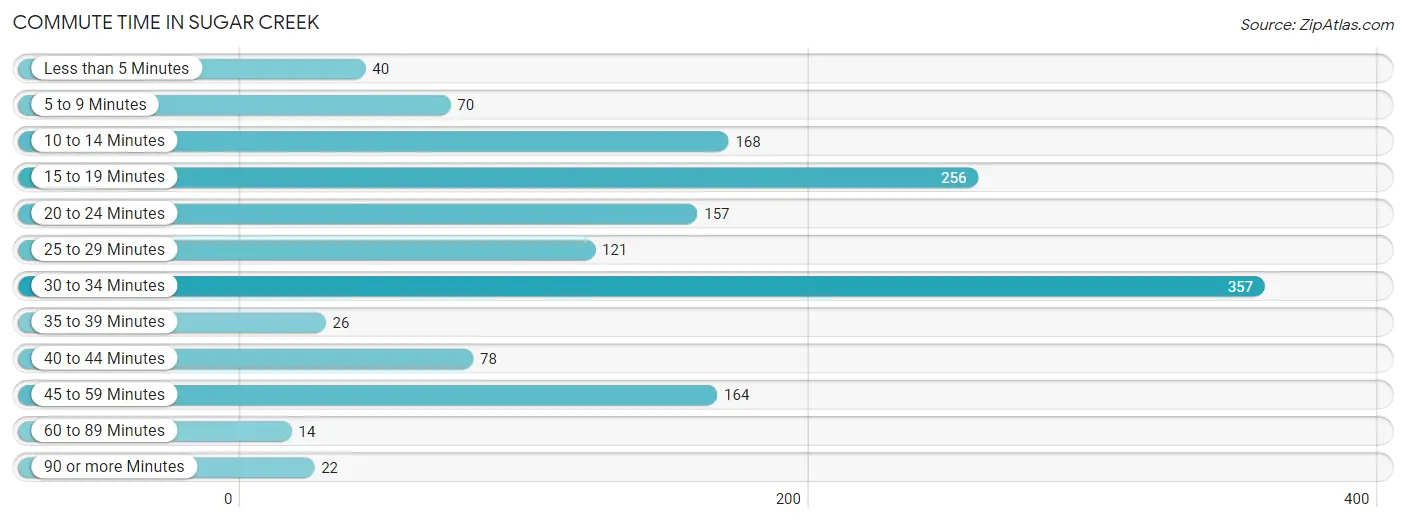
| Commute Time | # Commuters | % Commuters |
| Less than 5 Minutes | 40 | 2.7% |
| 5 to 9 Minutes | 70 | 4.8% |
| 10 to 14 Minutes | 168 | 11.4% |
| 15 to 19 Minutes | 256 | 17.4% |
| 20 to 24 Minutes | 157 | 10.7% |
| 25 to 29 Minutes | 121 | 8.2% |
| 30 to 34 Minutes | 357 | 24.2% |
| 35 to 39 Minutes | 26 | 1.8% |
| 40 to 44 Minutes | 78 | 5.3% |
| 45 to 59 Minutes | 164 | 11.1% |
| 60 to 89 Minutes | 14 | 0.9% |
| 90 or more Minutes | 22 | 1.5% |
Commute Time by Sex in Sugar Creek
The most common commute times in Sugar Creek are 30 to 34 minutes (177 commuters, 22.0%) for males and 30 to 34 minutes (180 commuters, 26.9%) for females.
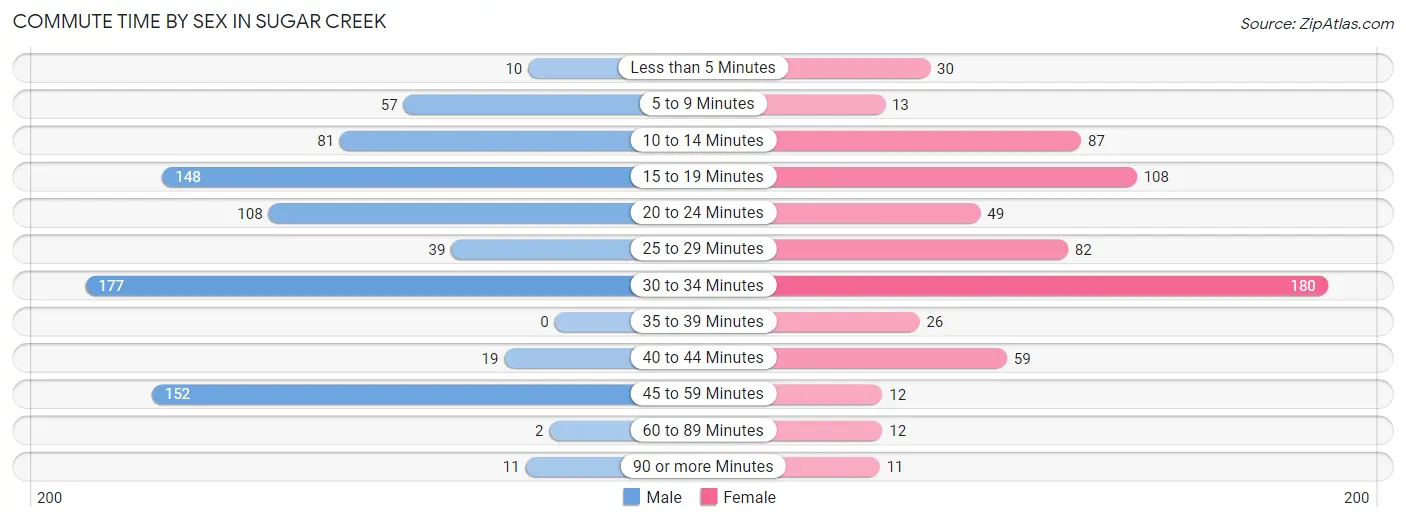
| Commute Time | Male | Female |
| Less than 5 Minutes | 10 (1.2%) | 30 (4.5%) |
| 5 to 9 Minutes | 57 (7.1%) | 13 (1.9%) |
| 10 to 14 Minutes | 81 (10.1%) | 87 (13.0%) |
| 15 to 19 Minutes | 148 (18.4%) | 108 (16.1%) |
| 20 to 24 Minutes | 108 (13.4%) | 49 (7.3%) |
| 25 to 29 Minutes | 39 (4.9%) | 82 (12.3%) |
| 30 to 34 Minutes | 177 (22.0%) | 180 (26.9%) |
| 35 to 39 Minutes | 0 (0.0%) | 26 (3.9%) |
| 40 to 44 Minutes | 19 (2.4%) | 59 (8.8%) |
| 45 to 59 Minutes | 152 (18.9%) | 12 (1.8%) |
| 60 to 89 Minutes | 2 (0.3%) | 12 (1.8%) |
| 90 or more Minutes | 11 (1.4%) | 11 (1.6%) |
Time of Departure to Work by Sex in Sugar Creek
The most frequent times of departure to work in Sugar Creek are 9:00 AM to 9:59 AM (166, 20.6%) for males and 7:00 AM to 7:29 AM (123, 18.4%) for females.
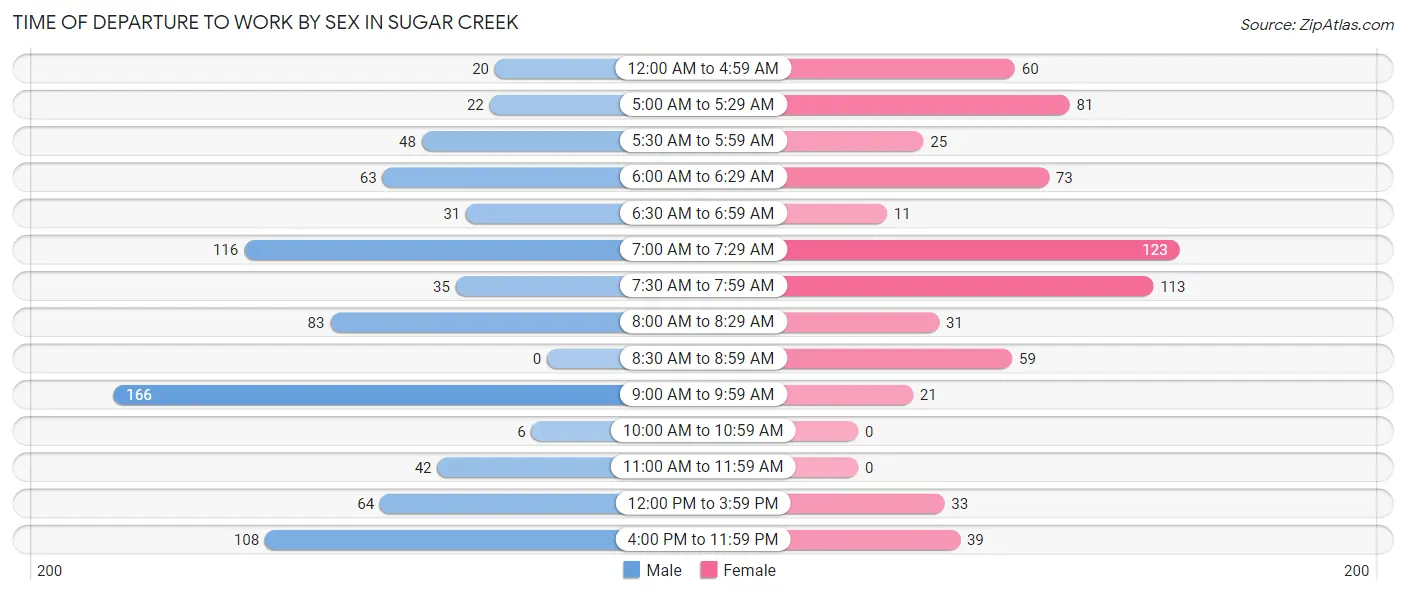
| Time of Departure | Male | Female |
| 12:00 AM to 4:59 AM | 20 (2.5%) | 60 (9.0%) |
| 5:00 AM to 5:29 AM | 22 (2.7%) | 81 (12.1%) |
| 5:30 AM to 5:59 AM | 48 (6.0%) | 25 (3.7%) |
| 6:00 AM to 6:29 AM | 63 (7.8%) | 73 (10.9%) |
| 6:30 AM to 6:59 AM | 31 (3.9%) | 11 (1.6%) |
| 7:00 AM to 7:29 AM | 116 (14.4%) | 123 (18.4%) |
| 7:30 AM to 7:59 AM | 35 (4.3%) | 113 (16.9%) |
| 8:00 AM to 8:29 AM | 83 (10.3%) | 31 (4.6%) |
| 8:30 AM to 8:59 AM | 0 (0.0%) | 59 (8.8%) |
| 9:00 AM to 9:59 AM | 166 (20.6%) | 21 (3.1%) |
| 10:00 AM to 10:59 AM | 6 (0.7%) | 0 (0.0%) |
| 11:00 AM to 11:59 AM | 42 (5.2%) | 0 (0.0%) |
| 12:00 PM to 3:59 PM | 64 (8.0%) | 33 (4.9%) |
| 4:00 PM to 11:59 PM | 108 (13.4%) | 39 (5.8%) |
| Total | 804 (100.0%) | 669 (100.0%) |
Housing Occupancy in Sugar Creek
Occupancy by Ownership in Sugar Creek
Of the total 1,299 dwellings in Sugar Creek, owner-occupied units account for 857 (66.0%), while renter-occupied units make up 442 (34.0%).
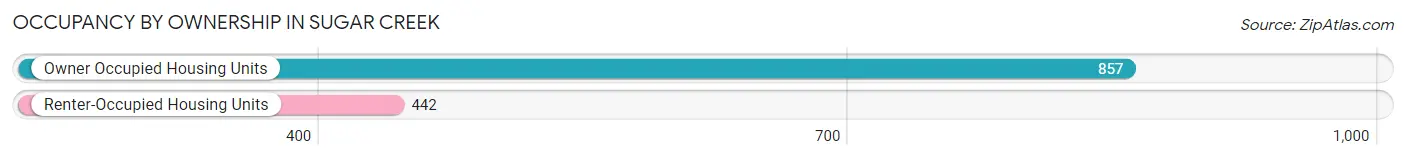
| Occupancy | # Housing Units | % Housing Units |
| Owner Occupied Housing Units | 857 | 66.0% |
| Renter-Occupied Housing Units | 442 | 34.0% |
| Total Occupied Housing Units | 1,299 | 100.0% |
Occupancy by Household Size in Sugar Creek
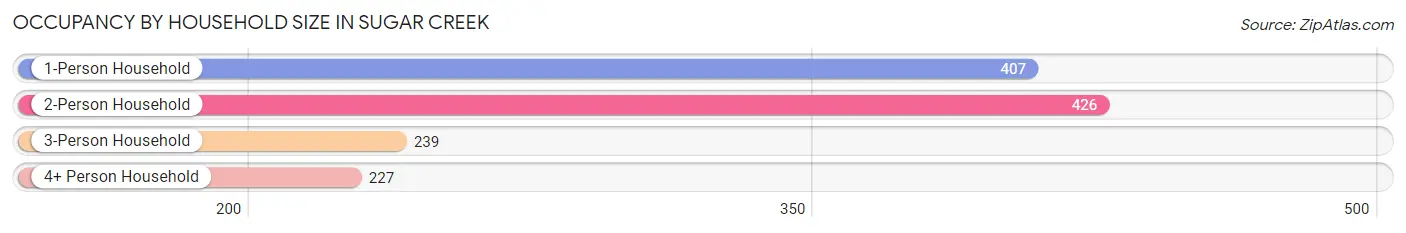
| Household Size | # Housing Units | % Housing Units |
| 1-Person Household | 407 | 31.3% |
| 2-Person Household | 426 | 32.8% |
| 3-Person Household | 239 | 18.4% |
| 4+ Person Household | 227 | 17.5% |
| Total Housing Units | 1,299 | 100.0% |
Occupancy by Ownership by Household Size in Sugar Creek
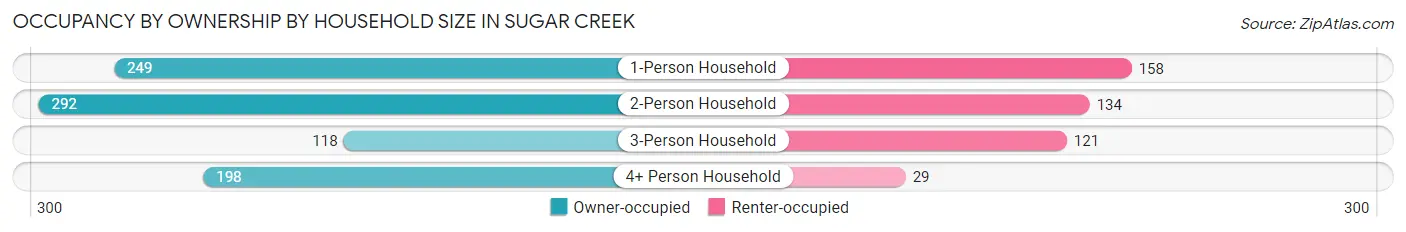
| Household Size | Owner-occupied | Renter-occupied |
| 1-Person Household | 249 (61.2%) | 158 (38.8%) |
| 2-Person Household | 292 (68.5%) | 134 (31.5%) |
| 3-Person Household | 118 (49.4%) | 121 (50.6%) |
| 4+ Person Household | 198 (87.2%) | 29 (12.8%) |
| Total Housing Units | 857 (66.0%) | 442 (34.0%) |
Occupancy by Educational Attainment in Sugar Creek
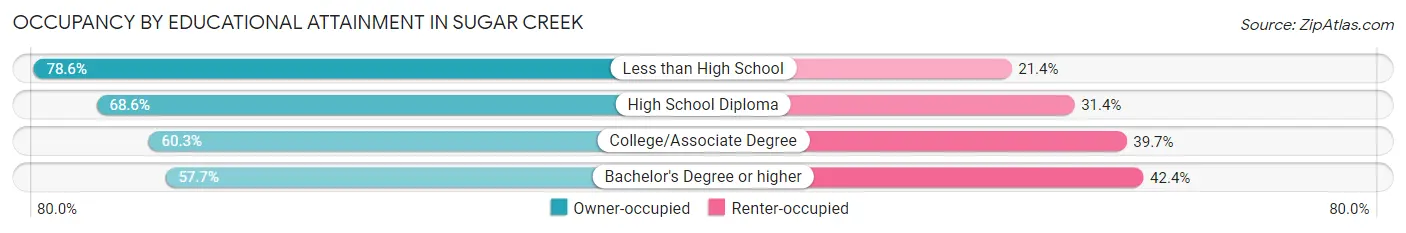
| Household Size | Owner-occupied | Renter-occupied |
| Less than High School | 154 (78.6%) | 42 (21.4%) |
| High School Diploma | 369 (68.6%) | 169 (31.4%) |
| College/Associate Degree | 187 (60.3%) | 123 (39.7%) |
| Bachelor's Degree or higher | 147 (57.7%) | 108 (42.3%) |
Occupancy by Age of Householder in Sugar Creek
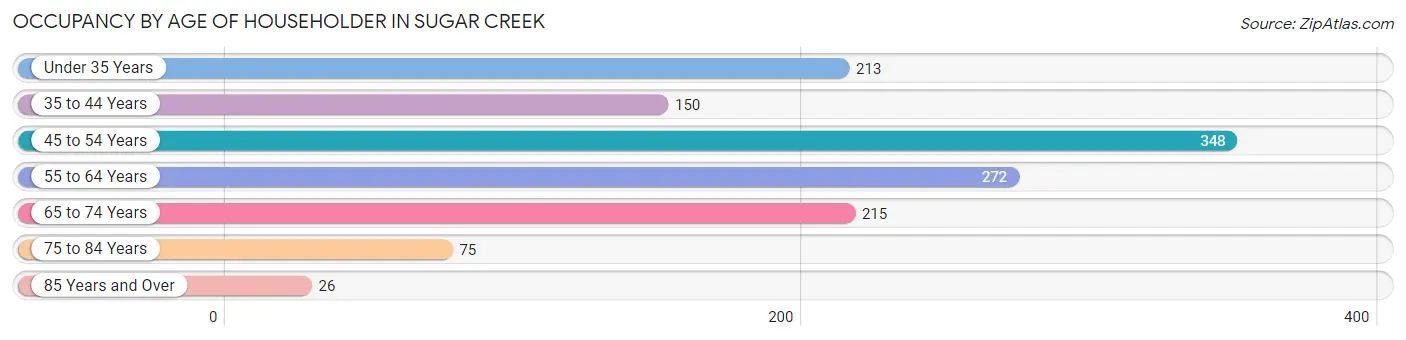
| Age Bracket | # Households | % Households |
| Under 35 Years | 213 | 16.4% |
| 35 to 44 Years | 150 | 11.6% |
| 45 to 54 Years | 348 | 26.8% |
| 55 to 64 Years | 272 | 20.9% |
| 65 to 74 Years | 215 | 16.6% |
| 75 to 84 Years | 75 | 5.8% |
| 85 Years and Over | 26 | 2.0% |
| Total | 1,299 | 100.0% |
Housing Finances in Sugar Creek
Median Income by Occupancy in Sugar Creek
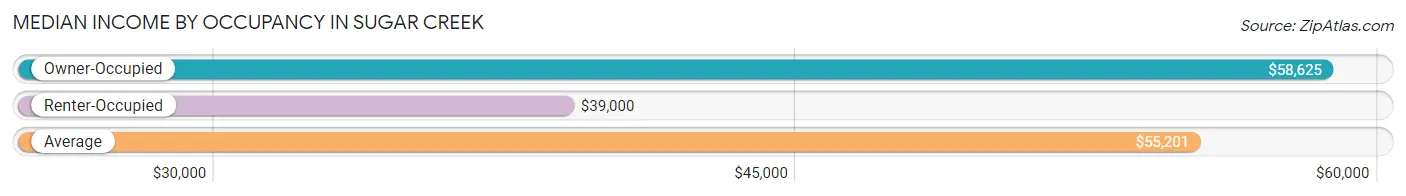
| Occupancy Type | # Households | Median Income |
| Owner-Occupied | 857 (66.0%) | $58,625 |
| Renter-Occupied | 442 (34.0%) | $39,000 |
| Average | 1,299 (100.0%) | $55,201 |
Occupancy by Householder Income Bracket in Sugar Creek
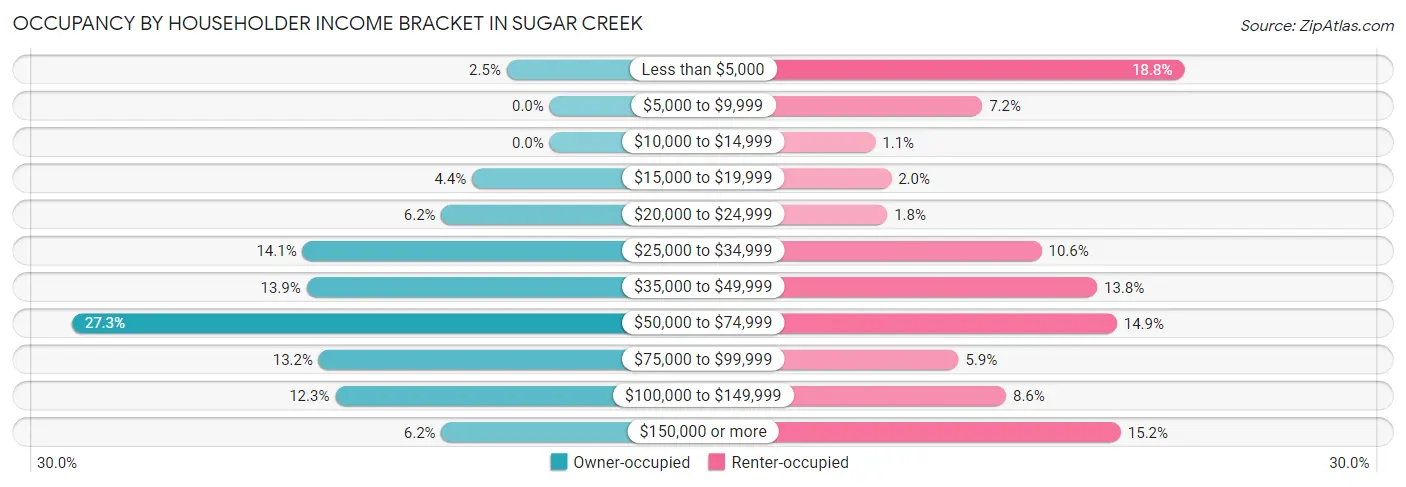
| Income Bracket | Owner-occupied | Renter-occupied |
| Less than $5,000 | 21 (2.5%) | 83 (18.8%) |
| $5,000 to $9,999 | 0 (0.0%) | 32 (7.2%) |
| $10,000 to $14,999 | 0 (0.0%) | 5 (1.1%) |
| $15,000 to $19,999 | 38 (4.4%) | 9 (2.0%) |
| $20,000 to $24,999 | 53 (6.2%) | 8 (1.8%) |
| $25,000 to $34,999 | 121 (14.1%) | 47 (10.6%) |
| $35,000 to $49,999 | 119 (13.9%) | 61 (13.8%) |
| $50,000 to $74,999 | 234 (27.3%) | 66 (14.9%) |
| $75,000 to $99,999 | 113 (13.2%) | 26 (5.9%) |
| $100,000 to $149,999 | 105 (12.2%) | 38 (8.6%) |
| $150,000 or more | 53 (6.2%) | 67 (15.2%) |
| Total | 857 (100.0%) | 442 (100.0%) |
Monthly Housing Cost Tiers in Sugar Creek
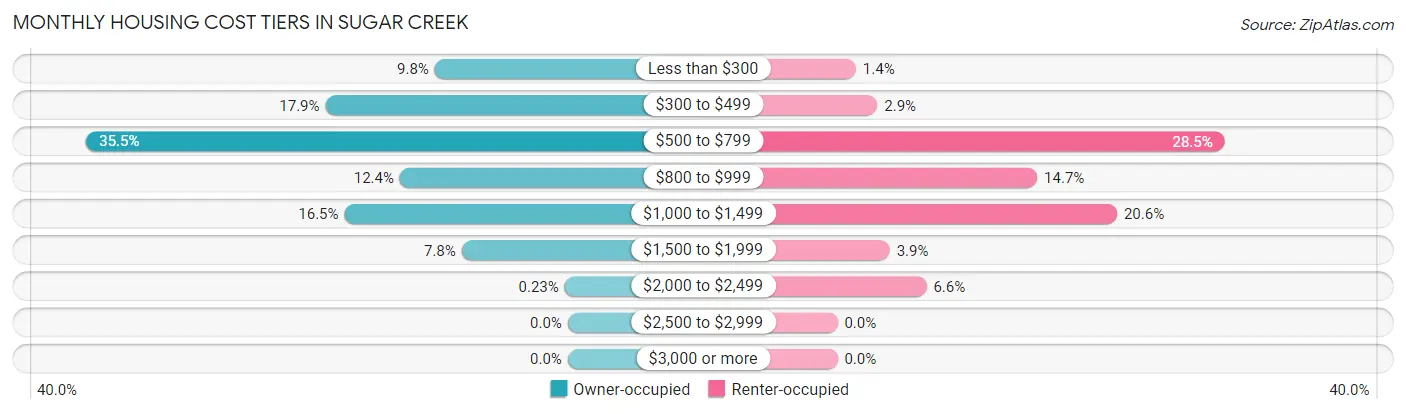
| Monthly Cost | Owner-occupied | Renter-occupied |
| Less than $300 | 84 (9.8%) | 6 (1.4%) |
| $300 to $499 | 153 (17.8%) | 13 (2.9%) |
| $500 to $799 | 304 (35.5%) | 126 (28.5%) |
| $800 to $999 | 106 (12.4%) | 65 (14.7%) |
| $1,000 to $1,499 | 141 (16.5%) | 91 (20.6%) |
| $1,500 to $1,999 | 67 (7.8%) | 17 (3.8%) |
| $2,000 to $2,499 | 2 (0.2%) | 29 (6.6%) |
| $2,500 to $2,999 | 0 (0.0%) | 0 (0.0%) |
| $3,000 or more | 0 (0.0%) | 0 (0.0%) |
| Total | 857 (100.0%) | 442 (100.0%) |
Physical Housing Characteristics in Sugar Creek
Housing Structures in Sugar Creek
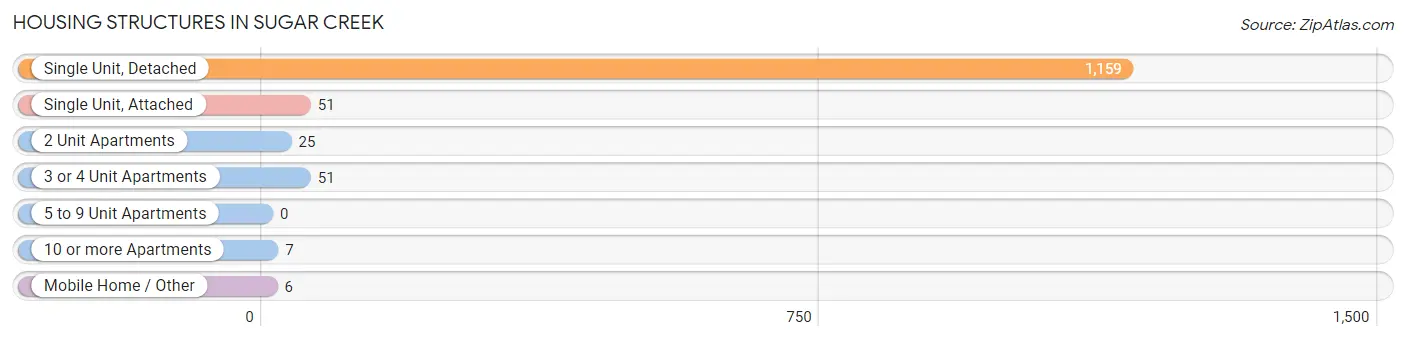
| Structure Type | # Housing Units | % Housing Units |
| Single Unit, Detached | 1,159 | 89.2% |
| Single Unit, Attached | 51 | 3.9% |
| 2 Unit Apartments | 25 | 1.9% |
| 3 or 4 Unit Apartments | 51 | 3.9% |
| 5 to 9 Unit Apartments | 0 | 0.0% |
| 10 or more Apartments | 7 | 0.5% |
| Mobile Home / Other | 6 | 0.5% |
| Total | 1,299 | 100.0% |
Housing Structures by Occupancy in Sugar Creek
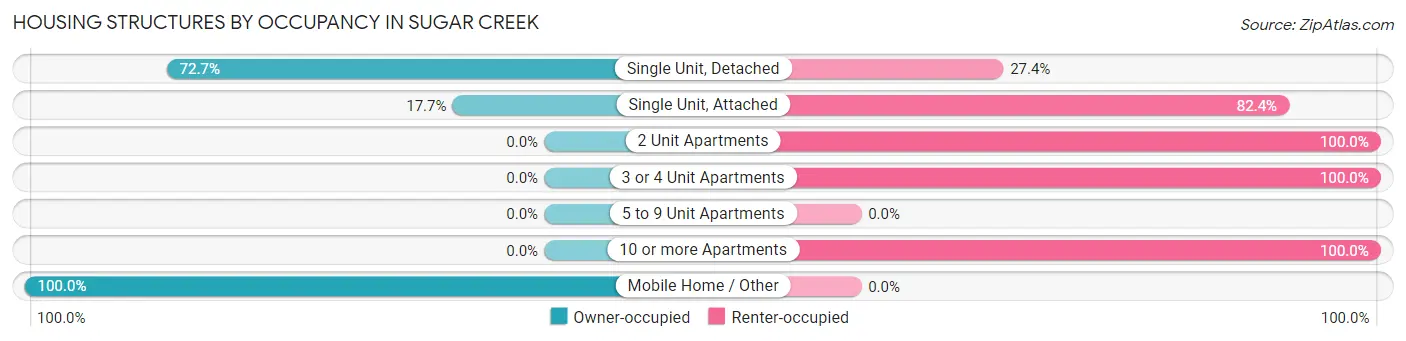
| Structure Type | Owner-occupied | Renter-occupied |
| Single Unit, Detached | 842 (72.7%) | 317 (27.4%) |
| Single Unit, Attached | 9 (17.6%) | 42 (82.4%) |
| 2 Unit Apartments | 0 (0.0%) | 25 (100.0%) |
| 3 or 4 Unit Apartments | 0 (0.0%) | 51 (100.0%) |
| 5 to 9 Unit Apartments | 0 (0.0%) | 0 (0.0%) |
| 10 or more Apartments | 0 (0.0%) | 7 (100.0%) |
| Mobile Home / Other | 6 (100.0%) | 0 (0.0%) |
| Total | 857 (66.0%) | 442 (34.0%) |
Housing Structures by Number of Rooms in Sugar Creek
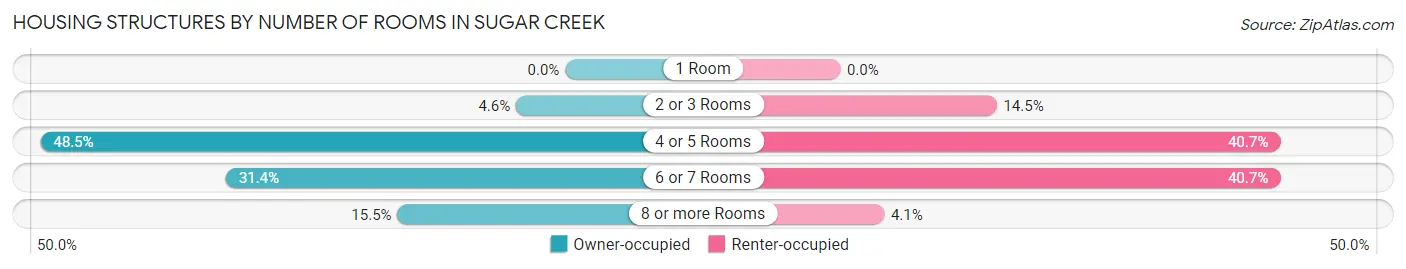
| Number of Rooms | Owner-occupied | Renter-occupied |
| 1 Room | 0 (0.0%) | 0 (0.0%) |
| 2 or 3 Rooms | 39 (4.5%) | 64 (14.5%) |
| 4 or 5 Rooms | 416 (48.5%) | 180 (40.7%) |
| 6 or 7 Rooms | 269 (31.4%) | 180 (40.7%) |
| 8 or more Rooms | 133 (15.5%) | 18 (4.1%) |
| Total | 857 (100.0%) | 442 (100.0%) |
Housing Structure by Heating Type in Sugar Creek
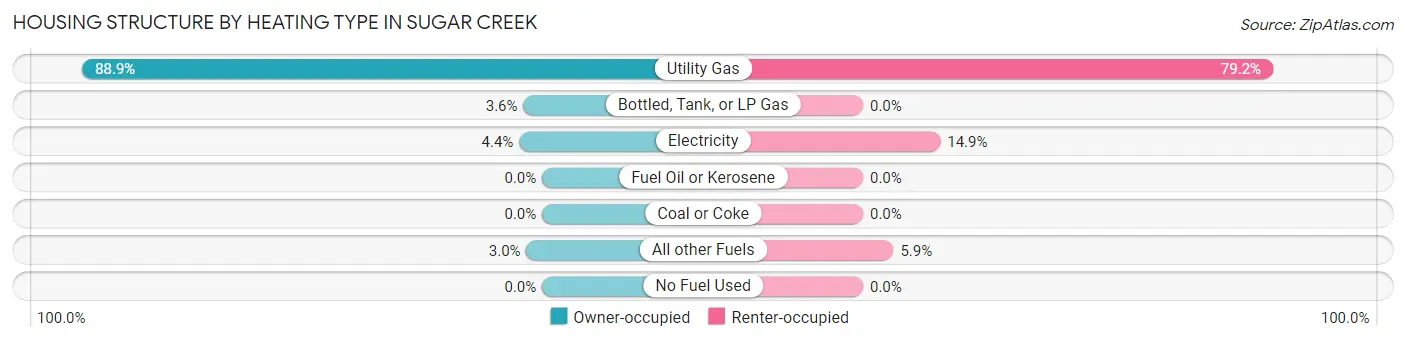
| Heating Type | Owner-occupied | Renter-occupied |
| Utility Gas | 762 (88.9%) | 350 (79.2%) |
| Bottled, Tank, or LP Gas | 31 (3.6%) | 0 (0.0%) |
| Electricity | 38 (4.4%) | 66 (14.9%) |
| Fuel Oil or Kerosene | 0 (0.0%) | 0 (0.0%) |
| Coal or Coke | 0 (0.0%) | 0 (0.0%) |
| All other Fuels | 26 (3.0%) | 26 (5.9%) |
| No Fuel Used | 0 (0.0%) | 0 (0.0%) |
| Total | 857 (100.0%) | 442 (100.0%) |
Household Vehicle Usage in Sugar Creek
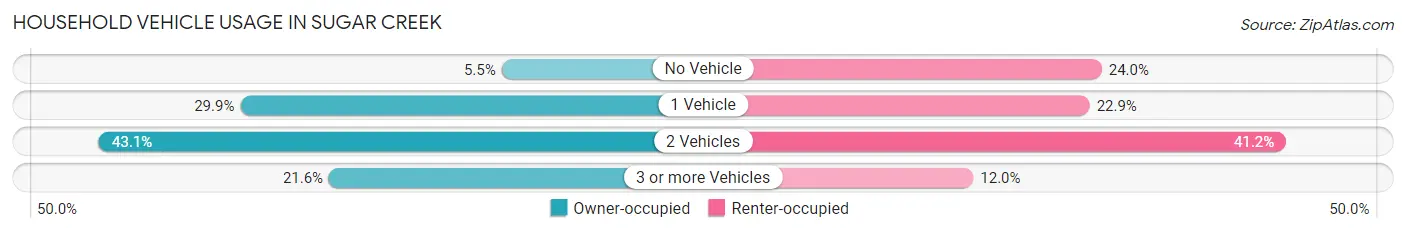
| Vehicles per Household | Owner-occupied | Renter-occupied |
| No Vehicle | 47 (5.5%) | 106 (24.0%) |
| 1 Vehicle | 256 (29.9%) | 101 (22.9%) |
| 2 Vehicles | 369 (43.1%) | 182 (41.2%) |
| 3 or more Vehicles | 185 (21.6%) | 53 (12.0%) |
| Total | 857 (100.0%) | 442 (100.0%) |
Real Estate & Mortgages in Sugar Creek
Real Estate and Mortgage Overview in Sugar Creek
| Characteristic | Without Mortgage | With Mortgage |
| Housing Units | 422 | 435 |
| Median Property Value | $84,800 | $88,700 |
| Median Household Income | $48,478 | $31 |
| Monthly Housing Costs | $470 | $0 |
| Real Estate Taxes | $1,459 | $32 |
Property Value by Mortgage Status in Sugar Creek
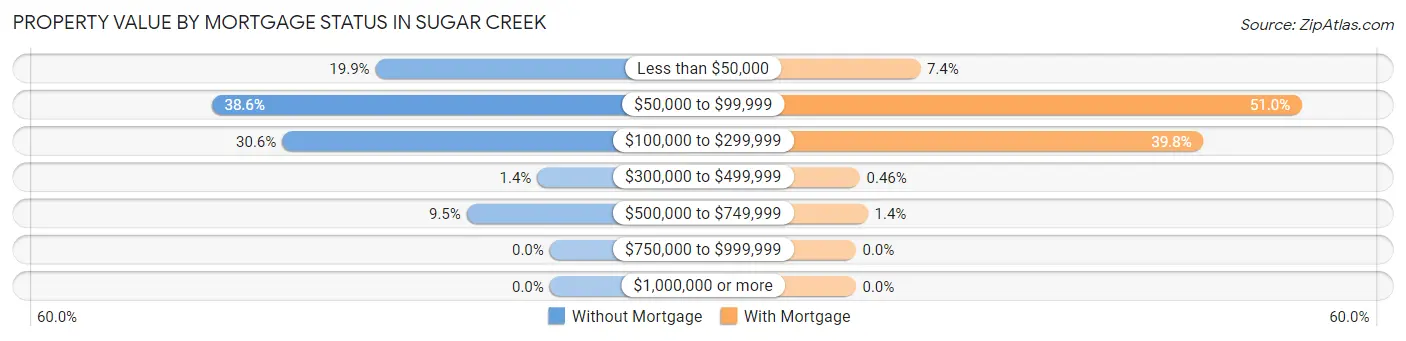
| Property Value | Without Mortgage | With Mortgage |
| Less than $50,000 | 84 (19.9%) | 32 (7.4%) |
| $50,000 to $99,999 | 163 (38.6%) | 222 (51.0%) |
| $100,000 to $299,999 | 129 (30.6%) | 173 (39.8%) |
| $300,000 to $499,999 | 6 (1.4%) | 2 (0.5%) |
| $500,000 to $749,999 | 40 (9.5%) | 6 (1.4%) |
| $750,000 to $999,999 | 0 (0.0%) | 0 (0.0%) |
| $1,000,000 or more | 0 (0.0%) | 0 (0.0%) |
| Total | 422 (100.0%) | 435 (100.0%) |
Household Income by Mortgage Status in Sugar Creek
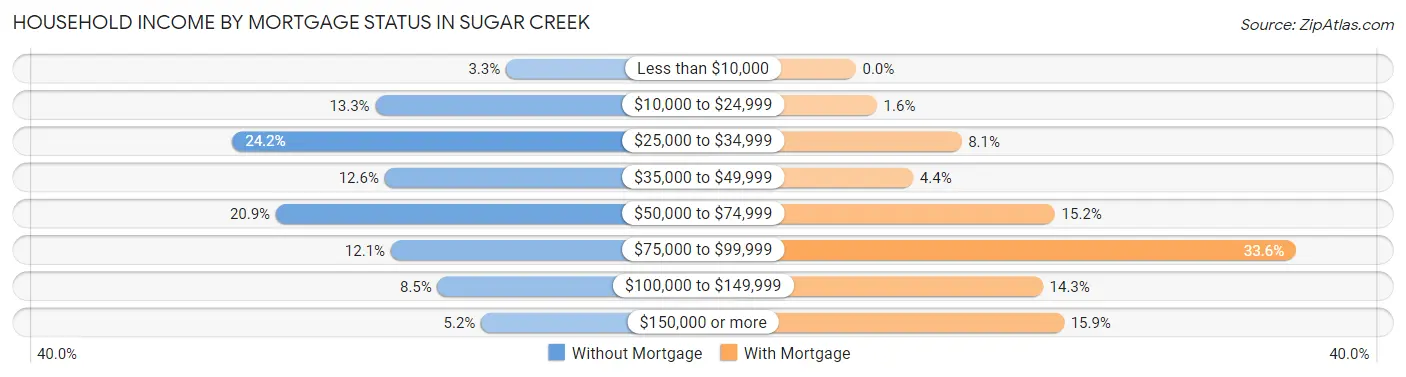
| Household Income | Without Mortgage | With Mortgage |
| Less than $10,000 | 14 (3.3%) | 0 (0.0%) |
| $10,000 to $24,999 | 56 (13.3%) | 7 (1.6%) |
| $25,000 to $34,999 | 102 (24.2%) | 35 (8.1%) |
| $35,000 to $49,999 | 53 (12.6%) | 19 (4.4%) |
| $50,000 to $74,999 | 88 (20.8%) | 66 (15.2%) |
| $75,000 to $99,999 | 51 (12.1%) | 146 (33.6%) |
| $100,000 to $149,999 | 36 (8.5%) | 62 (14.2%) |
| $150,000 or more | 22 (5.2%) | 69 (15.9%) |
| Total | 422 (100.0%) | 435 (100.0%) |
Property Value to Household Income Ratio in Sugar Creek
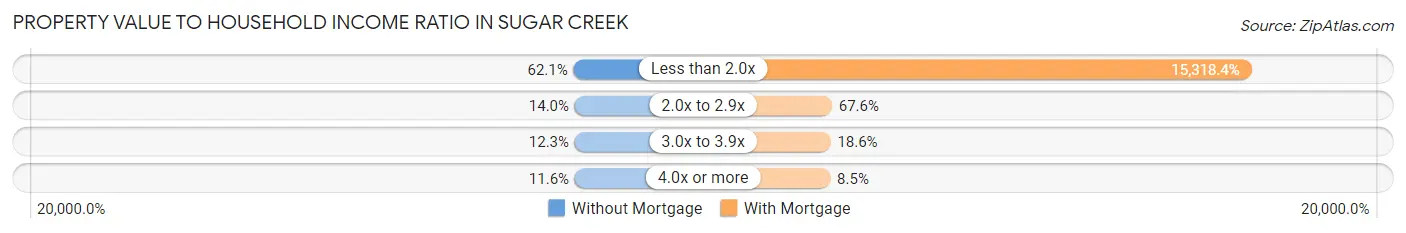
| Value-to-Income Ratio | Without Mortgage | With Mortgage |
| Less than 2.0x | 262 (62.1%) | 66,635 (15,318.4%) |
| 2.0x to 2.9x | 59 (14.0%) | 294 (67.6%) |
| 3.0x to 3.9x | 52 (12.3%) | 81 (18.6%) |
| 4.0x or more | 49 (11.6%) | 37 (8.5%) |
| Total | 422 (100.0%) | 435 (100.0%) |
Real Estate Taxes by Mortgage Status in Sugar Creek
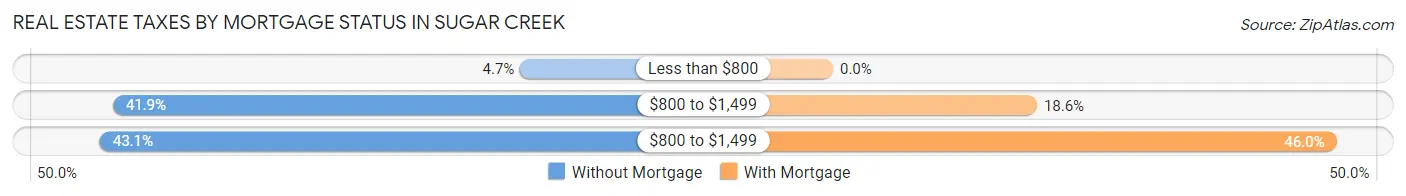
| Property Taxes | Without Mortgage | With Mortgage |
| Less than $800 | 20 (4.7%) | 0 (0.0%) |
| $800 to $1,499 | 177 (41.9%) | 81 (18.6%) |
| $800 to $1,499 | 182 (43.1%) | 200 (46.0%) |
| Total | 422 (100.0%) | 435 (100.0%) |
Health & Disability in Sugar Creek
Health Insurance Coverage by Age in Sugar Creek
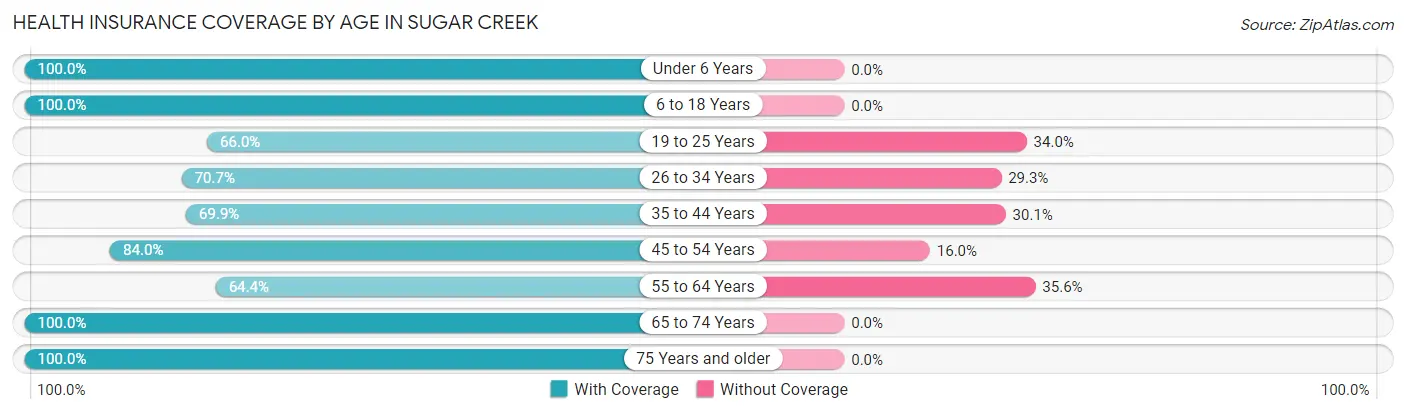
| Age Bracket | With Coverage | Without Coverage |
| Under 6 Years | 212 (100.0%) | 0 (0.0%) |
| 6 to 18 Years | 535 (100.0%) | 0 (0.0%) |
| 19 to 25 Years | 130 (66.0%) | 67 (34.0%) |
| 26 to 34 Years | 278 (70.7%) | 115 (29.3%) |
| 35 to 44 Years | 244 (69.9%) | 105 (30.1%) |
| 45 to 54 Years | 516 (84.0%) | 98 (16.0%) |
| 55 to 64 Years | 307 (64.4%) | 170 (35.6%) |
| 65 to 74 Years | 309 (100.0%) | 0 (0.0%) |
| 75 Years and older | 161 (100.0%) | 0 (0.0%) |
| Total | 2,692 (82.9%) | 555 (17.1%) |
Health Insurance Coverage by Citizenship Status in Sugar Creek

| Citizenship Status | With Coverage | Without Coverage |
| Native Born | 212 (100.0%) | 0 (0.0%) |
| Foreign Born, Citizen | 535 (100.0%) | 0 (0.0%) |
| Foreign Born, not a Citizen | 130 (66.0%) | 67 (34.0%) |
Health Insurance Coverage by Household Income in Sugar Creek
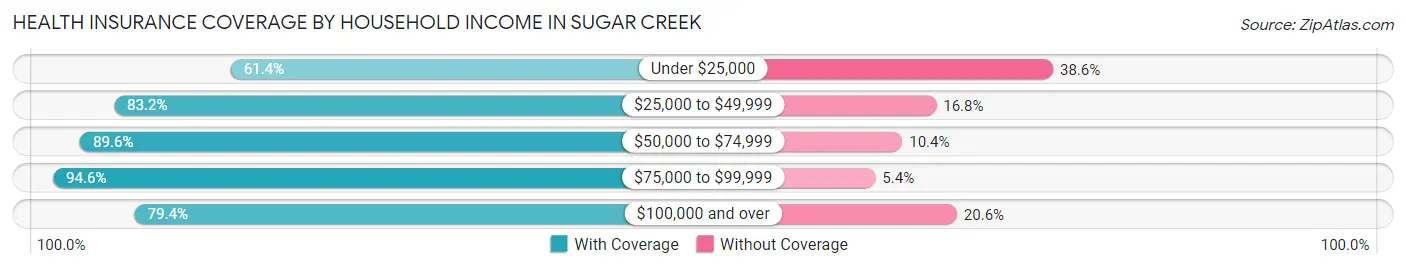
| Household Income | With Coverage | Without Coverage |
| Under $25,000 | 208 (61.4%) | 131 (38.6%) |
| $25,000 to $49,999 | 581 (83.2%) | 117 (16.8%) |
| $50,000 to $74,999 | 853 (89.6%) | 99 (10.4%) |
| $75,000 to $99,999 | 318 (94.6%) | 18 (5.4%) |
| $100,000 and over | 731 (79.4%) | 190 (20.6%) |
Public vs Private Health Insurance Coverage by Age in Sugar Creek
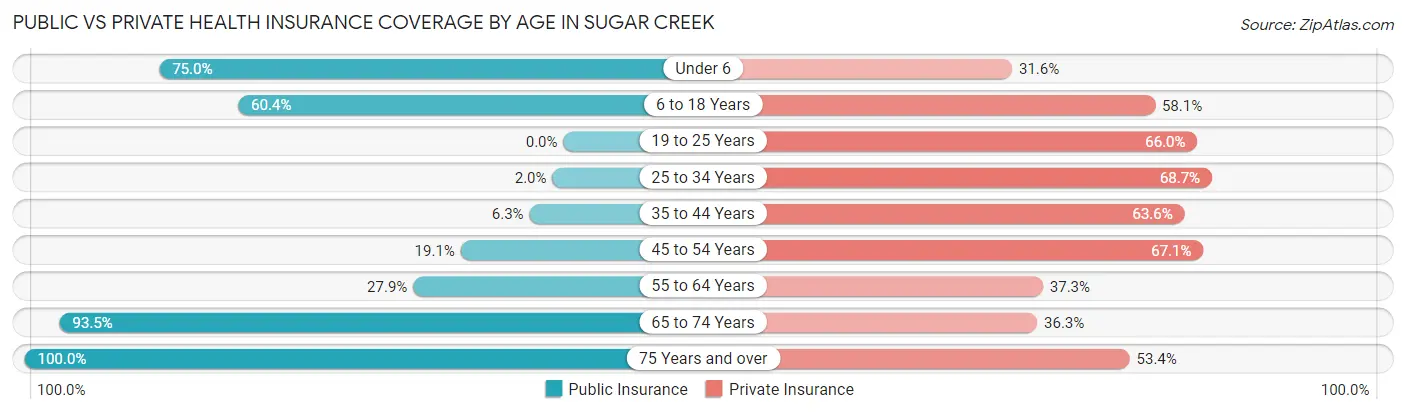
| Age Bracket | Public Insurance | Private Insurance |
| Under 6 | 159 (75.0%) | 67 (31.6%) |
| 6 to 18 Years | 323 (60.4%) | 311 (58.1%) |
| 19 to 25 Years | 0 (0.0%) | 130 (66.0%) |
| 25 to 34 Years | 8 (2.0%) | 270 (68.7%) |
| 35 to 44 Years | 22 (6.3%) | 222 (63.6%) |
| 45 to 54 Years | 117 (19.1%) | 412 (67.1%) |
| 55 to 64 Years | 133 (27.9%) | 178 (37.3%) |
| 65 to 74 Years | 289 (93.5%) | 112 (36.2%) |
| 75 Years and over | 161 (100.0%) | 86 (53.4%) |
| Total | 1,212 (37.3%) | 1,788 (55.1%) |
Disability Status by Sex by Age in Sugar Creek
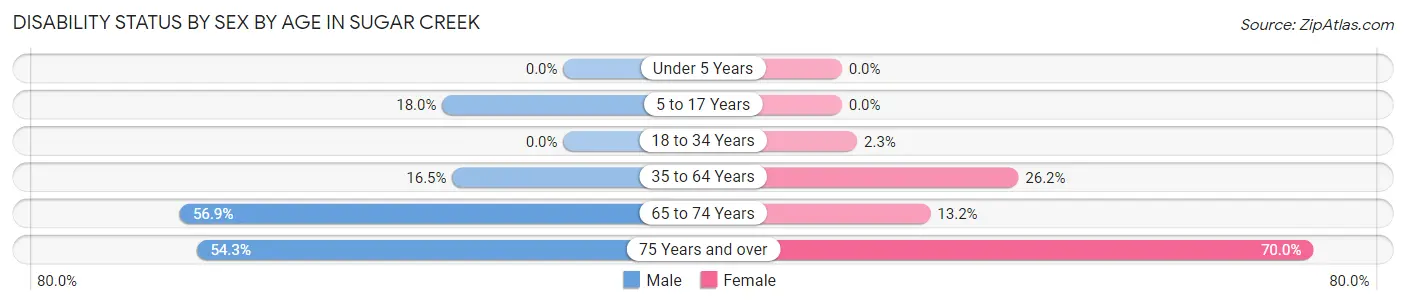
| Age Bracket | Male | Female |
| Under 5 Years | 0 (0.0%) | 0 (0.0%) |
| 5 to 17 Years | 48 (18.0%) | 0 (0.0%) |
| 18 to 34 Years | 0 (0.0%) | 8 (2.3%) |
| 35 to 64 Years | 133 (16.5%) | 166 (26.2%) |
| 65 to 74 Years | 111 (56.9%) | 15 (13.2%) |
| 75 Years and over | 44 (54.3%) | 56 (70.0%) |
Disability Class by Sex by Age in Sugar Creek
Disability Class: Hearing Difficulty
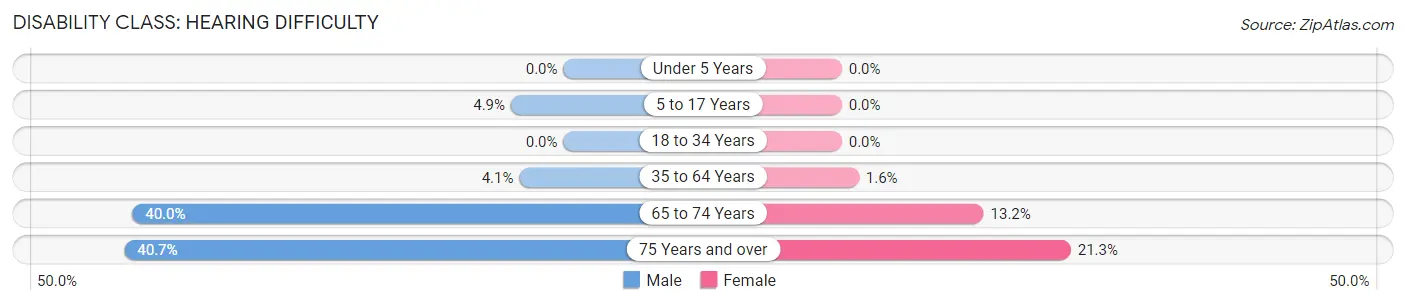
| Age Bracket | Male | Female |
| Under 5 Years | 0 (0.0%) | 0 (0.0%) |
| 5 to 17 Years | 13 (4.9%) | 0 (0.0%) |
| 18 to 34 Years | 0 (0.0%) | 0 (0.0%) |
| 35 to 64 Years | 33 (4.1%) | 10 (1.6%) |
| 65 to 74 Years | 78 (40.0%) | 15 (13.2%) |
| 75 Years and over | 33 (40.7%) | 17 (21.2%) |
Disability Class: Vision Difficulty
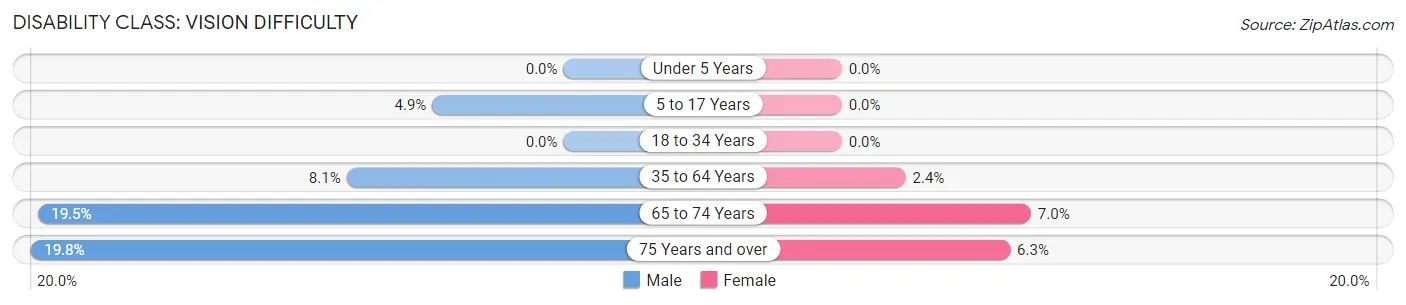
| Age Bracket | Male | Female |
| Under 5 Years | 0 (0.0%) | 0 (0.0%) |
| 5 to 17 Years | 13 (4.9%) | 0 (0.0%) |
| 18 to 34 Years | 0 (0.0%) | 0 (0.0%) |
| 35 to 64 Years | 65 (8.1%) | 15 (2.4%) |
| 65 to 74 Years | 38 (19.5%) | 8 (7.0%) |
| 75 Years and over | 16 (19.8%) | 5 (6.2%) |
Disability Class: Cognitive Difficulty
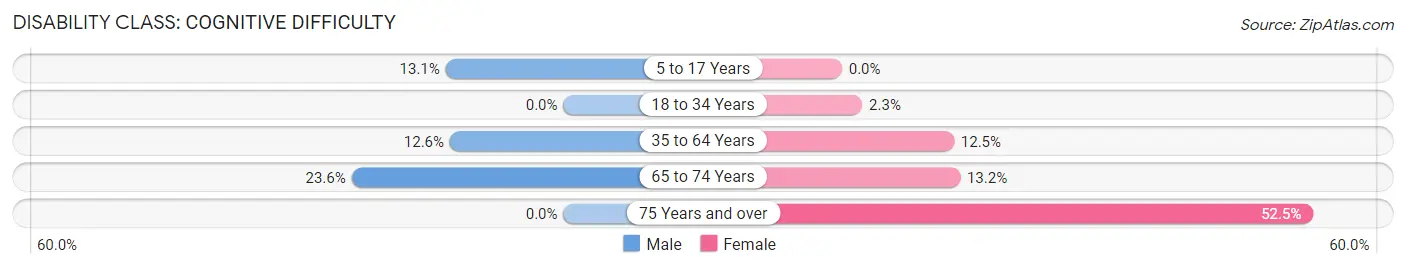
| Age Bracket | Male | Female |
| 5 to 17 Years | 35 (13.1%) | 0 (0.0%) |
| 18 to 34 Years | 0 (0.0%) | 8 (2.3%) |
| 35 to 64 Years | 102 (12.6%) | 79 (12.5%) |
| 65 to 74 Years | 46 (23.6%) | 15 (13.2%) |
| 75 Years and over | 0 (0.0%) | 42 (52.5%) |
Disability Class: Ambulatory Difficulty
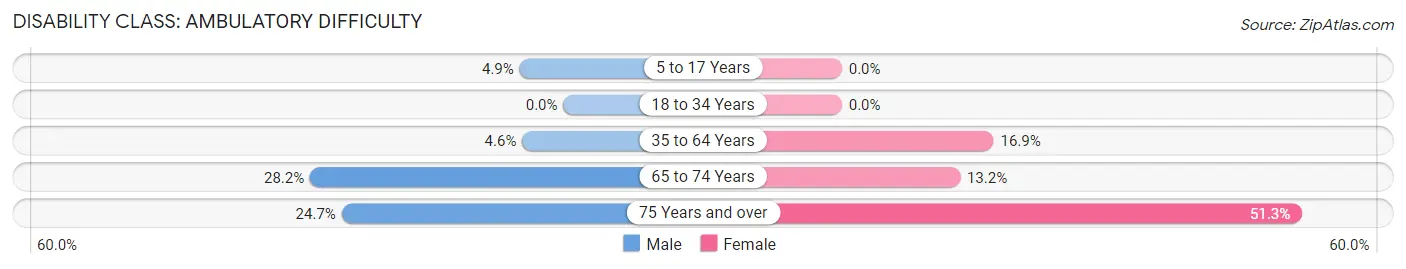
| Age Bracket | Male | Female |
| 5 to 17 Years | 13 (4.9%) | 0 (0.0%) |
| 18 to 34 Years | 0 (0.0%) | 0 (0.0%) |
| 35 to 64 Years | 37 (4.6%) | 107 (16.9%) |
| 65 to 74 Years | 55 (28.2%) | 15 (13.2%) |
| 75 Years and over | 20 (24.7%) | 41 (51.2%) |
Disability Class: Self-Care Difficulty
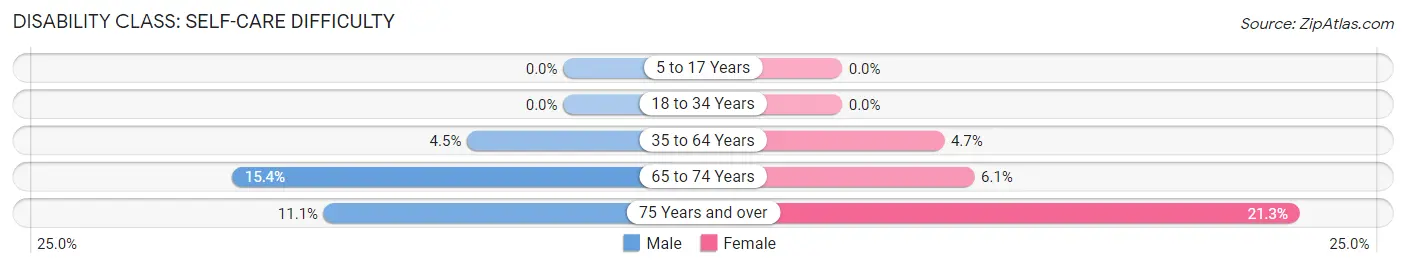
| Age Bracket | Male | Female |
| 5 to 17 Years | 0 (0.0%) | 0 (0.0%) |
| 18 to 34 Years | 0 (0.0%) | 0 (0.0%) |
| 35 to 64 Years | 36 (4.5%) | 30 (4.7%) |
| 65 to 74 Years | 30 (15.4%) | 7 (6.1%) |
| 75 Years and over | 9 (11.1%) | 17 (21.2%) |
Technology Access in Sugar Creek
Computing Device Access in Sugar Creek
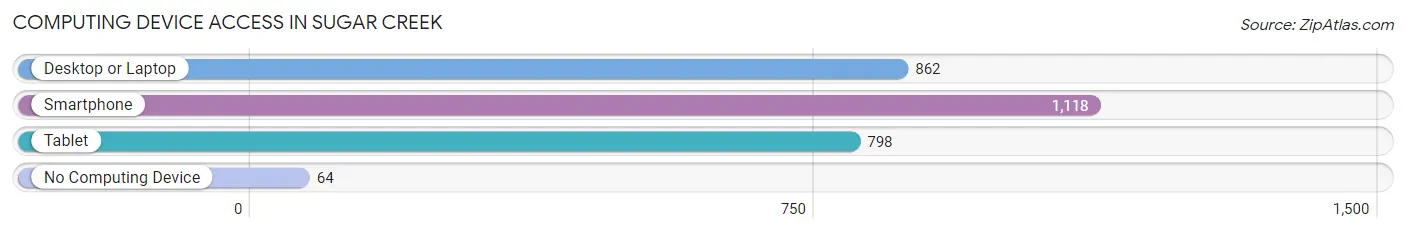
| Device Type | # Households | % Households |
| Desktop or Laptop | 862 | 66.4% |
| Smartphone | 1,118 | 86.1% |
| Tablet | 798 | 61.4% |
| No Computing Device | 64 | 4.9% |
| Total | 1,299 | 100.0% |
Internet Access in Sugar Creek
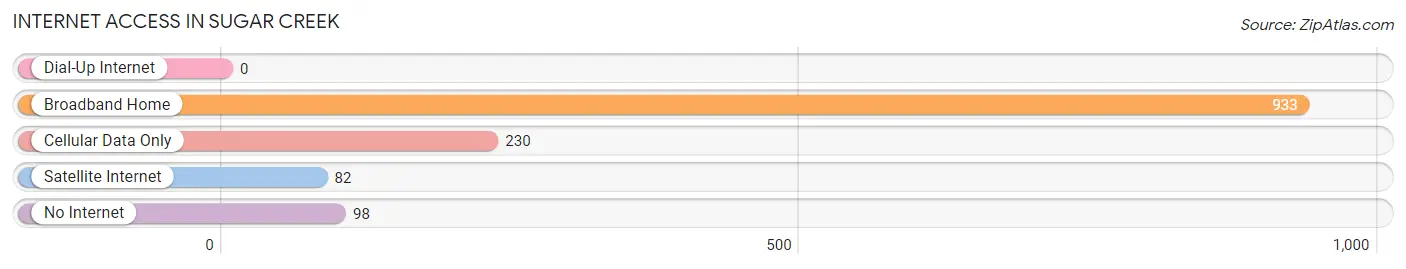
| Internet Type | # Households | % Households |
| Dial-Up Internet | 0 | 0.0% |
| Broadband Home | 933 | 71.8% |
| Cellular Data Only | 230 | 17.7% |
| Satellite Internet | 82 | 6.3% |
| No Internet | 98 | 7.5% |
| Total | 1,299 | 100.0% |
Sugar Creek Summary
Sugar Creek, Missouri is a small city located in Jackson County, Missouri, just east of Kansas City. The city is part of the Kansas City metropolitan area and has a population of approximately 4,000 people. The city is known for its historic downtown area, which is home to a variety of shops, restaurants, and other businesses.
History
Sugar Creek was founded in 1837 by a group of settlers from Kentucky. The city was named after the nearby Sugar Creek, which was named for the abundance of sugar maple trees in the area. The city was originally a farming community, but in the late 19th century, it began to develop into a small industrial center. The city was incorporated in 1887 and was home to a variety of businesses, including a flour mill, a brickyard, and a furniture factory.
In the early 20th century, Sugar Creek experienced a period of growth and development. The city was home to a variety of businesses, including a movie theater, a hotel, and a variety of shops and restaurants. The city also had a streetcar line that connected it to Kansas City.
Geography
Sugar Creek is located in Jackson County, Missouri, just east of Kansas City. The city is situated on the banks of Sugar Creek, which is a tributary of the Missouri River. The city is located in the Missouri River Valley, which is a region of rolling hills and valleys. The city is located at an elevation of 845 feet above sea level.
The climate in Sugar Creek is humid continental, with hot, humid summers and cold, snowy winters. The average annual temperature is around 54 degrees Fahrenheit, and the average annual precipitation is around 40 inches.
Economy
Sugar Creek’s economy is largely based on the service industry. The city is home to a variety of businesses, including restaurants, retail stores, and professional services. The city is also home to a variety of manufacturing companies, including a furniture factory and a brickyard.
The city is also home to a variety of educational institutions, including a community college and a technical school. The city is also home to a variety of healthcare facilities, including a hospital and a number of medical clinics.
Demographics
As of the 2010 census, the population of Sugar Creek was 4,000 people. The racial makeup of the city was 94.3% White, 1.7% African American, 0.3% Native American, 0.7% Asian, 0.1% Pacific Islander, and 2.8% from other races. The median household income in the city was $41,000, and the median family income was $50,000.
Sugar Creek is a small city with a rich history and a diverse economy. The city is home to a variety of businesses, educational institutions, and healthcare facilities. The city is also home to a variety of cultural attractions, including a variety of shops, restaurants, and other businesses. The city is a great place to live, work, and play.
Common Questions
What is Per Capita Income in Sugar Creek?
Per Capita income in Sugar Creek is $27,865.
What is the Median Family Income in Sugar Creek?
Median Family Income in Sugar Creek is $64,200.
What is the Median Household income in Sugar Creek?
Median Household Income in Sugar Creek is $55,201.
What is Income or Wage Gap in Sugar Creek?
Income or Wage Gap in Sugar Creek is 28.5%.
Women in Sugar Creek earn 71.5 cents for every dollar earned by a man.
What is Family Income Deficit in Sugar Creek?
Family Income Deficit in Sugar Creek is $12,445.
Families that are below poverty line in Sugar Creek earn $12,445 less on average than the poverty threshold level.
What is Inequality or Gini Index in Sugar Creek?
Inequality or Gini Index in Sugar Creek is 0.42.
What is the Total Population of Sugar Creek?
Total Population of Sugar Creek is 3,247.
What is the Total Male Population of Sugar Creek?
Total Male Population of Sugar Creek is 1,676.
What is the Total Female Population of Sugar Creek?
Total Female Population of Sugar Creek is 1,571.
What is the Ratio of Males per 100 Females in Sugar Creek?
There are 106.68 Males per 100 Females in Sugar Creek.
What is the Ratio of Females per 100 Males in Sugar Creek?
There are 93.74 Females per 100 Males in Sugar Creek.
What is the Median Population Age in Sugar Creek?
Median Population Age in Sugar Creek is 43.9 Years.
What is the Average Family Size in Sugar Creek
Average Family Size in Sugar Creek is 3.2 People.
What is the Average Household Size in Sugar Creek
Average Household Size in Sugar Creek is 2.5 People.
How Large is the Labor Force in Sugar Creek?
There are 1,624 People in the Labor Forcein in Sugar Creek.
What is the Percentage of People in the Labor Force in Sugar Creek?
61.6% of People are in the Labor Force in Sugar Creek.
What is the Unemployment Rate in Sugar Creek?
Unemployment Rate in Sugar Creek is 5.8%.