Sparta, MO Map & Demographics
Sparta Map
Sparta Overview
$25,934
PER CAPITA INCOME
$65,250
AVG FAMILY INCOME
$61,319
AVG HOUSEHOLD INCOME
3.3%
WAGE / INCOME GAP [ % ]
96.7¢/ $1
WAGE / INCOME GAP [ $ ]
0.33
INEQUALITY / GINI INDEX
2,442
TOTAL POPULATION
1,145
MALE POPULATION
1,297
FEMALE POPULATION
88.28
MALES / 100 FEMALES
113.28
FEMALES / 100 MALES
38.2
MEDIAN AGE
2.8
AVG FAMILY SIZE
2.5
AVG HOUSEHOLD SIZE
1,161
LABOR FORCE [ PEOPLE ]
59.9%
PERCENT IN LABOR FORCE
1.4%
UNEMPLOYMENT RATE
Sparta Zip Codes
Sparta Area Codes
Income in Sparta
Income Overview in Sparta
Per Capita Income in Sparta is $25,934, while median incomes of families and households are $65,250 and $61,319 respectively.
| Characteristic | Number | Measure |
| Per Capita Income | 2,442 | $25,934 |
| Median Family Income | 722 | $65,250 |
| Mean Family Income | 722 | $70,128 |
| Median Household Income | 966 | $61,319 |
| Mean Household Income | 966 | $65,844 |
| Income Deficit | 722 | $0 |
| Wage / Income Gap (%) | 2,442 | 3.34% |
| Wage / Income Gap ($) | 2,442 | 96.66¢ per $1 |
| Gini / Inequality Index | 2,442 | 0.33 |
Earnings by Sex in Sparta
Average Earnings in Sparta are $34,564, $34,918 for men and $33,750 for women, a difference of 3.3%.
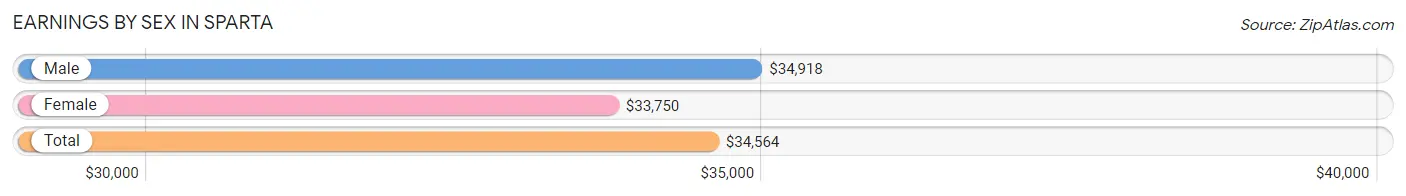
| Sex | Number | Average Earnings |
| Male | 651 (50.7%) | $34,918 |
| Female | 632 (49.3%) | $33,750 |
| Total | 1,283 (100.0%) | $34,564 |
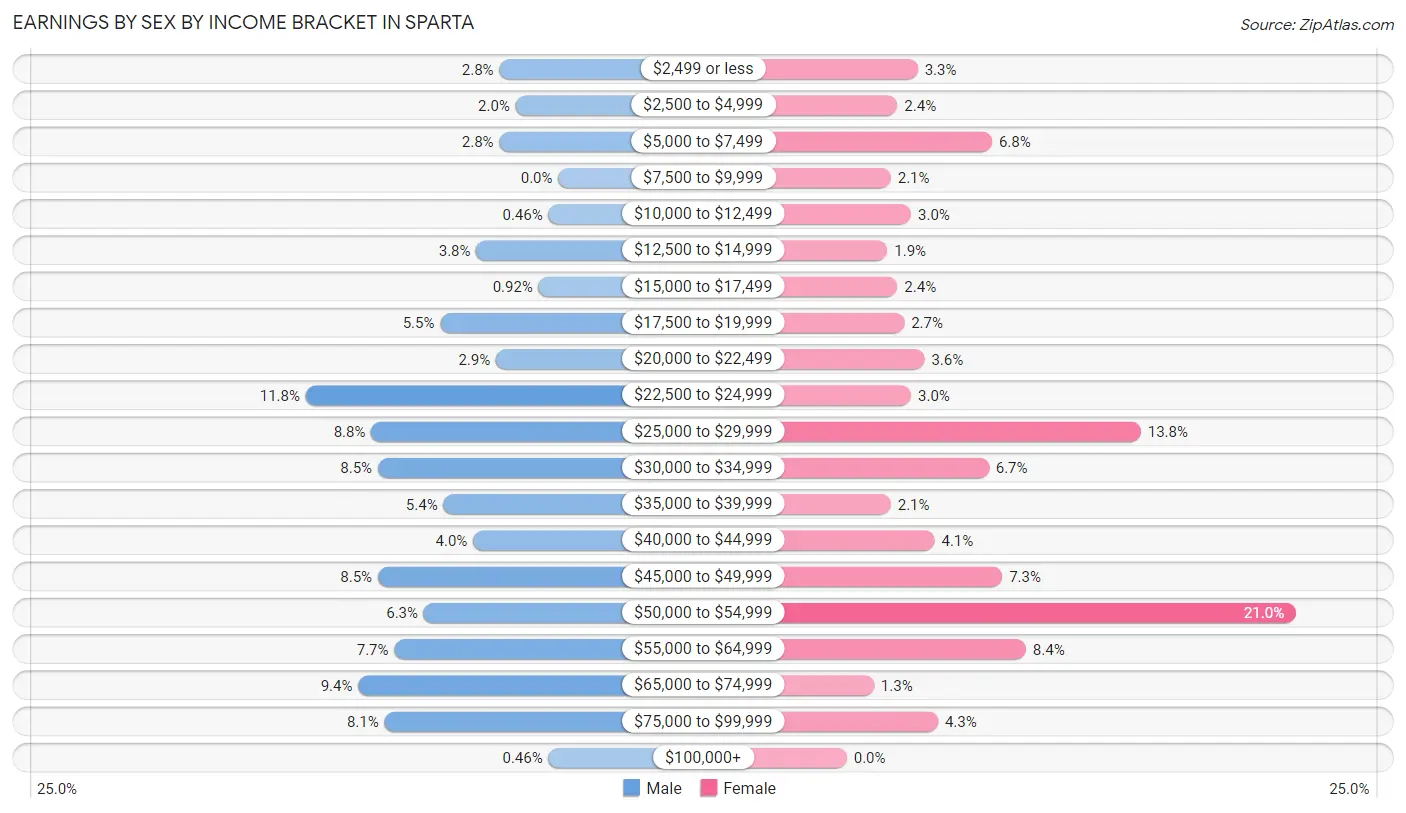
Earnings by Sex by Income Bracket in Sparta
The most common earnings brackets in Sparta are $22,500 to $24,999 for men (77 | 11.8%) and $50,000 to $54,999 for women (133 | 21.0%).
| Income | Male | Female |
| $2,499 or less | 18 (2.8%) | 21 (3.3%) |
| $2,500 to $4,999 | 13 (2.0%) | 15 (2.4%) |
| $5,000 to $7,499 | 18 (2.8%) | 43 (6.8%) |
| $7,500 to $9,999 | 0 (0.0%) | 13 (2.1%) |
| $10,000 to $12,499 | 3 (0.5%) | 19 (3.0%) |
| $12,500 to $14,999 | 25 (3.8%) | 12 (1.9%) |
| $15,000 to $17,499 | 6 (0.9%) | 15 (2.4%) |
| $17,500 to $19,999 | 36 (5.5%) | 17 (2.7%) |
| $20,000 to $22,499 | 19 (2.9%) | 23 (3.6%) |
| $22,500 to $24,999 | 77 (11.8%) | 19 (3.0%) |
| $25,000 to $29,999 | 57 (8.8%) | 87 (13.8%) |
| $30,000 to $34,999 | 55 (8.5%) | 42 (6.7%) |
| $35,000 to $39,999 | 35 (5.4%) | 13 (2.1%) |
| $40,000 to $44,999 | 26 (4.0%) | 26 (4.1%) |
| $45,000 to $49,999 | 55 (8.5%) | 46 (7.3%) |
| $50,000 to $54,999 | 41 (6.3%) | 133 (21.0%) |
| $55,000 to $64,999 | 50 (7.7%) | 53 (8.4%) |
| $65,000 to $74,999 | 61 (9.4%) | 8 (1.3%) |
| $75,000 to $99,999 | 53 (8.1%) | 27 (4.3%) |
| $100,000+ | 3 (0.5%) | 0 (0.0%) |
| Total | 651 (100.0%) | 632 (100.0%) |
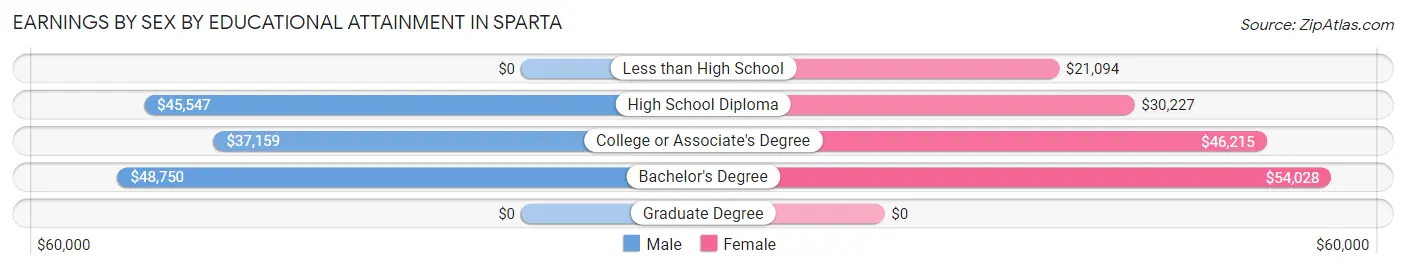
Earnings by Sex by Educational Attainment in Sparta
Average earnings in Sparta are $41,510 for men and $43,984 for women, a difference of 5.6%. Men with an educational attainment of bachelor's degree enjoy the highest average annual earnings of $48,750, while those with college or associate's degree education earn the least with $37,159. Women with an educational attainment of bachelor's degree earn the most with the average annual earnings of $54,028, while those with less than high school education have the smallest earnings of $21,094.
| Educational Attainment | Male Income | Female Income |
| Less than High School | - | - |
| High School Diploma | $45,547 | $30,227 |
| College or Associate's Degree | $37,159 | $46,215 |
| Bachelor's Degree | $48,750 | $54,028 |
| Graduate Degree | - | - |
| Total | $41,510 | $43,984 |
Family Income in Sparta
Family Income Brackets in Sparta
According to the Sparta family income data, there are 200 families falling into the $75,000 to $99,999 income range, which is the most common income bracket and makes up 27.7% of all families. Conversely, the $200,000+ income bracket is the least frequent group with only 10 families (1.4%) belonging to this category.
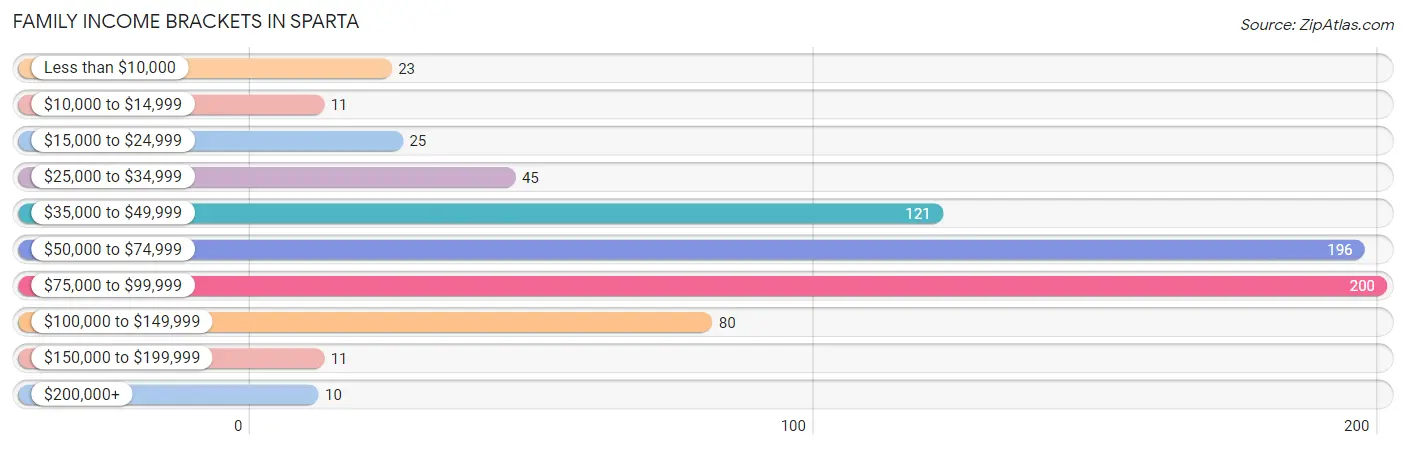
| Income Bracket | # Families | % Families |
| Less than $10,000 | 23 | 3.2% |
| $10,000 to $14,999 | 11 | 1.5% |
| $15,000 to $24,999 | 25 | 3.5% |
| $25,000 to $34,999 | 45 | 6.2% |
| $35,000 to $49,999 | 121 | 16.8% |
| $50,000 to $74,999 | 196 | 27.1% |
| $75,000 to $99,999 | 200 | 27.7% |
| $100,000 to $149,999 | 80 | 11.1% |
| $150,000 to $199,999 | 11 | 1.5% |
| $200,000+ | 10 | 1.4% |
Family Income by Famaliy Size in Sparta
4-person families (94 | 13.0%) account for the highest median family income in Sparta with $71,184 per family, while 2-person families (395 | 54.7%) have the highest median income of $31,875 per family member.
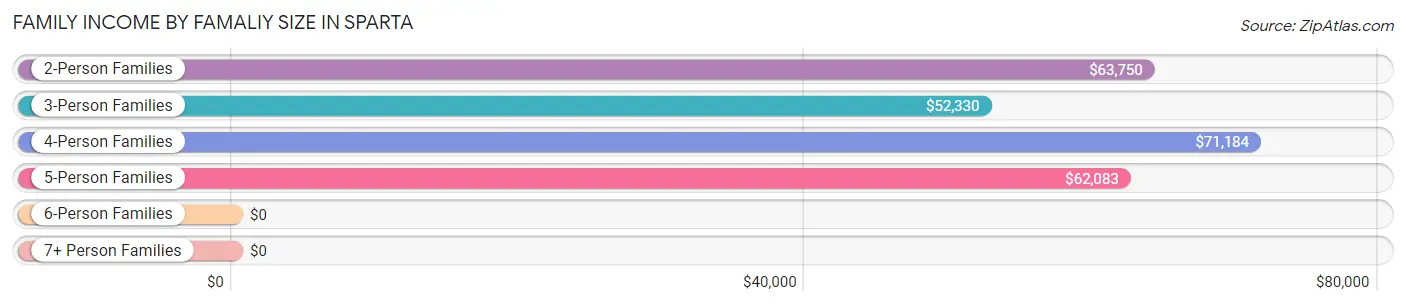
| Income Bracket | # Families | Median Income |
| 2-Person Families | 395 (54.7%) | $63,750 |
| 3-Person Families | 179 (24.8%) | $52,330 |
| 4-Person Families | 94 (13.0%) | $71,184 |
| 5-Person Families | 35 (4.9%) | $62,083 |
| 6-Person Families | 14 (1.9%) | $0 |
| 7+ Person Families | 5 (0.7%) | $0 |
| Total | 722 (100.0%) | $65,250 |
Family Income by Number of Earners in Sparta
The median family income in Sparta is $65,250, with families comprising 3+ earners (32) having the highest median family income of $128,056, while families with no earners (122) have the lowest median family income of $41,116, accounting for 4.4% and 16.9% of families, respectively.
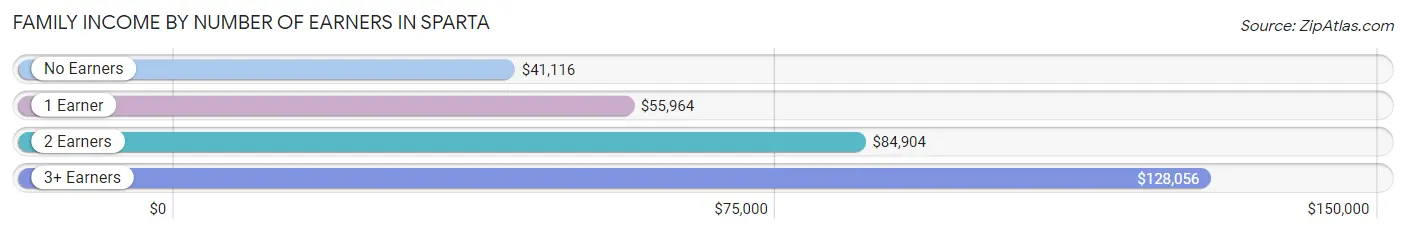
| Number of Earners | # Families | Median Income |
| No Earners | 122 (16.9%) | $41,116 |
| 1 Earner | 221 (30.6%) | $55,964 |
| 2 Earners | 347 (48.1%) | $84,904 |
| 3+ Earners | 32 (4.4%) | $128,056 |
| Total | 722 (100.0%) | $65,250 |
Household Income in Sparta
Household Income Brackets in Sparta
With 236 households falling in the category, the $75,000 to $99,999 income range is the most frequent in Sparta, accounting for 24.4% of all households. In contrast, only 10 households (1.0%) fall into the $200,000+ income bracket, making it the least populous group.
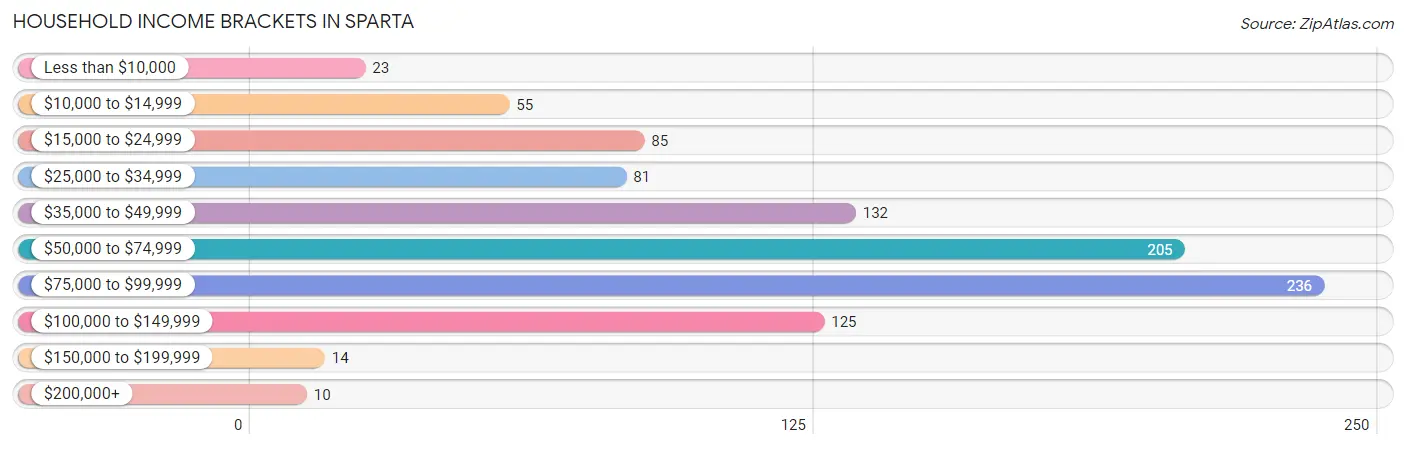
| Income Bracket | # Households | % Households |
| Less than $10,000 | 23 | 2.4% |
| $10,000 to $14,999 | 55 | 5.7% |
| $15,000 to $24,999 | 85 | 8.8% |
| $25,000 to $34,999 | 81 | 8.4% |
| $35,000 to $49,999 | 132 | 13.7% |
| $50,000 to $74,999 | 205 | 21.2% |
| $75,000 to $99,999 | 236 | 24.4% |
| $100,000 to $149,999 | 125 | 12.9% |
| $150,000 to $199,999 | 14 | 1.4% |
| $200,000+ | 10 | 1.0% |
Household Income by Householder Age in Sparta
The median household income in Sparta is $61,319, with the highest median household income of $98,141 found in the 45 to 64 years age bracket for the primary householder. A total of 289 households (29.9%) fall into this category. Meanwhile, the 65+ years age bracket for the primary householder has the lowest median household income of $40,168, with 267 households (27.6%) in this group.
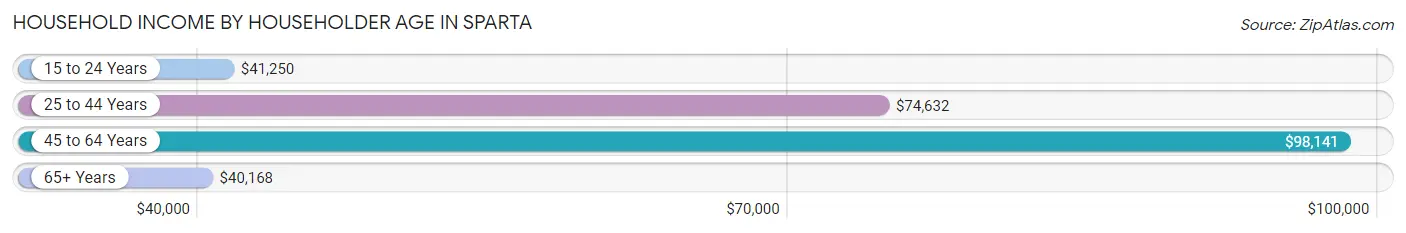
| Income Bracket | # Households | Median Income |
| 15 to 24 Years | 59 (6.1%) | $41,250 |
| 25 to 44 Years | 351 (36.3%) | $74,632 |
| 45 to 64 Years | 289 (29.9%) | $98,141 |
| 65+ Years | 267 (27.6%) | $40,168 |
| Total | 966 (100.0%) | $61,319 |
Poverty in Sparta
Income Below Poverty by Sex and Age in Sparta
With 10.9% poverty level for males and 11.2% for females among the residents of Sparta, 16 and 17 year old males and 75 year old and over females are the most vulnerable to poverty, with 5 males (38.5%) and 20 females (20.2%) in their respective age groups living below the poverty level.
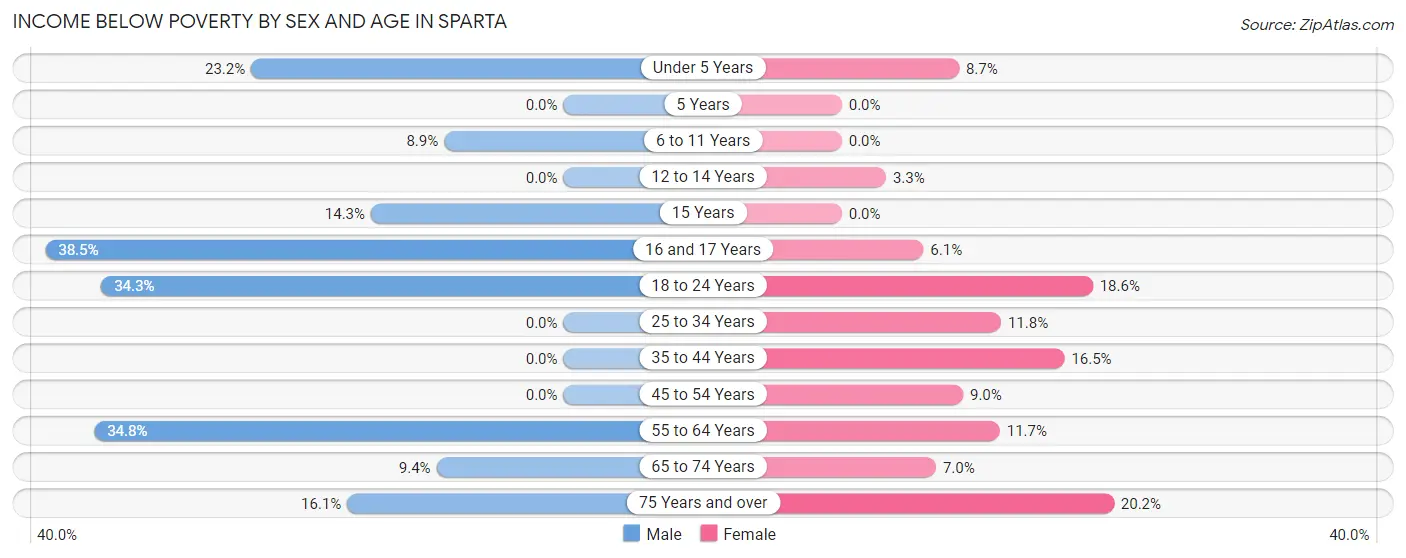
| Age Bracket | Male | Female |
| Under 5 Years | 16 (23.2%) | 10 (8.7%) |
| 5 Years | 0 (0.0%) | 0 (0.0%) |
| 6 to 11 Years | 7 (8.9%) | 0 (0.0%) |
| 12 to 14 Years | 0 (0.0%) | 2 (3.3%) |
| 15 Years | 2 (14.3%) | 0 (0.0%) |
| 16 and 17 Years | 5 (38.5%) | 2 (6.1%) |
| 18 to 24 Years | 35 (34.3%) | 19 (18.6%) |
| 25 to 34 Years | 0 (0.0%) | 26 (11.8%) |
| 35 to 44 Years | 0 (0.0%) | 20 (16.5%) |
| 45 to 54 Years | 0 (0.0%) | 9 (9.0%) |
| 55 to 64 Years | 31 (34.8%) | 23 (11.7%) |
| 65 to 74 Years | 13 (9.4%) | 13 (7.0%) |
| 75 Years and over | 13 (16.1%) | 20 (20.2%) |
| Total | 122 (10.9%) | 144 (11.2%) |
Income Above Poverty by Sex and Age in Sparta
According to the poverty statistics in Sparta, males aged 5 years and females aged 5 years are the age groups that are most secure financially, with 100.0% of males and 100.0% of females in these age groups living above the poverty line.
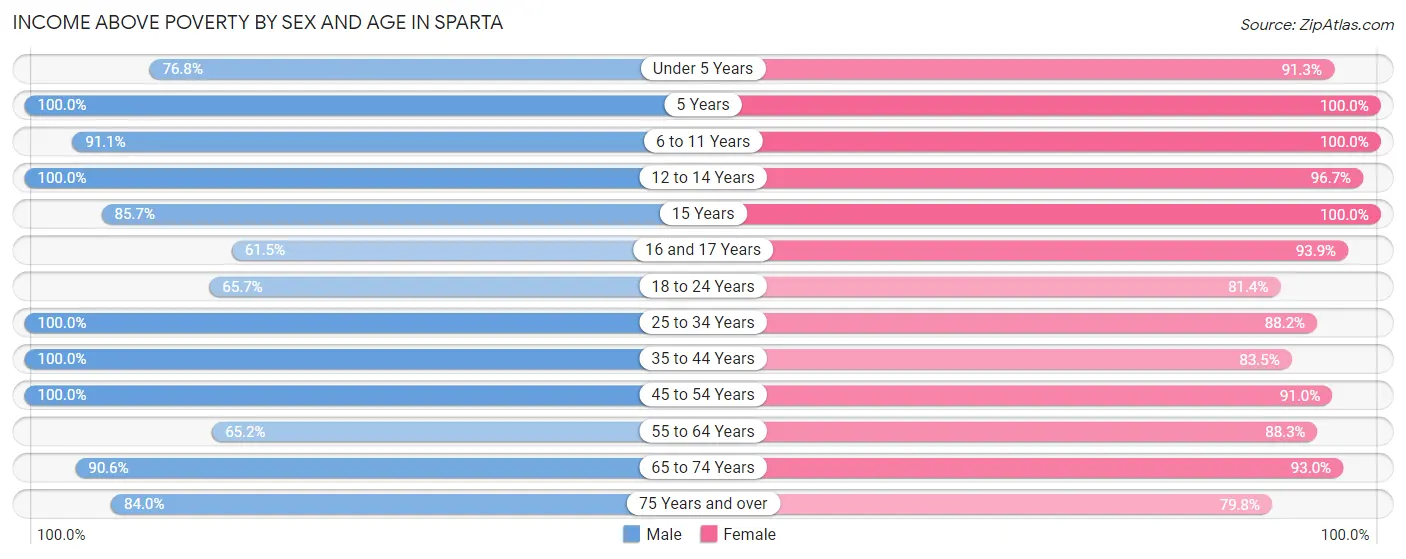
| Age Bracket | Male | Female |
| Under 5 Years | 53 (76.8%) | 105 (91.3%) |
| 5 Years | 12 (100.0%) | 11 (100.0%) |
| 6 to 11 Years | 72 (91.1%) | 40 (100.0%) |
| 12 to 14 Years | 60 (100.0%) | 59 (96.7%) |
| 15 Years | 12 (85.7%) | 6 (100.0%) |
| 16 and 17 Years | 8 (61.5%) | 31 (93.9%) |
| 18 to 24 Years | 67 (65.7%) | 83 (81.4%) |
| 25 to 34 Years | 221 (100.0%) | 194 (88.2%) |
| 35 to 44 Years | 152 (100.0%) | 101 (83.5%) |
| 45 to 54 Years | 86 (100.0%) | 91 (91.0%) |
| 55 to 64 Years | 58 (65.2%) | 173 (88.3%) |
| 65 to 74 Years | 125 (90.6%) | 173 (93.0%) |
| 75 Years and over | 68 (84.0%) | 79 (79.8%) |
| Total | 994 (89.1%) | 1,146 (88.8%) |
Income Below Poverty Among Married-Couple Families in Sparta
The poverty statistics for married-couple families in Sparta show that 3.7% or 20 of the total 539 families live below the poverty line. Families with no children have the highest poverty rate of 5.5%, comprising of 20 families. On the other hand, families with 1 or 2 children have the lowest poverty rate of 0.0%, which includes 0 families.
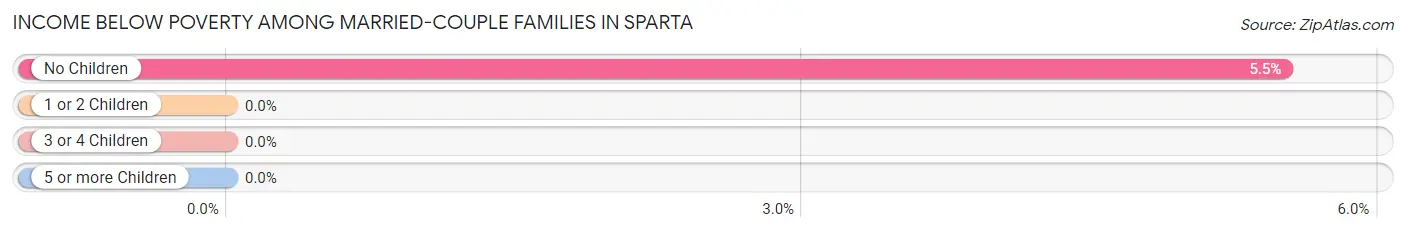
| Children | Above Poverty | Below Poverty |
| No Children | 343 (94.5%) | 20 (5.5%) |
| 1 or 2 Children | 151 (100.0%) | 0 (0.0%) |
| 3 or 4 Children | 25 (100.0%) | 0 (0.0%) |
| 5 or more Children | 0 (0.0%) | 0 (0.0%) |
| Total | 519 (96.3%) | 20 (3.7%) |
Income Below Poverty Among Single-Parent Households in Sparta
According to the poverty data in Sparta, 5.0% or 3 single-father households and 25.2% or 31 single-mother households are living below the poverty line. Among single-father households, those with 1 or 2 children have the highest poverty rate, with 3 households (10.0%) experiencing poverty. Likewise, among single-mother households, those with 3 or 4 children have the highest poverty rate, with 10 households (66.7%) falling below the poverty line.
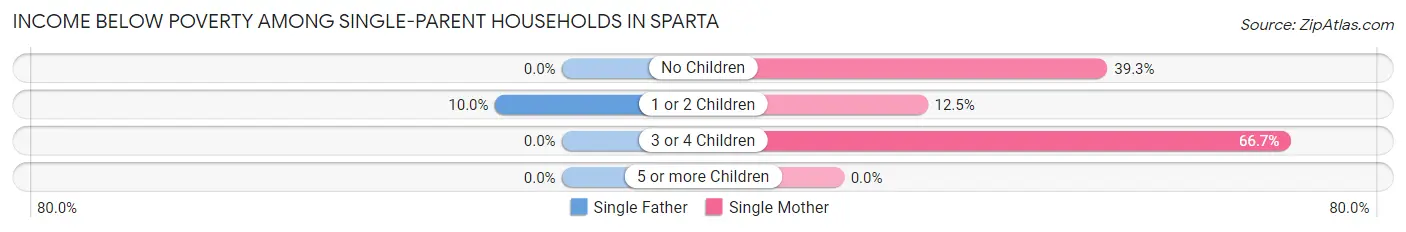
| Children | Single Father | Single Mother |
| No Children | 0 (0.0%) | 11 (39.3%) |
| 1 or 2 Children | 3 (10.0%) | 10 (12.5%) |
| 3 or 4 Children | 0 (0.0%) | 10 (66.7%) |
| 5 or more Children | 0 (0.0%) | 0 (0.0%) |
| Total | 3 (5.0%) | 31 (25.2%) |
Income Below Poverty Among Married-Couple vs Single-Parent Households in Sparta
The poverty data for Sparta shows that 20 of the married-couple family households (3.7%) and 34 of the single-parent households (18.6%) are living below the poverty level. Within the married-couple family households, those with no children have the highest poverty rate, with 20 households (5.5%) falling below the poverty line. Among the single-parent households, those with 3 or 4 children have the highest poverty rate, with 10 household (43.5%) living below poverty.
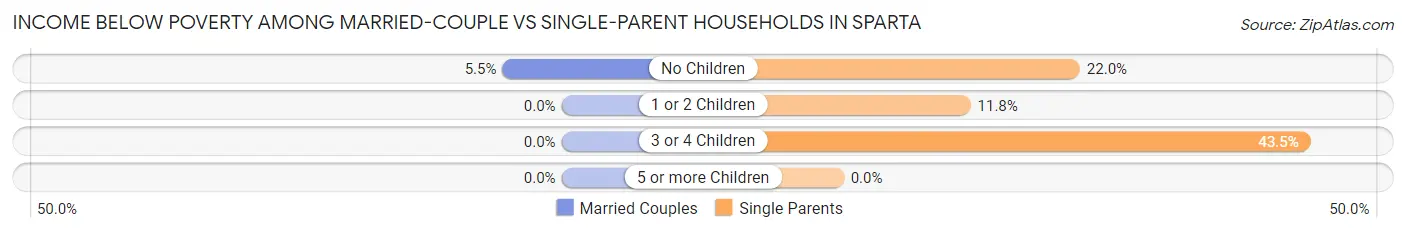
| Children | Married-Couple Families | Single-Parent Households |
| No Children | 20 (5.5%) | 11 (22.0%) |
| 1 or 2 Children | 0 (0.0%) | 13 (11.8%) |
| 3 or 4 Children | 0 (0.0%) | 10 (43.5%) |
| 5 or more Children | 0 (0.0%) | 0 (0.0%) |
| Total | 20 (3.7%) | 34 (18.6%) |
Race in Sparta
The most populous races in Sparta are White / Caucasian (2,408 | 98.6%), Two or more Races (34 | 1.4%), and Hispanic or Latino (14 | 0.6%).
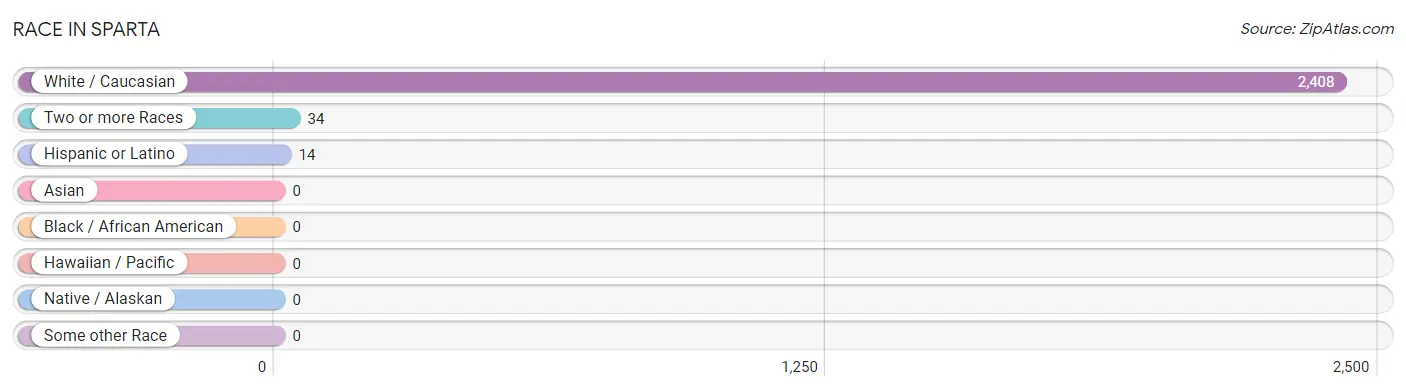
| Race | # Population | % Population |
| Asian | 0 | 0.0% |
| Black / African American | 0 | 0.0% |
| Hawaiian / Pacific | 0 | 0.0% |
| Hispanic or Latino | 14 | 0.6% |
| Native / Alaskan | 0 | 0.0% |
| White / Caucasian | 2,408 | 98.6% |
| Two or more Races | 34 | 1.4% |
| Some other Race | 0 | 0.0% |
| Total | 2,442 | 100.0% |
Ancestry in Sparta
The most populous ancestries reported in Sparta are German (462 | 18.9%), American (386 | 15.8%), English (385 | 15.8%), Irish (291 | 11.9%), and Italian (50 | 2.1%), together accounting for 64.5% of all Sparta residents.
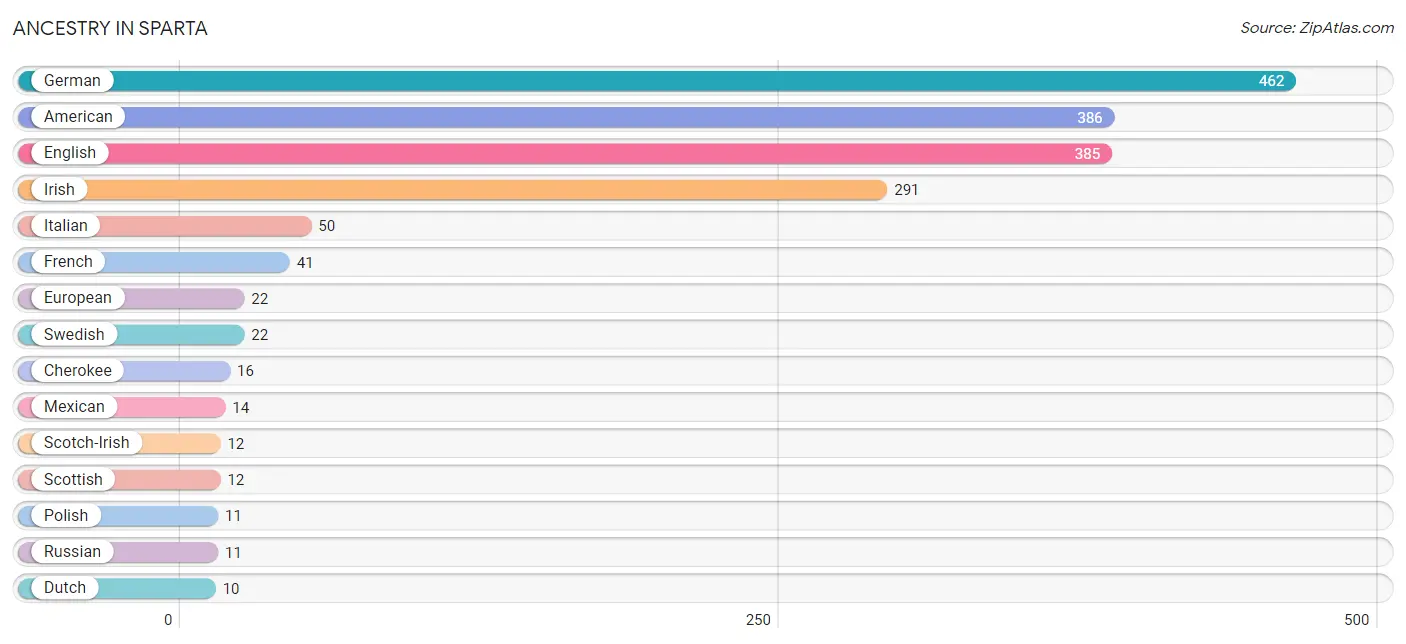
| Ancestry | # Population | % Population |
| American | 386 | 15.8% |
| Arab | 6 | 0.3% |
| Armenian | 6 | 0.3% |
| Cherokee | 16 | 0.7% |
| Choctaw | 8 | 0.3% |
| Danish | 3 | 0.1% |
| Dutch | 10 | 0.4% |
| Egyptian | 6 | 0.3% |
| English | 385 | 15.8% |
| European | 22 | 0.9% |
| Finnish | 6 | 0.3% |
| French | 41 | 1.7% |
| French Canadian | 4 | 0.2% |
| German | 462 | 18.9% |
| Irish | 291 | 11.9% |
| Italian | 50 | 2.1% |
| Mexican | 14 | 0.6% |
| Norwegian | 7 | 0.3% |
| Polish | 11 | 0.4% |
| Portuguese | 3 | 0.1% |
| Russian | 11 | 0.4% |
| Scotch-Irish | 12 | 0.5% |
| Scottish | 12 | 0.5% |
| Swedish | 22 | 0.9% | View All 24 Rows |
Immigrants in Sparta
The most numerous immigrant groups reported in Sparta came from Eastern Europe (17 | 0.7%), Europe (17 | 0.7%), Belarus (6 | 0.3%), Russia (6 | 0.3%), and Ukraine (5 | 0.2%), together accounting for 2.1% of all Sparta residents.
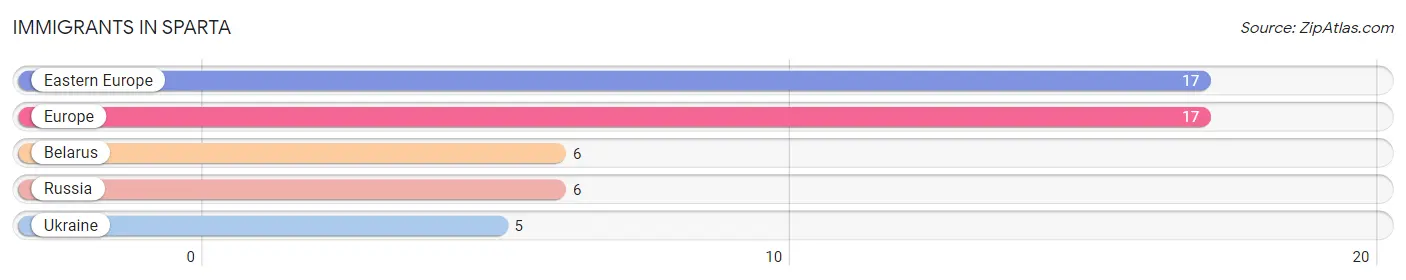
| Immigration Origin | # Population | % Population |
| Belarus | 6 | 0.3% |
| Eastern Europe | 17 | 0.7% |
| Europe | 17 | 0.7% |
| Russia | 6 | 0.3% |
| Ukraine | 5 | 0.2% | View All 5 Rows |
Sex and Age in Sparta
Sex and Age in Sparta
The most populous age groups in Sparta are 25 to 29 Years (141 | 12.3%) for men and 60 to 64 Years (163 | 12.6%) for women.
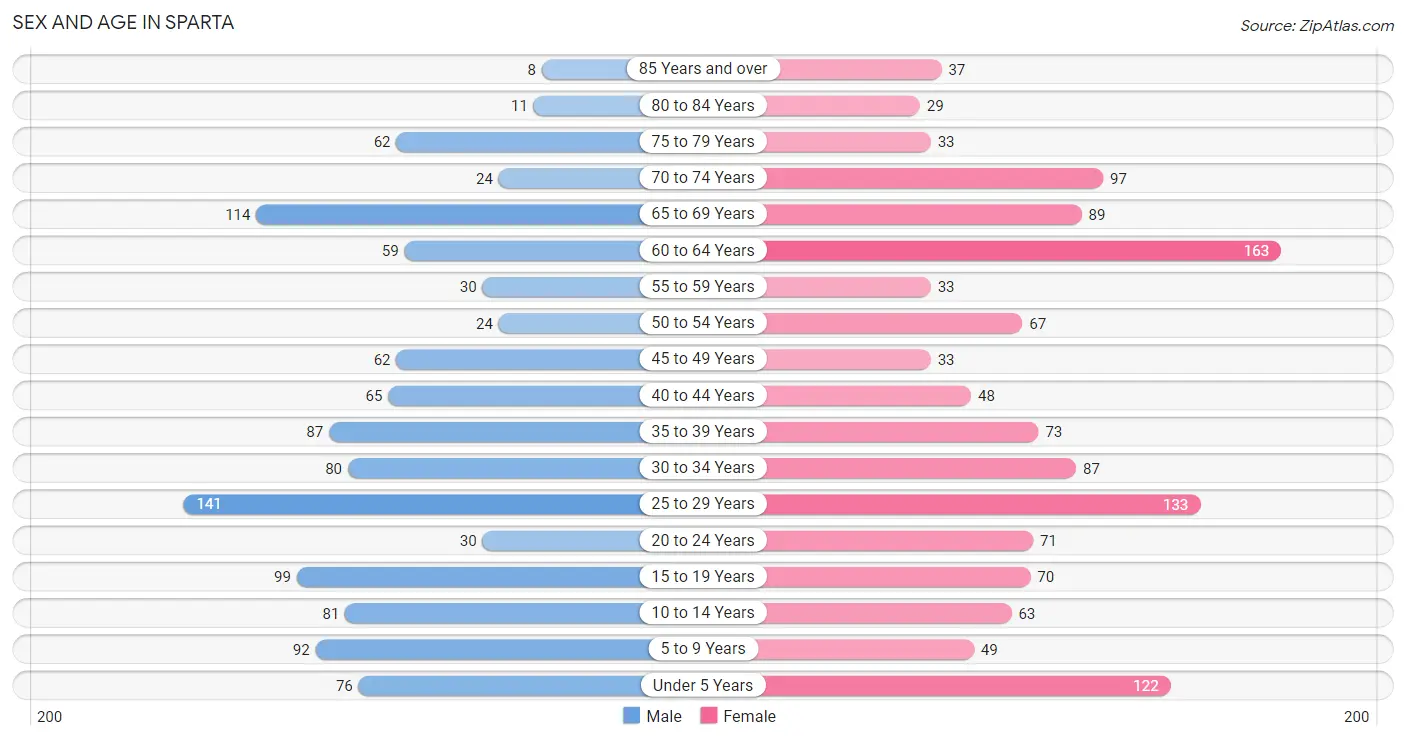
| Age Bracket | Male | Female |
| Under 5 Years | 76 (6.6%) | 122 (9.4%) |
| 5 to 9 Years | 92 (8.0%) | 49 (3.8%) |
| 10 to 14 Years | 81 (7.1%) | 63 (4.9%) |
| 15 to 19 Years | 99 (8.6%) | 70 (5.4%) |
| 20 to 24 Years | 30 (2.6%) | 71 (5.5%) |
| 25 to 29 Years | 141 (12.3%) | 133 (10.2%) |
| 30 to 34 Years | 80 (7.0%) | 87 (6.7%) |
| 35 to 39 Years | 87 (7.6%) | 73 (5.6%) |
| 40 to 44 Years | 65 (5.7%) | 48 (3.7%) |
| 45 to 49 Years | 62 (5.4%) | 33 (2.5%) |
| 50 to 54 Years | 24 (2.1%) | 67 (5.2%) |
| 55 to 59 Years | 30 (2.6%) | 33 (2.5%) |
| 60 to 64 Years | 59 (5.1%) | 163 (12.6%) |
| 65 to 69 Years | 114 (10.0%) | 89 (6.9%) |
| 70 to 74 Years | 24 (2.1%) | 97 (7.5%) |
| 75 to 79 Years | 62 (5.4%) | 33 (2.5%) |
| 80 to 84 Years | 11 (1.0%) | 29 (2.2%) |
| 85 Years and over | 8 (0.7%) | 37 (2.9%) |
| Total | 1,145 (100.0%) | 1,297 (100.0%) |
Families and Households in Sparta
Median Family Size in Sparta
The median family size in Sparta is 2.76 persons per family, with single female/mother families (123 | 17.0%) accounting for the largest median family size of 3.16 persons per family. On the other hand, married-couple families (539 | 74.7%) represent the smallest median family size with 2.66 persons per family.
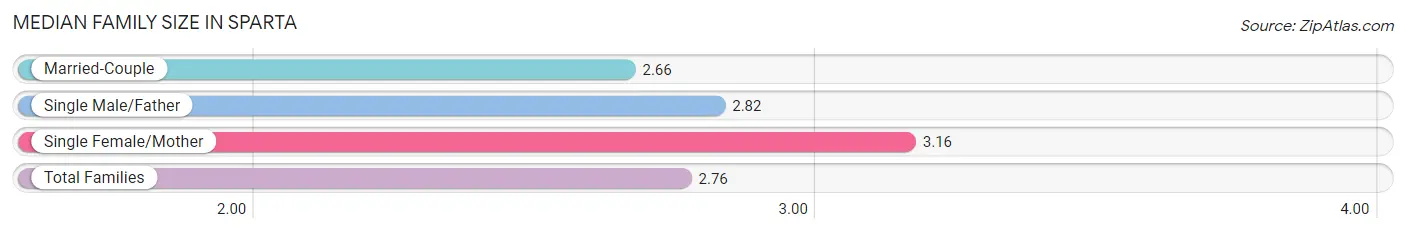
| Family Type | # Families | Family Size |
| Married-Couple | 539 (74.7%) | 2.66 |
| Single Male/Father | 60 (8.3%) | 2.82 |
| Single Female/Mother | 123 (17.0%) | 3.16 |
| Total Families | 722 (100.0%) | 2.76 |
Median Household Size in Sparta
The median household size in Sparta is 2.53 persons per household, with single male/father households (60 | 6.2%) accounting for the largest median household size of 3.97 persons per household. non-family households (244 | 25.3%) represent the smallest median household size with 1.29 persons per household.
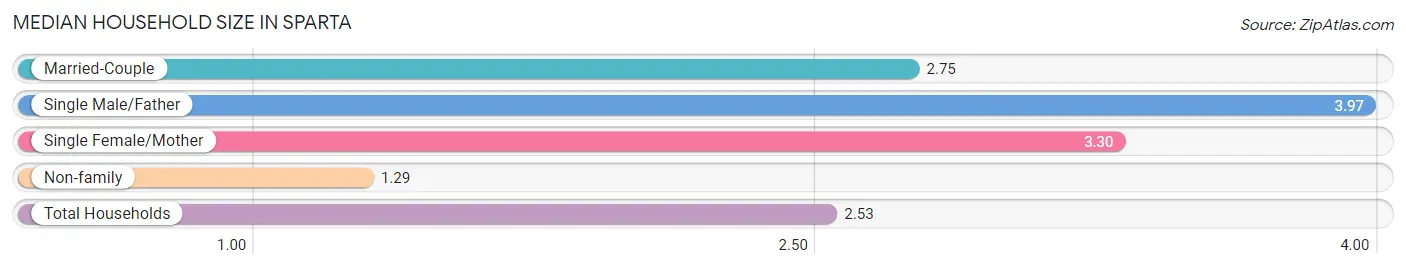
| Household Type | # Households | Household Size |
| Married-Couple | 539 (55.8%) | 2.75 |
| Single Male/Father | 60 (6.2%) | 3.97 |
| Single Female/Mother | 123 (12.7%) | 3.30 |
| Non-family | 244 (25.3%) | 1.29 |
| Total Households | 966 (100.0%) | 2.53 |
Household Size by Marriage Status in Sparta
Out of a total of 966 households in Sparta, 722 (74.7%) are family households, while 244 (25.3%) are nonfamily households. The most numerous type of family households are 2-person households, comprising 371, and the most common type of nonfamily households are 1-person households, comprising 173.
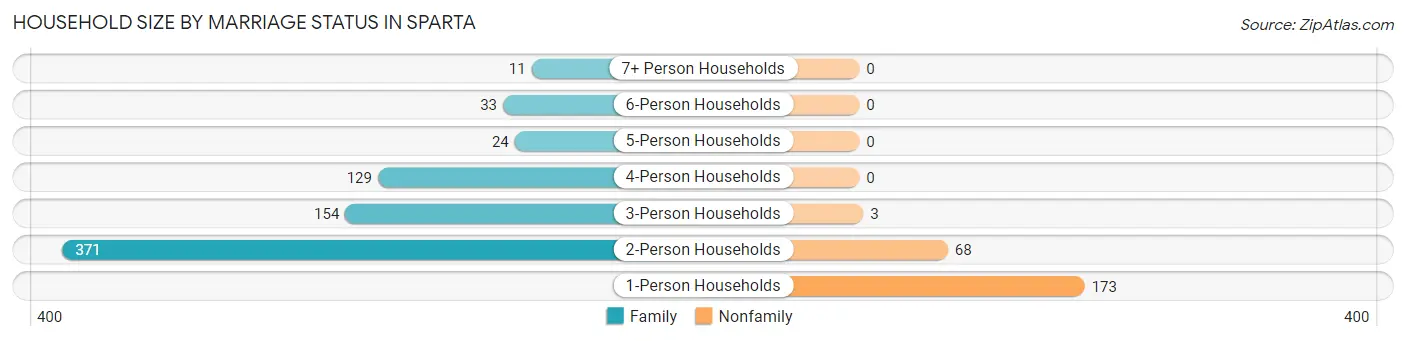
| Household Size | Family Households | Nonfamily Households |
| 1-Person Households | - | 173 (17.9%) |
| 2-Person Households | 371 (38.4%) | 68 (7.0%) |
| 3-Person Households | 154 (15.9%) | 3 (0.3%) |
| 4-Person Households | 129 (13.4%) | 0 (0.0%) |
| 5-Person Households | 24 (2.5%) | 0 (0.0%) |
| 6-Person Households | 33 (3.4%) | 0 (0.0%) |
| 7+ Person Households | 11 (1.1%) | 0 (0.0%) |
| Total | 722 (74.7%) | 244 (25.3%) |
Female Fertility in Sparta
Fertility by Age in Sparta
Average fertility rate in Sparta is 99.0 births per 1,000 women. Women in the age bracket of 15 to 19 years have the highest fertility rate with 214.0 births per 1,000 women. Women in the age bracket of 20 to 34 years acount for 67.9% of all women with births.
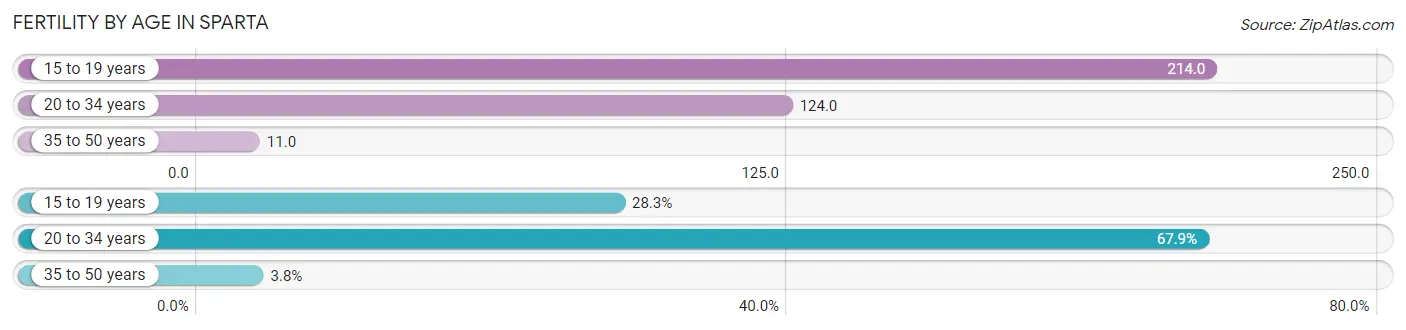
| Age Bracket | Women with Births | Births / 1,000 Women |
| 15 to 19 years | 15 (28.3%) | 214.0 |
| 20 to 34 years | 36 (67.9%) | 124.0 |
| 35 to 50 years | 2 (3.8%) | 11.0 |
| Total | 53 (100.0%) | 99.0 |
Fertility by Age by Marriage Status in Sparta
52.8% of women with births (53) in Sparta are married. The highest percentage of unmarried women with births falls into 20 to 34 years age bracket with 58.3% of them unmarried at the time of birth, while the lowest percentage of unmarried women with births belong to 35 to 50 years age bracket with 0.0% of them unmarried.
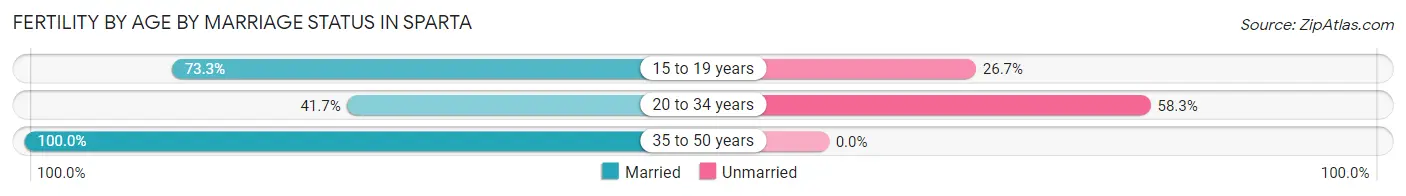
| Age Bracket | Married | Unmarried |
| 15 to 19 years | 11 (73.3%) | 4 (26.7%) |
| 20 to 34 years | 15 (41.7%) | 21 (58.3%) |
| 35 to 50 years | 2 (100.0%) | 0 (0.0%) |
| Total | 28 (52.8%) | 25 (47.2%) |
Fertility by Education in Sparta
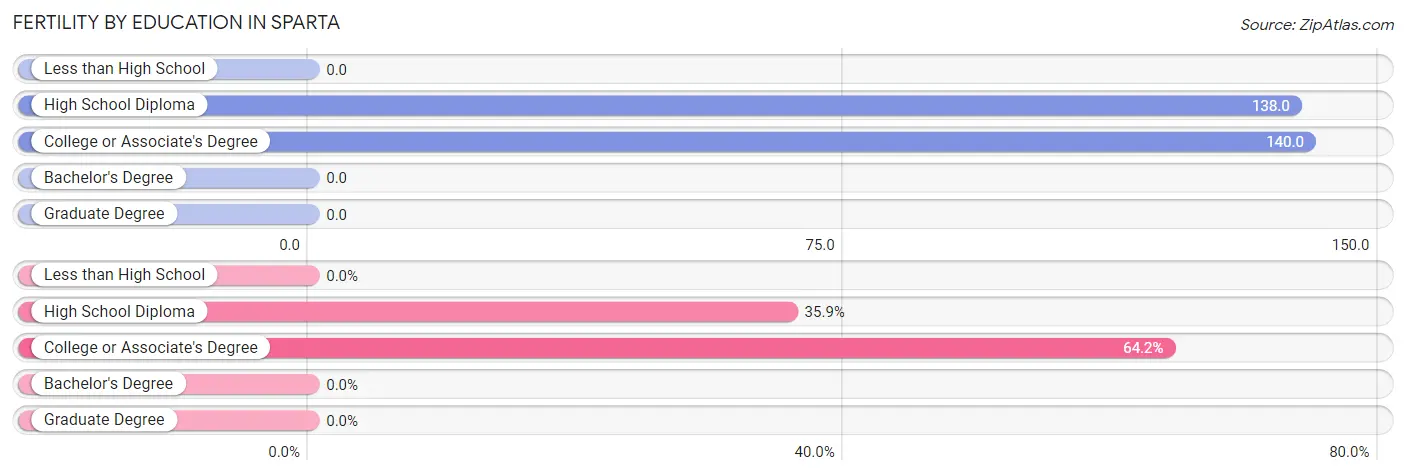
| Educational Attainment | Women with Births | Births / 1,000 Women |
| Less than High School | 0 (0.0%) | 0.0 |
| High School Diploma | 19 (35.8%) | 138.0 |
| College or Associate's Degree | 34 (64.1%) | 140.0 |
| Bachelor's Degree | 0 (0.0%) | 0.0 |
| Graduate Degree | 0 (0.0%) | 0.0 |
| Total | 53 (100.0%) | 99.0 |
Fertility by Education by Marriage Status in Sparta
47.2% of women with births in Sparta are unmarried. Women with the educational attainment of high school diploma are most likely to be married with 78.9% of them married at childbirth, while women with the educational attainment of college or associate's degree are least likely to be married with 61.8% of them unmarried at childbirth.
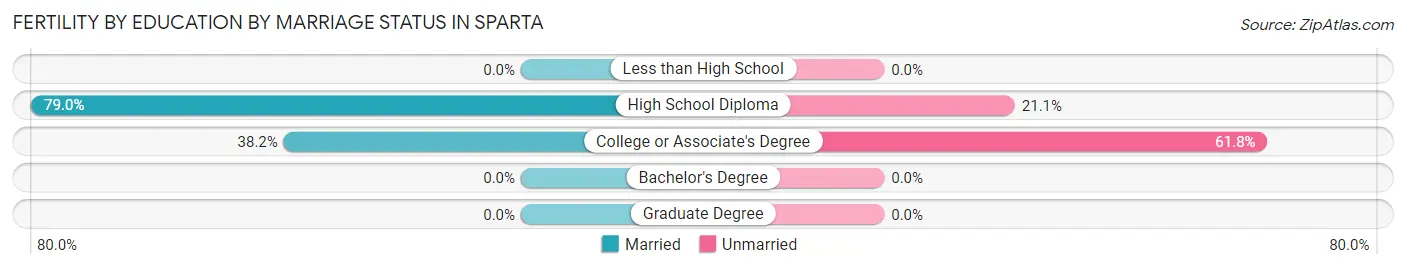
| Educational Attainment | Married | Unmarried |
| Less than High School | 0 (0.0%) | 0 (0.0%) |
| High School Diploma | 15 (78.9%) | 4 (21.0%) |
| College or Associate's Degree | 13 (38.2%) | 21 (61.8%) |
| Bachelor's Degree | 0 (0.0%) | 0 (0.0%) |
| Graduate Degree | 0 (0.0%) | 0 (0.0%) |
| Total | 28 (52.8%) | 25 (47.2%) |
Employment Characteristics in Sparta
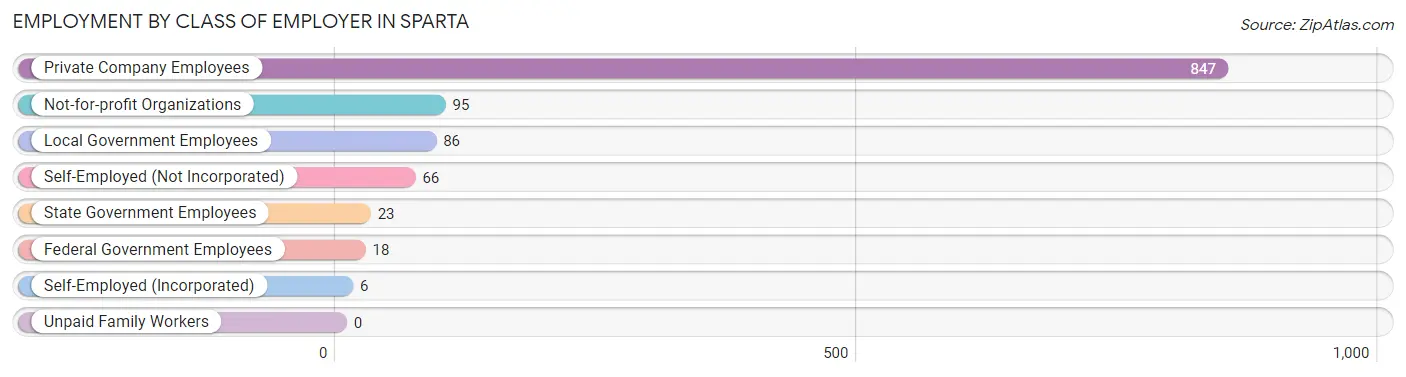
Employment by Class of Employer in Sparta
Among the 1,141 employed individuals in Sparta, private company employees (847 | 74.2%), not-for-profit organizations (95 | 8.3%), and local government employees (86 | 7.5%) make up the most common classes of employment.
| Employer Class | # Employees | % Employees |
| Private Company Employees | 847 | 74.2% |
| Self-Employed (Incorporated) | 6 | 0.5% |
| Self-Employed (Not Incorporated) | 66 | 5.8% |
| Not-for-profit Organizations | 95 | 8.3% |
| Local Government Employees | 86 | 7.5% |
| State Government Employees | 23 | 2.0% |
| Federal Government Employees | 18 | 1.6% |
| Unpaid Family Workers | 0 | 0.0% |
| Total | 1,141 | 100.0% |
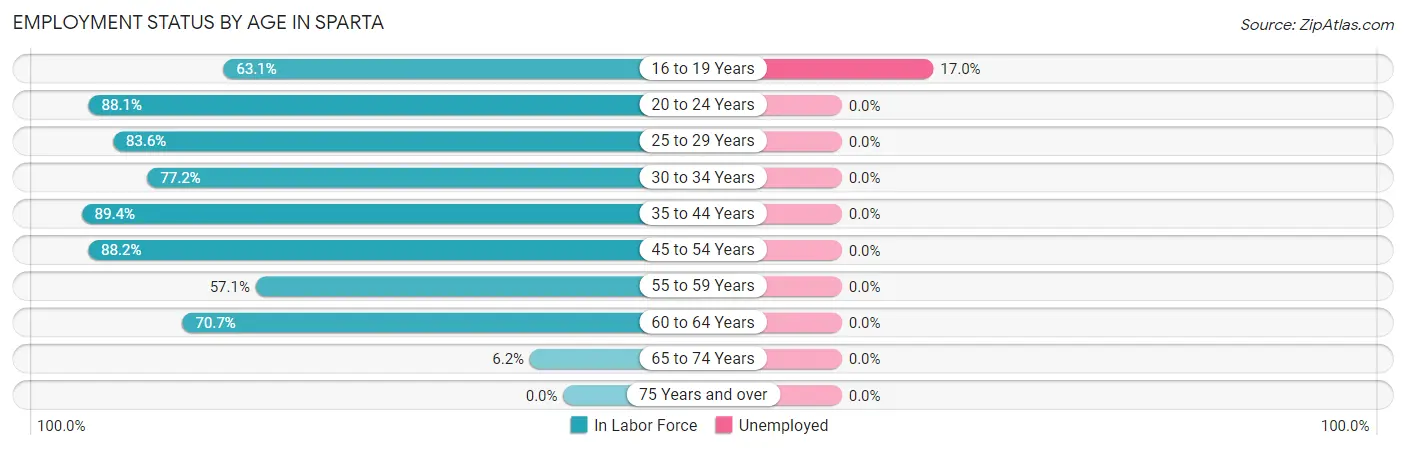
Employment Status by Age in Sparta
According to the labor force statistics for Sparta, out of the total population over 16 years of age (1,939), 59.9% or 1,161 individuals are in the labor force, with 1.4% or 16 of them unemployed. The age group with the highest labor force participation rate is 35 to 44 years, with 89.4% or 244 individuals in the labor force. Within the labor force, the 16 to 19 years age range has the highest percentage of unemployed individuals, with 17.0% or 16 of them being unemployed.
| Age Bracket | In Labor Force | Unemployed |
| 16 to 19 Years | 94 (63.1%) | 16 (17.0%) |
| 20 to 24 Years | 89 (88.1%) | 0 (0.0%) |
| 25 to 29 Years | 229 (83.6%) | 0 (0.0%) |
| 30 to 34 Years | 129 (77.2%) | 0 (0.0%) |
| 35 to 44 Years | 244 (89.4%) | 0 (0.0%) |
| 45 to 54 Years | 164 (88.2%) | 0 (0.0%) |
| 55 to 59 Years | 36 (57.1%) | 0 (0.0%) |
| 60 to 64 Years | 157 (70.7%) | 0 (0.0%) |
| 65 to 74 Years | 20 (6.2%) | 0 (0.0%) |
| 75 Years and over | 0 (0.0%) | 0 (0.0%) |
| Total | 1,161 (59.9%) | 16 (1.4%) |
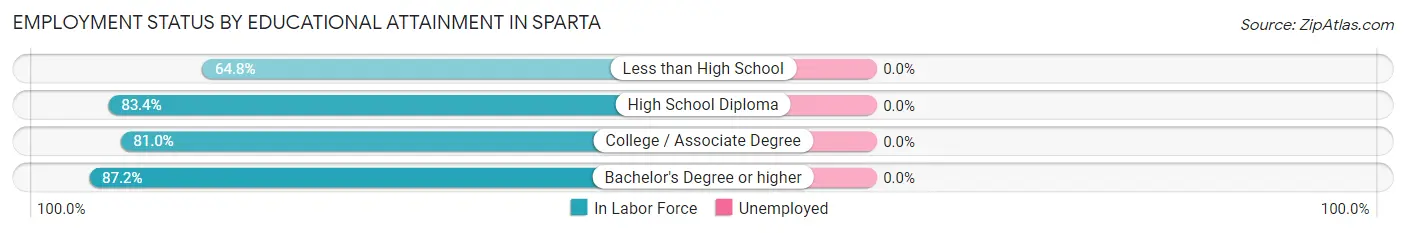
Employment Status by Educational Attainment in Sparta
| Educational Attainment | In Labor Force | Unemployed |
| Less than High School | 68 (64.8%) | 0 (0.0%) |
| High School Diploma | 311 (83.4%) | 0 (0.0%) |
| College / Associate Degree | 478 (81.0%) | 0 (0.0%) |
| Bachelor's Degree or higher | 102 (87.2%) | 0 (0.0%) |
| Total | 959 (80.9%) | 0 (0.0%) |
Employment Occupations by Sex in Sparta
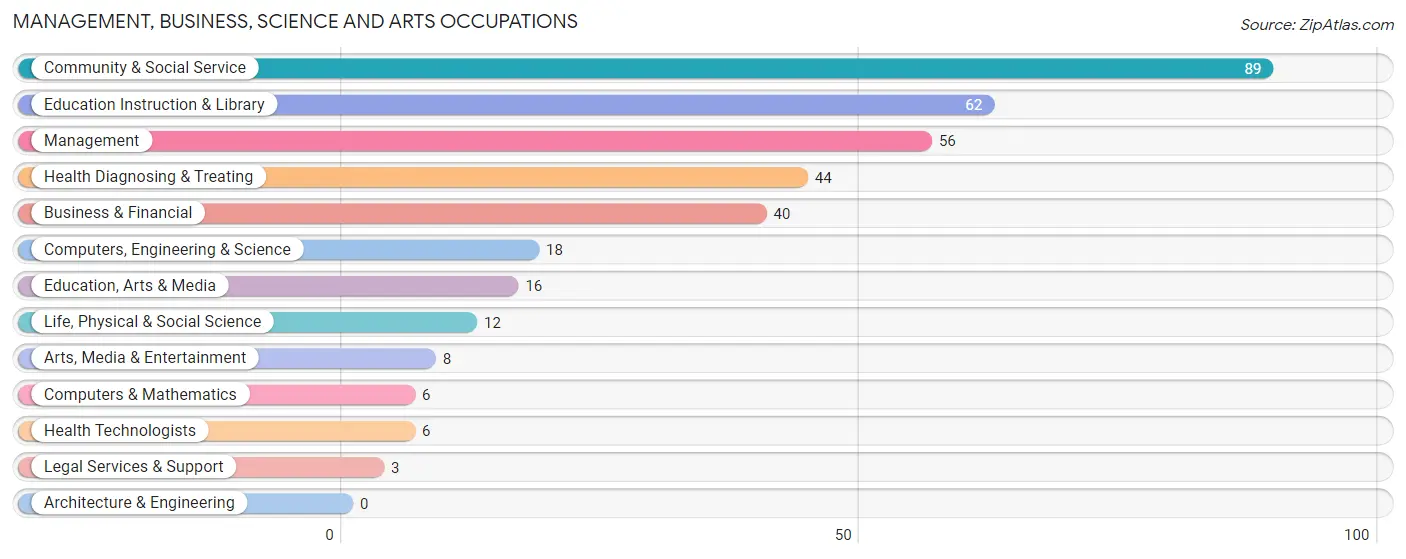
Management, Business, Science and Arts Occupations
The most common Management, Business, Science and Arts occupations in Sparta are Community & Social Service (89 | 7.8%), Education Instruction & Library (62 | 5.4%), Management (56 | 4.9%), Health Diagnosing & Treating (44 | 3.8%), and Business & Financial (40 | 3.5%).
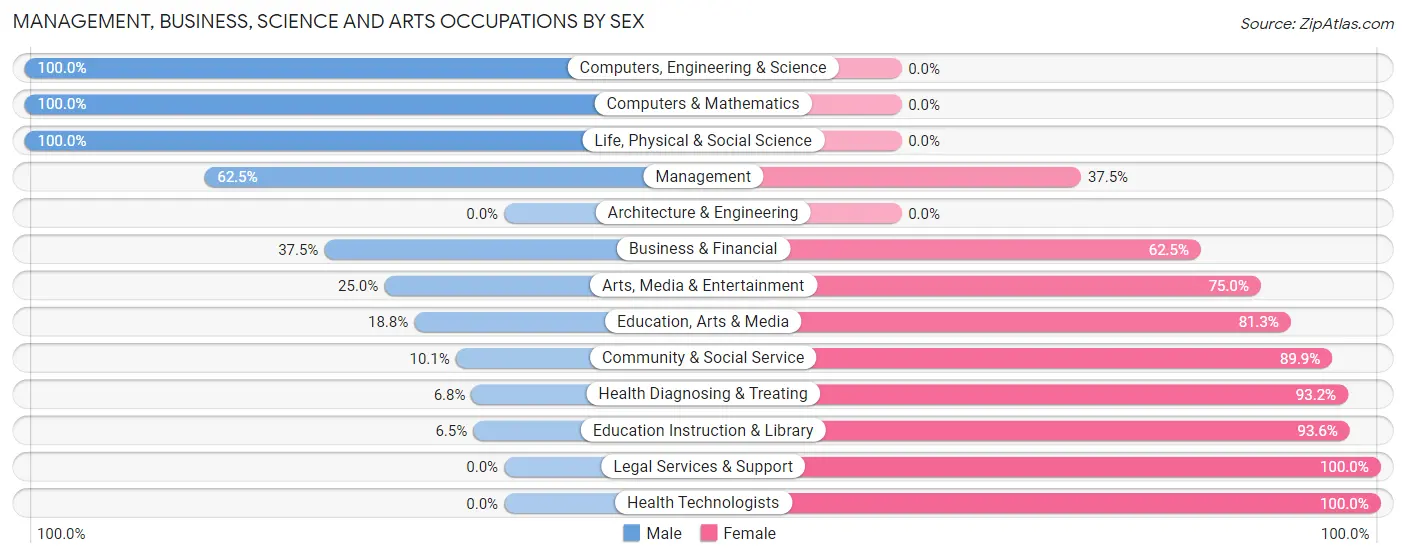
Management, Business, Science and Arts Occupations by Sex
Within the Management, Business, Science and Arts occupations in Sparta, the most male-oriented occupations are Computers, Engineering & Science (100.0%), Computers & Mathematics (100.0%), and Life, Physical & Social Science (100.0%), while the most female-oriented occupations are Legal Services & Support (100.0%), Health Technologists (100.0%), and Education Instruction & Library (93.5%).
| Occupation | Male | Female |
| Management | 35 (62.5%) | 21 (37.5%) |
| Business & Financial | 15 (37.5%) | 25 (62.5%) |
| Computers, Engineering & Science | 18 (100.0%) | 0 (0.0%) |
| Computers & Mathematics | 6 (100.0%) | 0 (0.0%) |
| Architecture & Engineering | 0 (0.0%) | 0 (0.0%) |
| Life, Physical & Social Science | 12 (100.0%) | 0 (0.0%) |
| Community & Social Service | 9 (10.1%) | 80 (89.9%) |
| Education, Arts & Media | 3 (18.8%) | 13 (81.2%) |
| Legal Services & Support | 0 (0.0%) | 3 (100.0%) |
| Education Instruction & Library | 4 (6.5%) | 58 (93.5%) |
| Arts, Media & Entertainment | 2 (25.0%) | 6 (75.0%) |
| Health Diagnosing & Treating | 3 (6.8%) | 41 (93.2%) |
| Health Technologists | 0 (0.0%) | 6 (100.0%) |
| Total (Category) | 80 (32.4%) | 167 (67.6%) |
| Total (Overall) | 566 (49.4%) | 580 (50.6%) |
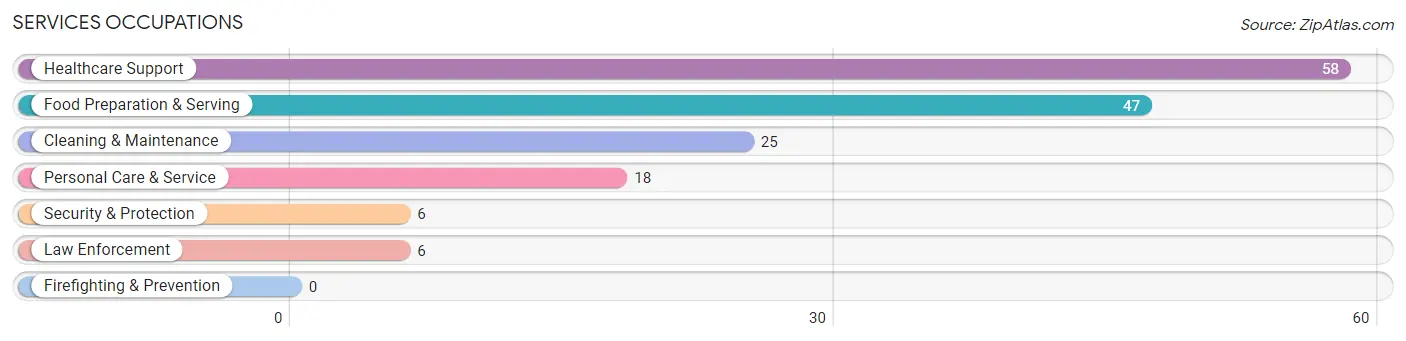
Services Occupations
The most common Services occupations in Sparta are Healthcare Support (58 | 5.1%), Food Preparation & Serving (47 | 4.1%), Cleaning & Maintenance (25 | 2.2%), Personal Care & Service (18 | 1.6%), and Security & Protection (6 | 0.5%).
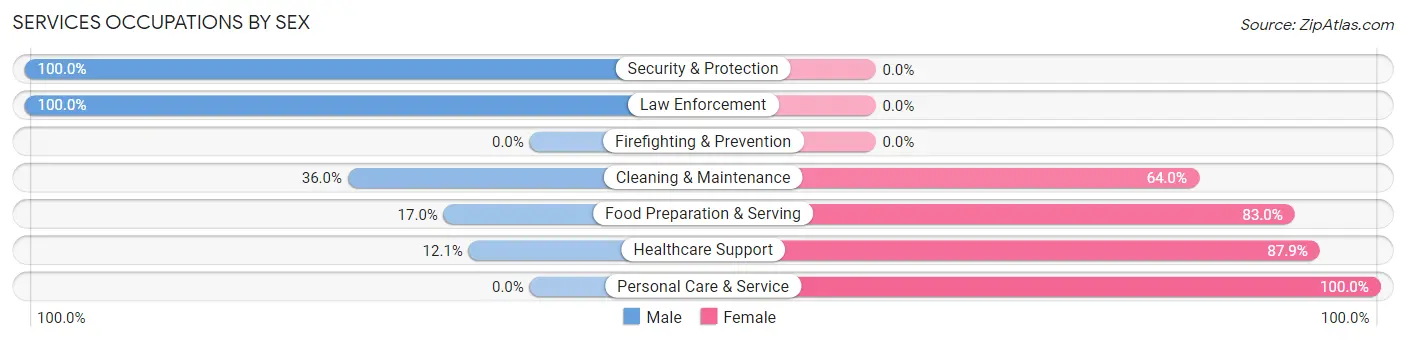
Services Occupations by Sex
Within the Services occupations in Sparta, the most male-oriented occupations are Security & Protection (100.0%), Law Enforcement (100.0%), and Cleaning & Maintenance (36.0%), while the most female-oriented occupations are Personal Care & Service (100.0%), Healthcare Support (87.9%), and Food Preparation & Serving (83.0%).
| Occupation | Male | Female |
| Healthcare Support | 7 (12.1%) | 51 (87.9%) |
| Security & Protection | 6 (100.0%) | 0 (0.0%) |
| Firefighting & Prevention | 0 (0.0%) | 0 (0.0%) |
| Law Enforcement | 6 (100.0%) | 0 (0.0%) |
| Food Preparation & Serving | 8 (17.0%) | 39 (83.0%) |
| Cleaning & Maintenance | 9 (36.0%) | 16 (64.0%) |
| Personal Care & Service | 0 (0.0%) | 18 (100.0%) |
| Total (Category) | 30 (19.5%) | 124 (80.5%) |
| Total (Overall) | 566 (49.4%) | 580 (50.6%) |
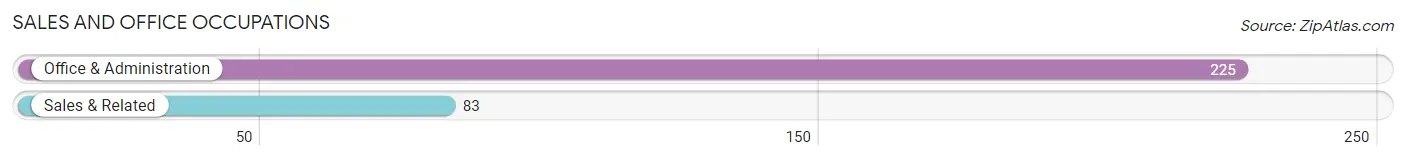
Sales and Office Occupations
The most common Sales and Office occupations in Sparta are Office & Administration (225 | 19.6%), and Sales & Related (83 | 7.2%).
Sales and Office Occupations by Sex
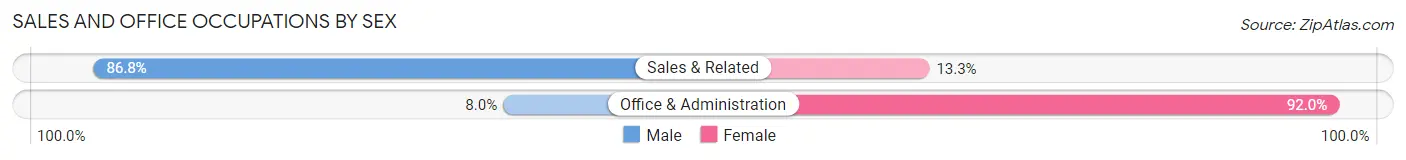
| Occupation | Male | Female |
| Sales & Related | 72 (86.8%) | 11 (13.3%) |
| Office & Administration | 18 (8.0%) | 207 (92.0%) |
| Total (Category) | 90 (29.2%) | 218 (70.8%) |
| Total (Overall) | 566 (49.4%) | 580 (50.6%) |
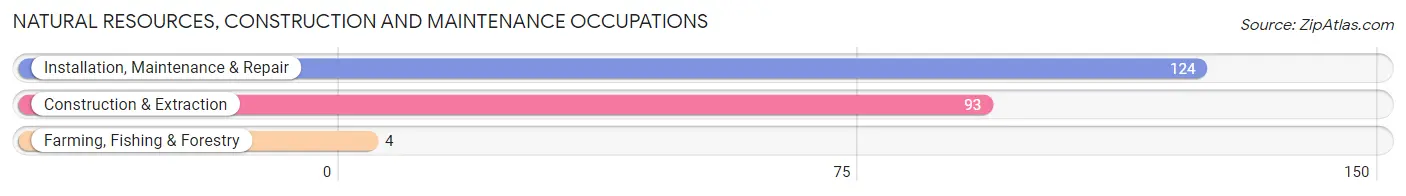
Natural Resources, Construction and Maintenance Occupations
The most common Natural Resources, Construction and Maintenance occupations in Sparta are Installation, Maintenance & Repair (124 | 10.8%), Construction & Extraction (93 | 8.1%), and Farming, Fishing & Forestry (4 | 0.4%).
Natural Resources, Construction and Maintenance Occupations by Sex
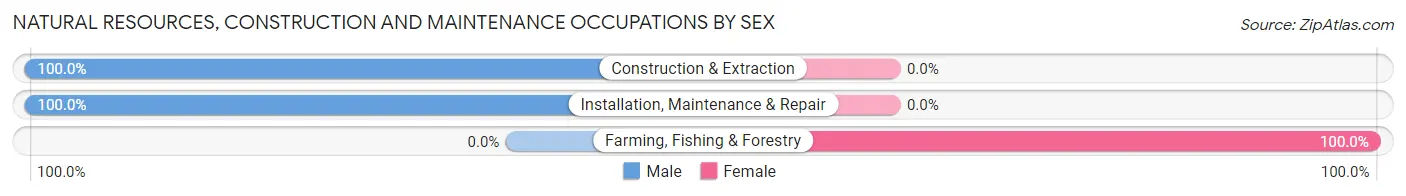
| Occupation | Male | Female |
| Farming, Fishing & Forestry | 0 (0.0%) | 4 (100.0%) |
| Construction & Extraction | 93 (100.0%) | 0 (0.0%) |
| Installation, Maintenance & Repair | 124 (100.0%) | 0 (0.0%) |
| Total (Category) | 217 (98.2%) | 4 (1.8%) |
| Total (Overall) | 566 (49.4%) | 580 (50.6%) |
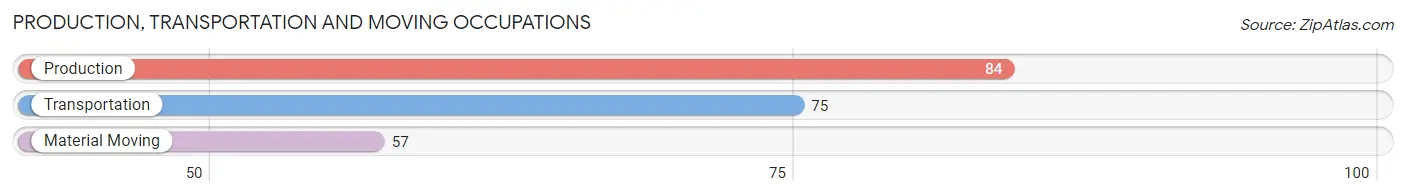
Production, Transportation and Moving Occupations
The most common Production, Transportation and Moving occupations in Sparta are Production (84 | 7.3%), Transportation (75 | 6.5%), and Material Moving (57 | 5.0%).
Production, Transportation and Moving Occupations by Sex
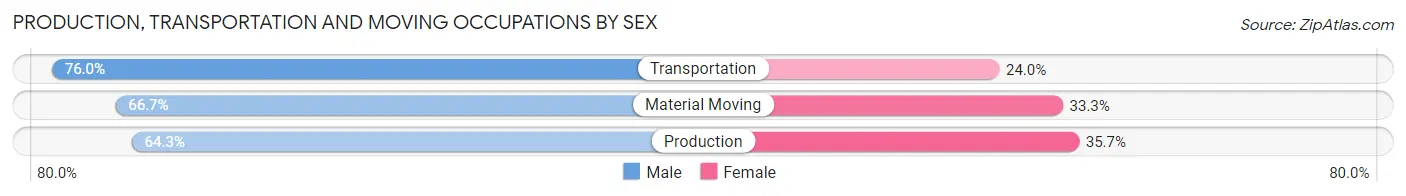
| Occupation | Male | Female |
| Production | 54 (64.3%) | 30 (35.7%) |
| Transportation | 57 (76.0%) | 18 (24.0%) |
| Material Moving | 38 (66.7%) | 19 (33.3%) |
| Total (Category) | 149 (69.0%) | 67 (31.0%) |
| Total (Overall) | 566 (49.4%) | 580 (50.6%) |
Employment Industries by Sex in Sparta
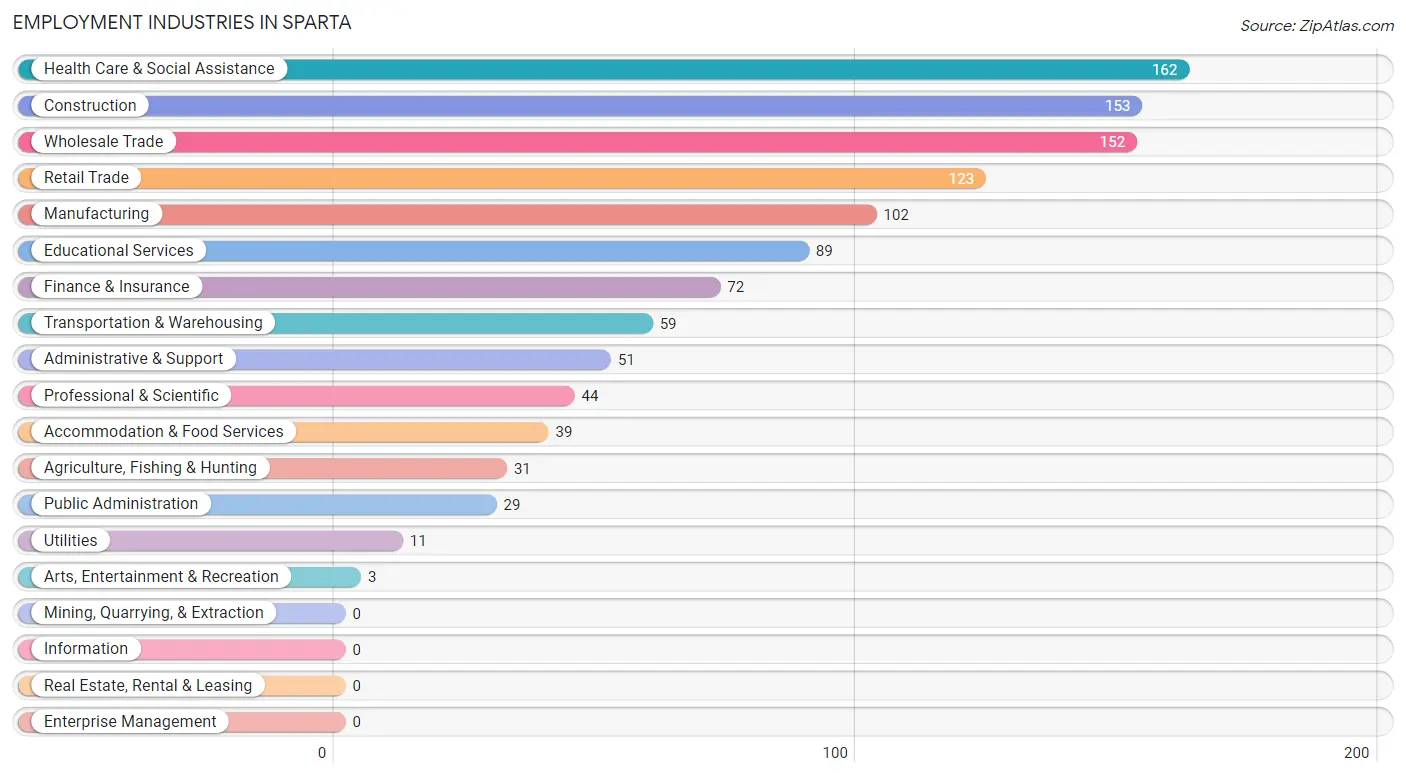
Employment Industries in Sparta
The major employment industries in Sparta include Health Care & Social Assistance (162 | 14.1%), Construction (153 | 13.4%), Wholesale Trade (152 | 13.3%), Retail Trade (123 | 10.7%), and Manufacturing (102 | 8.9%).
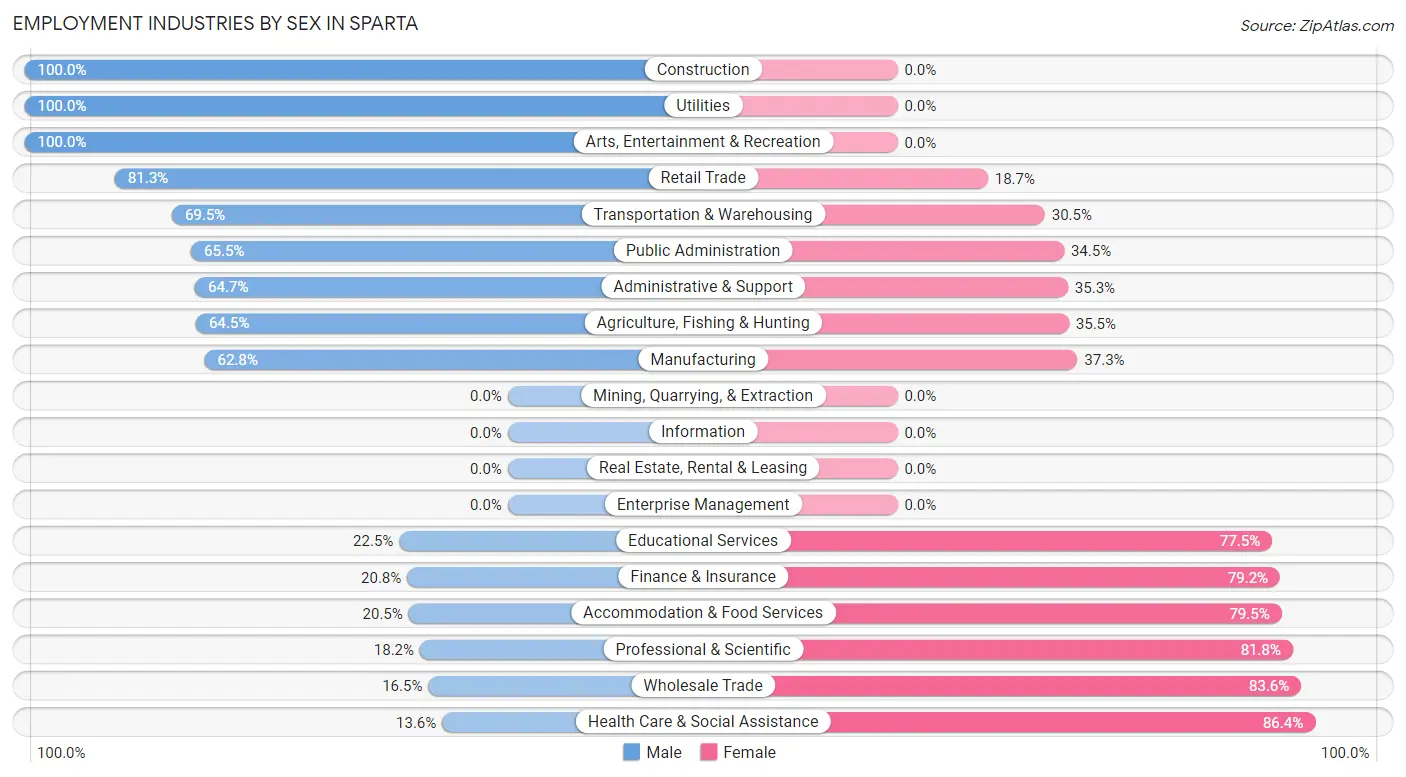
Employment Industries by Sex in Sparta
The Sparta industries that see more men than women are Construction (100.0%), Utilities (100.0%), and Arts, Entertainment & Recreation (100.0%), whereas the industries that tend to have a higher number of women are Health Care & Social Assistance (86.4%), Wholesale Trade (83.6%), and Professional & Scientific (81.8%).
| Industry | Male | Female |
| Agriculture, Fishing & Hunting | 20 (64.5%) | 11 (35.5%) |
| Mining, Quarrying, & Extraction | 0 (0.0%) | 0 (0.0%) |
| Construction | 153 (100.0%) | 0 (0.0%) |
| Manufacturing | 64 (62.7%) | 38 (37.2%) |
| Wholesale Trade | 25 (16.5%) | 127 (83.6%) |
| Retail Trade | 100 (81.3%) | 23 (18.7%) |
| Transportation & Warehousing | 41 (69.5%) | 18 (30.5%) |
| Utilities | 11 (100.0%) | 0 (0.0%) |
| Information | 0 (0.0%) | 0 (0.0%) |
| Finance & Insurance | 15 (20.8%) | 57 (79.2%) |
| Real Estate, Rental & Leasing | 0 (0.0%) | 0 (0.0%) |
| Professional & Scientific | 8 (18.2%) | 36 (81.8%) |
| Enterprise Management | 0 (0.0%) | 0 (0.0%) |
| Administrative & Support | 33 (64.7%) | 18 (35.3%) |
| Educational Services | 20 (22.5%) | 69 (77.5%) |
| Health Care & Social Assistance | 22 (13.6%) | 140 (86.4%) |
| Arts, Entertainment & Recreation | 3 (100.0%) | 0 (0.0%) |
| Accommodation & Food Services | 8 (20.5%) | 31 (79.5%) |
| Public Administration | 19 (65.5%) | 10 (34.5%) |
| Total | 566 (49.4%) | 580 (50.6%) |
Education in Sparta
School Enrollment in Sparta
The most common levels of schooling among the 560 students in Sparta are college / undergraduate (163 | 29.1%), middle school (129 | 23.0%), and high school (112 | 20.0%).
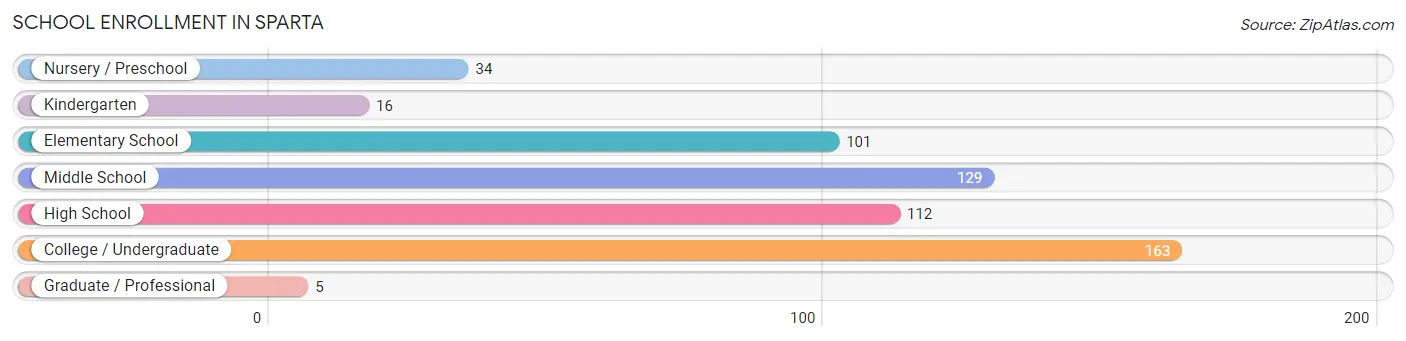
| School Level | # Students | % Students |
| Nursery / Preschool | 34 | 6.1% |
| Kindergarten | 16 | 2.9% |
| Elementary School | 101 | 18.0% |
| Middle School | 129 | 23.0% |
| High School | 112 | 20.0% |
| College / Undergraduate | 163 | 29.1% |
| Graduate / Professional | 5 | 0.9% |
| Total | 560 | 100.0% |
School Enrollment by Age by Funding Source in Sparta
Out of a total of 560 students who are enrolled in schools in Sparta, 63 (11.3%) attend a private institution, while the remaining 497 (88.7%) are enrolled in public schools. The age group of 20 to 24 year olds has the highest likelihood of being enrolled in private schools, with 8 (44.4% in the age bracket) enrolled. Conversely, the age group of 3 to 4 year olds has the lowest likelihood of being enrolled in a private school, with 24 (100.0% in the age bracket) attending a public institution.
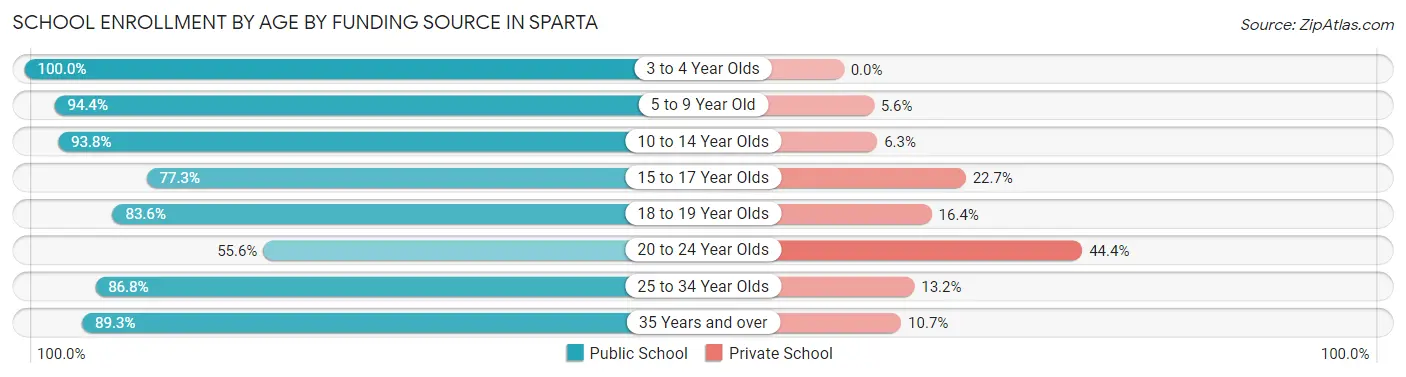
| Age Bracket | Public School | Private School |
| 3 to 4 Year Olds | 24 (100.0%) | 0 (0.0%) |
| 5 to 9 Year Old | 118 (94.4%) | 7 (5.6%) |
| 10 to 14 Year Olds | 135 (93.8%) | 9 (6.2%) |
| 15 to 17 Year Olds | 51 (77.3%) | 15 (22.7%) |
| 18 to 19 Year Olds | 51 (83.6%) | 10 (16.4%) |
| 20 to 24 Year Olds | 10 (55.6%) | 8 (44.4%) |
| 25 to 34 Year Olds | 33 (86.8%) | 5 (13.2%) |
| 35 Years and over | 75 (89.3%) | 9 (10.7%) |
| Total | 497 (88.8%) | 63 (11.3%) |
Educational Attainment by Field of Study in Sparta
Business (48 | 34.0%), education (32 | 22.7%), bio, nature & agricultural (26 | 18.4%), computers & mathematics (7 | 5.0%), and liberal arts & history (7 | 5.0%) are the most common fields of study among 141 individuals in Sparta who have obtained a bachelor's degree or higher.
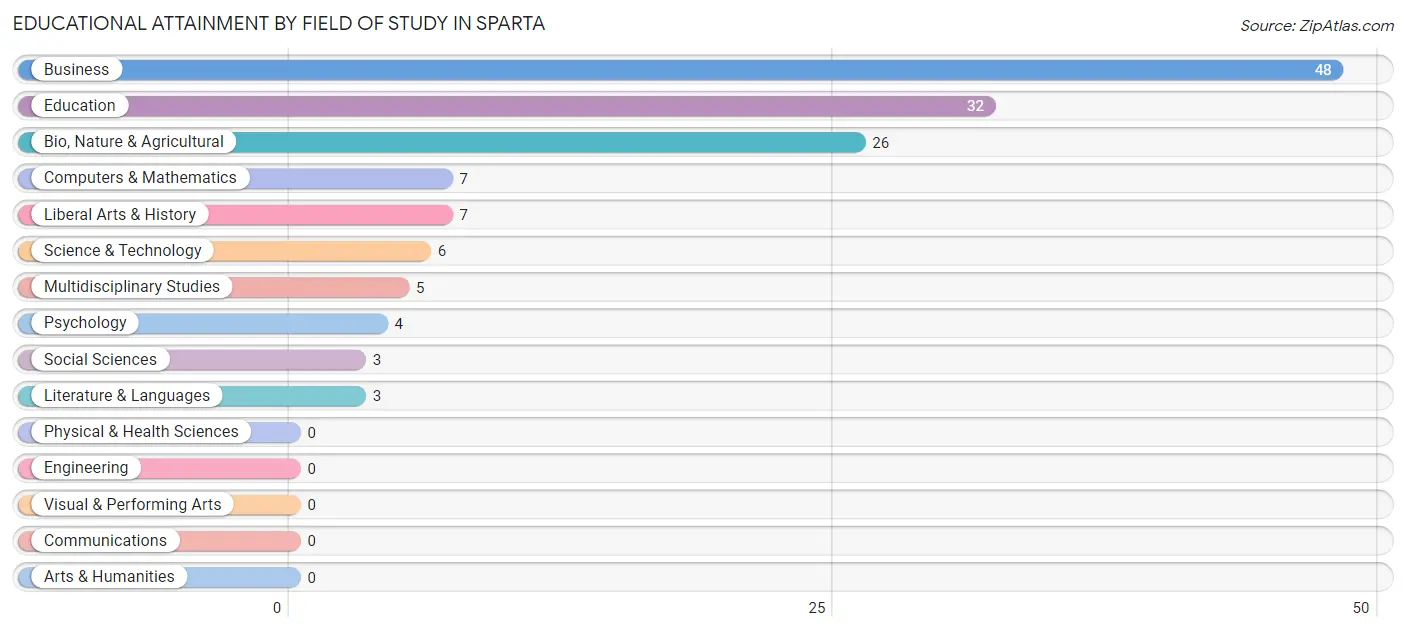
| Field of Study | # Graduates | % Graduates |
| Computers & Mathematics | 7 | 5.0% |
| Bio, Nature & Agricultural | 26 | 18.4% |
| Physical & Health Sciences | 0 | 0.0% |
| Psychology | 4 | 2.8% |
| Social Sciences | 3 | 2.1% |
| Engineering | 0 | 0.0% |
| Multidisciplinary Studies | 5 | 3.5% |
| Science & Technology | 6 | 4.3% |
| Business | 48 | 34.0% |
| Education | 32 | 22.7% |
| Literature & Languages | 3 | 2.1% |
| Liberal Arts & History | 7 | 5.0% |
| Visual & Performing Arts | 0 | 0.0% |
| Communications | 0 | 0.0% |
| Arts & Humanities | 0 | 0.0% |
| Total | 141 | 100.0% |
Transportation & Commute in Sparta
Vehicle Availability by Sex in Sparta
The most prevalent vehicle ownership categories in Sparta are males with 2 vehicles (306, accounting for 54.1%) and females with 2 vehicles (330, making up 53.2%).
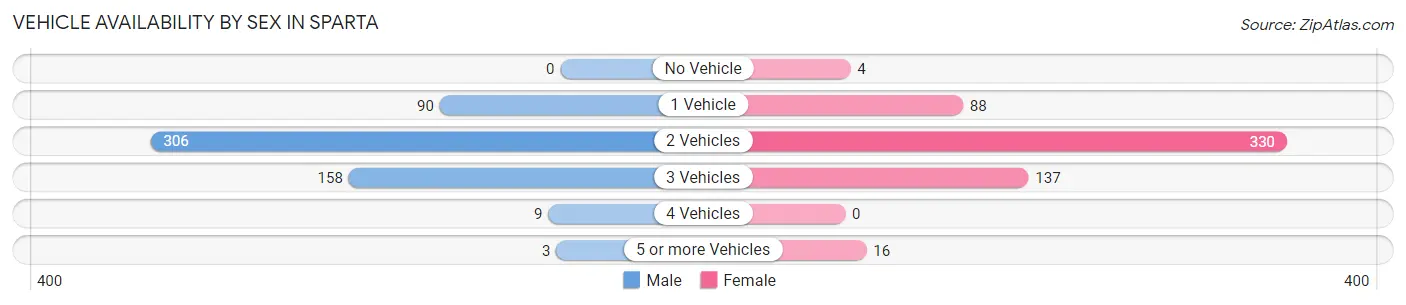
| Vehicles Available | Male | Female |
| No Vehicle | 0 (0.0%) | 4 (0.7%) |
| 1 Vehicle | 90 (15.9%) | 88 (15.3%) |
| 2 Vehicles | 306 (54.1%) | 330 (57.4%) |
| 3 Vehicles | 158 (27.9%) | 137 (23.8%) |
| 4 Vehicles | 9 (1.6%) | 0 (0.0%) |
| 5 or more Vehicles | 3 (0.5%) | 16 (2.8%) |
| Total | 566 (100.0%) | 575 (100.0%) |
Commute Time in Sparta
The most frequently occuring commute durations in Sparta are 45 to 59 minutes (306 commuters, 27.5%), 30 to 34 minutes (189 commuters, 17.0%), and 20 to 24 minutes (113 commuters, 10.2%).
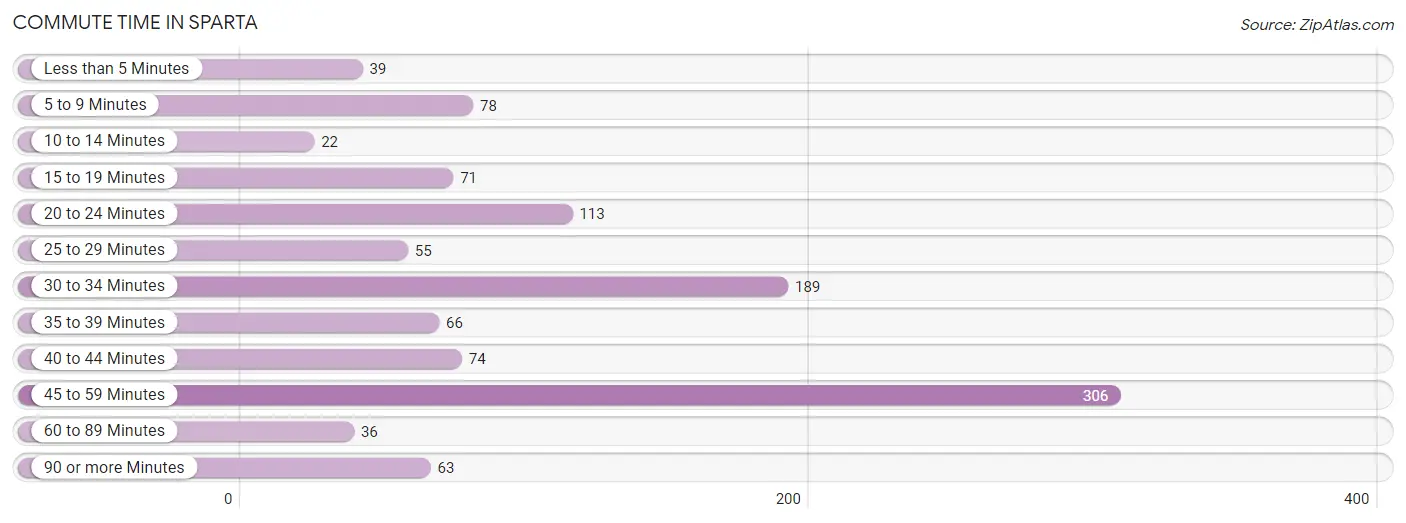
| Commute Time | # Commuters | % Commuters |
| Less than 5 Minutes | 39 | 3.5% |
| 5 to 9 Minutes | 78 | 7.0% |
| 10 to 14 Minutes | 22 | 2.0% |
| 15 to 19 Minutes | 71 | 6.4% |
| 20 to 24 Minutes | 113 | 10.2% |
| 25 to 29 Minutes | 55 | 5.0% |
| 30 to 34 Minutes | 189 | 17.0% |
| 35 to 39 Minutes | 66 | 5.9% |
| 40 to 44 Minutes | 74 | 6.7% |
| 45 to 59 Minutes | 306 | 27.5% |
| 60 to 89 Minutes | 36 | 3.2% |
| 90 or more Minutes | 63 | 5.7% |
Commute Time by Sex in Sparta
The most common commute times in Sparta are 45 to 59 minutes (139 commuters, 25.7%) for males and 45 to 59 minutes (167 commuters, 29.2%) for females.
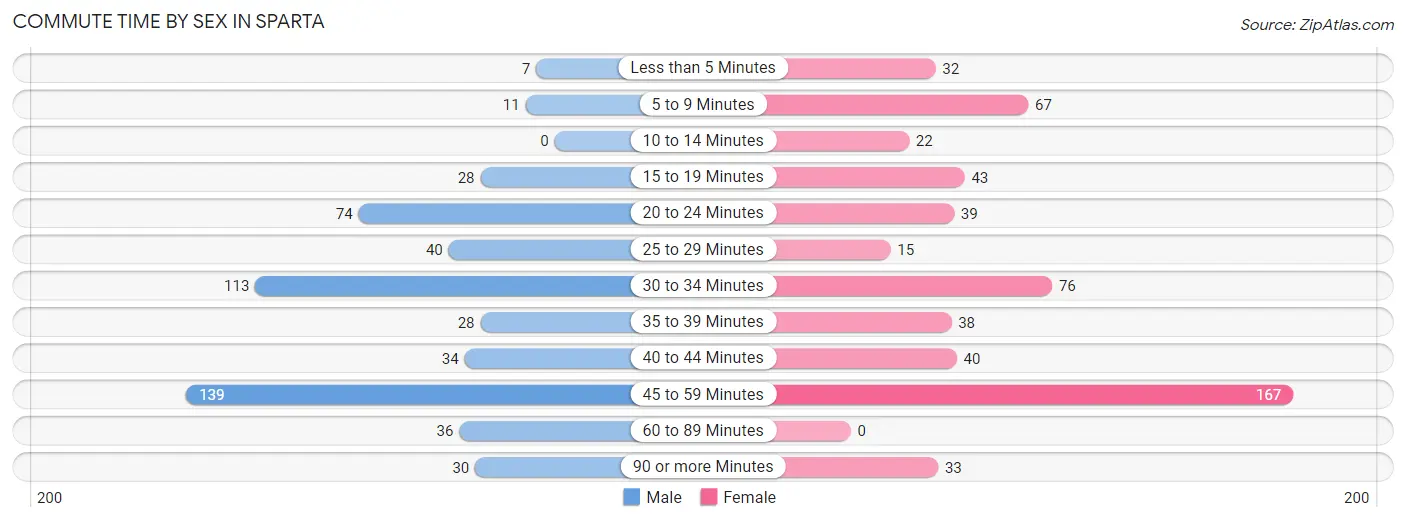
| Commute Time | Male | Female |
| Less than 5 Minutes | 7 (1.3%) | 32 (5.6%) |
| 5 to 9 Minutes | 11 (2.0%) | 67 (11.7%) |
| 10 to 14 Minutes | 0 (0.0%) | 22 (3.8%) |
| 15 to 19 Minutes | 28 (5.2%) | 43 (7.5%) |
| 20 to 24 Minutes | 74 (13.7%) | 39 (6.8%) |
| 25 to 29 Minutes | 40 (7.4%) | 15 (2.6%) |
| 30 to 34 Minutes | 113 (20.9%) | 76 (13.3%) |
| 35 to 39 Minutes | 28 (5.2%) | 38 (6.6%) |
| 40 to 44 Minutes | 34 (6.3%) | 40 (7.0%) |
| 45 to 59 Minutes | 139 (25.7%) | 167 (29.2%) |
| 60 to 89 Minutes | 36 (6.7%) | 0 (0.0%) |
| 90 or more Minutes | 30 (5.6%) | 33 (5.8%) |
Time of Departure to Work by Sex in Sparta
The most frequent times of departure to work in Sparta are 6:00 AM to 6:29 AM (138, 25.6%) for males and 7:00 AM to 7:29 AM (127, 22.2%) for females.
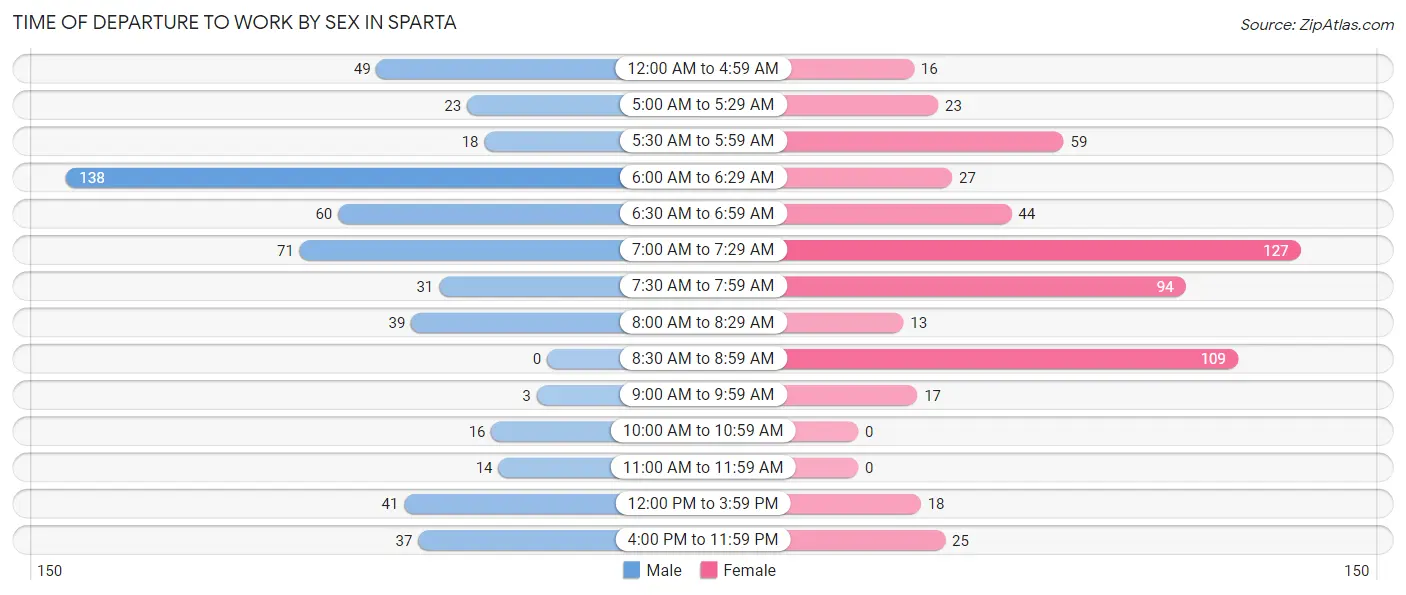
| Time of Departure | Male | Female |
| 12:00 AM to 4:59 AM | 49 (9.1%) | 16 (2.8%) |
| 5:00 AM to 5:29 AM | 23 (4.3%) | 23 (4.0%) |
| 5:30 AM to 5:59 AM | 18 (3.3%) | 59 (10.3%) |
| 6:00 AM to 6:29 AM | 138 (25.6%) | 27 (4.7%) |
| 6:30 AM to 6:59 AM | 60 (11.1%) | 44 (7.7%) |
| 7:00 AM to 7:29 AM | 71 (13.2%) | 127 (22.2%) |
| 7:30 AM to 7:59 AM | 31 (5.7%) | 94 (16.4%) |
| 8:00 AM to 8:29 AM | 39 (7.2%) | 13 (2.3%) |
| 8:30 AM to 8:59 AM | 0 (0.0%) | 109 (19.1%) |
| 9:00 AM to 9:59 AM | 3 (0.6%) | 17 (3.0%) |
| 10:00 AM to 10:59 AM | 16 (3.0%) | 0 (0.0%) |
| 11:00 AM to 11:59 AM | 14 (2.6%) | 0 (0.0%) |
| 12:00 PM to 3:59 PM | 41 (7.6%) | 18 (3.2%) |
| 4:00 PM to 11:59 PM | 37 (6.9%) | 25 (4.4%) |
| Total | 540 (100.0%) | 572 (100.0%) |
Housing Occupancy in Sparta
Occupancy by Ownership in Sparta
Of the total 966 dwellings in Sparta, owner-occupied units account for 654 (67.7%), while renter-occupied units make up 312 (32.3%).
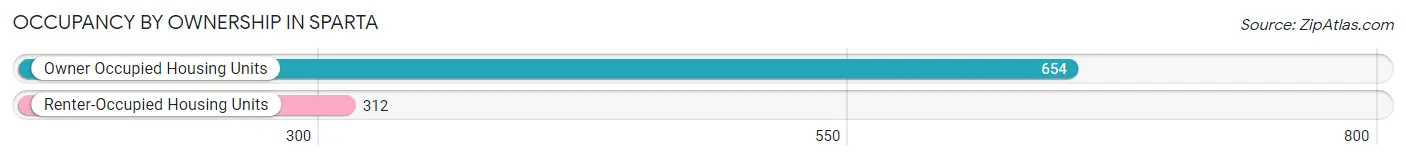
| Occupancy | # Housing Units | % Housing Units |
| Owner Occupied Housing Units | 654 | 67.7% |
| Renter-Occupied Housing Units | 312 | 32.3% |
| Total Occupied Housing Units | 966 | 100.0% |
Occupancy by Household Size in Sparta
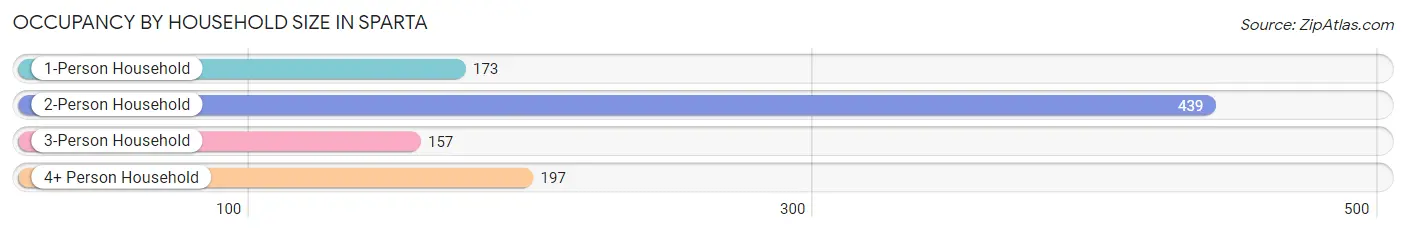
| Household Size | # Housing Units | % Housing Units |
| 1-Person Household | 173 | 17.9% |
| 2-Person Household | 439 | 45.5% |
| 3-Person Household | 157 | 16.3% |
| 4+ Person Household | 197 | 20.4% |
| Total Housing Units | 966 | 100.0% |
Occupancy by Ownership by Household Size in Sparta
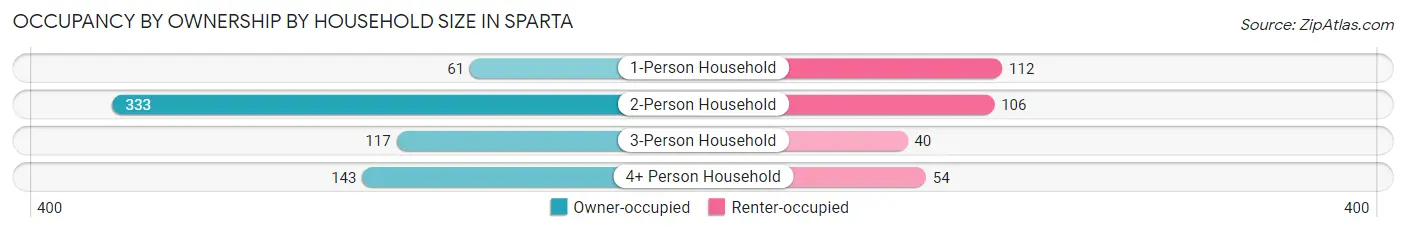
| Household Size | Owner-occupied | Renter-occupied |
| 1-Person Household | 61 (35.3%) | 112 (64.7%) |
| 2-Person Household | 333 (75.8%) | 106 (24.1%) |
| 3-Person Household | 117 (74.5%) | 40 (25.5%) |
| 4+ Person Household | 143 (72.6%) | 54 (27.4%) |
| Total Housing Units | 654 (67.7%) | 312 (32.3%) |
Occupancy by Educational Attainment in Sparta
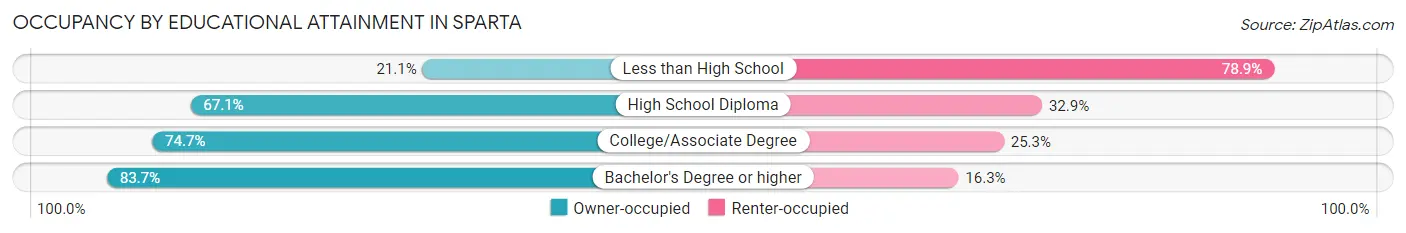
| Household Size | Owner-occupied | Renter-occupied |
| Less than High School | 19 (21.1%) | 71 (78.9%) |
| High School Diploma | 245 (67.1%) | 120 (32.9%) |
| College/Associate Degree | 313 (74.7%) | 106 (25.3%) |
| Bachelor's Degree or higher | 77 (83.7%) | 15 (16.3%) |
Occupancy by Age of Householder in Sparta
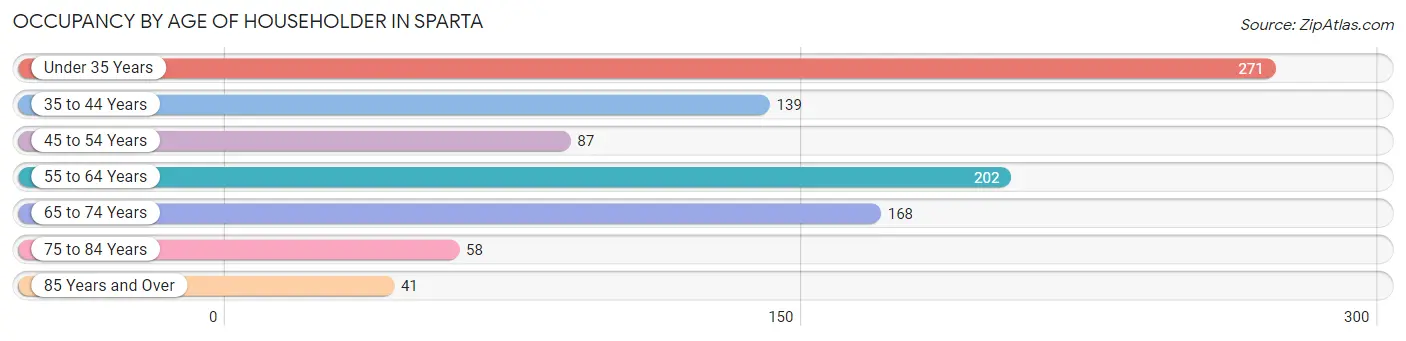
| Age Bracket | # Households | % Households |
| Under 35 Years | 271 | 28.1% |
| 35 to 44 Years | 139 | 14.4% |
| 45 to 54 Years | 87 | 9.0% |
| 55 to 64 Years | 202 | 20.9% |
| 65 to 74 Years | 168 | 17.4% |
| 75 to 84 Years | 58 | 6.0% |
| 85 Years and Over | 41 | 4.2% |
| Total | 966 | 100.0% |
Housing Finances in Sparta
Median Income by Occupancy in Sparta
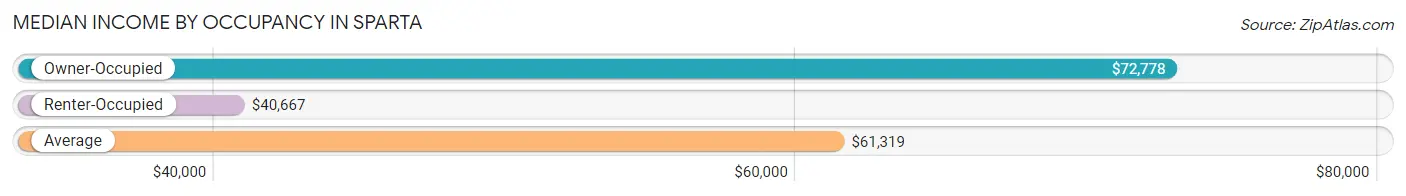
| Occupancy Type | # Households | Median Income |
| Owner-Occupied | 654 (67.7%) | $72,778 |
| Renter-Occupied | 312 (32.3%) | $40,667 |
| Average | 966 (100.0%) | $61,319 |
Occupancy by Householder Income Bracket in Sparta
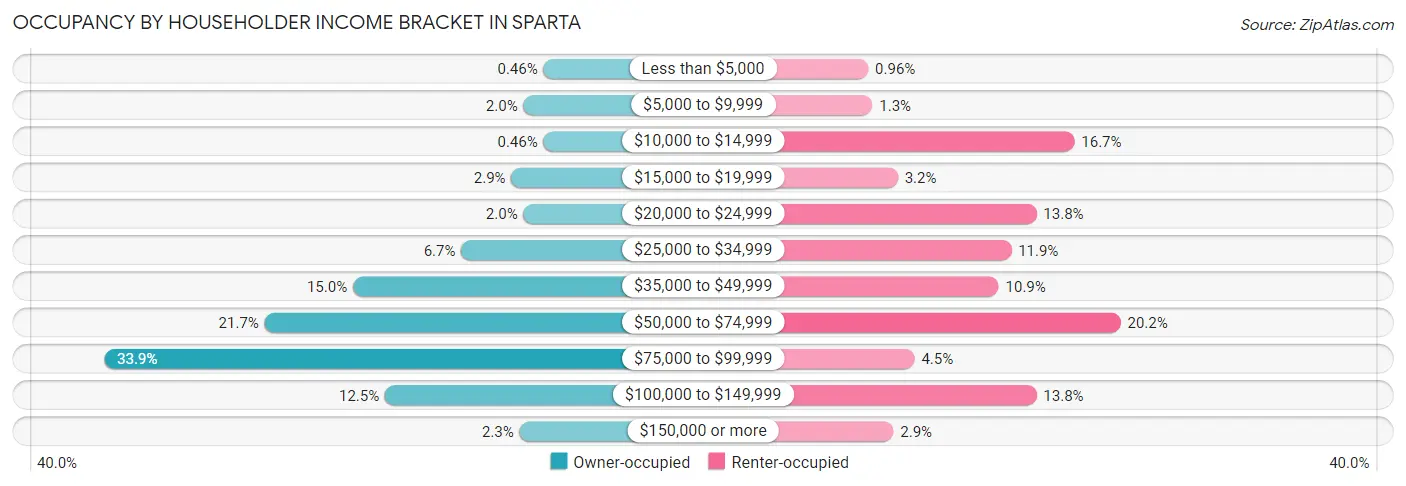
| Income Bracket | Owner-occupied | Renter-occupied |
| Less than $5,000 | 3 (0.5%) | 3 (1.0%) |
| $5,000 to $9,999 | 13 (2.0%) | 4 (1.3%) |
| $10,000 to $14,999 | 3 (0.5%) | 52 (16.7%) |
| $15,000 to $19,999 | 19 (2.9%) | 10 (3.2%) |
| $20,000 to $24,999 | 13 (2.0%) | 43 (13.8%) |
| $25,000 to $34,999 | 44 (6.7%) | 37 (11.9%) |
| $35,000 to $49,999 | 98 (15.0%) | 34 (10.9%) |
| $50,000 to $74,999 | 142 (21.7%) | 63 (20.2%) |
| $75,000 to $99,999 | 222 (33.9%) | 14 (4.5%) |
| $100,000 to $149,999 | 82 (12.5%) | 43 (13.8%) |
| $150,000 or more | 15 (2.3%) | 9 (2.9%) |
| Total | 654 (100.0%) | 312 (100.0%) |
Monthly Housing Cost Tiers in Sparta
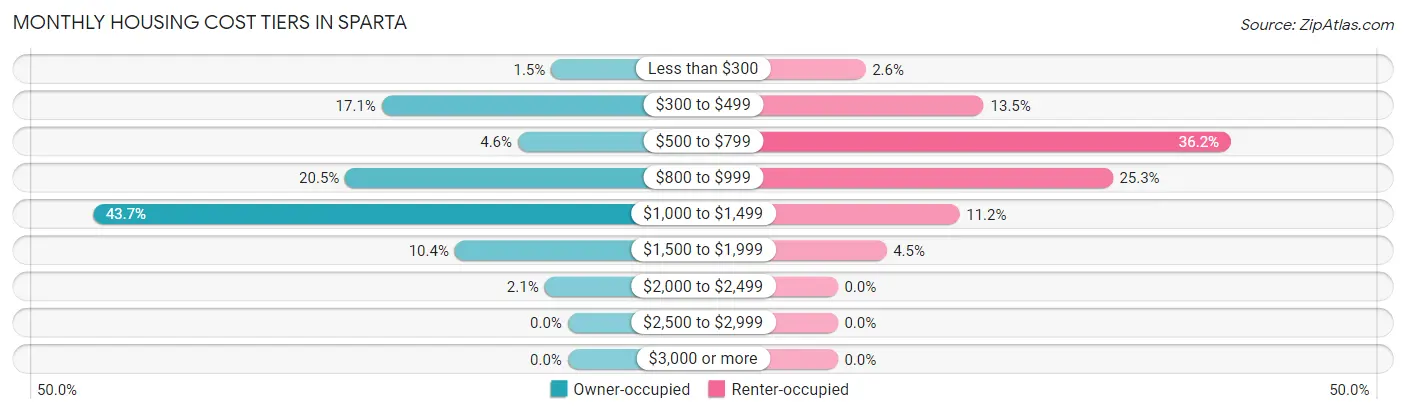
| Monthly Cost | Owner-occupied | Renter-occupied |
| Less than $300 | 10 (1.5%) | 8 (2.6%) |
| $300 to $499 | 112 (17.1%) | 42 (13.5%) |
| $500 to $799 | 30 (4.6%) | 113 (36.2%) |
| $800 to $999 | 134 (20.5%) | 79 (25.3%) |
| $1,000 to $1,499 | 286 (43.7%) | 35 (11.2%) |
| $1,500 to $1,999 | 68 (10.4%) | 14 (4.5%) |
| $2,000 to $2,499 | 14 (2.1%) | 0 (0.0%) |
| $2,500 to $2,999 | 0 (0.0%) | 0 (0.0%) |
| $3,000 or more | 0 (0.0%) | 0 (0.0%) |
| Total | 654 (100.0%) | 312 (100.0%) |
Physical Housing Characteristics in Sparta
Housing Structures in Sparta
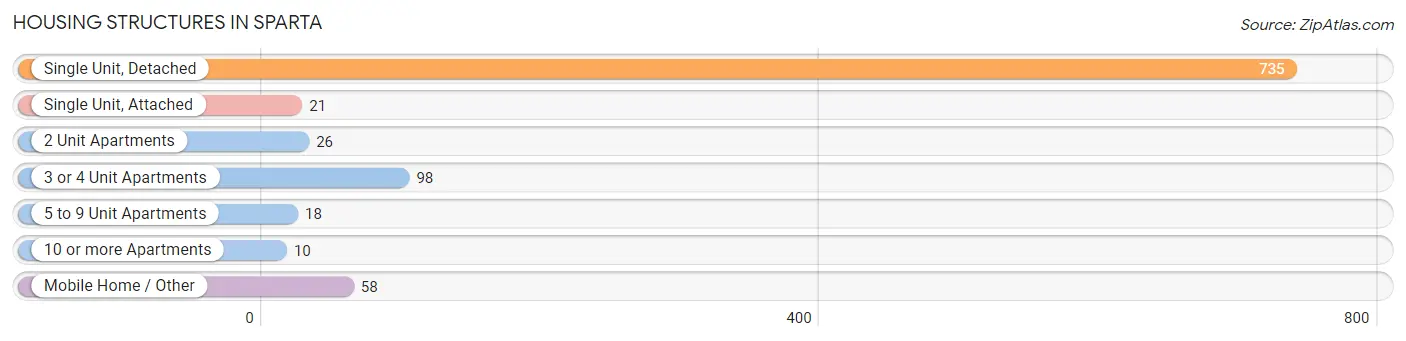
| Structure Type | # Housing Units | % Housing Units |
| Single Unit, Detached | 735 | 76.1% |
| Single Unit, Attached | 21 | 2.2% |
| 2 Unit Apartments | 26 | 2.7% |
| 3 or 4 Unit Apartments | 98 | 10.1% |
| 5 to 9 Unit Apartments | 18 | 1.9% |
| 10 or more Apartments | 10 | 1.0% |
| Mobile Home / Other | 58 | 6.0% |
| Total | 966 | 100.0% |
Housing Structures by Occupancy in Sparta
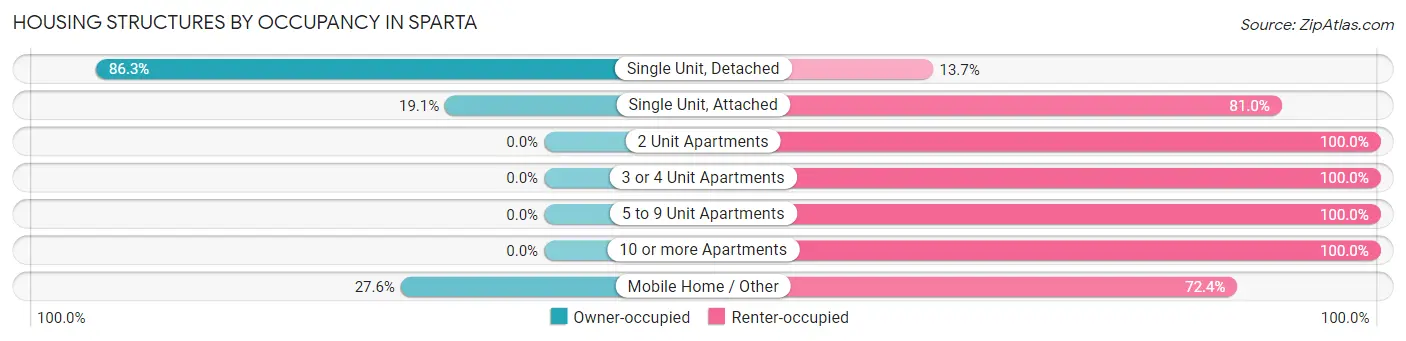
| Structure Type | Owner-occupied | Renter-occupied |
| Single Unit, Detached | 634 (86.3%) | 101 (13.7%) |
| Single Unit, Attached | 4 (19.1%) | 17 (80.9%) |
| 2 Unit Apartments | 0 (0.0%) | 26 (100.0%) |
| 3 or 4 Unit Apartments | 0 (0.0%) | 98 (100.0%) |
| 5 to 9 Unit Apartments | 0 (0.0%) | 18 (100.0%) |
| 10 or more Apartments | 0 (0.0%) | 10 (100.0%) |
| Mobile Home / Other | 16 (27.6%) | 42 (72.4%) |
| Total | 654 (67.7%) | 312 (32.3%) |
Housing Structures by Number of Rooms in Sparta
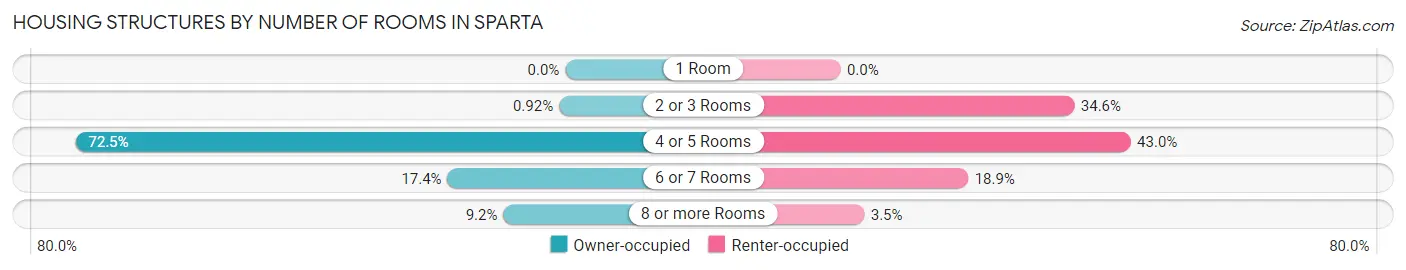
| Number of Rooms | Owner-occupied | Renter-occupied |
| 1 Room | 0 (0.0%) | 0 (0.0%) |
| 2 or 3 Rooms | 6 (0.9%) | 108 (34.6%) |
| 4 or 5 Rooms | 474 (72.5%) | 134 (42.9%) |
| 6 or 7 Rooms | 114 (17.4%) | 59 (18.9%) |
| 8 or more Rooms | 60 (9.2%) | 11 (3.5%) |
| Total | 654 (100.0%) | 312 (100.0%) |
Housing Structure by Heating Type in Sparta
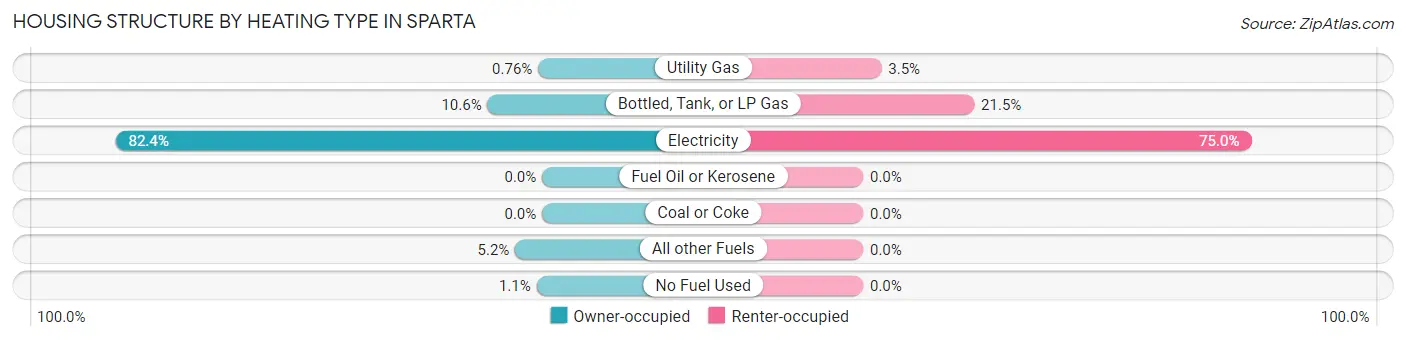
| Heating Type | Owner-occupied | Renter-occupied |
| Utility Gas | 5 (0.8%) | 11 (3.5%) |
| Bottled, Tank, or LP Gas | 69 (10.5%) | 67 (21.5%) |
| Electricity | 539 (82.4%) | 234 (75.0%) |
| Fuel Oil or Kerosene | 0 (0.0%) | 0 (0.0%) |
| Coal or Coke | 0 (0.0%) | 0 (0.0%) |
| All other Fuels | 34 (5.2%) | 0 (0.0%) |
| No Fuel Used | 7 (1.1%) | 0 (0.0%) |
| Total | 654 (100.0%) | 312 (100.0%) |
Household Vehicle Usage in Sparta
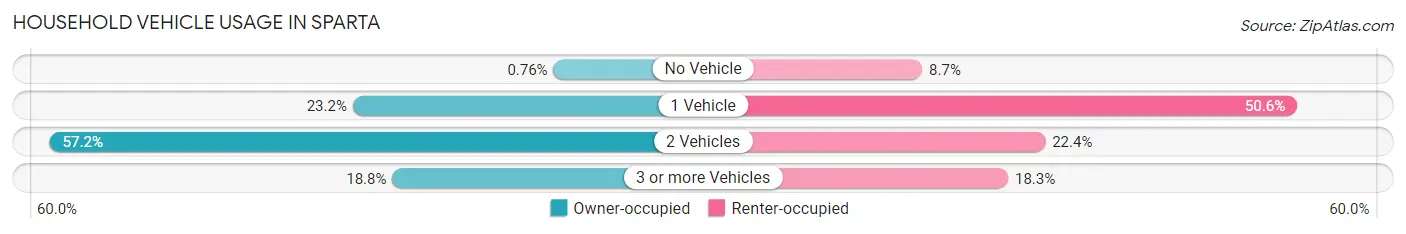
| Vehicles per Household | Owner-occupied | Renter-occupied |
| No Vehicle | 5 (0.8%) | 27 (8.6%) |
| 1 Vehicle | 152 (23.2%) | 158 (50.6%) |
| 2 Vehicles | 374 (57.2%) | 70 (22.4%) |
| 3 or more Vehicles | 123 (18.8%) | 57 (18.3%) |
| Total | 654 (100.0%) | 312 (100.0%) |
Real Estate & Mortgages in Sparta
Real Estate and Mortgage Overview in Sparta
| Characteristic | Without Mortgage | With Mortgage |
| Housing Units | 132 | 522 |
| Median Property Value | $109,300 | $171,300 |
| Median Household Income | $41,444 | $15 |
| Monthly Housing Costs | $358 | $0 |
| Real Estate Taxes | $783 | $38 |
Property Value by Mortgage Status in Sparta
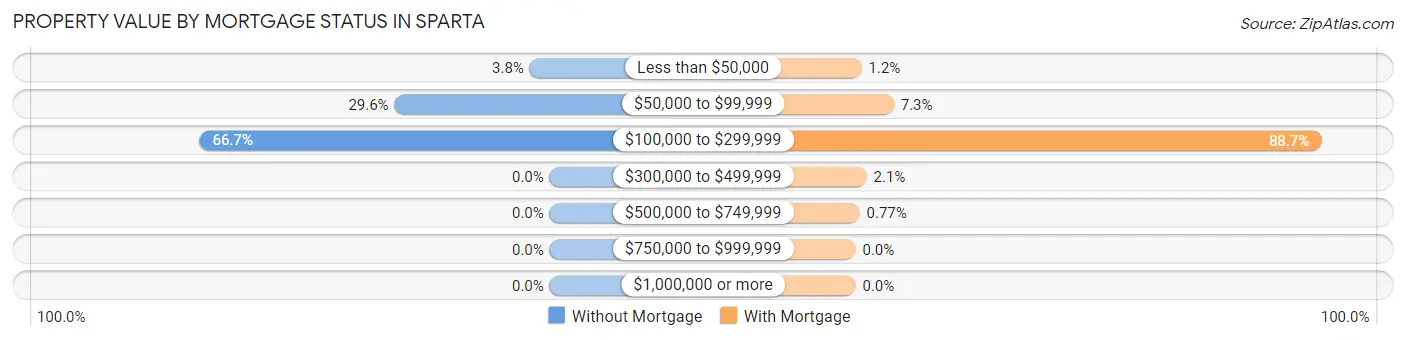
| Property Value | Without Mortgage | With Mortgage |
| Less than $50,000 | 5 (3.8%) | 6 (1.1%) |
| $50,000 to $99,999 | 39 (29.5%) | 38 (7.3%) |
| $100,000 to $299,999 | 88 (66.7%) | 463 (88.7%) |
| $300,000 to $499,999 | 0 (0.0%) | 11 (2.1%) |
| $500,000 to $749,999 | 0 (0.0%) | 4 (0.8%) |
| $750,000 to $999,999 | 0 (0.0%) | 0 (0.0%) |
| $1,000,000 or more | 0 (0.0%) | 0 (0.0%) |
| Total | 132 (100.0%) | 522 (100.0%) |
Household Income by Mortgage Status in Sparta
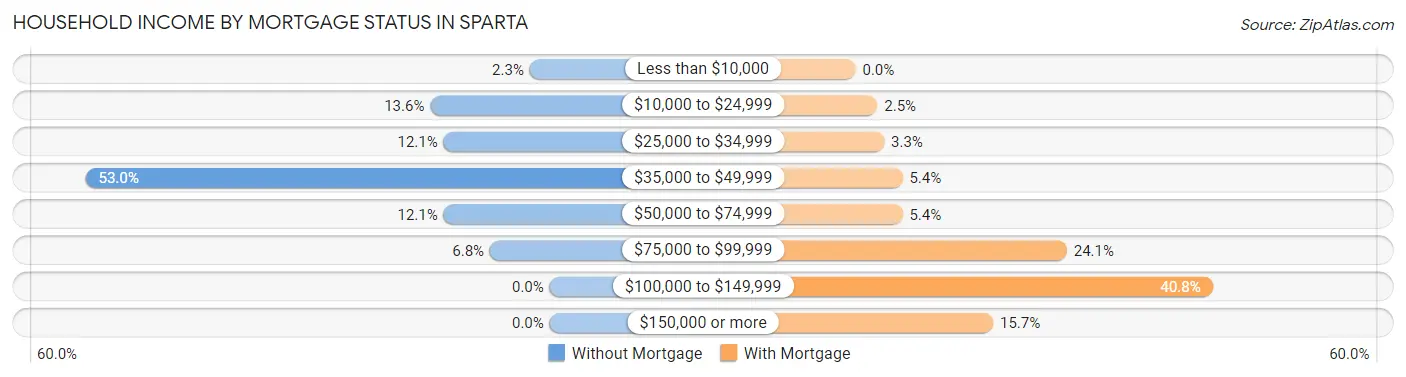
| Household Income | Without Mortgage | With Mortgage |
| Less than $10,000 | 3 (2.3%) | 0 (0.0%) |
| $10,000 to $24,999 | 18 (13.6%) | 13 (2.5%) |
| $25,000 to $34,999 | 16 (12.1%) | 17 (3.3%) |
| $35,000 to $49,999 | 70 (53.0%) | 28 (5.4%) |
| $50,000 to $74,999 | 16 (12.1%) | 28 (5.4%) |
| $75,000 to $99,999 | 9 (6.8%) | 126 (24.1%) |
| $100,000 to $149,999 | 0 (0.0%) | 213 (40.8%) |
| $150,000 or more | 0 (0.0%) | 82 (15.7%) |
| Total | 132 (100.0%) | 522 (100.0%) |
Property Value to Household Income Ratio in Sparta
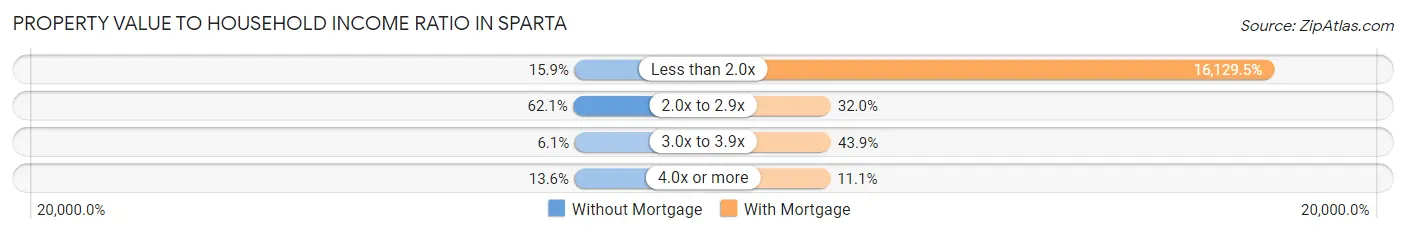
| Value-to-Income Ratio | Without Mortgage | With Mortgage |
| Less than 2.0x | 21 (15.9%) | 84,196 (16,129.5%) |
| 2.0x to 2.9x | 82 (62.1%) | 167 (32.0%) |
| 3.0x to 3.9x | 8 (6.1%) | 229 (43.9%) |
| 4.0x or more | 18 (13.6%) | 58 (11.1%) |
| Total | 132 (100.0%) | 522 (100.0%) |
Real Estate Taxes by Mortgage Status in Sparta
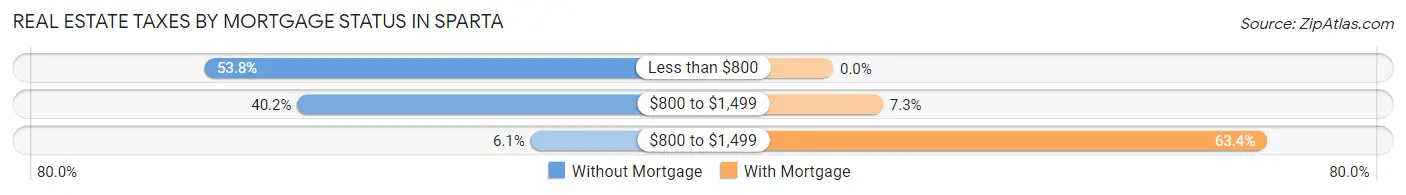
| Property Taxes | Without Mortgage | With Mortgage |
| Less than $800 | 71 (53.8%) | 0 (0.0%) |
| $800 to $1,499 | 53 (40.2%) | 38 (7.3%) |
| $800 to $1,499 | 8 (6.1%) | 331 (63.4%) |
| Total | 132 (100.0%) | 522 (100.0%) |
Health & Disability in Sparta
Health Insurance Coverage by Age in Sparta
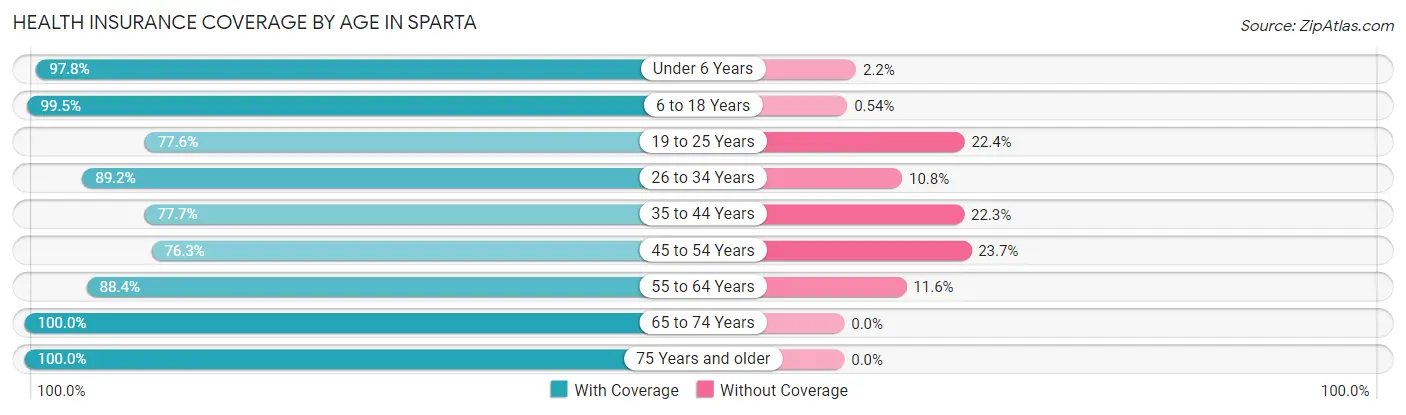
| Age Bracket | With Coverage | Without Coverage |
| Under 6 Years | 223 (97.8%) | 5 (2.2%) |
| 6 to 18 Years | 370 (99.5%) | 2 (0.5%) |
| 19 to 25 Years | 180 (77.6%) | 52 (22.4%) |
| 26 to 34 Years | 323 (89.2%) | 39 (10.8%) |
| 35 to 44 Years | 212 (77.7%) | 61 (22.3%) |
| 45 to 54 Years | 142 (76.3%) | 44 (23.7%) |
| 55 to 64 Years | 252 (88.4%) | 33 (11.6%) |
| 65 to 74 Years | 324 (100.0%) | 0 (0.0%) |
| 75 Years and older | 180 (100.0%) | 0 (0.0%) |
| Total | 2,206 (90.3%) | 236 (9.7%) |
Health Insurance Coverage by Citizenship Status in Sparta
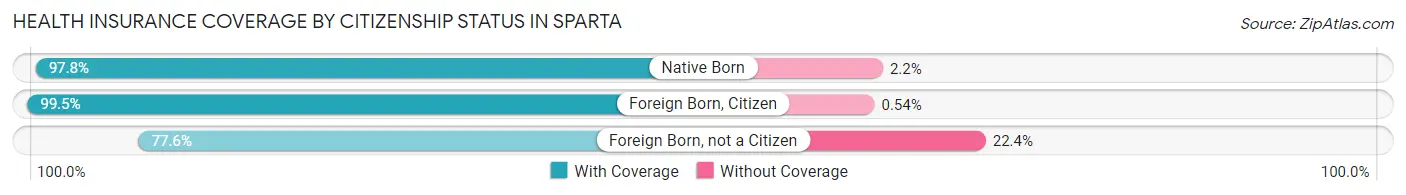
| Citizenship Status | With Coverage | Without Coverage |
| Native Born | 223 (97.8%) | 5 (2.2%) |
| Foreign Born, Citizen | 370 (99.5%) | 2 (0.5%) |
| Foreign Born, not a Citizen | 180 (77.6%) | 52 (22.4%) |
Health Insurance Coverage by Household Income in Sparta
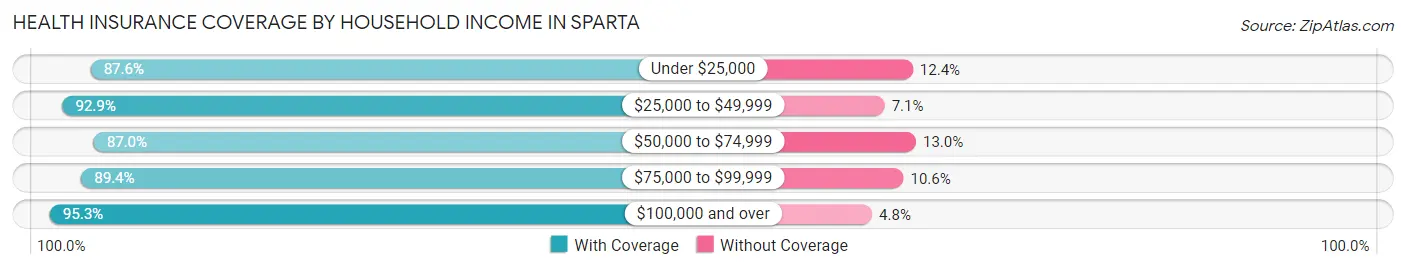
| Household Income | With Coverage | Without Coverage |
| Under $25,000 | 198 (87.6%) | 28 (12.4%) |
| $25,000 to $49,999 | 419 (92.9%) | 32 (7.1%) |
| $50,000 to $74,999 | 577 (87.0%) | 86 (13.0%) |
| $75,000 to $99,999 | 571 (89.4%) | 68 (10.6%) |
| $100,000 and over | 441 (95.3%) | 22 (4.8%) |
Public vs Private Health Insurance Coverage by Age in Sparta
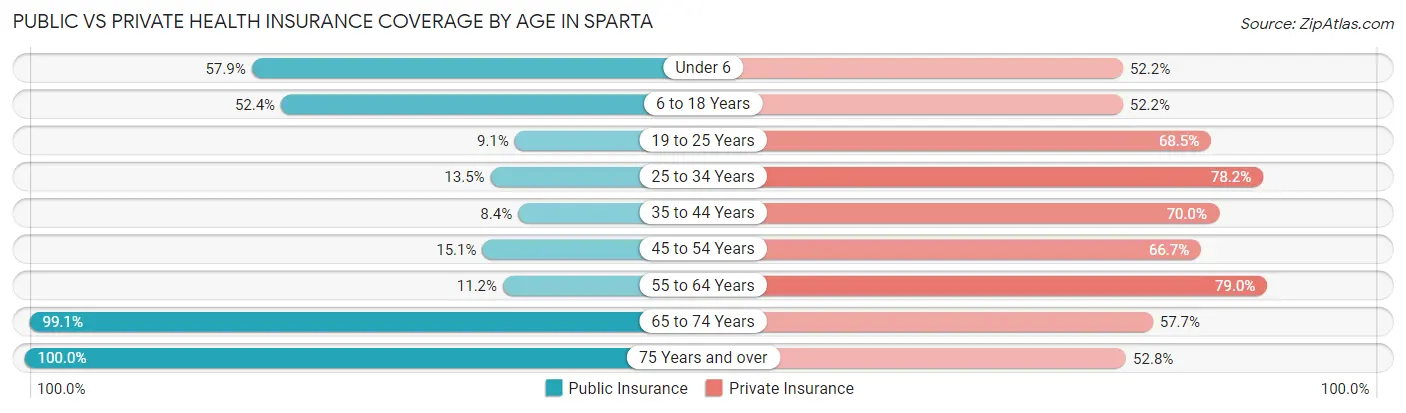
| Age Bracket | Public Insurance | Private Insurance |
| Under 6 | 132 (57.9%) | 119 (52.2%) |
| 6 to 18 Years | 195 (52.4%) | 194 (52.1%) |
| 19 to 25 Years | 21 (9.0%) | 159 (68.5%) |
| 25 to 34 Years | 49 (13.5%) | 283 (78.2%) |
| 35 to 44 Years | 23 (8.4%) | 191 (70.0%) |
| 45 to 54 Years | 28 (15.0%) | 124 (66.7%) |
| 55 to 64 Years | 32 (11.2%) | 225 (78.9%) |
| 65 to 74 Years | 321 (99.1%) | 187 (57.7%) |
| 75 Years and over | 180 (100.0%) | 95 (52.8%) |
| Total | 981 (40.2%) | 1,577 (64.6%) |
Disability Status by Sex by Age in Sparta
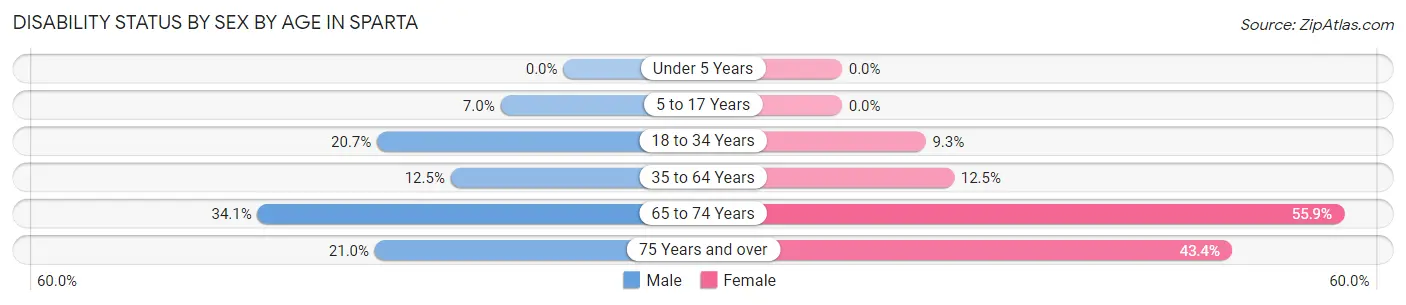
| Age Bracket | Male | Female |
| Under 5 Years | 0 (0.0%) | 0 (0.0%) |
| 5 to 17 Years | 14 (7.0%) | 0 (0.0%) |
| 18 to 34 Years | 67 (20.7%) | 30 (9.3%) |
| 35 to 64 Years | 41 (12.5%) | 52 (12.5%) |
| 65 to 74 Years | 47 (34.1%) | 104 (55.9%) |
| 75 Years and over | 17 (21.0%) | 43 (43.4%) |
Disability Class by Sex by Age in Sparta
Disability Class: Hearing Difficulty
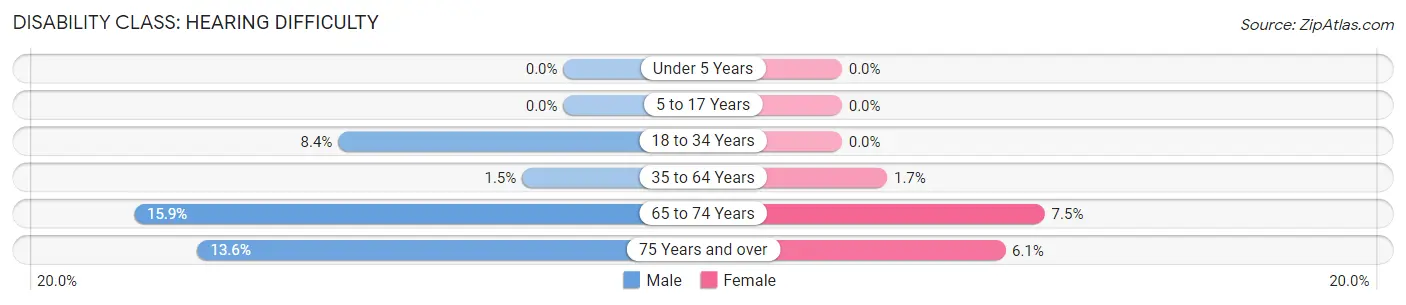
| Age Bracket | Male | Female |
| Under 5 Years | 0 (0.0%) | 0 (0.0%) |
| 5 to 17 Years | 0 (0.0%) | 0 (0.0%) |
| 18 to 34 Years | 27 (8.4%) | 0 (0.0%) |
| 35 to 64 Years | 5 (1.5%) | 7 (1.7%) |
| 65 to 74 Years | 22 (15.9%) | 14 (7.5%) |
| 75 Years and over | 11 (13.6%) | 6 (6.1%) |
Disability Class: Vision Difficulty
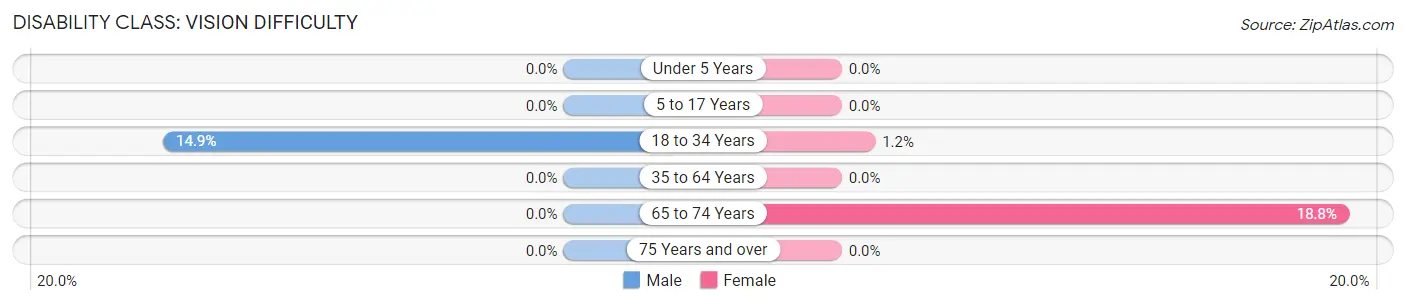
| Age Bracket | Male | Female |
| Under 5 Years | 0 (0.0%) | 0 (0.0%) |
| 5 to 17 Years | 0 (0.0%) | 0 (0.0%) |
| 18 to 34 Years | 48 (14.9%) | 4 (1.2%) |
| 35 to 64 Years | 0 (0.0%) | 0 (0.0%) |
| 65 to 74 Years | 0 (0.0%) | 35 (18.8%) |
| 75 Years and over | 0 (0.0%) | 0 (0.0%) |
Disability Class: Cognitive Difficulty
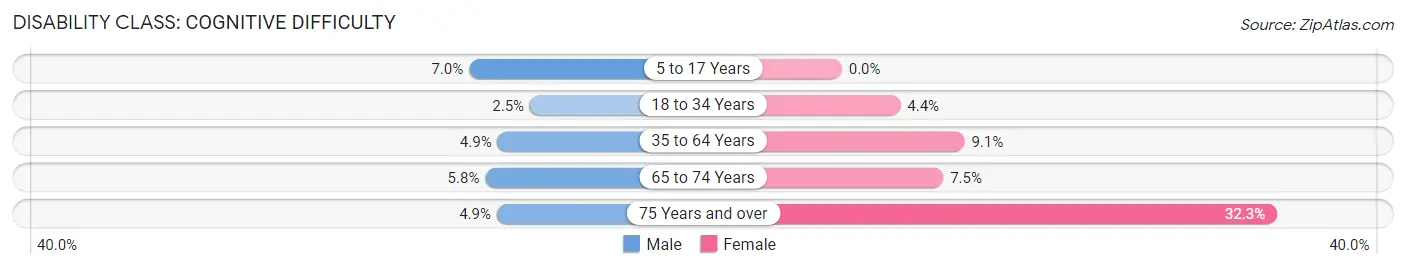
| Age Bracket | Male | Female |
| 5 to 17 Years | 14 (7.0%) | 0 (0.0%) |
| 18 to 34 Years | 8 (2.5%) | 14 (4.3%) |
| 35 to 64 Years | 16 (4.9%) | 38 (9.1%) |
| 65 to 74 Years | 8 (5.8%) | 14 (7.5%) |
| 75 Years and over | 4 (4.9%) | 32 (32.3%) |
Disability Class: Ambulatory Difficulty
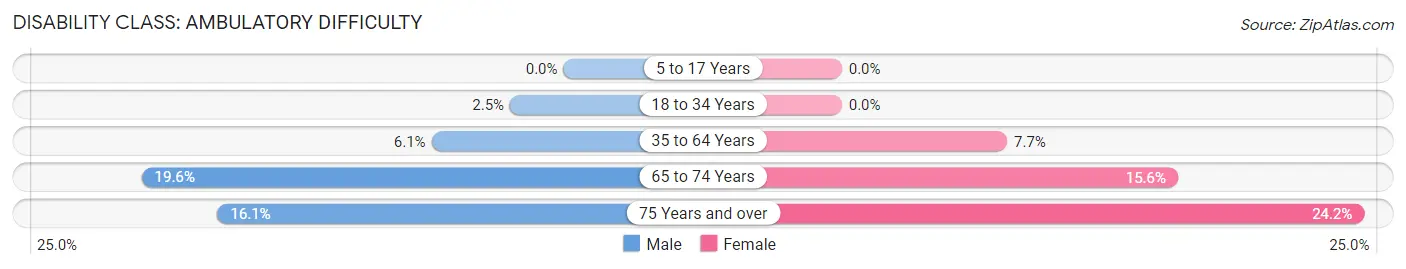
| Age Bracket | Male | Female |
| 5 to 17 Years | 0 (0.0%) | 0 (0.0%) |
| 18 to 34 Years | 8 (2.5%) | 0 (0.0%) |
| 35 to 64 Years | 20 (6.1%) | 32 (7.7%) |
| 65 to 74 Years | 27 (19.6%) | 29 (15.6%) |
| 75 Years and over | 13 (16.1%) | 24 (24.2%) |
Disability Class: Self-Care Difficulty
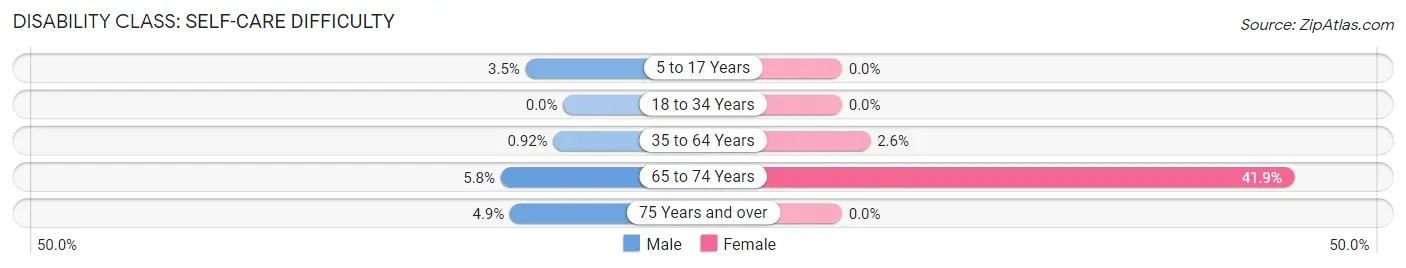
| Age Bracket | Male | Female |
| 5 to 17 Years | 7 (3.5%) | 0 (0.0%) |
| 18 to 34 Years | 0 (0.0%) | 0 (0.0%) |
| 35 to 64 Years | 3 (0.9%) | 11 (2.6%) |
| 65 to 74 Years | 8 (5.8%) | 78 (41.9%) |
| 75 Years and over | 4 (4.9%) | 0 (0.0%) |
Technology Access in Sparta
Computing Device Access in Sparta
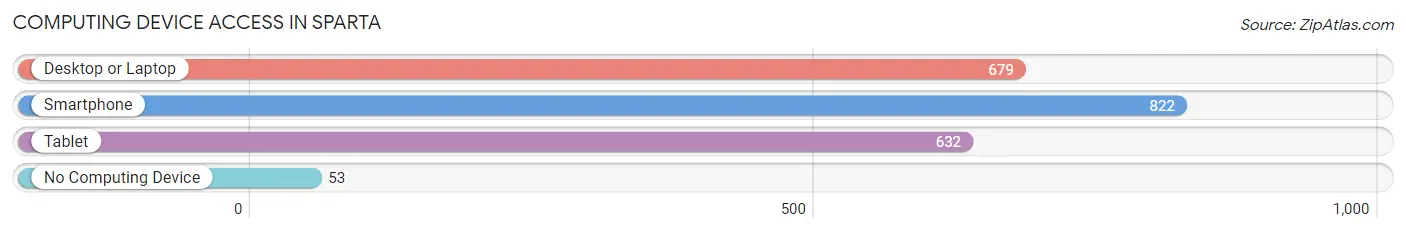
| Device Type | # Households | % Households |
| Desktop or Laptop | 679 | 70.3% |
| Smartphone | 822 | 85.1% |
| Tablet | 632 | 65.4% |
| No Computing Device | 53 | 5.5% |
| Total | 966 | 100.0% |
Internet Access in Sparta
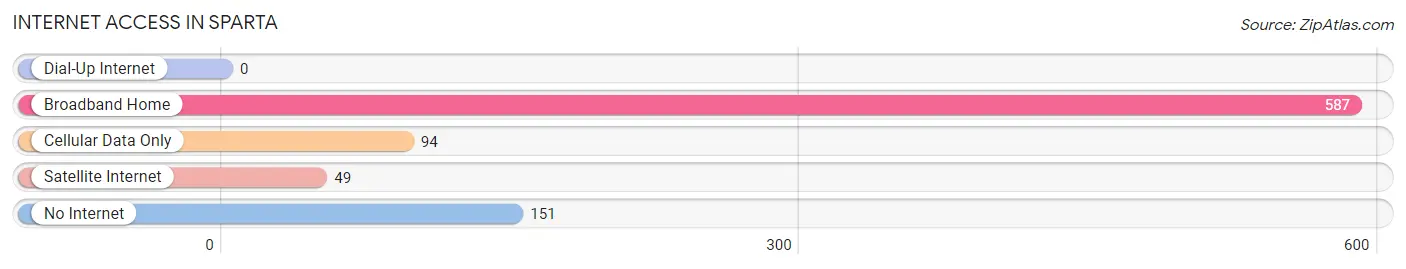
| Internet Type | # Households | % Households |
| Dial-Up Internet | 0 | 0.0% |
| Broadband Home | 587 | 60.8% |
| Cellular Data Only | 94 | 9.7% |
| Satellite Internet | 49 | 5.1% |
| No Internet | 151 | 15.6% |
| Total | 966 | 100.0% |
Sparta Summary
Sparta is a small city located in Christian County, Missouri, United States. It is situated in the Ozark Mountains, approximately 20 miles north of Springfield. The city has a population of approximately 2,500 people and is the county seat of Christian County.
Geography
Sparta is located in the Ozark Mountains of southwestern Missouri. The city is situated in the foothills of the Ozarks, with the James River running through the city. The city is located at an elevation of 890 feet above sea level. The city is surrounded by rolling hills and forests, with the nearest major city being Springfield, located 20 miles to the south.
History
Sparta was founded in 1837 by settlers from Kentucky and Tennessee. The city was named after the ancient Greek city-state of Sparta. The city was incorporated in 1845 and was the county seat of Christian County. During the Civil War, Sparta was a major supply center for the Confederate Army. After the war, the city experienced a period of growth and prosperity.
Economy
Sparta’s economy is largely based on agriculture and tourism. The city is home to several large farms, which produce a variety of crops, including corn, soybeans, wheat, and hay. The city is also home to several small businesses, including restaurants, retail stores, and service providers. Tourism is also an important part of the local economy, with visitors coming to the city to enjoy the natural beauty of the Ozarks.
Demographics
As of the 2010 census, the population of Sparta was 2,500. The racial makeup of the city was 95.2% White, 0.8% African American, 0.4% Native American, 0.4% Asian, 0.1% Pacific Islander, and 2.1% from other races. The median household income was $37,917, and the median family income was $45,938. The per capita income was $19,945.
Conclusion
Sparta is a small city located in the Ozark Mountains of southwestern Missouri. The city has a population of approximately 2,500 people and is the county seat of Christian County. The city’s economy is largely based on agriculture and tourism, with visitors coming to the city to enjoy the natural beauty of the Ozarks. The city has a diverse population, with the majority of residents being White. Sparta is a great place to live, work, and visit, and is a great example of the beauty and culture of the Ozarks.
Common Questions
What is Per Capita Income in Sparta?
Per Capita income in Sparta is $25,934.
What is the Median Family Income in Sparta?
Median Family Income in Sparta is $65,250.
What is the Median Household income in Sparta?
Median Household Income in Sparta is $61,319.
What is Income or Wage Gap in Sparta?
Income or Wage Gap in Sparta is 3.3%.
Women in Sparta earn 96.7 cents for every dollar earned by a man.
What is Inequality or Gini Index in Sparta?
Inequality or Gini Index in Sparta is 0.33.
What is the Total Population of Sparta?
Total Population of Sparta is 2,442.
What is the Total Male Population of Sparta?
Total Male Population of Sparta is 1,145.
What is the Total Female Population of Sparta?
Total Female Population of Sparta is 1,297.
What is the Ratio of Males per 100 Females in Sparta?
There are 88.28 Males per 100 Females in Sparta.
What is the Ratio of Females per 100 Males in Sparta?
There are 113.28 Females per 100 Males in Sparta.
What is the Median Population Age in Sparta?
Median Population Age in Sparta is 38.2 Years.
What is the Average Family Size in Sparta
Average Family Size in Sparta is 2.8 People.
What is the Average Household Size in Sparta
Average Household Size in Sparta is 2.5 People.
How Large is the Labor Force in Sparta?
There are 1,161 People in the Labor Forcein in Sparta.
What is the Percentage of People in the Labor Force in Sparta?
59.9% of People are in the Labor Force in Sparta.
What is the Unemployment Rate in Sparta?
Unemployment Rate in Sparta is 1.4%.