Smithville, MO Map & Demographics
Smithville Map
Smithville Overview
$36,059
PER CAPITA INCOME
$108,383
AVG FAMILY INCOME
$95,122
AVG HOUSEHOLD INCOME
22.2%
WAGE / INCOME GAP [ % ]
77.8¢/ $1
WAGE / INCOME GAP [ $ ]
0.33
INEQUALITY / GINI INDEX
10,416
TOTAL POPULATION
4,942
MALE POPULATION
5,474
FEMALE POPULATION
90.28
MALES / 100 FEMALES
110.76
FEMALES / 100 MALES
36.3
MEDIAN AGE
3.3
AVG FAMILY SIZE
2.8
AVG HOUSEHOLD SIZE
5,250
LABOR FORCE [ PEOPLE ]
66.9%
PERCENT IN LABOR FORCE
0.7%
UNEMPLOYMENT RATE
Smithville Zip Codes
Smithville Area Codes
Income in Smithville
Income Overview in Smithville
Per Capita Income in Smithville is $36,059, while median incomes of families and households are $108,383 and $95,122 respectively.
| Characteristic | Number | Measure |
| Per Capita Income | 10,416 | $36,059 |
| Median Family Income | 2,794 | $108,383 |
| Mean Family Income | 2,794 | $114,410 |
| Median Household Income | 3,638 | $95,122 |
| Mean Household Income | 3,638 | $101,467 |
| Income Deficit | 2,794 | $0 |
| Wage / Income Gap (%) | 10,416 | 22.18% |
| Wage / Income Gap ($) | 10,416 | 77.82¢ per $1 |
| Gini / Inequality Index | 10,416 | 0.33 |
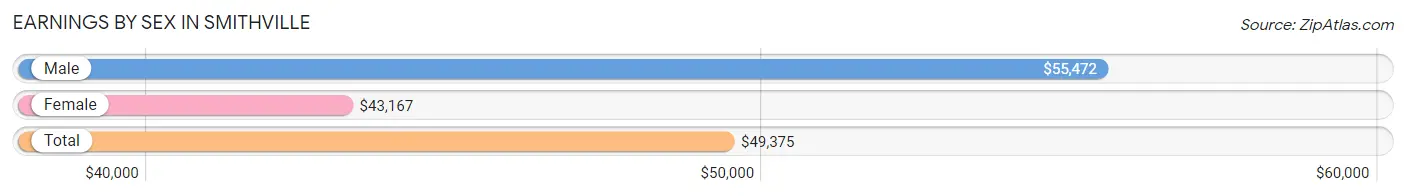
Earnings by Sex in Smithville
Average Earnings in Smithville are $49,375, $55,472 for men and $43,167 for women, a difference of 22.2%.
| Sex | Number | Average Earnings |
| Male | 2,989 (52.6%) | $55,472 |
| Female | 2,691 (47.4%) | $43,167 |
| Total | 5,680 (100.0%) | $49,375 |
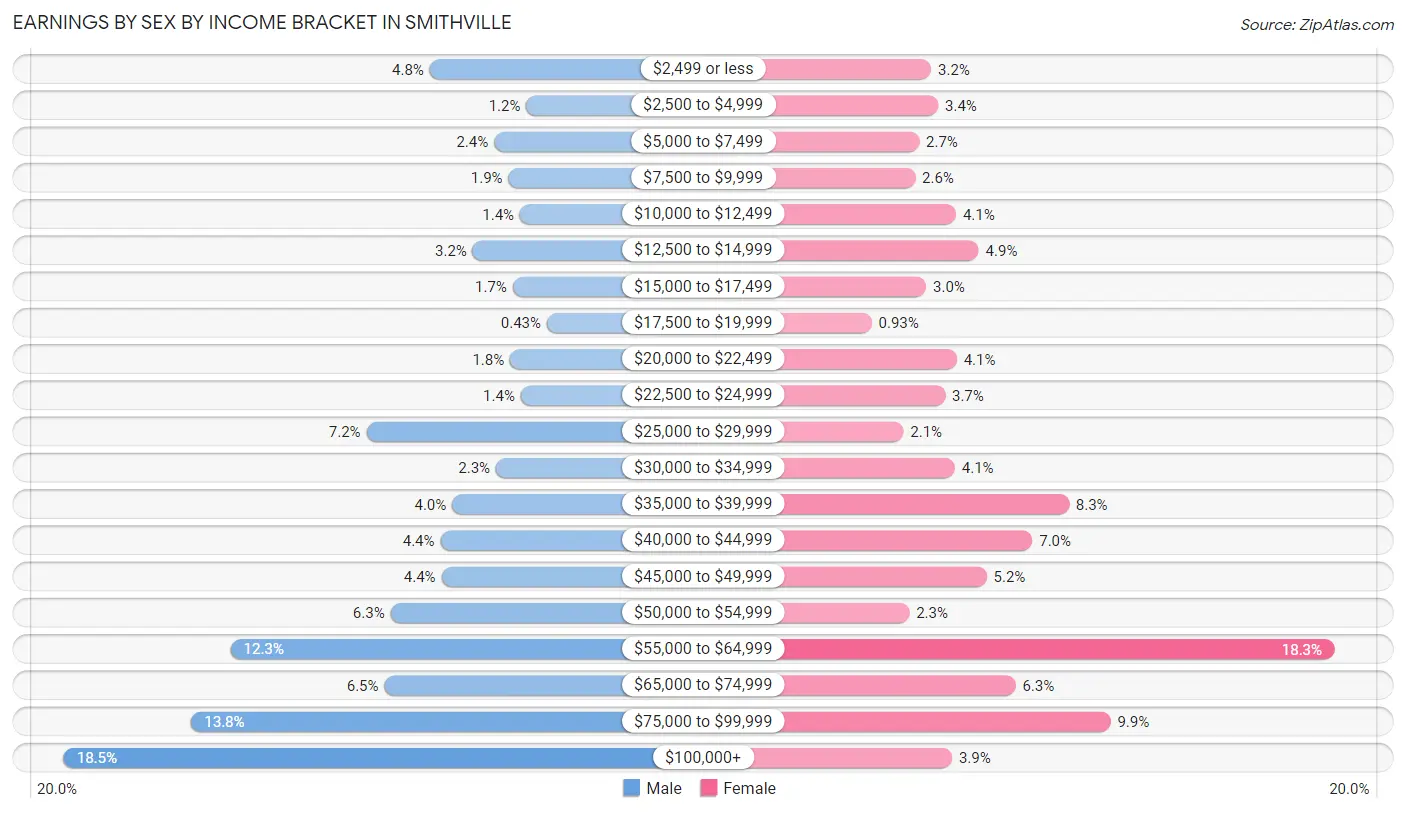
Earnings by Sex by Income Bracket in Smithville
The most common earnings brackets in Smithville are $100,000+ for men (554 | 18.5%) and $55,000 to $64,999 for women (491 | 18.2%).
| Income | Male | Female |
| $2,499 or less | 144 (4.8%) | 85 (3.2%) |
| $2,500 to $4,999 | 36 (1.2%) | 92 (3.4%) |
| $5,000 to $7,499 | 72 (2.4%) | 73 (2.7%) |
| $7,500 to $9,999 | 56 (1.9%) | 69 (2.6%) |
| $10,000 to $12,499 | 43 (1.4%) | 110 (4.1%) |
| $12,500 to $14,999 | 96 (3.2%) | 133 (4.9%) |
| $15,000 to $17,499 | 51 (1.7%) | 80 (3.0%) |
| $17,500 to $19,999 | 13 (0.4%) | 25 (0.9%) |
| $20,000 to $22,499 | 54 (1.8%) | 111 (4.1%) |
| $22,500 to $24,999 | 42 (1.4%) | 99 (3.7%) |
| $25,000 to $29,999 | 215 (7.2%) | 57 (2.1%) |
| $30,000 to $34,999 | 70 (2.3%) | 109 (4.1%) |
| $35,000 to $39,999 | 119 (4.0%) | 224 (8.3%) |
| $40,000 to $44,999 | 132 (4.4%) | 187 (7.0%) |
| $45,000 to $49,999 | 131 (4.4%) | 141 (5.2%) |
| $50,000 to $54,999 | 188 (6.3%) | 63 (2.3%) |
| $55,000 to $64,999 | 367 (12.3%) | 491 (18.2%) |
| $65,000 to $74,999 | 195 (6.5%) | 170 (6.3%) |
| $75,000 to $99,999 | 411 (13.8%) | 266 (9.9%) |
| $100,000+ | 554 (18.5%) | 106 (3.9%) |
| Total | 2,989 (100.0%) | 2,691 (100.0%) |
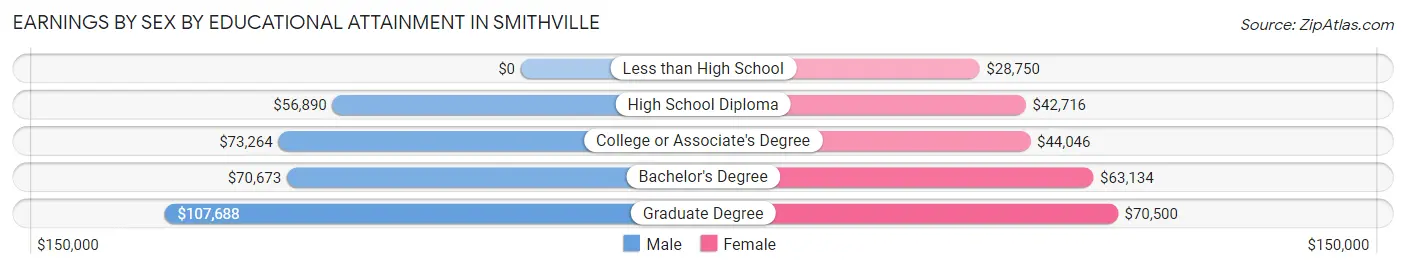
Earnings by Sex by Educational Attainment in Smithville
Average earnings in Smithville are $62,976 for men and $47,950 for women, a difference of 23.9%. Men with an educational attainment of graduate degree enjoy the highest average annual earnings of $107,688, while those with high school diploma education earn the least with $56,890. Women with an educational attainment of graduate degree earn the most with the average annual earnings of $70,500, while those with less than high school education have the smallest earnings of $28,750.
| Educational Attainment | Male Income | Female Income |
| Less than High School | - | - |
| High School Diploma | $56,890 | $42,716 |
| College or Associate's Degree | $73,264 | $44,046 |
| Bachelor's Degree | $70,673 | $63,134 |
| Graduate Degree | $107,688 | $70,500 |
| Total | $62,976 | $47,950 |
Family Income in Smithville
Family Income Brackets in Smithville
According to the Smithville family income data, there are 1,020 families falling into the $100,000 to $149,999 income range, which is the most common income bracket and makes up 36.5% of all families.
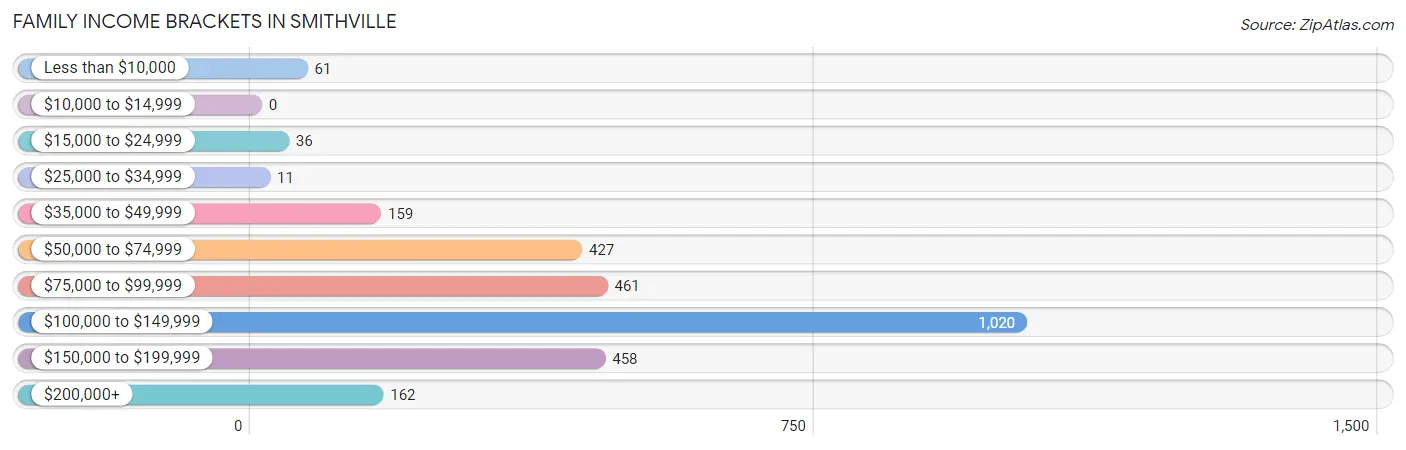
| Income Bracket | # Families | % Families |
| Less than $10,000 | 61 | 2.2% |
| $10,000 to $14,999 | 0 | 0.0% |
| $15,000 to $24,999 | 36 | 1.3% |
| $25,000 to $34,999 | 11 | 0.4% |
| $35,000 to $49,999 | 159 | 5.7% |
| $50,000 to $74,999 | 427 | 15.3% |
| $75,000 to $99,999 | 461 | 16.5% |
| $100,000 to $149,999 | 1,020 | 36.5% |
| $150,000 to $199,999 | 458 | 16.4% |
| $200,000+ | 162 | 5.8% |
Family Income by Famaliy Size in Smithville
5-person families (461 | 16.5%) account for the highest median family income in Smithville with $145,190 per family, while 2-person families (1,150 | 41.2%) have the highest median income of $42,696 per family member.
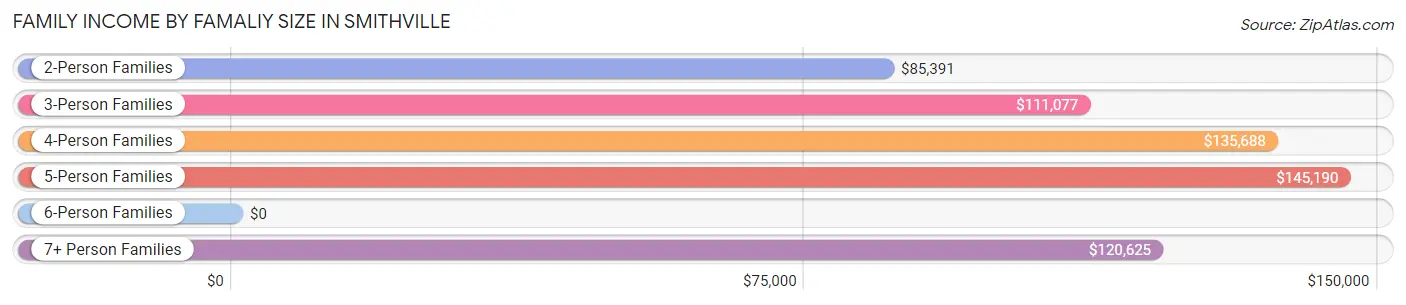
| Income Bracket | # Families | Median Income |
| 2-Person Families | 1,150 (41.2%) | $85,391 |
| 3-Person Families | 546 (19.5%) | $111,077 |
| 4-Person Families | 507 (18.1%) | $135,688 |
| 5-Person Families | 461 (16.5%) | $145,190 |
| 6-Person Families | 28 (1.0%) | $0 |
| 7+ Person Families | 102 (3.6%) | $120,625 |
| Total | 2,794 (100.0%) | $108,383 |
Family Income by Number of Earners in Smithville
The median family income in Smithville is $108,383, with families comprising 3+ earners (476) having the highest median family income of $142,351, while families with no earners (293) have the lowest median family income of $73,438, accounting for 17.0% and 10.5% of families, respectively.
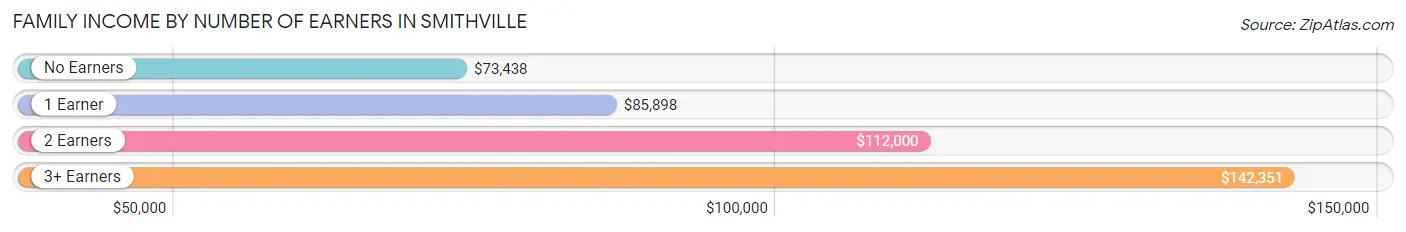
| Number of Earners | # Families | Median Income |
| No Earners | 293 (10.5%) | $73,438 |
| 1 Earner | 753 (27.0%) | $85,898 |
| 2 Earners | 1,272 (45.5%) | $112,000 |
| 3+ Earners | 476 (17.0%) | $142,351 |
| Total | 2,794 (100.0%) | $108,383 |
Household Income in Smithville
Household Income Brackets in Smithville
With 1,073 households falling in the category, the $100,000 to $149,999 income range is the most frequent in Smithville, accounting for 29.5% of all households. In contrast, only 62 households (1.7%) fall into the $10,000 to $14,999 income bracket, making it the least populous group.
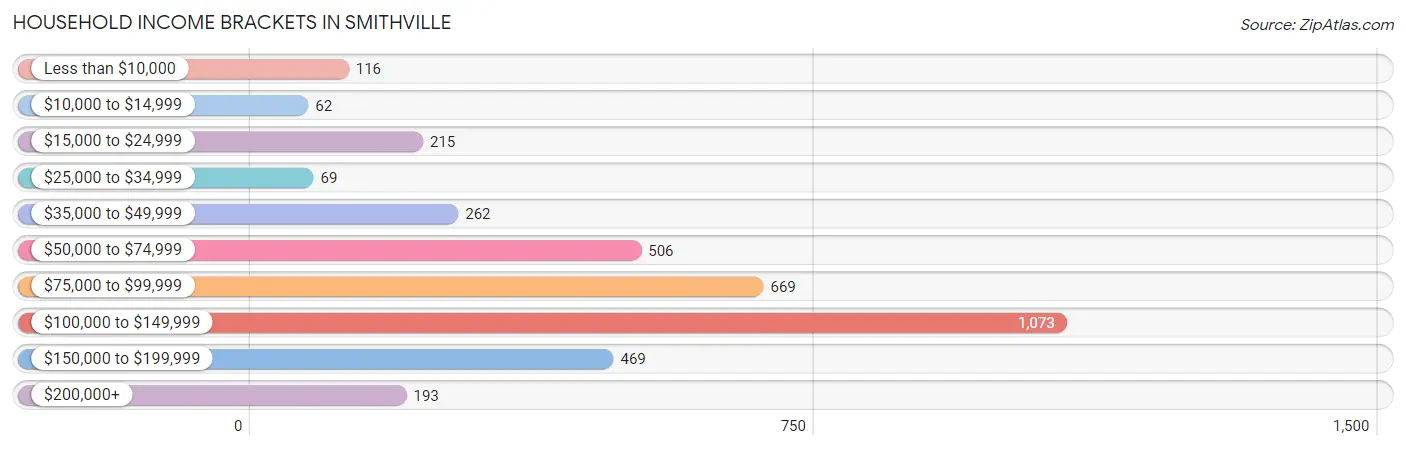
| Income Bracket | # Households | % Households |
| Less than $10,000 | 116 | 3.2% |
| $10,000 to $14,999 | 62 | 1.7% |
| $15,000 to $24,999 | 215 | 5.9% |
| $25,000 to $34,999 | 69 | 1.9% |
| $35,000 to $49,999 | 262 | 7.2% |
| $50,000 to $74,999 | 506 | 13.9% |
| $75,000 to $99,999 | 669 | 18.4% |
| $100,000 to $149,999 | 1,073 | 29.5% |
| $150,000 to $199,999 | 469 | 12.9% |
| $200,000+ | 193 | 5.3% |
Household Income by Householder Age in Smithville
The median household income in Smithville is $95,122, with the highest median household income of $109,302 found in the 25 to 44 years age bracket for the primary householder. A total of 1,296 households (35.6%) fall into this category. Meanwhile, the 15 to 24 years age bracket for the primary householder has the lowest median household income of $0, with 17 households (0.5%) in this group.
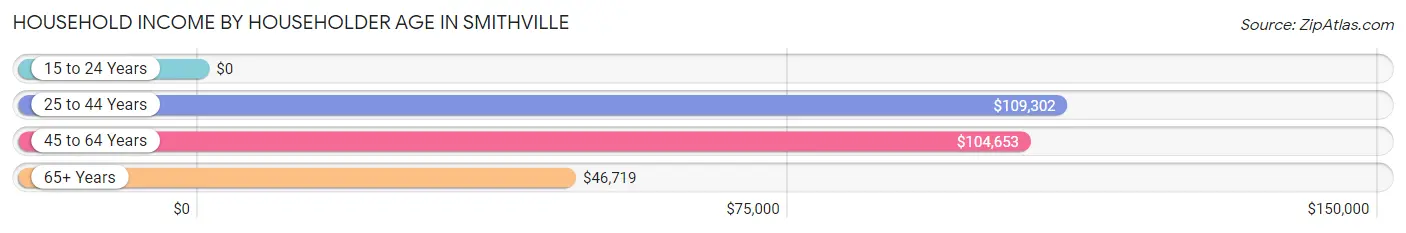
| Income Bracket | # Households | Median Income |
| 15 to 24 Years | 17 (0.5%) | $0 |
| 25 to 44 Years | 1,296 (35.6%) | $109,302 |
| 45 to 64 Years | 1,463 (40.2%) | $104,653 |
| 65+ Years | 862 (23.7%) | $46,719 |
| Total | 3,638 (100.0%) | $95,122 |
Poverty in Smithville
Income Below Poverty by Sex and Age in Smithville
With 5.5% poverty level for males and 8.7% for females among the residents of Smithville, 5 year old males and 15 year old females are the most vulnerable to poverty, with 42 males (33.6%) and 40 females (48.8%) in their respective age groups living below the poverty level.
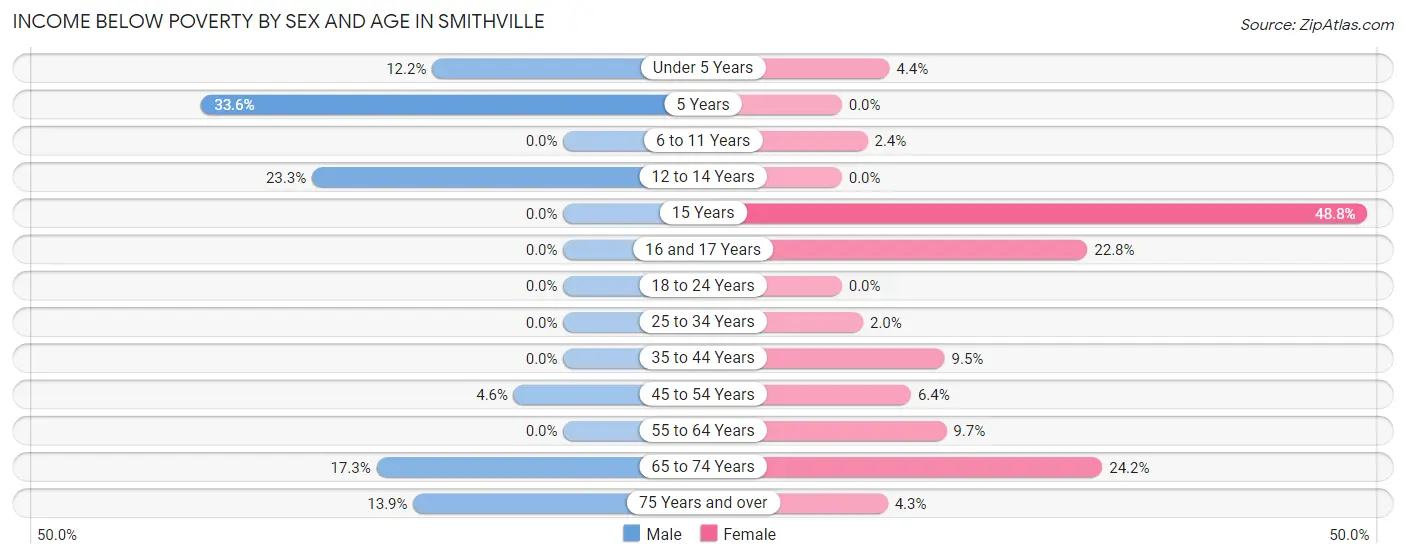
| Age Bracket | Male | Female |
| Under 5 Years | 55 (12.2%) | 26 (4.4%) |
| 5 Years | 42 (33.6%) | 0 (0.0%) |
| 6 to 11 Years | 0 (0.0%) | 10 (2.4%) |
| 12 to 14 Years | 42 (23.3%) | 0 (0.0%) |
| 15 Years | 0 (0.0%) | 40 (48.8%) |
| 16 and 17 Years | 0 (0.0%) | 80 (22.8%) |
| 18 to 24 Years | 0 (0.0%) | 0 (0.0%) |
| 25 to 34 Years | 0 (0.0%) | 12 (2.0%) |
| 35 to 44 Years | 0 (0.0%) | 74 (9.5%) |
| 45 to 54 Years | 26 (4.6%) | 34 (6.4%) |
| 55 to 64 Years | 0 (0.0%) | 71 (9.7%) |
| 65 to 74 Years | 81 (17.3%) | 110 (24.2%) |
| 75 Years and over | 27 (13.9%) | 14 (4.3%) |
| Total | 273 (5.5%) | 471 (8.7%) |
Income Above Poverty by Sex and Age in Smithville
According to the poverty statistics in Smithville, males aged 6 to 11 years and females aged 5 years are the age groups that are most secure financially, with 100.0% of males and 100.0% of females in these age groups living above the poverty line.
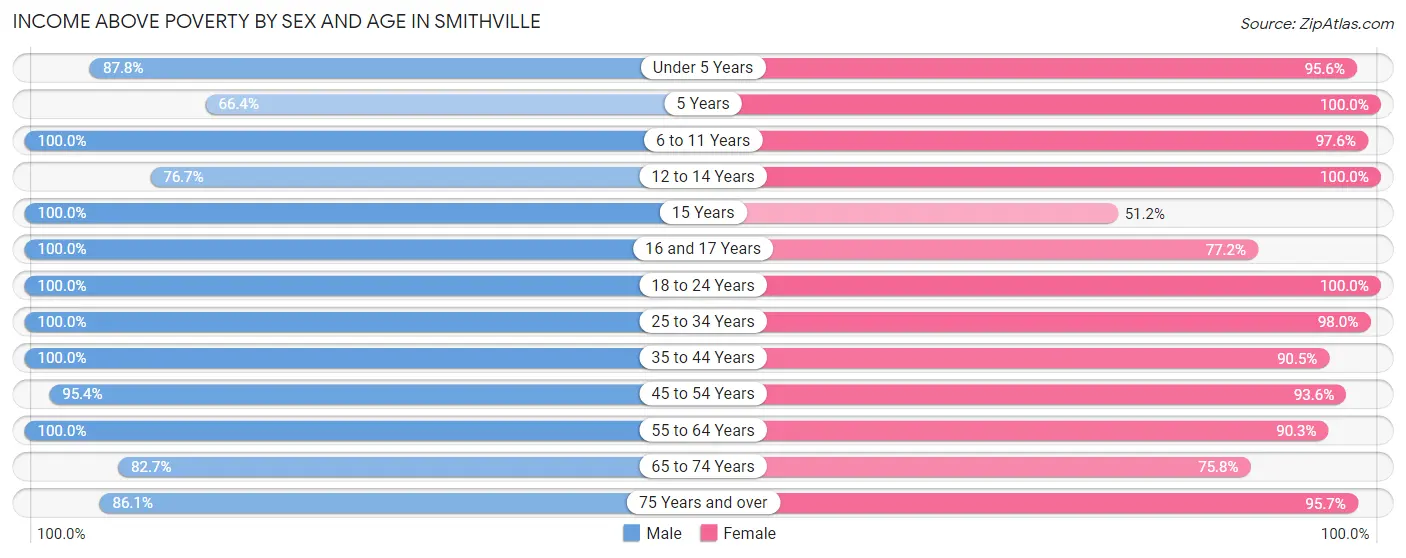
| Age Bracket | Male | Female |
| Under 5 Years | 397 (87.8%) | 561 (95.6%) |
| 5 Years | 83 (66.4%) | 62 (100.0%) |
| 6 to 11 Years | 432 (100.0%) | 408 (97.6%) |
| 12 to 14 Years | 138 (76.7%) | 197 (100.0%) |
| 15 Years | 33 (100.0%) | 42 (51.2%) |
| 16 and 17 Years | 223 (100.0%) | 271 (77.2%) |
| 18 to 24 Years | 542 (100.0%) | 301 (100.0%) |
| 25 to 34 Years | 430 (100.0%) | 597 (98.0%) |
| 35 to 44 Years | 738 (100.0%) | 702 (90.5%) |
| 45 to 54 Years | 540 (95.4%) | 496 (93.6%) |
| 55 to 64 Years | 546 (100.0%) | 660 (90.3%) |
| 65 to 74 Years | 386 (82.7%) | 345 (75.8%) |
| 75 Years and over | 167 (86.1%) | 315 (95.7%) |
| Total | 4,655 (94.5%) | 4,957 (91.3%) |
Income Below Poverty Among Married-Couple Families in Smithville
The poverty statistics for married-couple families in Smithville show that 4.8% or 106 of the total 2,212 families live below the poverty line. Families with 5 or more children have the highest poverty rate of 48.3%, comprising of 44 families. On the other hand, families with 3 or 4 children have the lowest poverty rate of 0.0%, which includes 0 families.
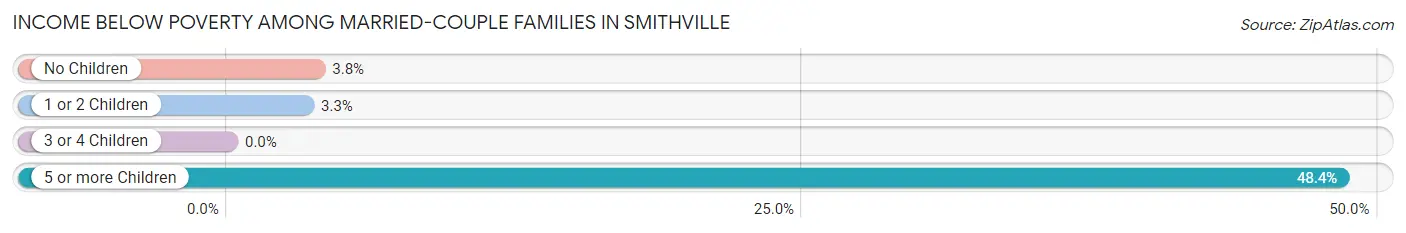
| Children | Above Poverty | Below Poverty |
| No Children | 911 (96.2%) | 36 (3.8%) |
| 1 or 2 Children | 759 (96.7%) | 26 (3.3%) |
| 3 or 4 Children | 389 (100.0%) | 0 (0.0%) |
| 5 or more Children | 47 (51.6%) | 44 (48.3%) |
| Total | 2,106 (95.2%) | 106 (4.8%) |
Income Below Poverty Among Single-Parent Households in Smithville
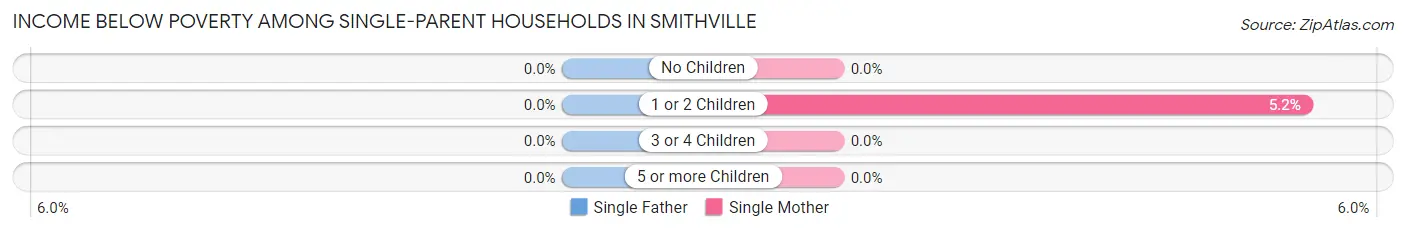
| Children | Single Father | Single Mother |
| No Children | 0 (0.0%) | 0 (0.0%) |
| 1 or 2 Children | 0 (0.0%) | 10 (5.2%) |
| 3 or 4 Children | 0 (0.0%) | 0 (0.0%) |
| 5 or more Children | 0 (0.0%) | 0 (0.0%) |
| Total | 0 (0.0%) | 10 (2.9%) |
Income Below Poverty Among Married-Couple vs Single-Parent Households in Smithville
The poverty data for Smithville shows that 106 of the married-couple family households (4.8%) and 10 of the single-parent households (1.7%) are living below the poverty level. Within the married-couple family households, those with 5 or more children have the highest poverty rate, with 44 households (48.3%) falling below the poverty line. Among the single-parent households, those with 1 or 2 children have the highest poverty rate, with 10 household (2.9%) living below poverty.
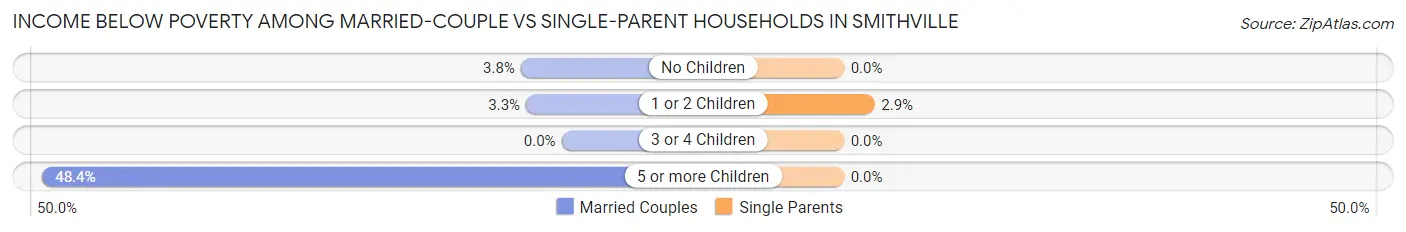
| Children | Married-Couple Families | Single-Parent Households |
| No Children | 36 (3.8%) | 0 (0.0%) |
| 1 or 2 Children | 26 (3.3%) | 10 (2.9%) |
| 3 or 4 Children | 0 (0.0%) | 0 (0.0%) |
| 5 or more Children | 44 (48.3%) | 0 (0.0%) |
| Total | 106 (4.8%) | 10 (1.7%) |
Race in Smithville
The most populous races in Smithville are White / Caucasian (9,645 | 92.6%), Two or more Races (581 | 5.6%), and Hispanic or Latino (117 | 1.1%).
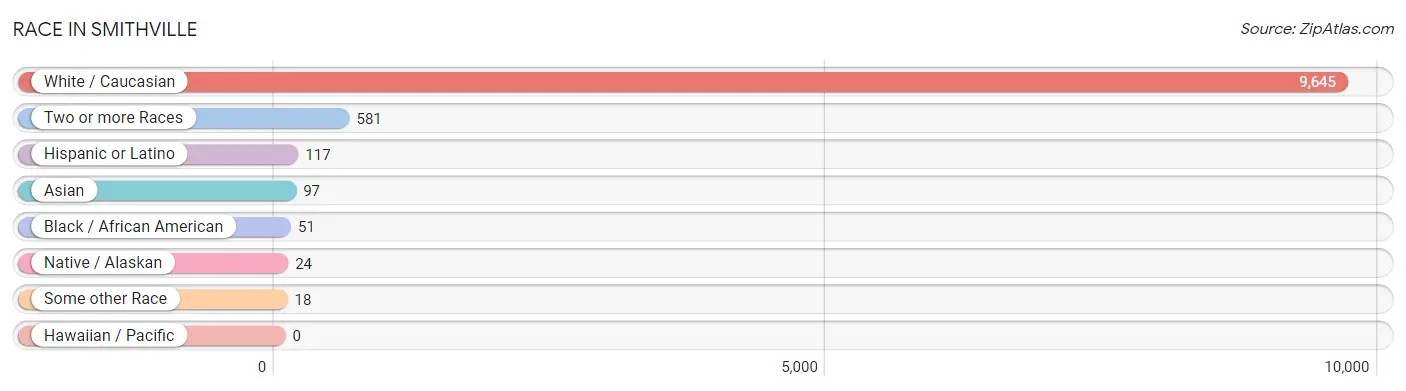
| Race | # Population | % Population |
| Asian | 97 | 0.9% |
| Black / African American | 51 | 0.5% |
| Hawaiian / Pacific | 0 | 0.0% |
| Hispanic or Latino | 117 | 1.1% |
| Native / Alaskan | 24 | 0.2% |
| White / Caucasian | 9,645 | 92.6% |
| Two or more Races | 581 | 5.6% |
| Some other Race | 18 | 0.2% |
| Total | 10,416 | 100.0% |
Ancestry in Smithville
The most populous ancestries reported in Smithville are German (2,258 | 21.7%), English (2,103 | 20.2%), Irish (1,133 | 10.9%), American (891 | 8.6%), and European (822 | 7.9%), together accounting for 69.2% of all Smithville residents.
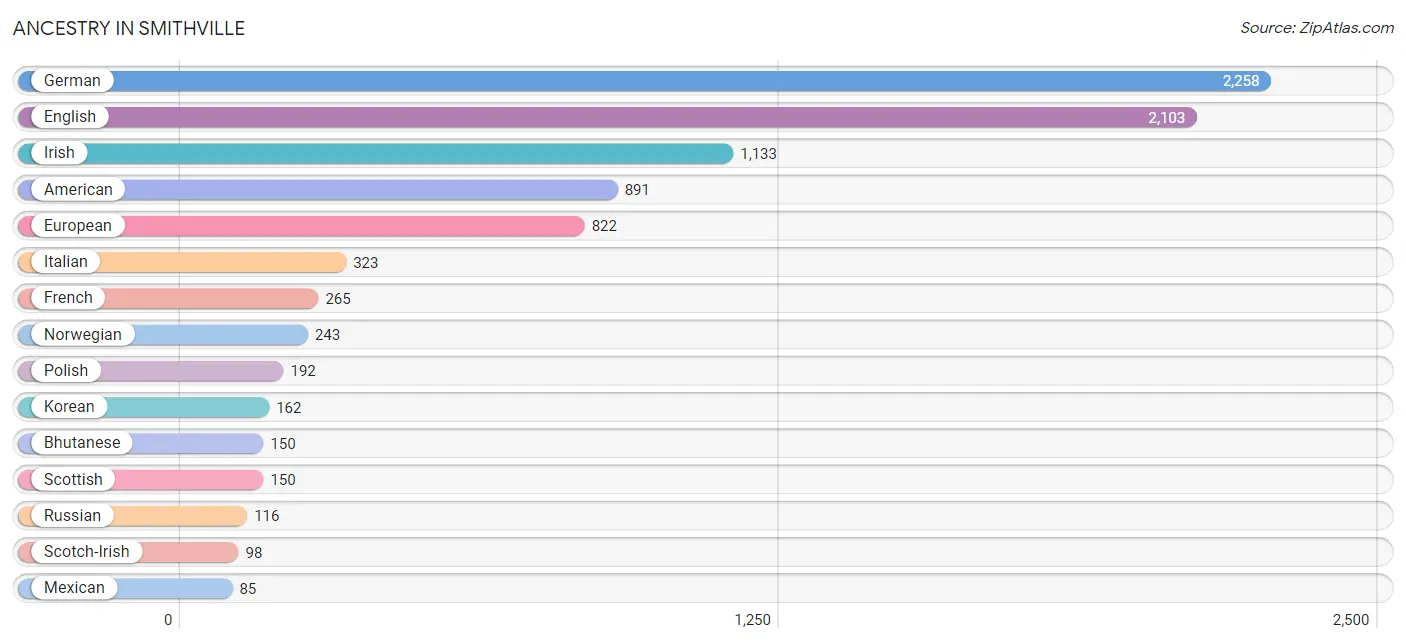
| Ancestry | # Population | % Population |
| American | 891 | 8.6% |
| Belgian | 25 | 0.2% |
| Bhutanese | 150 | 1.4% |
| British | 55 | 0.5% |
| Burmese | 5 | 0.1% |
| Cherokee | 14 | 0.1% |
| Colombian | 32 | 0.3% |
| Croatian | 40 | 0.4% |
| Czechoslovakian | 17 | 0.2% |
| Danish | 62 | 0.6% |
| Dutch | 35 | 0.3% |
| English | 2,103 | 20.2% |
| European | 822 | 7.9% |
| Finnish | 21 | 0.2% |
| French | 265 | 2.5% |
| French Canadian | 10 | 0.1% |
| German | 2,258 | 21.7% |
| Indian (Asian) | 20 | 0.2% |
| Irish | 1,133 | 10.9% |
| Italian | 323 | 3.1% |
| Korean | 162 | 1.6% |
| Mexican | 85 | 0.8% |
| Navajo | 3 | 0.0% |
| Northern European | 25 | 0.2% |
| Norwegian | 243 | 2.3% |
| Pakistani | 16 | 0.2% |
| Pennsylvania German | 8 | 0.1% |
| Polish | 192 | 1.8% |
| Potawatomi | 9 | 0.1% |
| Russian | 116 | 1.1% |
| Scotch-Irish | 98 | 0.9% |
| Scottish | 150 | 1.4% |
| Slavic | 10 | 0.1% |
| South American | 32 | 0.3% |
| Sri Lankan | 3 | 0.0% |
| Swedish | 68 | 0.6% |
| Swiss | 66 | 0.6% |
| Thai | 10 | 0.1% |
| Welsh | 29 | 0.3% | View All 39 Rows |
Immigrants in Smithville
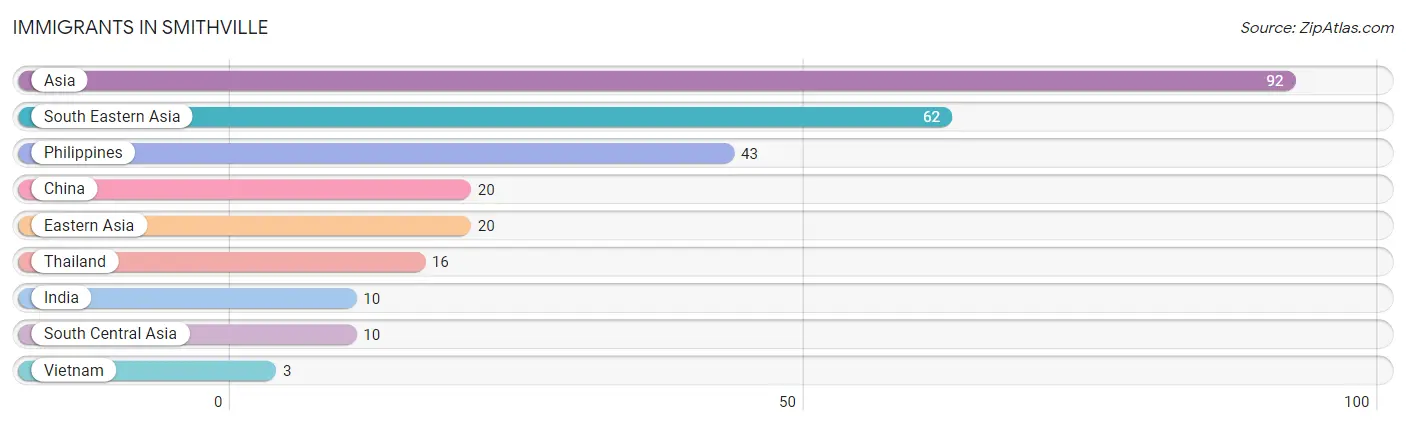
The most numerous immigrant groups reported in Smithville came from Asia (92 | 0.9%), South Eastern Asia (62 | 0.6%), Philippines (43 | 0.4%), China (20 | 0.2%), and Eastern Asia (20 | 0.2%), together accounting for 2.3% of all Smithville residents.
| Immigration Origin | # Population | % Population |
| Asia | 92 | 0.9% |
| China | 20 | 0.2% |
| Eastern Asia | 20 | 0.2% |
| India | 10 | 0.1% |
| Philippines | 43 | 0.4% |
| South Central Asia | 10 | 0.1% |
| South Eastern Asia | 62 | 0.6% |
| Thailand | 16 | 0.2% |
| Vietnam | 3 | 0.0% | View All 9 Rows |
Sex and Age in Smithville
Sex and Age in Smithville
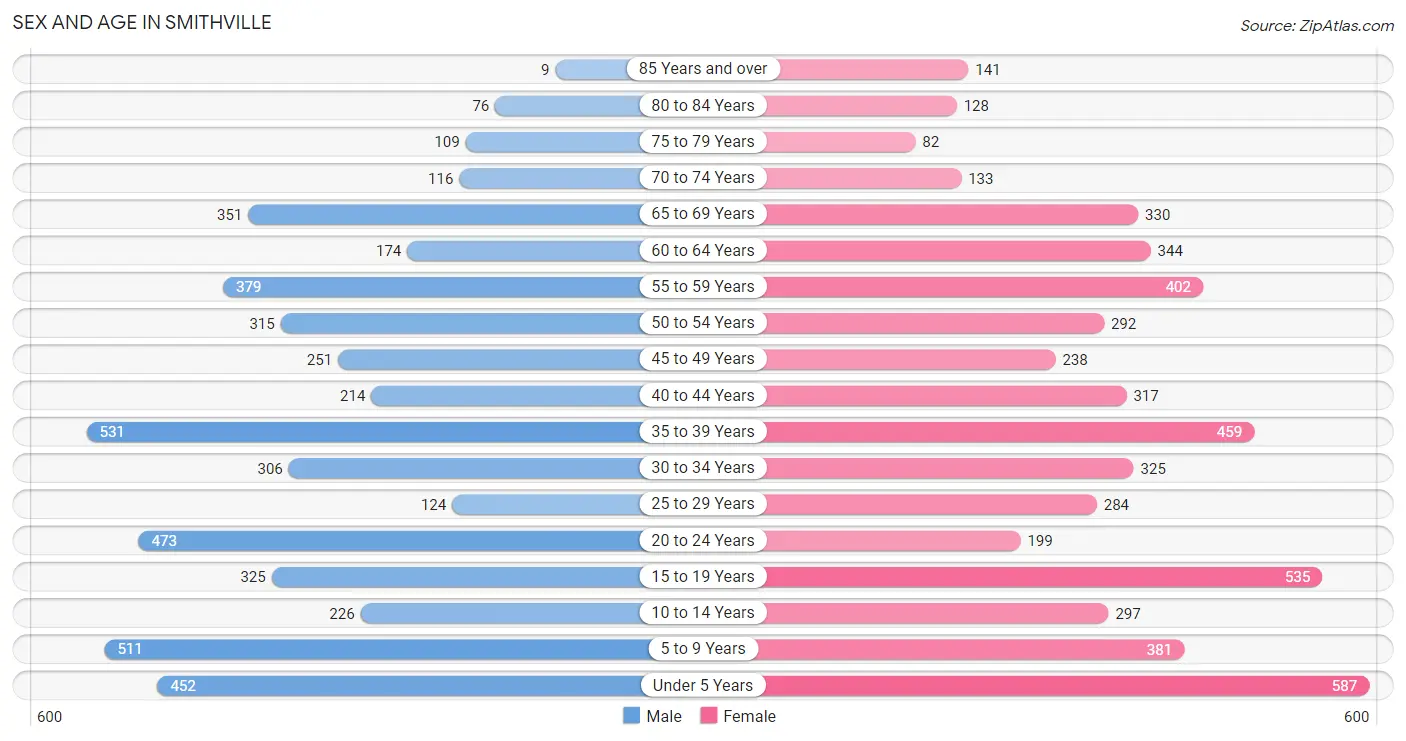
The most populous age groups in Smithville are 35 to 39 Years (531 | 10.7%) for men and Under 5 Years (587 | 10.7%) for women.
| Age Bracket | Male | Female |
| Under 5 Years | 452 (9.1%) | 587 (10.7%) |
| 5 to 9 Years | 511 (10.3%) | 381 (7.0%) |
| 10 to 14 Years | 226 (4.6%) | 297 (5.4%) |
| 15 to 19 Years | 325 (6.6%) | 535 (9.8%) |
| 20 to 24 Years | 473 (9.6%) | 199 (3.6%) |
| 25 to 29 Years | 124 (2.5%) | 284 (5.2%) |
| 30 to 34 Years | 306 (6.2%) | 325 (5.9%) |
| 35 to 39 Years | 531 (10.7%) | 459 (8.4%) |
| 40 to 44 Years | 214 (4.3%) | 317 (5.8%) |
| 45 to 49 Years | 251 (5.1%) | 238 (4.3%) |
| 50 to 54 Years | 315 (6.4%) | 292 (5.3%) |
| 55 to 59 Years | 379 (7.7%) | 402 (7.3%) |
| 60 to 64 Years | 174 (3.5%) | 344 (6.3%) |
| 65 to 69 Years | 351 (7.1%) | 330 (6.0%) |
| 70 to 74 Years | 116 (2.4%) | 133 (2.4%) |
| 75 to 79 Years | 109 (2.2%) | 82 (1.5%) |
| 80 to 84 Years | 76 (1.5%) | 128 (2.3%) |
| 85 Years and over | 9 (0.2%) | 141 (2.6%) |
| Total | 4,942 (100.0%) | 5,474 (100.0%) |
Families and Households in Smithville
Median Family Size in Smithville
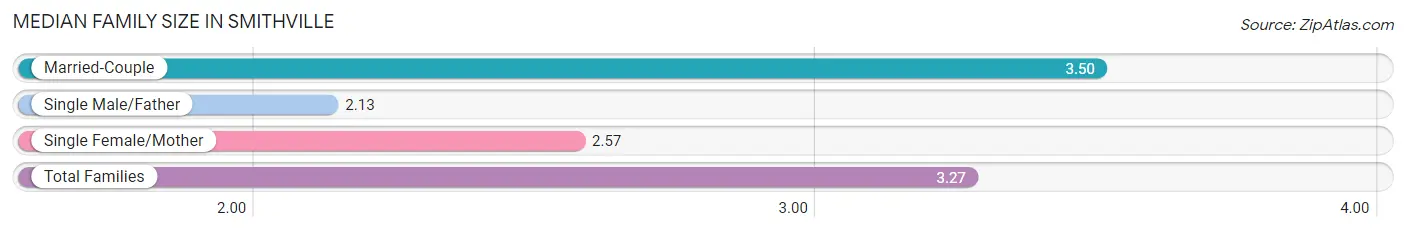
The median family size in Smithville is 3.27 persons per family, with married-couple families (2,212 | 79.2%) accounting for the largest median family size of 3.5 persons per family. On the other hand, single male/father families (239 | 8.6%) represent the smallest median family size with 2.13 persons per family.
| Family Type | # Families | Family Size |
| Married-Couple | 2,212 (79.2%) | 3.50 |
| Single Male/Father | 239 (8.6%) | 2.13 |
| Single Female/Mother | 343 (12.3%) | 2.57 |
| Total Families | 2,794 (100.0%) | 3.27 |
Median Household Size in Smithville
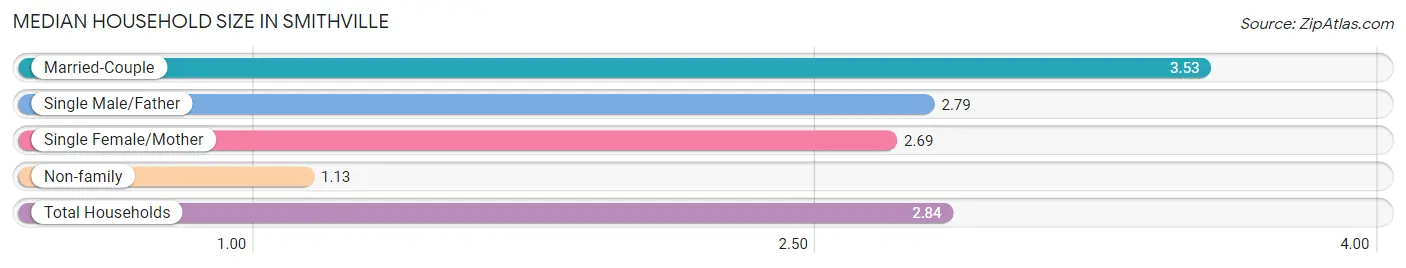
The median household size in Smithville is 2.84 persons per household, with married-couple households (2,212 | 60.8%) accounting for the largest median household size of 3.53 persons per household. non-family households (844 | 23.2%) represent the smallest median household size with 1.13 persons per household.
| Household Type | # Households | Household Size |
| Married-Couple | 2,212 (60.8%) | 3.53 |
| Single Male/Father | 239 (6.6%) | 2.79 |
| Single Female/Mother | 343 (9.4%) | 2.69 |
| Non-family | 844 (23.2%) | 1.13 |
| Total Households | 3,638 (100.0%) | 2.84 |
Household Size by Marriage Status in Smithville
Out of a total of 3,638 households in Smithville, 2,794 (76.8%) are family households, while 844 (23.2%) are nonfamily households. The most numerous type of family households are 2-person households, comprising 1,017, and the most common type of nonfamily households are 1-person households, comprising 744.
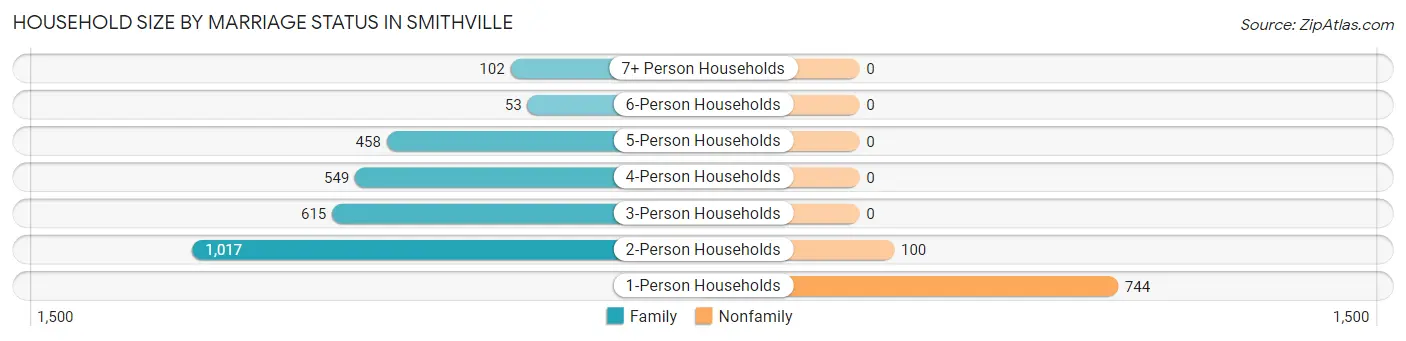
| Household Size | Family Households | Nonfamily Households |
| 1-Person Households | - | 744 (20.4%) |
| 2-Person Households | 1,017 (28.0%) | 100 (2.8%) |
| 3-Person Households | 615 (16.9%) | 0 (0.0%) |
| 4-Person Households | 549 (15.1%) | 0 (0.0%) |
| 5-Person Households | 458 (12.6%) | 0 (0.0%) |
| 6-Person Households | 53 (1.5%) | 0 (0.0%) |
| 7+ Person Households | 102 (2.8%) | 0 (0.0%) |
| Total | 2,794 (76.8%) | 844 (23.2%) |
Female Fertility in Smithville
Fertility by Age in Smithville
Average fertility rate in Smithville is 63.0 births per 1,000 women. Women in the age bracket of 20 to 34 years have the highest fertility rate with 153.0 births per 1,000 women. Women in the age bracket of 20 to 34 years acount for 80.5% of all women with births.
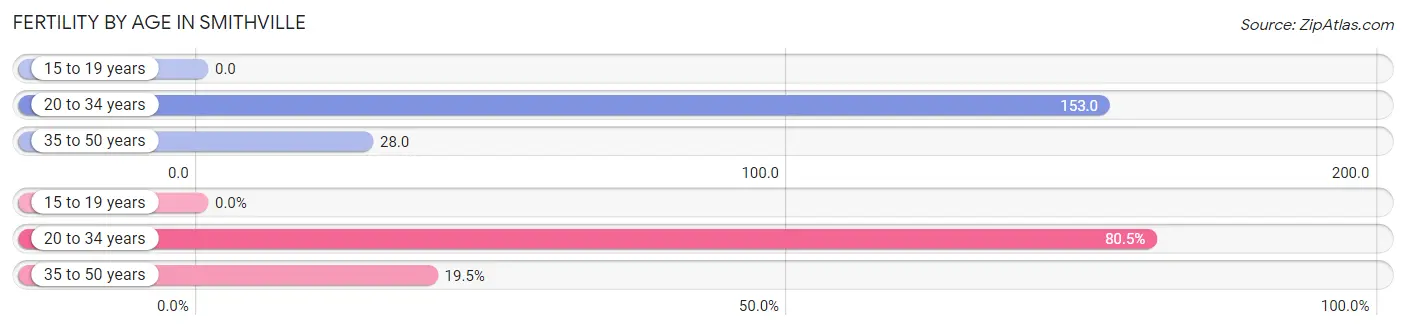
| Age Bracket | Women with Births | Births / 1,000 Women |
| 15 to 19 years | 0 (0.0%) | 0.0 |
| 20 to 34 years | 124 (80.5%) | 153.0 |
| 35 to 50 years | 30 (19.5%) | 28.0 |
| Total | 154 (100.0%) | 63.0 |
Fertility by Age by Marriage Status in Smithville
98.7% of women with births (154) in Smithville are married. The highest percentage of unmarried women with births falls into 20 to 34 years age bracket with 1.6% of them unmarried at the time of birth, while the lowest percentage of unmarried women with births belong to 35 to 50 years age bracket with 0.0% of them unmarried.
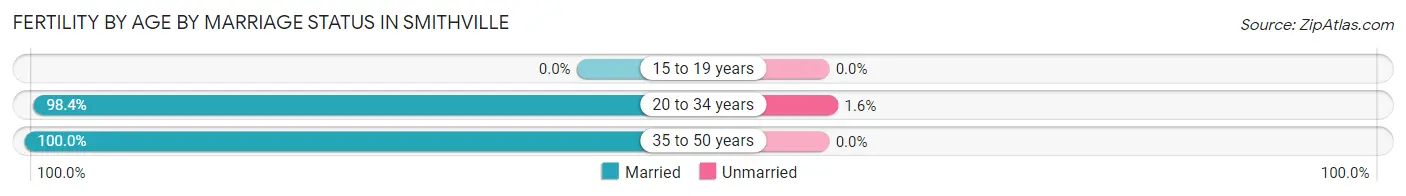
| Age Bracket | Married | Unmarried |
| 15 to 19 years | 0 (0.0%) | 0 (0.0%) |
| 20 to 34 years | 122 (98.4%) | 2 (1.6%) |
| 35 to 50 years | 30 (100.0%) | 0 (0.0%) |
| Total | 152 (98.7%) | 2 (1.3%) |
Fertility by Education in Smithville
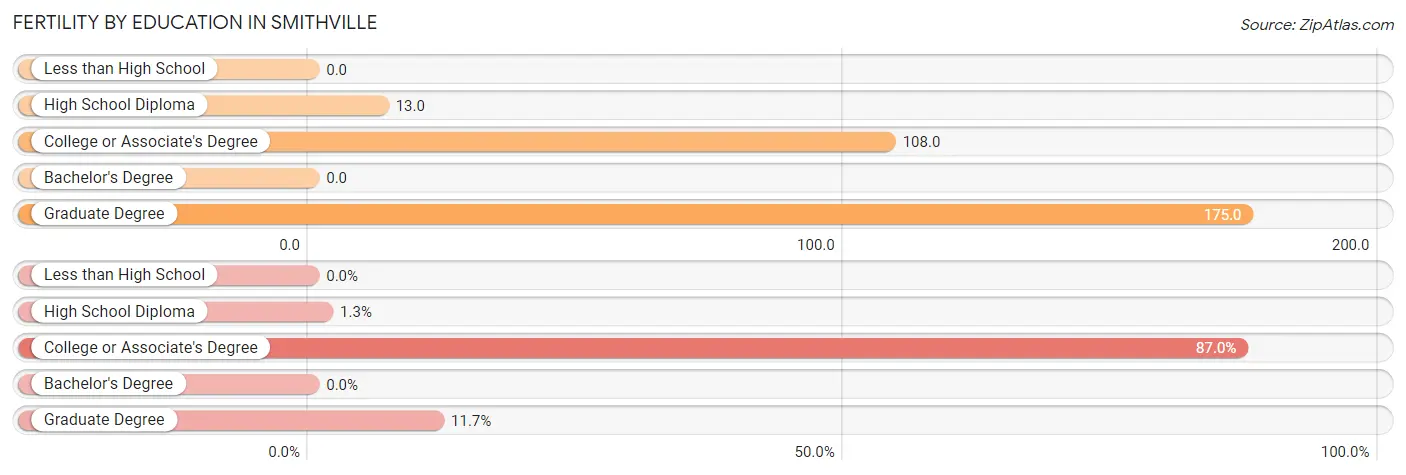
| Educational Attainment | Women with Births | Births / 1,000 Women |
| Less than High School | 0 (0.0%) | 0.0 |
| High School Diploma | 2 (1.3%) | 13.0 |
| College or Associate's Degree | 134 (87.0%) | 108.0 |
| Bachelor's Degree | 0 (0.0%) | 0.0 |
| Graduate Degree | 18 (11.7%) | 175.0 |
| Total | 154 (100.0%) | 63.0 |
Fertility by Education by Marriage Status in Smithville
1.3% of women with births in Smithville are unmarried. Women with the educational attainment of college or associate's degree are most likely to be married with 100.0% of them married at childbirth, while women with the educational attainment of high school diploma are least likely to be married with 100.0% of them unmarried at childbirth.
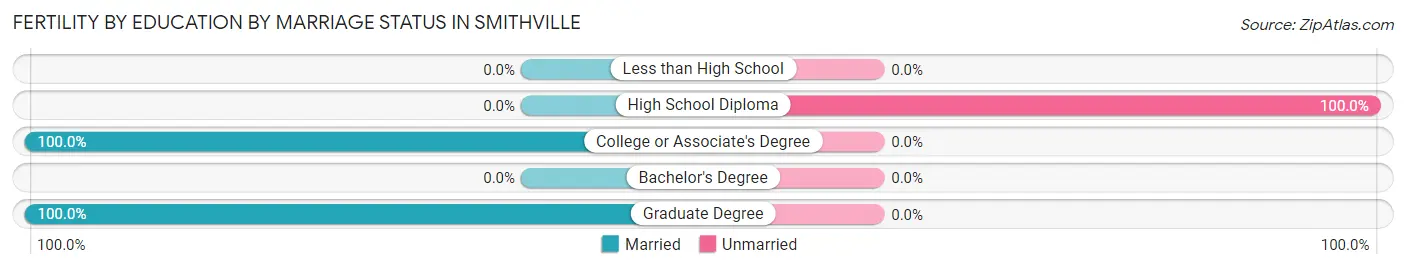
| Educational Attainment | Married | Unmarried |
| Less than High School | 0 (0.0%) | 0 (0.0%) |
| High School Diploma | 0 (0.0%) | 2 (100.0%) |
| College or Associate's Degree | 134 (100.0%) | 0 (0.0%) |
| Bachelor's Degree | 0 (0.0%) | 0 (0.0%) |
| Graduate Degree | 18 (100.0%) | 0 (0.0%) |
| Total | 152 (98.7%) | 2 (1.3%) |
Employment Characteristics in Smithville
Employment by Class of Employer in Smithville
Among the 5,189 employed individuals in Smithville, private company employees (4,024 | 77.5%), not-for-profit organizations (438 | 8.4%), and self-employed (not incorporated) (173 | 3.3%) make up the most common classes of employment.
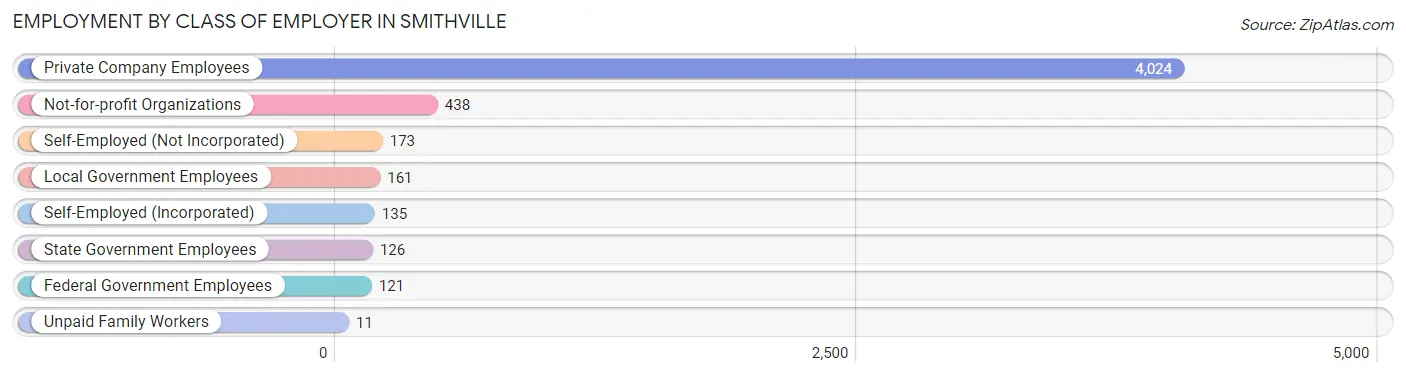
| Employer Class | # Employees | % Employees |
| Private Company Employees | 4,024 | 77.5% |
| Self-Employed (Incorporated) | 135 | 2.6% |
| Self-Employed (Not Incorporated) | 173 | 3.3% |
| Not-for-profit Organizations | 438 | 8.4% |
| Local Government Employees | 161 | 3.1% |
| State Government Employees | 126 | 2.4% |
| Federal Government Employees | 121 | 2.3% |
| Unpaid Family Workers | 11 | 0.2% |
| Total | 5,189 | 100.0% |
Employment Status by Age in Smithville
According to the labor force statistics for Smithville, out of the total population over 16 years of age (7,847), 66.9% or 5,250 individuals are in the labor force, with 0.7% or 37 of them unemployed. The age group with the highest labor force participation rate is 20 to 24 years, with 100.0% or 672 individuals in the labor force. Within the labor force, the 16 to 19 years age range has the highest percentage of unemployed individuals, with 5.8% or 17 of them being unemployed.
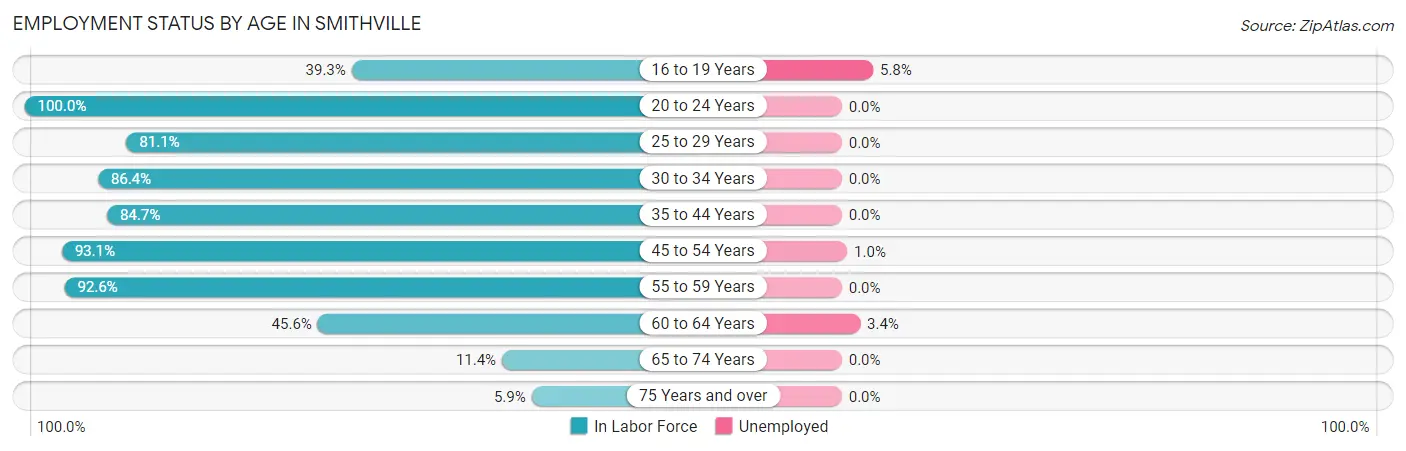
| Age Bracket | In Labor Force | Unemployed |
| 16 to 19 Years | 293 (39.3%) | 17 (5.8%) |
| 20 to 24 Years | 672 (100.0%) | 0 (0.0%) |
| 25 to 29 Years | 331 (81.1%) | 0 (0.0%) |
| 30 to 34 Years | 545 (86.4%) | 0 (0.0%) |
| 35 to 44 Years | 1,288 (84.7%) | 0 (0.0%) |
| 45 to 54 Years | 1,020 (93.1%) | 10 (1.0%) |
| 55 to 59 Years | 723 (92.6%) | 0 (0.0%) |
| 60 to 64 Years | 236 (45.6%) | 8 (3.4%) |
| 65 to 74 Years | 106 (11.4%) | 0 (0.0%) |
| 75 Years and over | 32 (5.9%) | 0 (0.0%) |
| Total | 5,250 (66.9%) | 37 (0.7%) |
Employment Status by Educational Attainment in Smithville
According to labor force statistics for Smithville, 83.6% of individuals (4,142) out of the total population between 25 and 64 years of age (4,955) are in the labor force, with 0.4% or 17 of them being unemployed. The group with the highest labor force participation rate are those with the educational attainment of bachelor's degree or higher, with 87.0% or 1,256 individuals in the labor force. Within the labor force, individuals with high school diploma education have the highest percentage of unemployment, with 1.5% or 17 of them being unemployed.
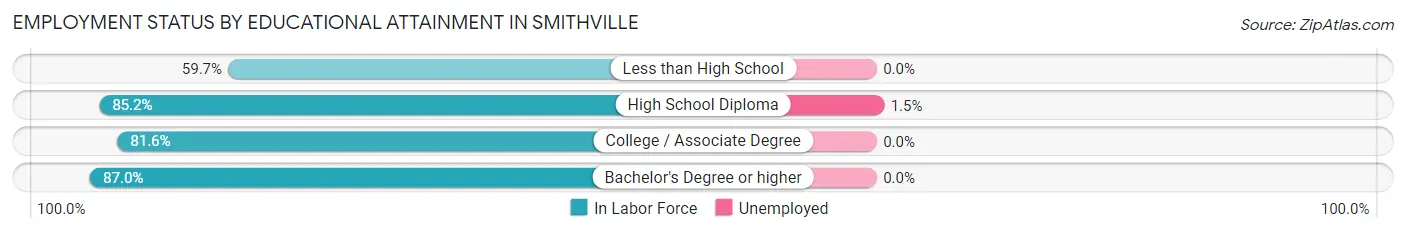
| Educational Attainment | In Labor Force | Unemployed |
| Less than High School | 71 (59.7%) | 0 (0.0%) |
| High School Diploma | 1,166 (85.2%) | 21 (1.5%) |
| College / Associate Degree | 1,651 (81.6%) | 0 (0.0%) |
| Bachelor's Degree or higher | 1,256 (87.0%) | 0 (0.0%) |
| Total | 4,142 (83.6%) | 20 (0.4%) |
Employment Occupations by Sex in Smithville
Management, Business, Science and Arts Occupations
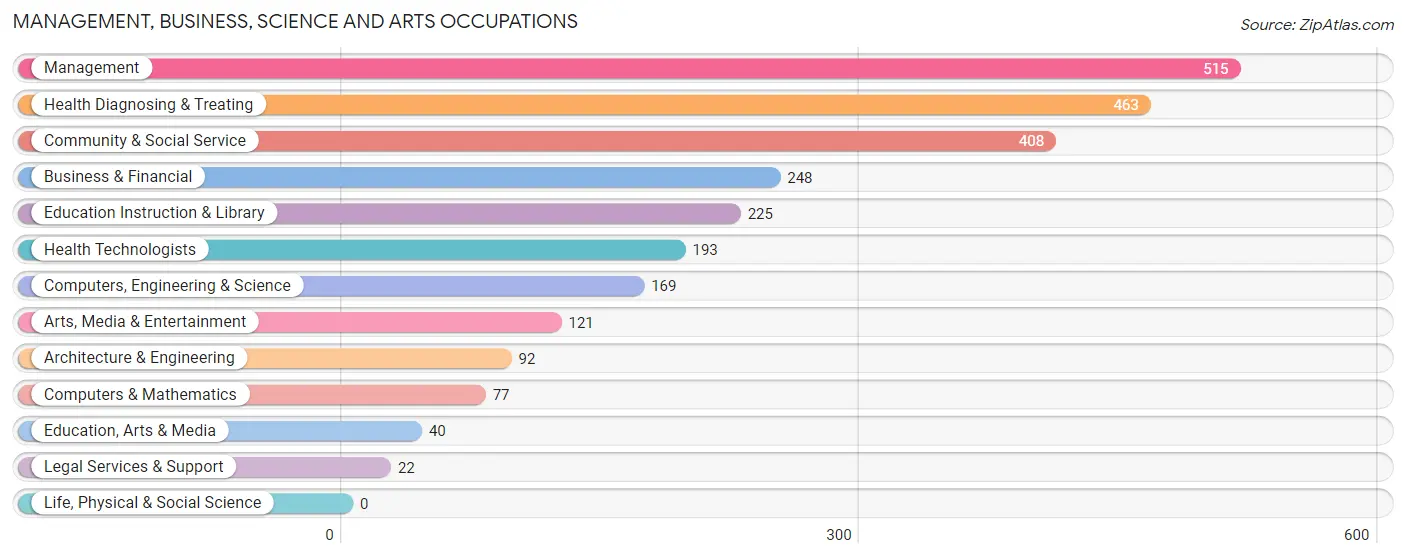
The most common Management, Business, Science and Arts occupations in Smithville are Management (515 | 10.0%), Health Diagnosing & Treating (463 | 9.0%), Community & Social Service (408 | 7.9%), Business & Financial (248 | 4.8%), and Education Instruction & Library (225 | 4.3%).
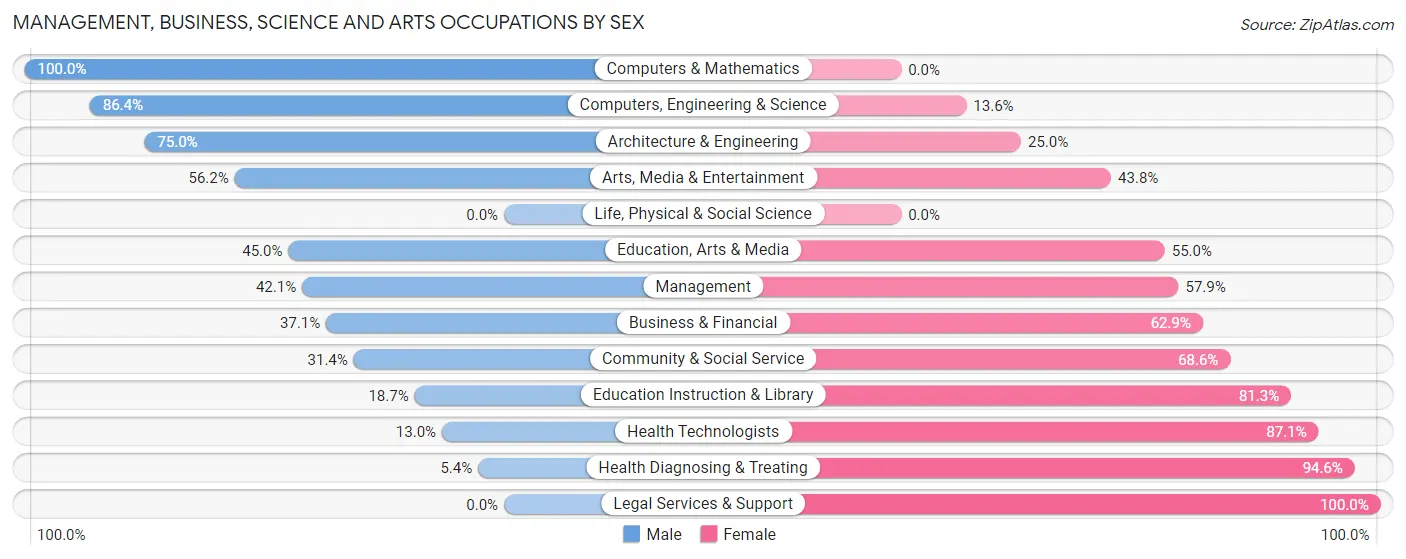
Management, Business, Science and Arts Occupations by Sex
Within the Management, Business, Science and Arts occupations in Smithville, the most male-oriented occupations are Computers & Mathematics (100.0%), Computers, Engineering & Science (86.4%), and Architecture & Engineering (75.0%), while the most female-oriented occupations are Legal Services & Support (100.0%), Health Diagnosing & Treating (94.6%), and Health Technologists (87.1%).
| Occupation | Male | Female |
| Management | 217 (42.1%) | 298 (57.9%) |
| Business & Financial | 92 (37.1%) | 156 (62.9%) |
| Computers, Engineering & Science | 146 (86.4%) | 23 (13.6%) |
| Computers & Mathematics | 77 (100.0%) | 0 (0.0%) |
| Architecture & Engineering | 69 (75.0%) | 23 (25.0%) |
| Life, Physical & Social Science | 0 (0.0%) | 0 (0.0%) |
| Community & Social Service | 128 (31.4%) | 280 (68.6%) |
| Education, Arts & Media | 18 (45.0%) | 22 (55.0%) |
| Legal Services & Support | 0 (0.0%) | 22 (100.0%) |
| Education Instruction & Library | 42 (18.7%) | 183 (81.3%) |
| Arts, Media & Entertainment | 68 (56.2%) | 53 (43.8%) |
| Health Diagnosing & Treating | 25 (5.4%) | 438 (94.6%) |
| Health Technologists | 25 (13.0%) | 168 (87.1%) |
| Total (Category) | 608 (33.7%) | 1,195 (66.3%) |
| Total (Overall) | 2,743 (53.1%) | 2,427 (46.9%) |
Services Occupations
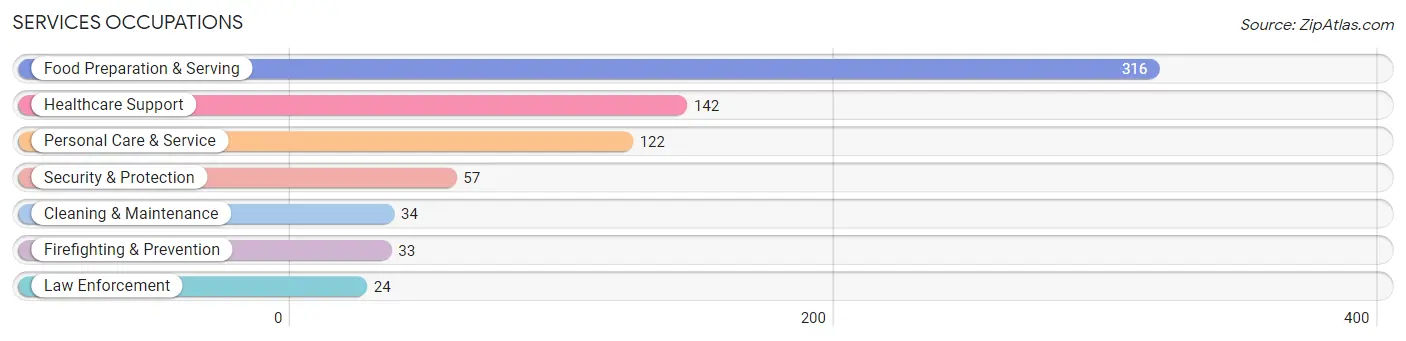
The most common Services occupations in Smithville are Food Preparation & Serving (316 | 6.1%), Healthcare Support (142 | 2.8%), Personal Care & Service (122 | 2.4%), Security & Protection (57 | 1.1%), and Cleaning & Maintenance (34 | 0.7%).
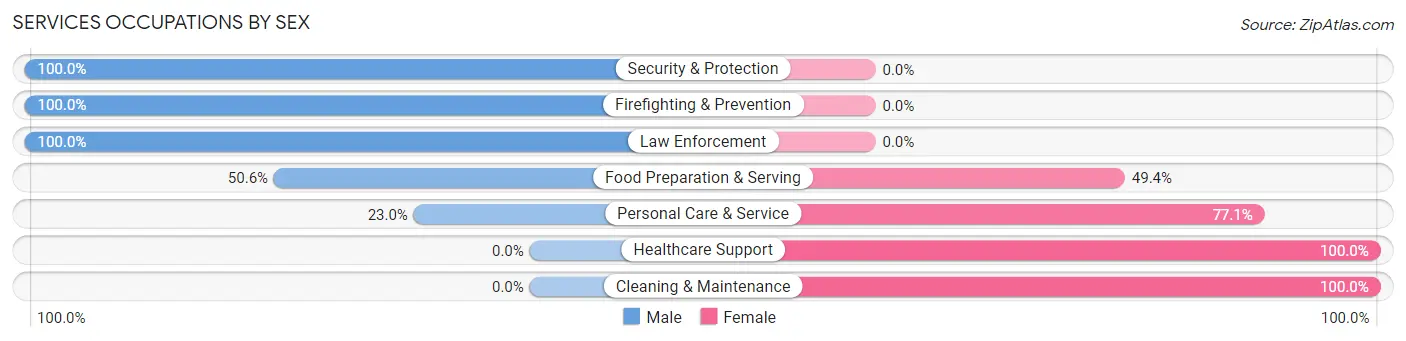
Services Occupations by Sex
Within the Services occupations in Smithville, the most male-oriented occupations are Security & Protection (100.0%), Firefighting & Prevention (100.0%), and Law Enforcement (100.0%), while the most female-oriented occupations are Healthcare Support (100.0%), Cleaning & Maintenance (100.0%), and Personal Care & Service (77.0%).
| Occupation | Male | Female |
| Healthcare Support | 0 (0.0%) | 142 (100.0%) |
| Security & Protection | 57 (100.0%) | 0 (0.0%) |
| Firefighting & Prevention | 33 (100.0%) | 0 (0.0%) |
| Law Enforcement | 24 (100.0%) | 0 (0.0%) |
| Food Preparation & Serving | 160 (50.6%) | 156 (49.4%) |
| Cleaning & Maintenance | 0 (0.0%) | 34 (100.0%) |
| Personal Care & Service | 28 (23.0%) | 94 (77.0%) |
| Total (Category) | 245 (36.5%) | 426 (63.5%) |
| Total (Overall) | 2,743 (53.1%) | 2,427 (46.9%) |
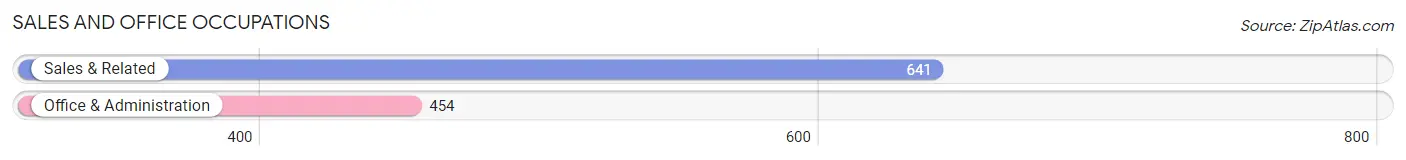
Sales and Office Occupations
The most common Sales and Office occupations in Smithville are Sales & Related (641 | 12.4%), and Office & Administration (454 | 8.8%).
Sales and Office Occupations by Sex
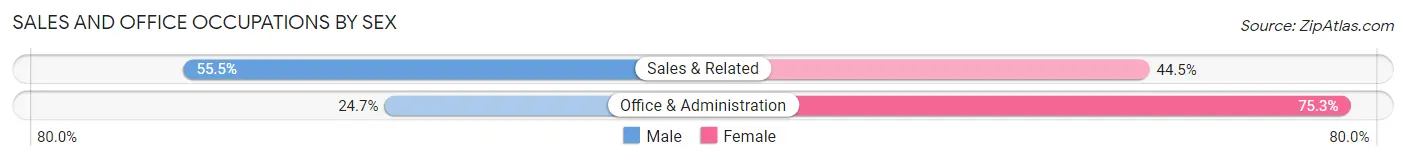
| Occupation | Male | Female |
| Sales & Related | 356 (55.5%) | 285 (44.5%) |
| Office & Administration | 112 (24.7%) | 342 (75.3%) |
| Total (Category) | 468 (42.7%) | 627 (57.3%) |
| Total (Overall) | 2,743 (53.1%) | 2,427 (46.9%) |
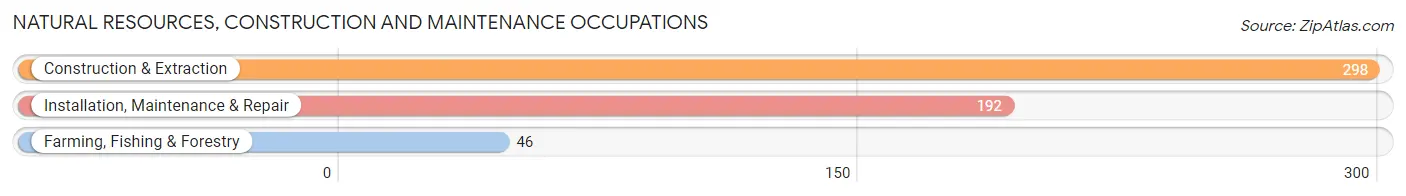
Natural Resources, Construction and Maintenance Occupations
The most common Natural Resources, Construction and Maintenance occupations in Smithville are Construction & Extraction (298 | 5.8%), Installation, Maintenance & Repair (192 | 3.7%), and Farming, Fishing & Forestry (46 | 0.9%).
Natural Resources, Construction and Maintenance Occupations by Sex
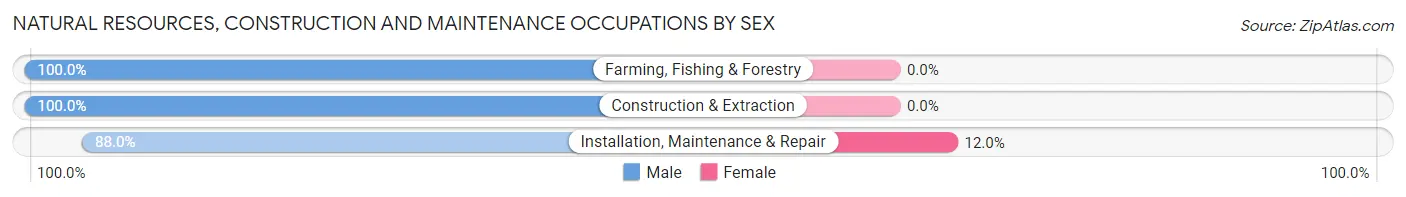
| Occupation | Male | Female |
| Farming, Fishing & Forestry | 46 (100.0%) | 0 (0.0%) |
| Construction & Extraction | 298 (100.0%) | 0 (0.0%) |
| Installation, Maintenance & Repair | 169 (88.0%) | 23 (12.0%) |
| Total (Category) | 513 (95.7%) | 23 (4.3%) |
| Total (Overall) | 2,743 (53.1%) | 2,427 (46.9%) |
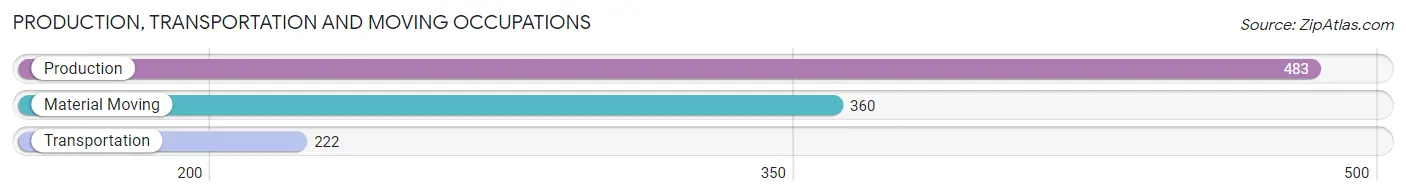
Production, Transportation and Moving Occupations
The most common Production, Transportation and Moving occupations in Smithville are Production (483 | 9.3%), Material Moving (360 | 7.0%), and Transportation (222 | 4.3%).
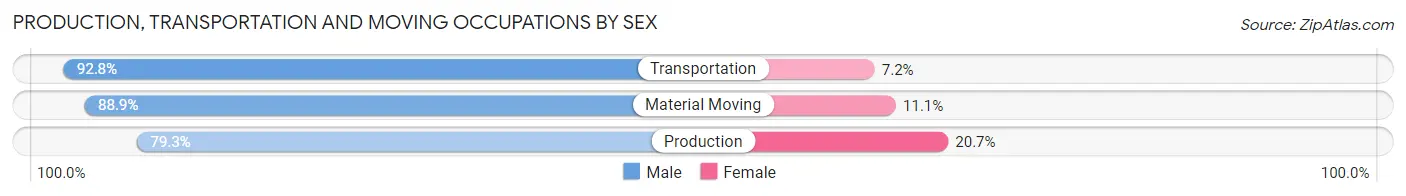
Production, Transportation and Moving Occupations by Sex
| Occupation | Male | Female |
| Production | 383 (79.3%) | 100 (20.7%) |
| Transportation | 206 (92.8%) | 16 (7.2%) |
| Material Moving | 320 (88.9%) | 40 (11.1%) |
| Total (Category) | 909 (85.4%) | 156 (14.6%) |
| Total (Overall) | 2,743 (53.1%) | 2,427 (46.9%) |
Employment Industries by Sex in Smithville
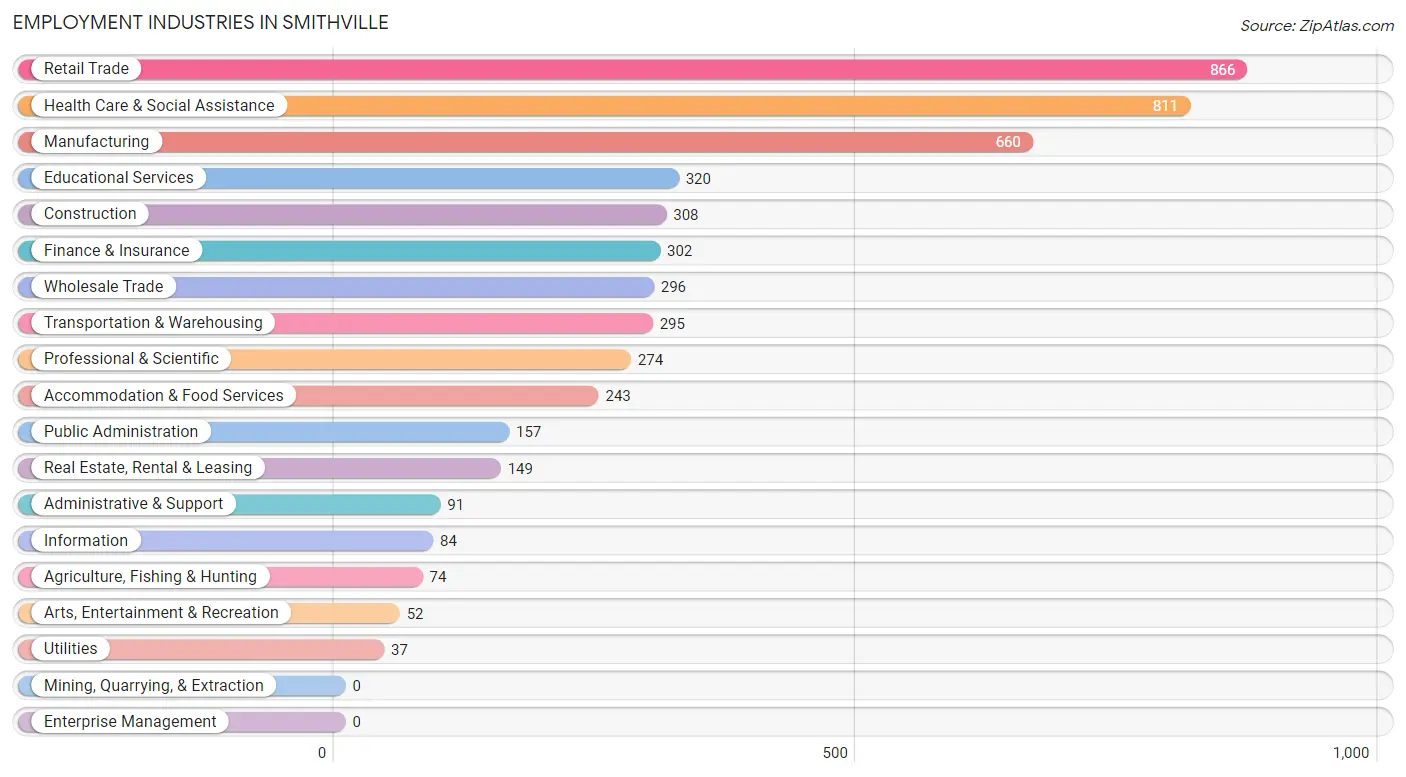
Employment Industries in Smithville
The major employment industries in Smithville include Retail Trade (866 | 16.8%), Health Care & Social Assistance (811 | 15.7%), Manufacturing (660 | 12.8%), Educational Services (320 | 6.2%), and Construction (308 | 6.0%).
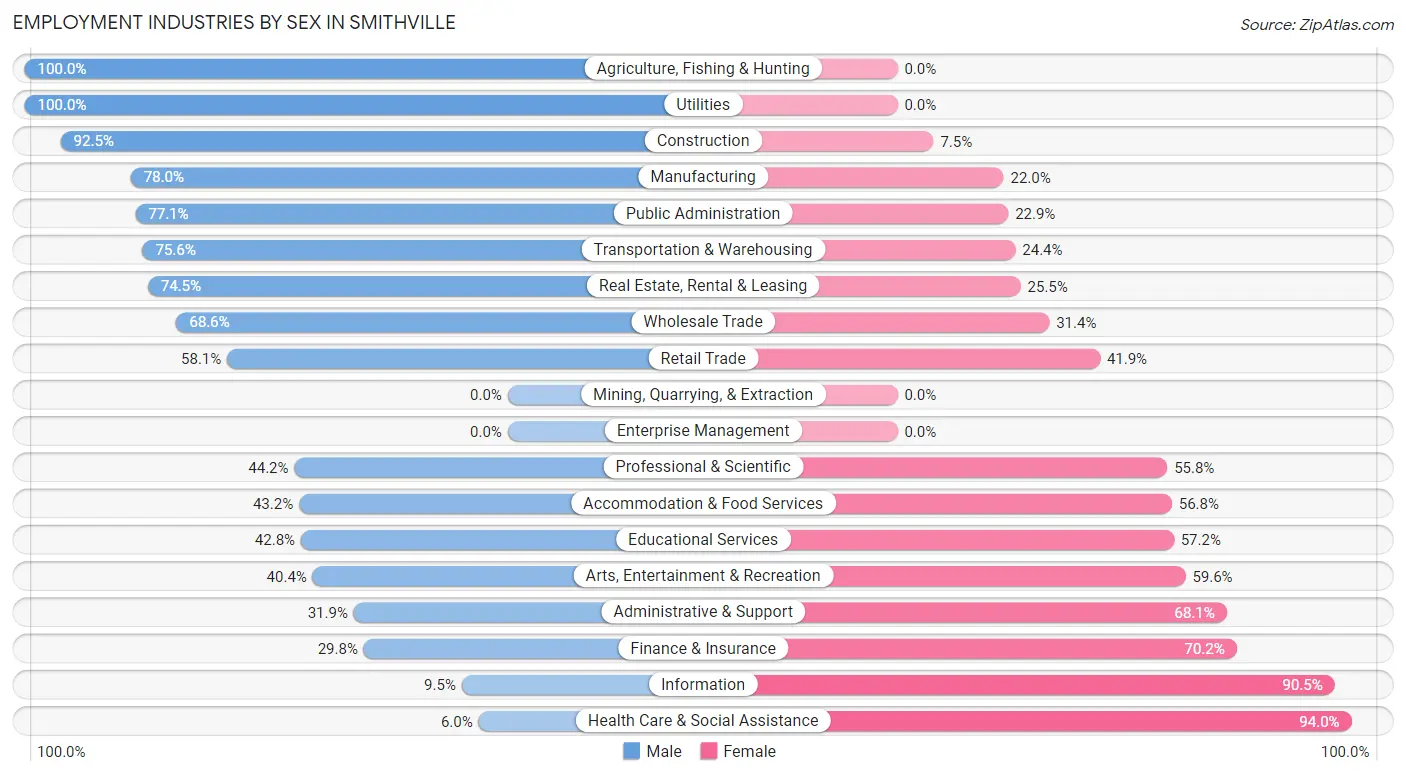
Employment Industries by Sex in Smithville
The Smithville industries that see more men than women are Agriculture, Fishing & Hunting (100.0%), Utilities (100.0%), and Construction (92.5%), whereas the industries that tend to have a higher number of women are Health Care & Social Assistance (94.0%), Information (90.5%), and Finance & Insurance (70.2%).
| Industry | Male | Female |
| Agriculture, Fishing & Hunting | 74 (100.0%) | 0 (0.0%) |
| Mining, Quarrying, & Extraction | 0 (0.0%) | 0 (0.0%) |
| Construction | 285 (92.5%) | 23 (7.5%) |
| Manufacturing | 515 (78.0%) | 145 (22.0%) |
| Wholesale Trade | 203 (68.6%) | 93 (31.4%) |
| Retail Trade | 503 (58.1%) | 363 (41.9%) |
| Transportation & Warehousing | 223 (75.6%) | 72 (24.4%) |
| Utilities | 37 (100.0%) | 0 (0.0%) |
| Information | 8 (9.5%) | 76 (90.5%) |
| Finance & Insurance | 90 (29.8%) | 212 (70.2%) |
| Real Estate, Rental & Leasing | 111 (74.5%) | 38 (25.5%) |
| Professional & Scientific | 121 (44.2%) | 153 (55.8%) |
| Enterprise Management | 0 (0.0%) | 0 (0.0%) |
| Administrative & Support | 29 (31.9%) | 62 (68.1%) |
| Educational Services | 137 (42.8%) | 183 (57.2%) |
| Health Care & Social Assistance | 49 (6.0%) | 762 (94.0%) |
| Arts, Entertainment & Recreation | 21 (40.4%) | 31 (59.6%) |
| Accommodation & Food Services | 105 (43.2%) | 138 (56.8%) |
| Public Administration | 121 (77.1%) | 36 (22.9%) |
| Total | 2,743 (53.1%) | 2,427 (46.9%) |
Education in Smithville
School Enrollment in Smithville
The most common levels of schooling among the 2,779 students in Smithville are high school (827 | 29.8%), elementary school (650 | 23.4%), and middle school (438 | 15.8%).
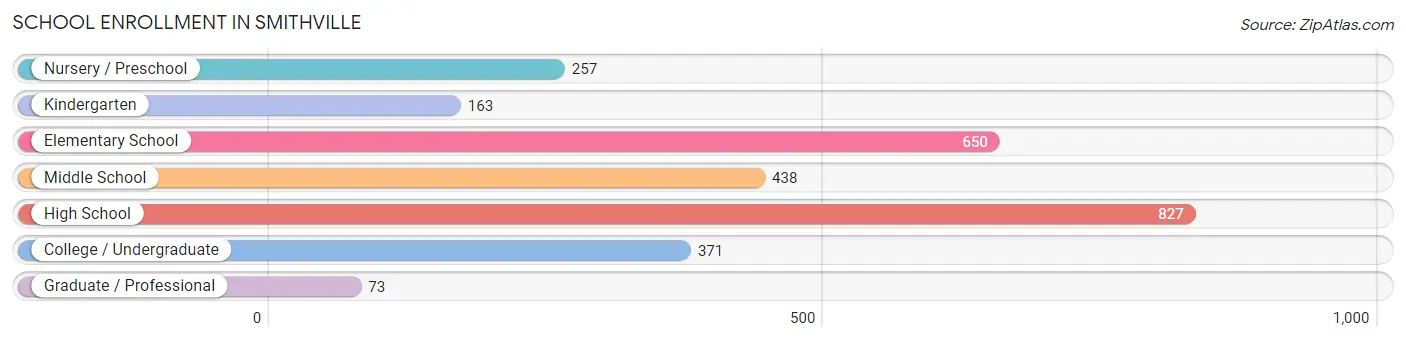
| School Level | # Students | % Students |
| Nursery / Preschool | 257 | 9.2% |
| Kindergarten | 163 | 5.9% |
| Elementary School | 650 | 23.4% |
| Middle School | 438 | 15.8% |
| High School | 827 | 29.8% |
| College / Undergraduate | 371 | 13.4% |
| Graduate / Professional | 73 | 2.6% |
| Total | 2,779 | 100.0% |
School Enrollment by Age by Funding Source in Smithville
Out of a total of 2,779 students who are enrolled in schools in Smithville, 370 (13.3%) attend a private institution, while the remaining 2,409 (86.7%) are enrolled in public schools. The age group of 3 to 4 year olds has the highest likelihood of being enrolled in private schools, with 130 (66.0% in the age bracket) enrolled. Conversely, the age group of 10 to 14 year olds has the lowest likelihood of being enrolled in a private school, with 512 (100.0% in the age bracket) attending a public institution.
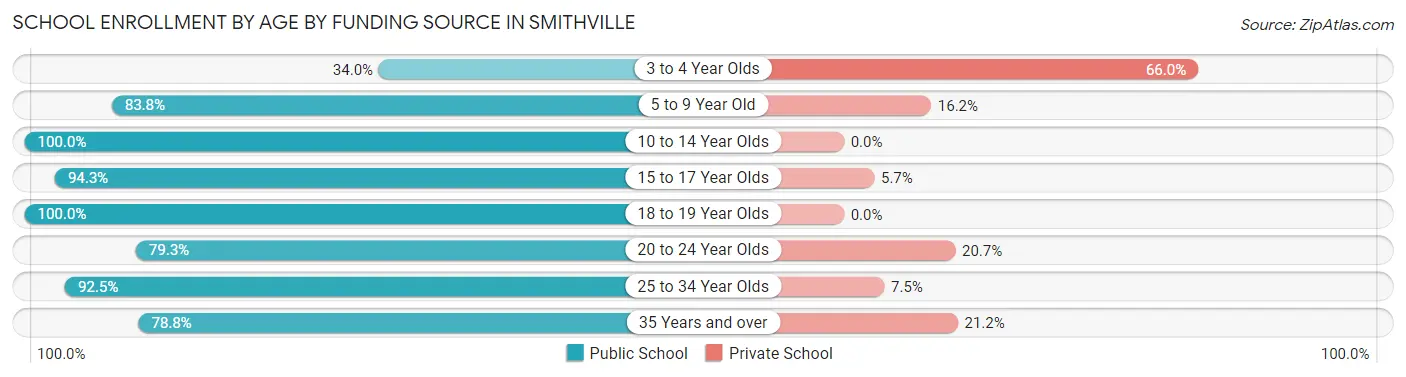
| Age Bracket | Public School | Private School |
| 3 to 4 Year Olds | 67 (34.0%) | 130 (66.0%) |
| 5 to 9 Year Old | 722 (83.8%) | 140 (16.2%) |
| 10 to 14 Year Olds | 512 (100.0%) | 0 (0.0%) |
| 15 to 17 Year Olds | 650 (94.3%) | 39 (5.7%) |
| 18 to 19 Year Olds | 79 (100.0%) | 0 (0.0%) |
| 20 to 24 Year Olds | 107 (79.3%) | 28 (20.7%) |
| 25 to 34 Year Olds | 221 (92.5%) | 18 (7.5%) |
| 35 Years and over | 52 (78.8%) | 14 (21.2%) |
| Total | 2,409 (86.7%) | 370 (13.3%) |
Educational Attainment by Field of Study in Smithville
Business (453 | 23.1%), education (416 | 21.2%), science & technology (321 | 16.4%), arts & humanities (153 | 7.8%), and psychology (134 | 6.8%) are the most common fields of study among 1,960 individuals in Smithville who have obtained a bachelor's degree or higher.
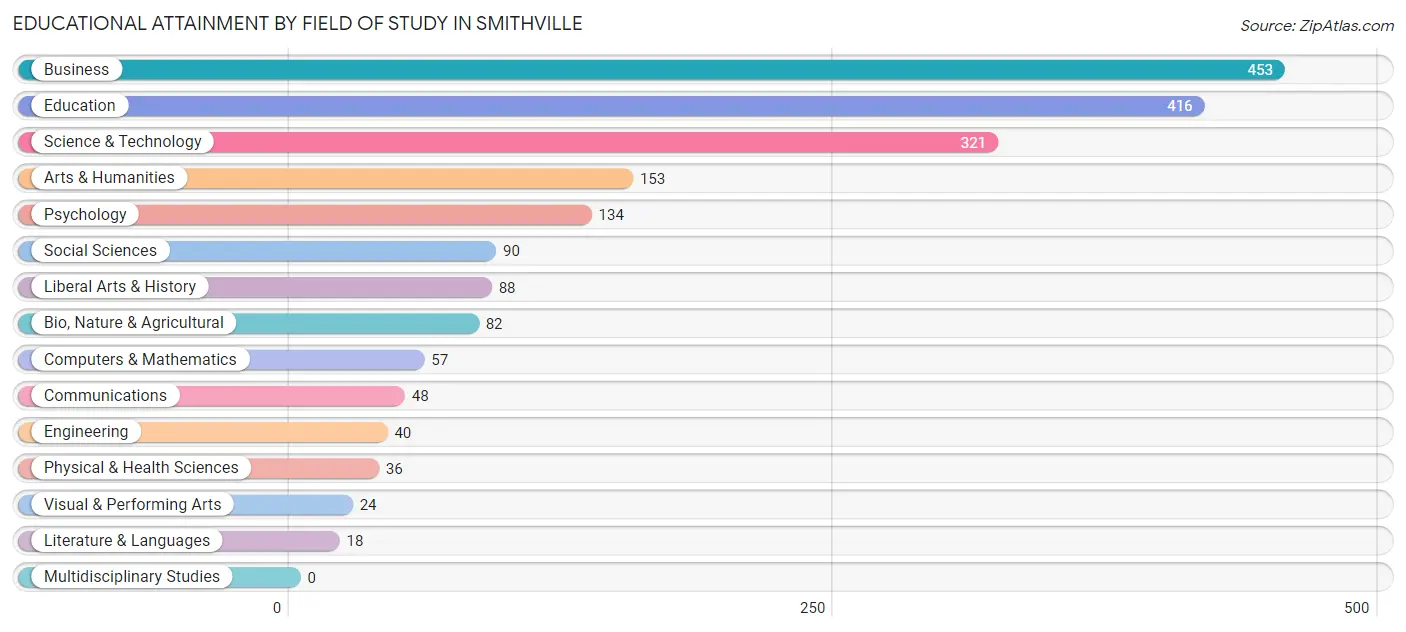
| Field of Study | # Graduates | % Graduates |
| Computers & Mathematics | 57 | 2.9% |
| Bio, Nature & Agricultural | 82 | 4.2% |
| Physical & Health Sciences | 36 | 1.8% |
| Psychology | 134 | 6.8% |
| Social Sciences | 90 | 4.6% |
| Engineering | 40 | 2.0% |
| Multidisciplinary Studies | 0 | 0.0% |
| Science & Technology | 321 | 16.4% |
| Business | 453 | 23.1% |
| Education | 416 | 21.2% |
| Literature & Languages | 18 | 0.9% |
| Liberal Arts & History | 88 | 4.5% |
| Visual & Performing Arts | 24 | 1.2% |
| Communications | 48 | 2.5% |
| Arts & Humanities | 153 | 7.8% |
| Total | 1,960 | 100.0% |
Transportation & Commute in Smithville
Vehicle Availability by Sex in Smithville
The most prevalent vehicle ownership categories in Smithville are males with 2 vehicles (1,046, accounting for 37.6%) and females with 2 vehicles (992, making up 43.6%).
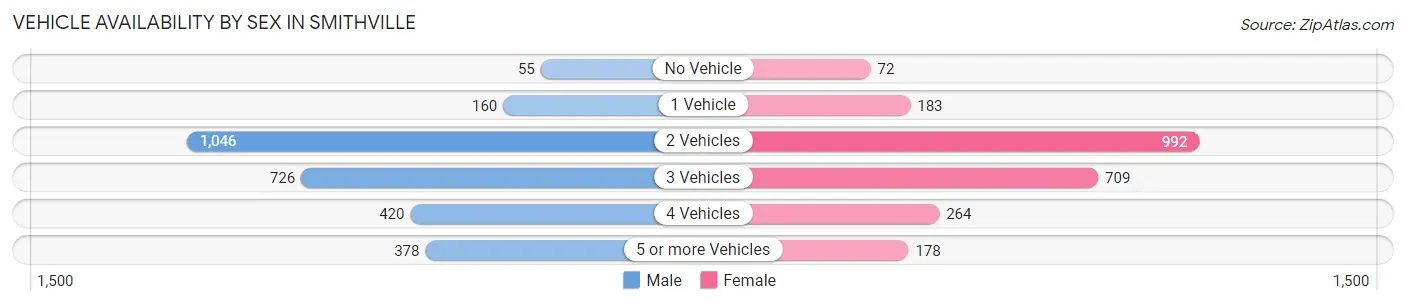
| Vehicles Available | Male | Female |
| No Vehicle | 55 (2.0%) | 72 (3.0%) |
| 1 Vehicle | 160 (5.8%) | 183 (7.6%) |
| 2 Vehicles | 1,046 (37.6%) | 992 (41.4%) |
| 3 Vehicles | 726 (26.1%) | 709 (29.6%) |
| 4 Vehicles | 420 (15.1%) | 264 (11.0%) |
| 5 or more Vehicles | 378 (13.6%) | 178 (7.4%) |
| Total | 2,785 (100.0%) | 2,398 (100.0%) |
Commute Time in Smithville
The most frequently occuring commute durations in Smithville are 20 to 24 minutes (753 commuters, 15.7%), 30 to 34 minutes (739 commuters, 15.4%), and 45 to 59 minutes (607 commuters, 12.7%).
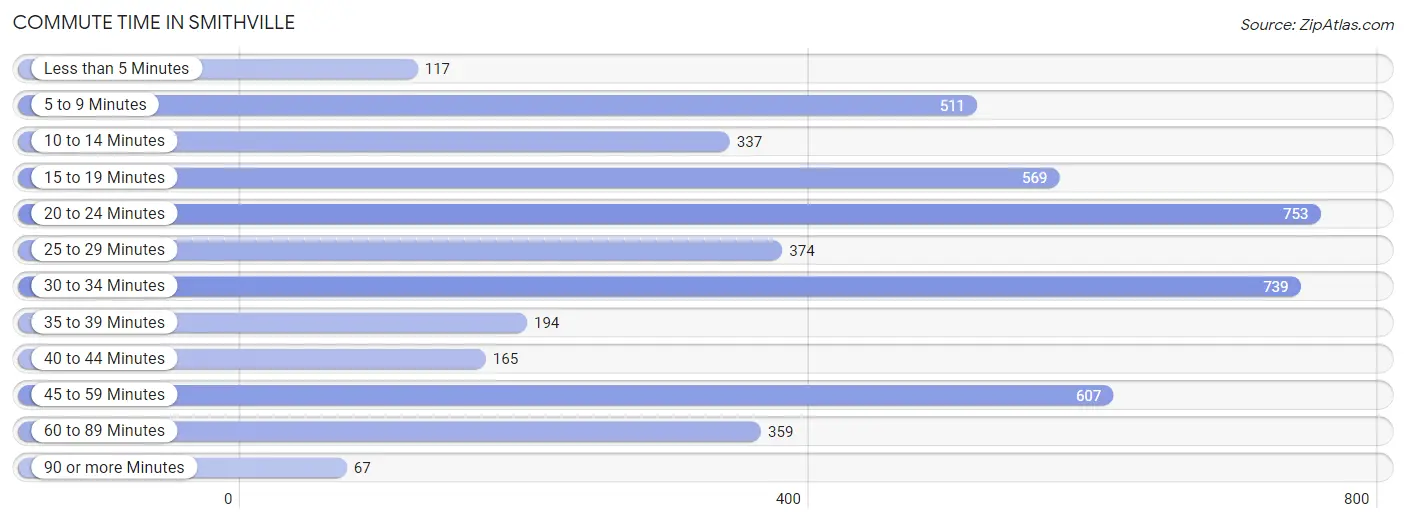
| Commute Time | # Commuters | % Commuters |
| Less than 5 Minutes | 117 | 2.4% |
| 5 to 9 Minutes | 511 | 10.7% |
| 10 to 14 Minutes | 337 | 7.0% |
| 15 to 19 Minutes | 569 | 11.9% |
| 20 to 24 Minutes | 753 | 15.7% |
| 25 to 29 Minutes | 374 | 7.8% |
| 30 to 34 Minutes | 739 | 15.4% |
| 35 to 39 Minutes | 194 | 4.1% |
| 40 to 44 Minutes | 165 | 3.4% |
| 45 to 59 Minutes | 607 | 12.7% |
| 60 to 89 Minutes | 359 | 7.5% |
| 90 or more Minutes | 67 | 1.4% |
Commute Time by Sex in Smithville
The most common commute times in Smithville are 20 to 24 minutes (403 commuters, 15.4%) for males and 15 to 19 minutes (365 commuters, 16.8%) for females.
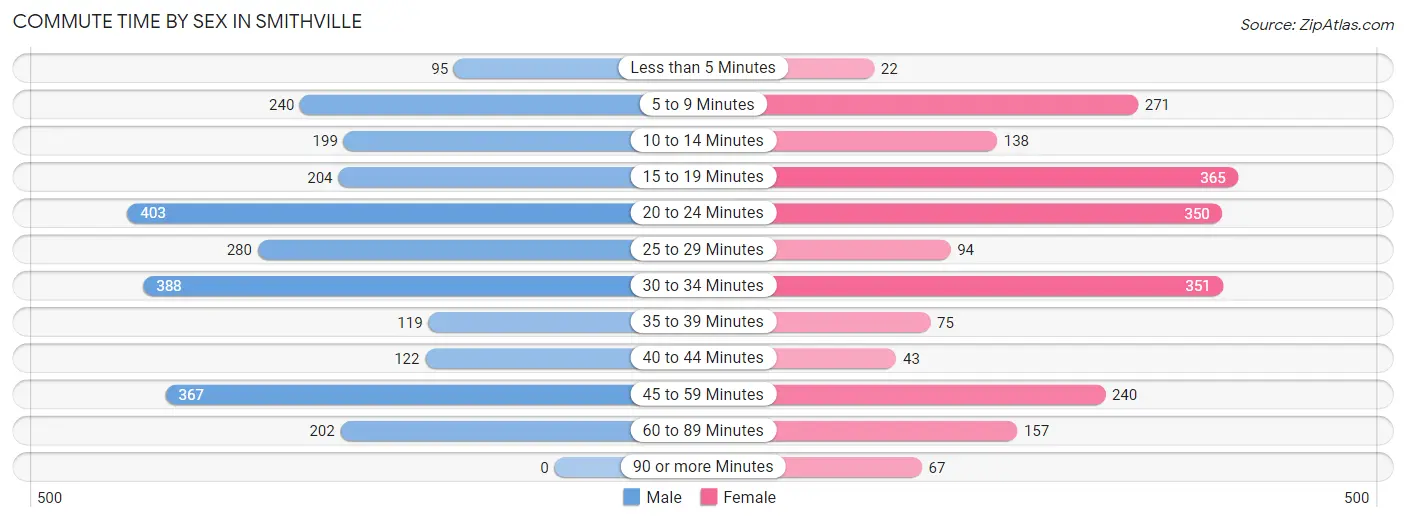
| Commute Time | Male | Female |
| Less than 5 Minutes | 95 (3.6%) | 22 (1.0%) |
| 5 to 9 Minutes | 240 (9.2%) | 271 (12.5%) |
| 10 to 14 Minutes | 199 (7.6%) | 138 (6.4%) |
| 15 to 19 Minutes | 204 (7.8%) | 365 (16.8%) |
| 20 to 24 Minutes | 403 (15.4%) | 350 (16.1%) |
| 25 to 29 Minutes | 280 (10.7%) | 94 (4.3%) |
| 30 to 34 Minutes | 388 (14.8%) | 351 (16.2%) |
| 35 to 39 Minutes | 119 (4.5%) | 75 (3.5%) |
| 40 to 44 Minutes | 122 (4.7%) | 43 (2.0%) |
| 45 to 59 Minutes | 367 (14.0%) | 240 (11.0%) |
| 60 to 89 Minutes | 202 (7.7%) | 157 (7.2%) |
| 90 or more Minutes | 0 (0.0%) | 67 (3.1%) |
Time of Departure to Work by Sex in Smithville
The most frequent times of departure to work in Smithville are 6:00 AM to 6:29 AM (496, 18.9%) for males and 6:00 AM to 6:29 AM (327, 15.0%) for females.
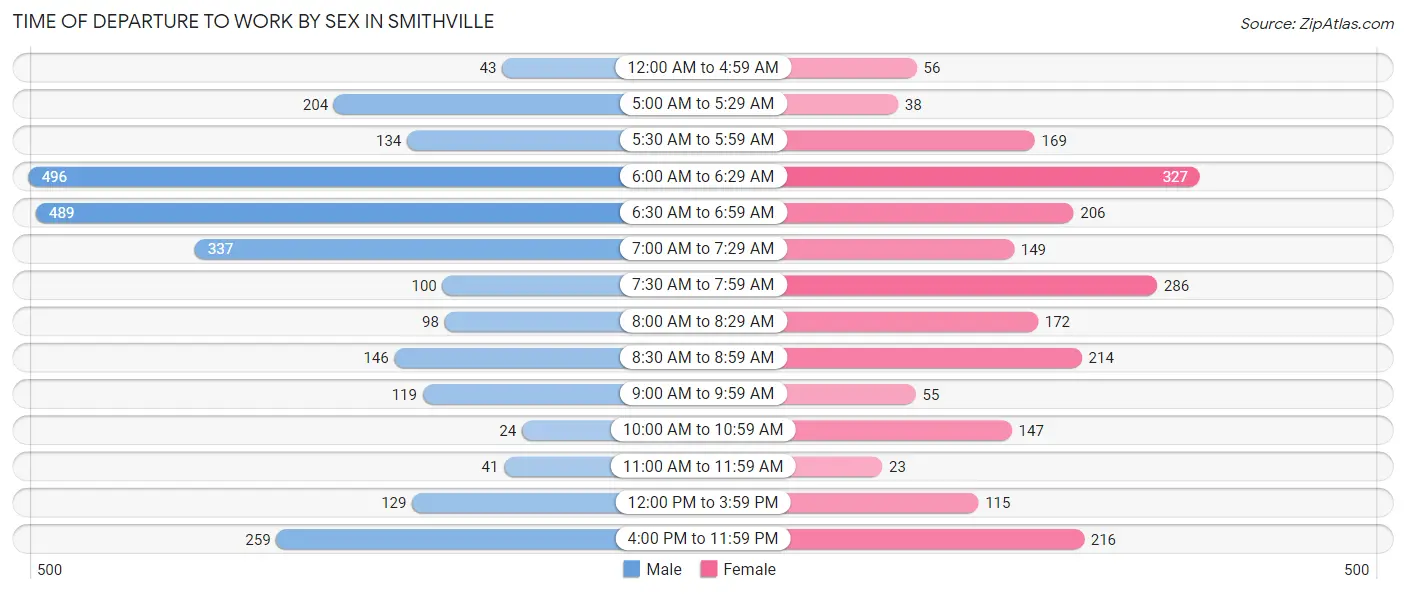
| Time of Departure | Male | Female |
| 12:00 AM to 4:59 AM | 43 (1.6%) | 56 (2.6%) |
| 5:00 AM to 5:29 AM | 204 (7.8%) | 38 (1.8%) |
| 5:30 AM to 5:59 AM | 134 (5.1%) | 169 (7.8%) |
| 6:00 AM to 6:29 AM | 496 (18.9%) | 327 (15.0%) |
| 6:30 AM to 6:59 AM | 489 (18.7%) | 206 (9.5%) |
| 7:00 AM to 7:29 AM | 337 (12.9%) | 149 (6.9%) |
| 7:30 AM to 7:59 AM | 100 (3.8%) | 286 (13.2%) |
| 8:00 AM to 8:29 AM | 98 (3.7%) | 172 (7.9%) |
| 8:30 AM to 8:59 AM | 146 (5.6%) | 214 (9.9%) |
| 9:00 AM to 9:59 AM | 119 (4.5%) | 55 (2.5%) |
| 10:00 AM to 10:59 AM | 24 (0.9%) | 147 (6.8%) |
| 11:00 AM to 11:59 AM | 41 (1.6%) | 23 (1.1%) |
| 12:00 PM to 3:59 PM | 129 (4.9%) | 115 (5.3%) |
| 4:00 PM to 11:59 PM | 259 (9.9%) | 216 (9.9%) |
| Total | 2,619 (100.0%) | 2,173 (100.0%) |
Housing Occupancy in Smithville
Occupancy by Ownership in Smithville
Of the total 3,638 dwellings in Smithville, owner-occupied units account for 3,185 (87.5%), while renter-occupied units make up 453 (12.4%).
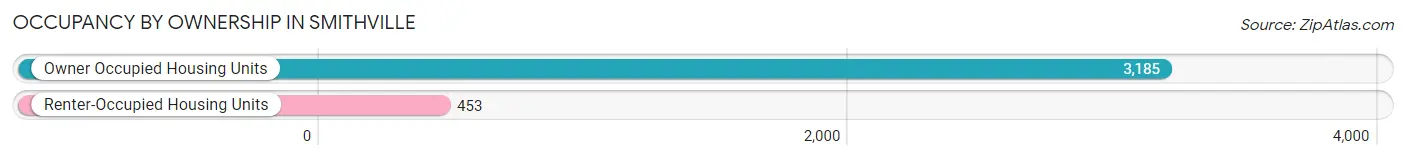
| Occupancy | # Housing Units | % Housing Units |
| Owner Occupied Housing Units | 3,185 | 87.5% |
| Renter-Occupied Housing Units | 453 | 12.4% |
| Total Occupied Housing Units | 3,638 | 100.0% |
Occupancy by Household Size in Smithville
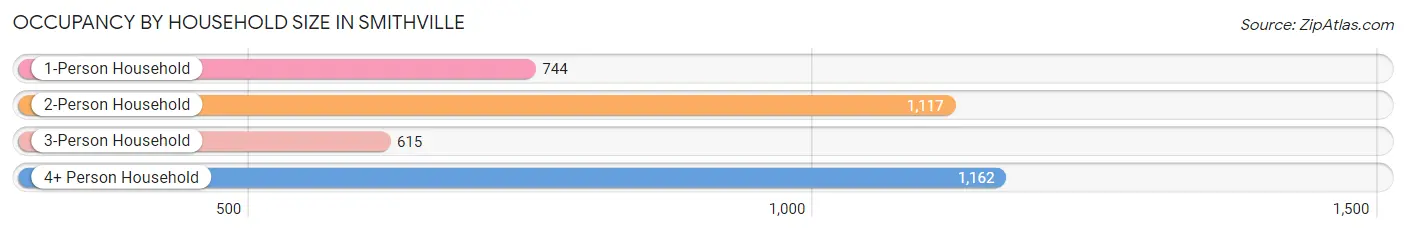
| Household Size | # Housing Units | % Housing Units |
| 1-Person Household | 744 | 20.4% |
| 2-Person Household | 1,117 | 30.7% |
| 3-Person Household | 615 | 16.9% |
| 4+ Person Household | 1,162 | 31.9% |
| Total Housing Units | 3,638 | 100.0% |
Occupancy by Ownership by Household Size in Smithville
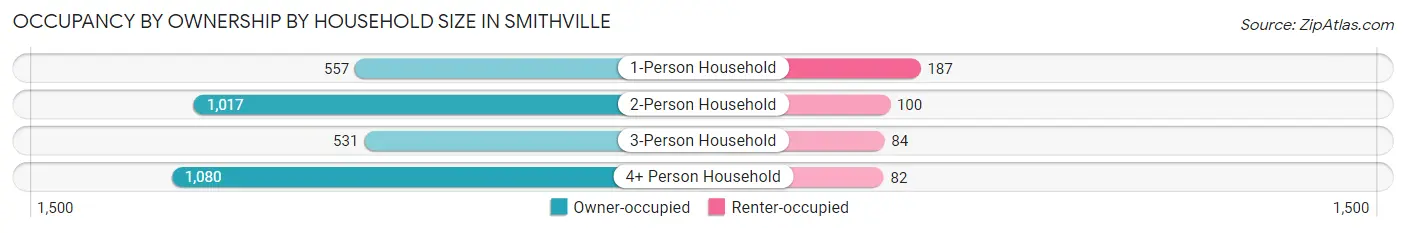
| Household Size | Owner-occupied | Renter-occupied |
| 1-Person Household | 557 (74.9%) | 187 (25.1%) |
| 2-Person Household | 1,017 (91.0%) | 100 (8.9%) |
| 3-Person Household | 531 (86.3%) | 84 (13.7%) |
| 4+ Person Household | 1,080 (92.9%) | 82 (7.1%) |
| Total Housing Units | 3,185 (87.5%) | 453 (12.4%) |
Occupancy by Educational Attainment in Smithville
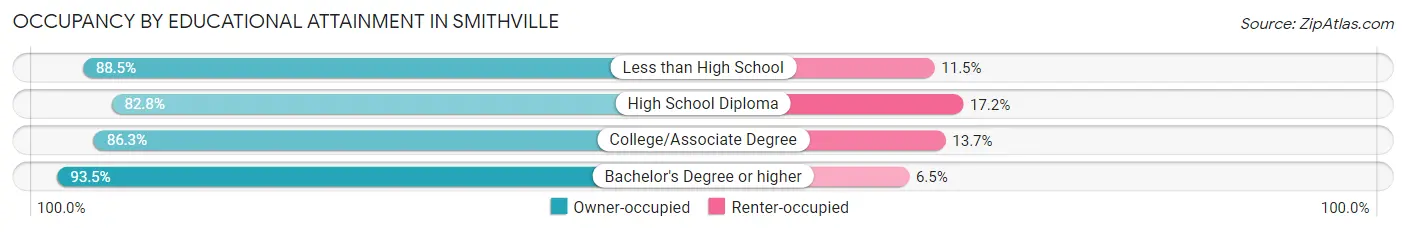
| Household Size | Owner-occupied | Renter-occupied |
| Less than High School | 138 (88.5%) | 18 (11.5%) |
| High School Diploma | 855 (82.8%) | 178 (17.2%) |
| College/Associate Degree | 1,170 (86.3%) | 186 (13.7%) |
| Bachelor's Degree or higher | 1,022 (93.5%) | 71 (6.5%) |
Occupancy by Age of Householder in Smithville
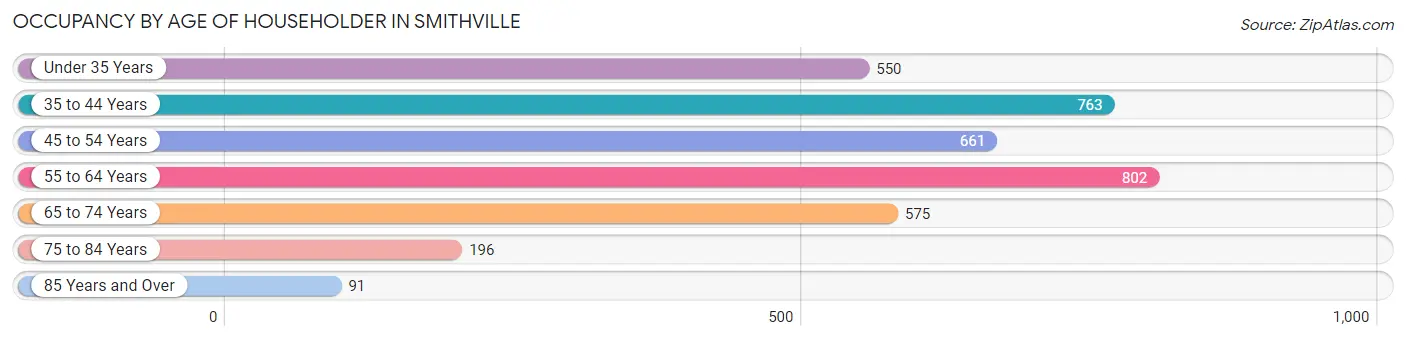
| Age Bracket | # Households | % Households |
| Under 35 Years | 550 | 15.1% |
| 35 to 44 Years | 763 | 21.0% |
| 45 to 54 Years | 661 | 18.2% |
| 55 to 64 Years | 802 | 22.1% |
| 65 to 74 Years | 575 | 15.8% |
| 75 to 84 Years | 196 | 5.4% |
| 85 Years and Over | 91 | 2.5% |
| Total | 3,638 | 100.0% |
Housing Finances in Smithville
Median Income by Occupancy in Smithville
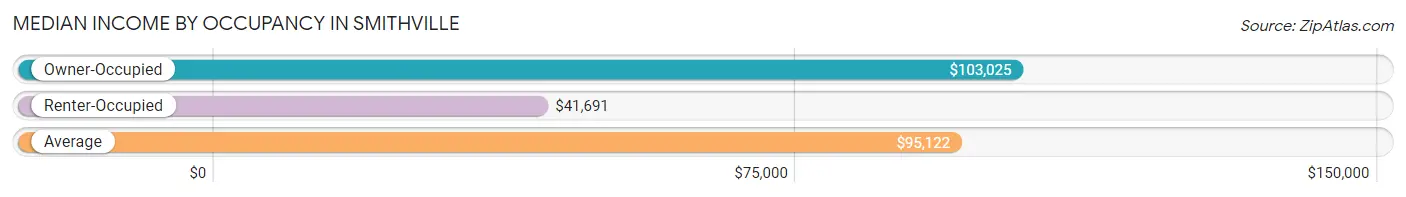
| Occupancy Type | # Households | Median Income |
| Owner-Occupied | 3,185 (87.5%) | $103,025 |
| Renter-Occupied | 453 (12.4%) | $41,691 |
| Average | 3,638 (100.0%) | $95,122 |
Occupancy by Householder Income Bracket in Smithville
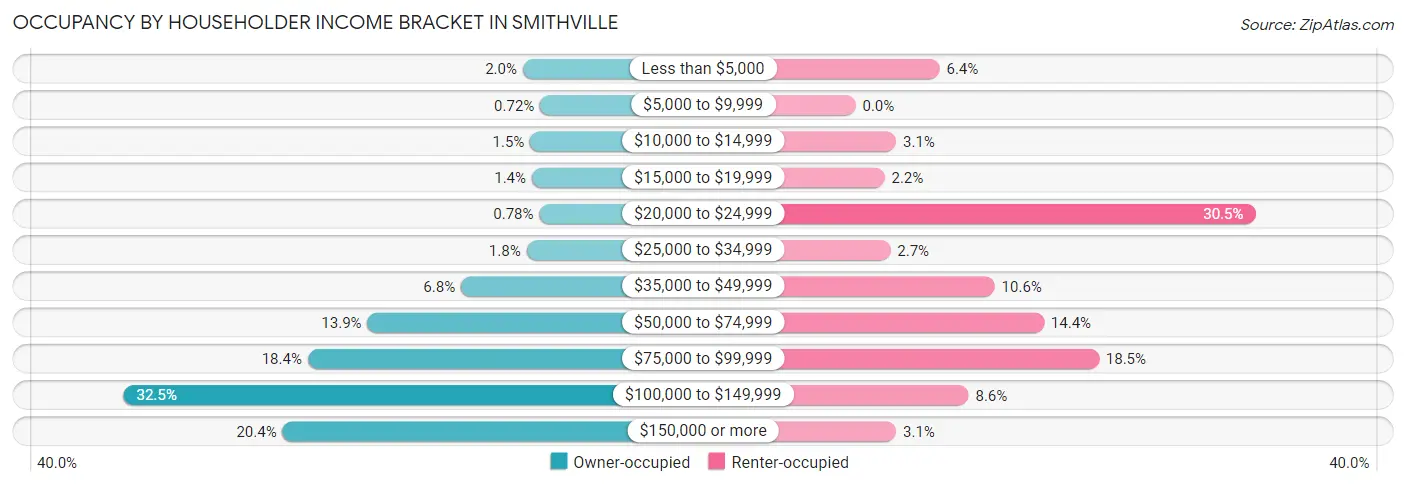
| Income Bracket | Owner-occupied | Renter-occupied |
| Less than $5,000 | 65 (2.0%) | 29 (6.4%) |
| $5,000 to $9,999 | 23 (0.7%) | 0 (0.0%) |
| $10,000 to $14,999 | 47 (1.5%) | 14 (3.1%) |
| $15,000 to $19,999 | 43 (1.3%) | 10 (2.2%) |
| $20,000 to $24,999 | 25 (0.8%) | 138 (30.5%) |
| $25,000 to $34,999 | 56 (1.8%) | 12 (2.6%) |
| $35,000 to $49,999 | 215 (6.8%) | 48 (10.6%) |
| $50,000 to $74,999 | 442 (13.9%) | 65 (14.3%) |
| $75,000 to $99,999 | 587 (18.4%) | 84 (18.5%) |
| $100,000 to $149,999 | 1,034 (32.5%) | 39 (8.6%) |
| $150,000 or more | 648 (20.3%) | 14 (3.1%) |
| Total | 3,185 (100.0%) | 453 (100.0%) |
Monthly Housing Cost Tiers in Smithville
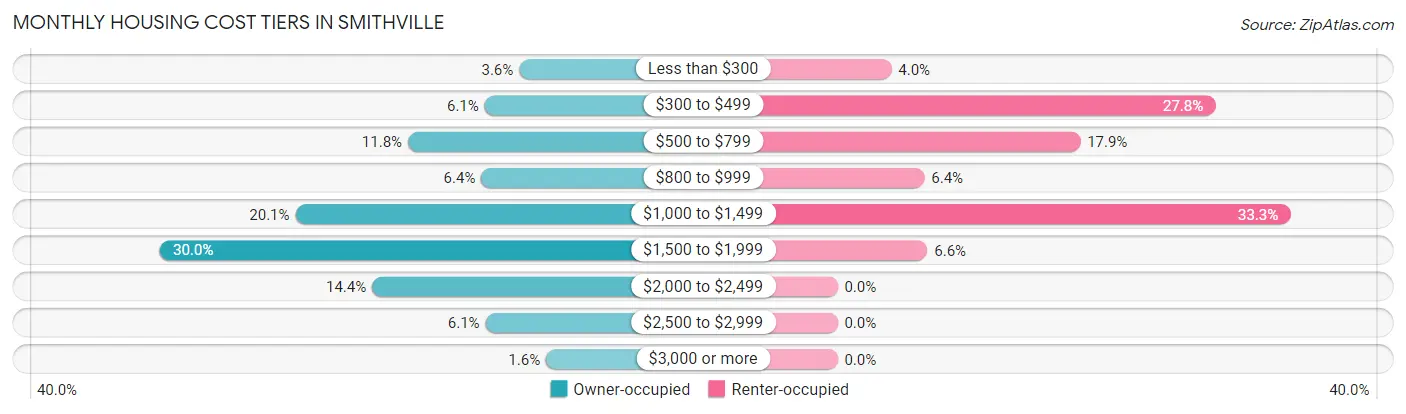
| Monthly Cost | Owner-occupied | Renter-occupied |
| Less than $300 | 114 (3.6%) | 18 (4.0%) |
| $300 to $499 | 195 (6.1%) | 126 (27.8%) |
| $500 to $799 | 375 (11.8%) | 81 (17.9%) |
| $800 to $999 | 203 (6.4%) | 29 (6.4%) |
| $1,000 to $1,499 | 639 (20.1%) | 151 (33.3%) |
| $1,500 to $1,999 | 956 (30.0%) | 30 (6.6%) |
| $2,000 to $2,499 | 459 (14.4%) | 0 (0.0%) |
| $2,500 to $2,999 | 193 (6.1%) | 0 (0.0%) |
| $3,000 or more | 51 (1.6%) | 0 (0.0%) |
| Total | 3,185 (100.0%) | 453 (100.0%) |
Physical Housing Characteristics in Smithville
Housing Structures in Smithville
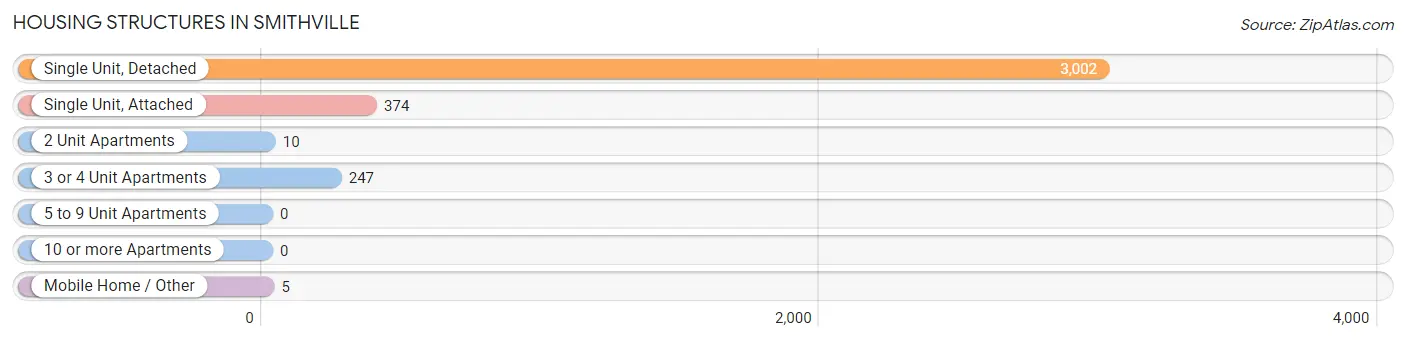
| Structure Type | # Housing Units | % Housing Units |
| Single Unit, Detached | 3,002 | 82.5% |
| Single Unit, Attached | 374 | 10.3% |
| 2 Unit Apartments | 10 | 0.3% |
| 3 or 4 Unit Apartments | 247 | 6.8% |
| 5 to 9 Unit Apartments | 0 | 0.0% |
| 10 or more Apartments | 0 | 0.0% |
| Mobile Home / Other | 5 | 0.1% |
| Total | 3,638 | 100.0% |
Housing Structures by Occupancy in Smithville
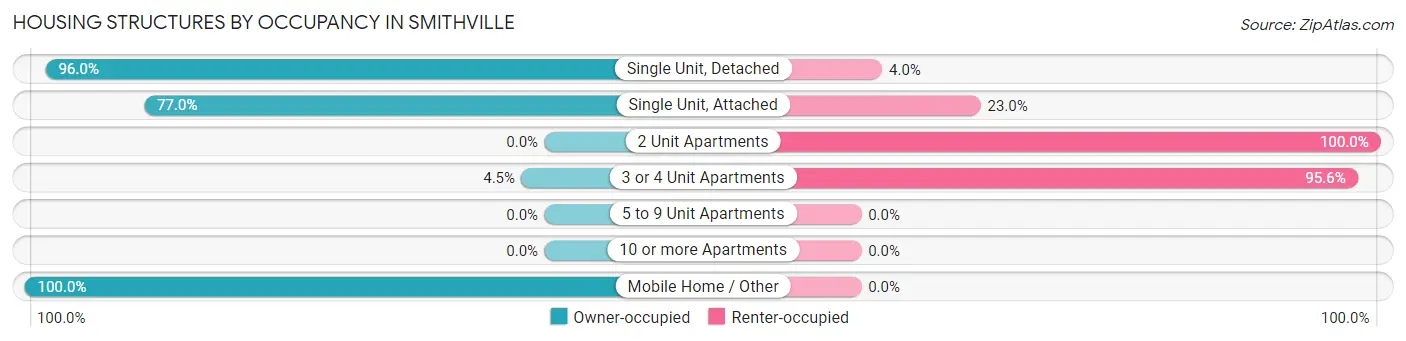
| Structure Type | Owner-occupied | Renter-occupied |
| Single Unit, Detached | 2,881 (96.0%) | 121 (4.0%) |
| Single Unit, Attached | 288 (77.0%) | 86 (23.0%) |
| 2 Unit Apartments | 0 (0.0%) | 10 (100.0%) |
| 3 or 4 Unit Apartments | 11 (4.4%) | 236 (95.6%) |
| 5 to 9 Unit Apartments | 0 (0.0%) | 0 (0.0%) |
| 10 or more Apartments | 0 (0.0%) | 0 (0.0%) |
| Mobile Home / Other | 5 (100.0%) | 0 (0.0%) |
| Total | 3,185 (87.5%) | 453 (12.4%) |
Housing Structures by Number of Rooms in Smithville
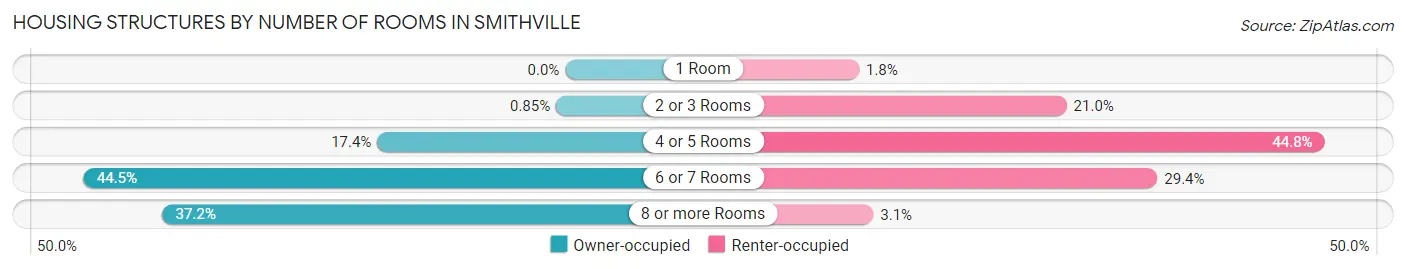
| Number of Rooms | Owner-occupied | Renter-occupied |
| 1 Room | 0 (0.0%) | 8 (1.8%) |
| 2 or 3 Rooms | 27 (0.9%) | 95 (21.0%) |
| 4 or 5 Rooms | 554 (17.4%) | 203 (44.8%) |
| 6 or 7 Rooms | 1,418 (44.5%) | 133 (29.4%) |
| 8 or more Rooms | 1,186 (37.2%) | 14 (3.1%) |
| Total | 3,185 (100.0%) | 453 (100.0%) |
Housing Structure by Heating Type in Smithville
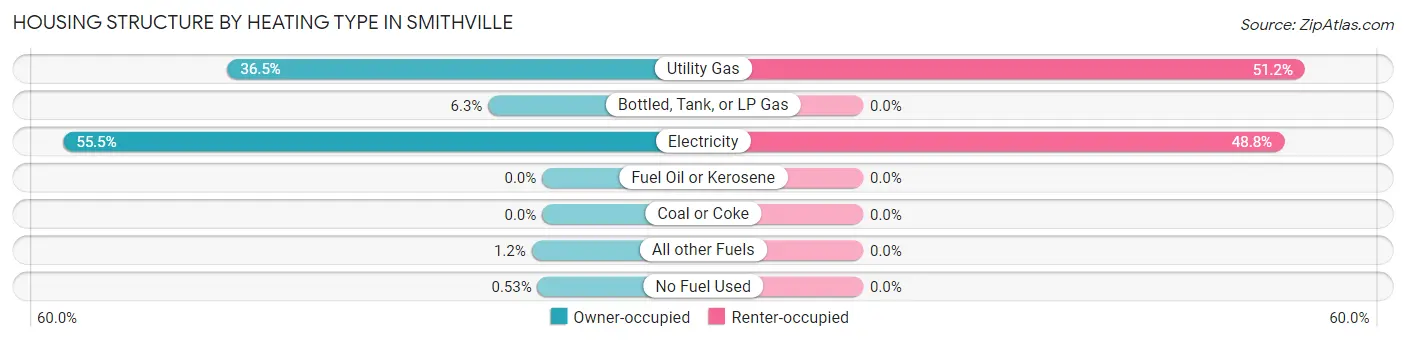
| Heating Type | Owner-occupied | Renter-occupied |
| Utility Gas | 1,162 (36.5%) | 232 (51.2%) |
| Bottled, Tank, or LP Gas | 199 (6.2%) | 0 (0.0%) |
| Electricity | 1,768 (55.5%) | 221 (48.8%) |
| Fuel Oil or Kerosene | 0 (0.0%) | 0 (0.0%) |
| Coal or Coke | 0 (0.0%) | 0 (0.0%) |
| All other Fuels | 39 (1.2%) | 0 (0.0%) |
| No Fuel Used | 17 (0.5%) | 0 (0.0%) |
| Total | 3,185 (100.0%) | 453 (100.0%) |
Household Vehicle Usage in Smithville
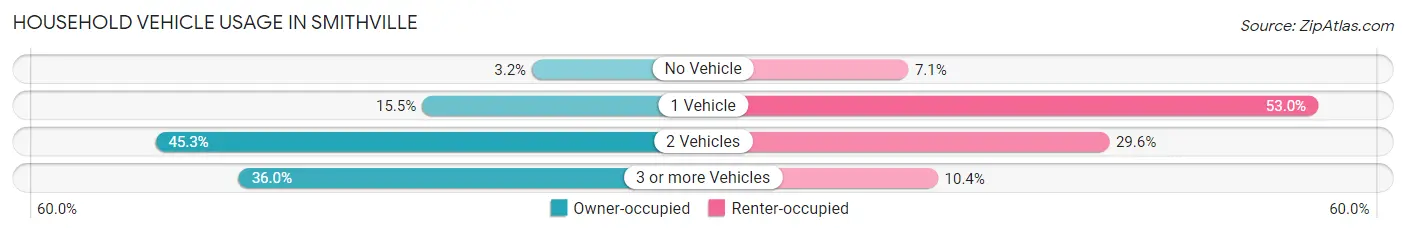
| Vehicles per Household | Owner-occupied | Renter-occupied |
| No Vehicle | 101 (3.2%) | 32 (7.1%) |
| 1 Vehicle | 493 (15.5%) | 240 (53.0%) |
| 2 Vehicles | 1,444 (45.3%) | 134 (29.6%) |
| 3 or more Vehicles | 1,147 (36.0%) | 47 (10.4%) |
| Total | 3,185 (100.0%) | 453 (100.0%) |
Real Estate & Mortgages in Smithville
Real Estate and Mortgage Overview in Smithville
| Characteristic | Without Mortgage | With Mortgage |
| Housing Units | 747 | 2,438 |
| Median Property Value | $253,400 | $247,900 |
| Median Household Income | $66,477 | $648 |
| Monthly Housing Costs | $613 | $51 |
| Real Estate Taxes | $2,469 | $35 |
Property Value by Mortgage Status in Smithville
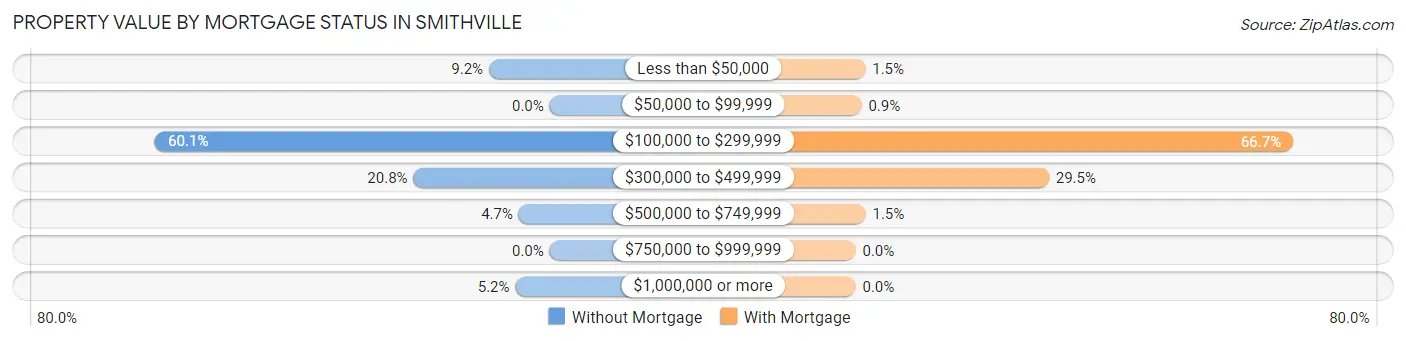
| Property Value | Without Mortgage | With Mortgage |
| Less than $50,000 | 69 (9.2%) | 36 (1.5%) |
| $50,000 to $99,999 | 0 (0.0%) | 22 (0.9%) |
| $100,000 to $299,999 | 449 (60.1%) | 1,625 (66.6%) |
| $300,000 to $499,999 | 155 (20.7%) | 718 (29.4%) |
| $500,000 to $749,999 | 35 (4.7%) | 37 (1.5%) |
| $750,000 to $999,999 | 0 (0.0%) | 0 (0.0%) |
| $1,000,000 or more | 39 (5.2%) | 0 (0.0%) |
| Total | 747 (100.0%) | 2,438 (100.0%) |
Household Income by Mortgage Status in Smithville
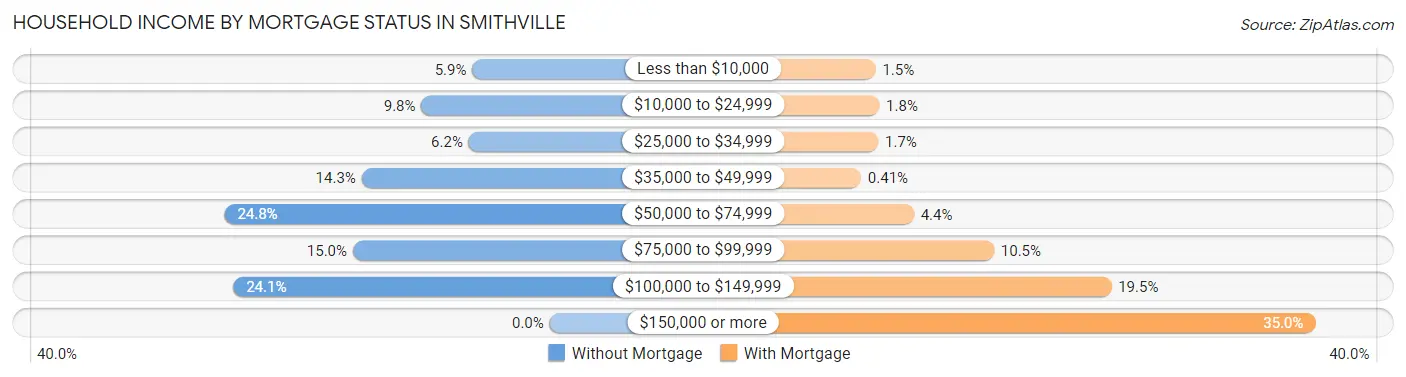
| Household Income | Without Mortgage | With Mortgage |
| Less than $10,000 | 44 (5.9%) | 37 (1.5%) |
| $10,000 to $24,999 | 73 (9.8%) | 44 (1.8%) |
| $25,000 to $34,999 | 46 (6.2%) | 42 (1.7%) |
| $35,000 to $49,999 | 107 (14.3%) | 10 (0.4%) |
| $50,000 to $74,999 | 185 (24.8%) | 108 (4.4%) |
| $75,000 to $99,999 | 112 (15.0%) | 257 (10.5%) |
| $100,000 to $149,999 | 180 (24.1%) | 475 (19.5%) |
| $150,000 or more | 0 (0.0%) | 854 (35.0%) |
| Total | 747 (100.0%) | 2,438 (100.0%) |
Property Value to Household Income Ratio in Smithville
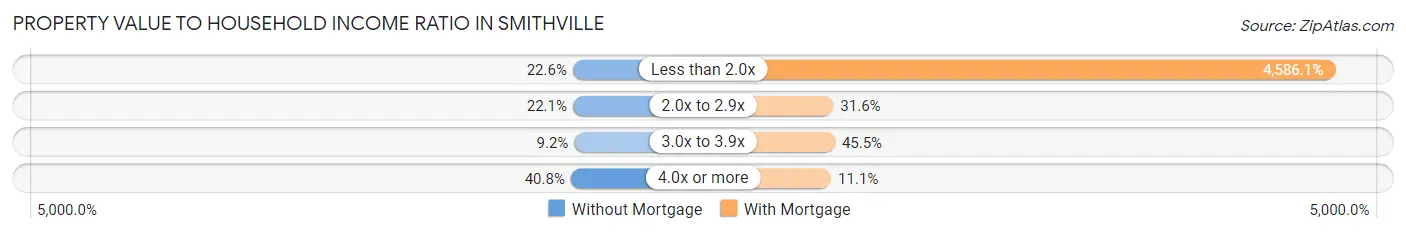
| Value-to-Income Ratio | Without Mortgage | With Mortgage |
| Less than 2.0x | 169 (22.6%) | 111,808 (4,586.1%) |
| 2.0x to 2.9x | 165 (22.1%) | 770 (31.6%) |
| 3.0x to 3.9x | 69 (9.2%) | 1,109 (45.5%) |
| 4.0x or more | 305 (40.8%) | 271 (11.1%) |
| Total | 747 (100.0%) | 2,438 (100.0%) |
Real Estate Taxes by Mortgage Status in Smithville
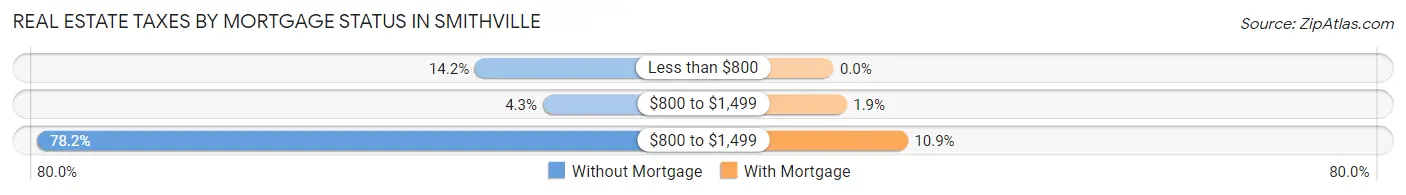
| Property Taxes | Without Mortgage | With Mortgage |
| Less than $800 | 106 (14.2%) | 0 (0.0%) |
| $800 to $1,499 | 32 (4.3%) | 47 (1.9%) |
| $800 to $1,499 | 584 (78.2%) | 265 (10.9%) |
| Total | 747 (100.0%) | 2,438 (100.0%) |
Health & Disability in Smithville
Health Insurance Coverage by Age in Smithville
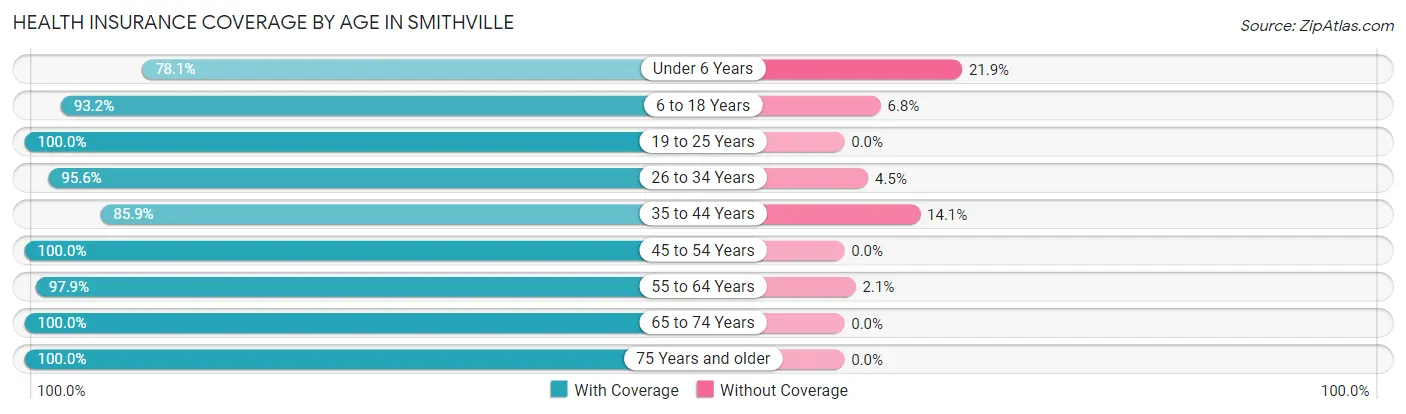
| Age Bracket | With Coverage | Without Coverage |
| Under 6 Years | 957 (78.1%) | 269 (21.9%) |
| 6 to 18 Years | 1,847 (93.2%) | 134 (6.8%) |
| 19 to 25 Years | 831 (100.0%) | 0 (0.0%) |
| 26 to 34 Years | 924 (95.6%) | 43 (4.4%) |
| 35 to 44 Years | 1,281 (85.9%) | 211 (14.1%) |
| 45 to 54 Years | 1,096 (100.0%) | 0 (0.0%) |
| 55 to 64 Years | 1,250 (97.9%) | 27 (2.1%) |
| 65 to 74 Years | 922 (100.0%) | 0 (0.0%) |
| 75 Years and older | 523 (100.0%) | 0 (0.0%) |
| Total | 9,631 (93.4%) | 684 (6.6%) |
Health Insurance Coverage by Citizenship Status in Smithville
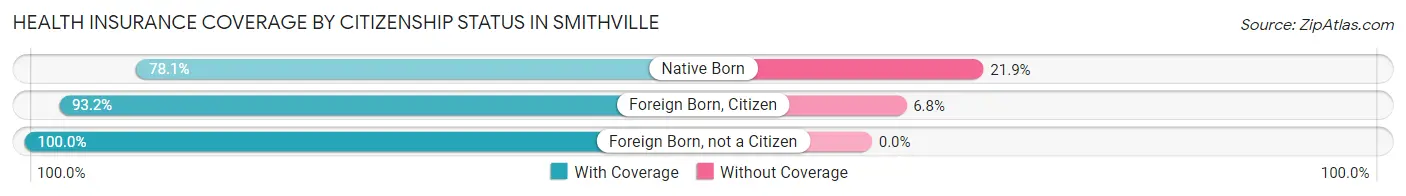
| Citizenship Status | With Coverage | Without Coverage |
| Native Born | 957 (78.1%) | 269 (21.9%) |
| Foreign Born, Citizen | 1,847 (93.2%) | 134 (6.8%) |
| Foreign Born, not a Citizen | 831 (100.0%) | 0 (0.0%) |
Health Insurance Coverage by Household Income in Smithville
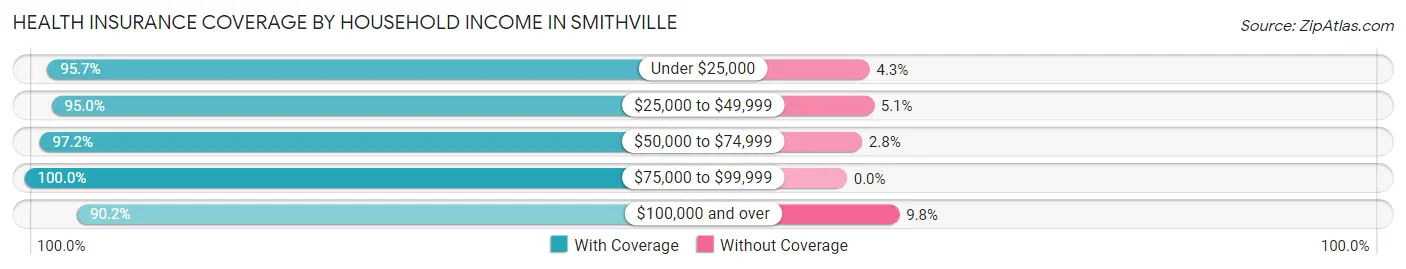
| Household Income | With Coverage | Without Coverage |
| Under $25,000 | 517 (95.7%) | 23 (4.3%) |
| $25,000 to $49,999 | 752 (95.0%) | 40 (5.1%) |
| $50,000 to $74,999 | 926 (97.2%) | 27 (2.8%) |
| $75,000 to $99,999 | 1,974 (100.0%) | 0 (0.0%) |
| $100,000 and over | 5,451 (90.2%) | 594 (9.8%) |
Public vs Private Health Insurance Coverage by Age in Smithville
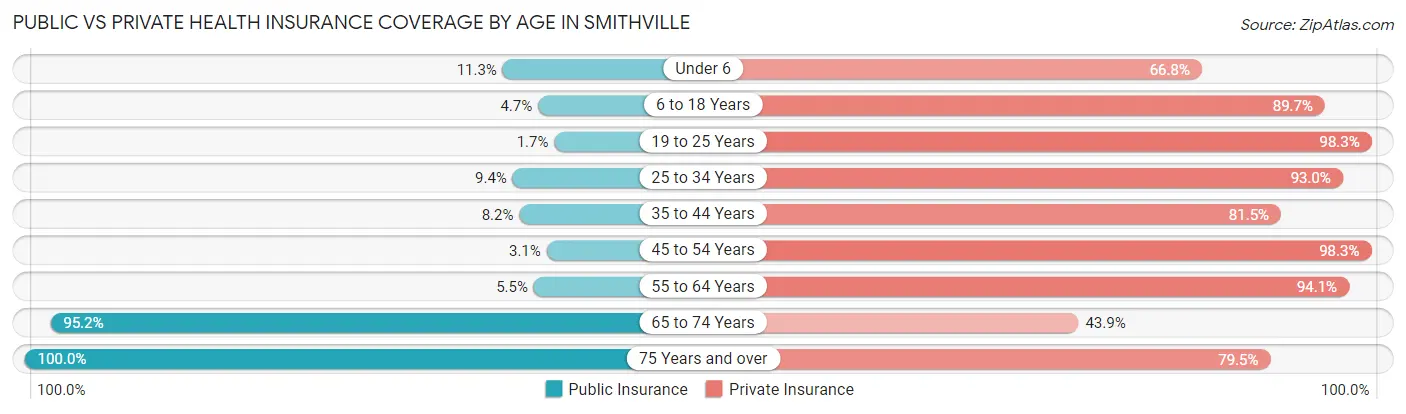
| Age Bracket | Public Insurance | Private Insurance |
| Under 6 | 138 (11.3%) | 819 (66.8%) |
| 6 to 18 Years | 93 (4.7%) | 1,776 (89.6%) |
| 19 to 25 Years | 14 (1.7%) | 817 (98.3%) |
| 25 to 34 Years | 91 (9.4%) | 899 (93.0%) |
| 35 to 44 Years | 122 (8.2%) | 1,216 (81.5%) |
| 45 to 54 Years | 34 (3.1%) | 1,077 (98.3%) |
| 55 to 64 Years | 70 (5.5%) | 1,202 (94.1%) |
| 65 to 74 Years | 878 (95.2%) | 405 (43.9%) |
| 75 Years and over | 523 (100.0%) | 416 (79.5%) |
| Total | 1,963 (19.0%) | 8,627 (83.6%) |
Disability Status by Sex by Age in Smithville
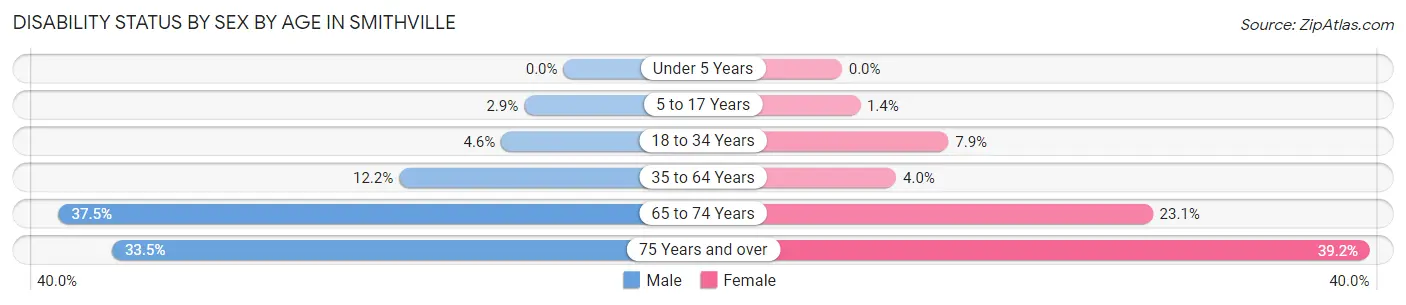
| Age Bracket | Male | Female |
| Under 5 Years | 0 (0.0%) | 0 (0.0%) |
| 5 to 17 Years | 29 (2.9%) | 15 (1.3%) |
| 18 to 34 Years | 44 (4.6%) | 72 (7.9%) |
| 35 to 64 Years | 223 (12.2%) | 82 (4.0%) |
| 65 to 74 Years | 175 (37.5%) | 105 (23.1%) |
| 75 Years and over | 65 (33.5%) | 129 (39.2%) |
Disability Class by Sex by Age in Smithville
Disability Class: Hearing Difficulty
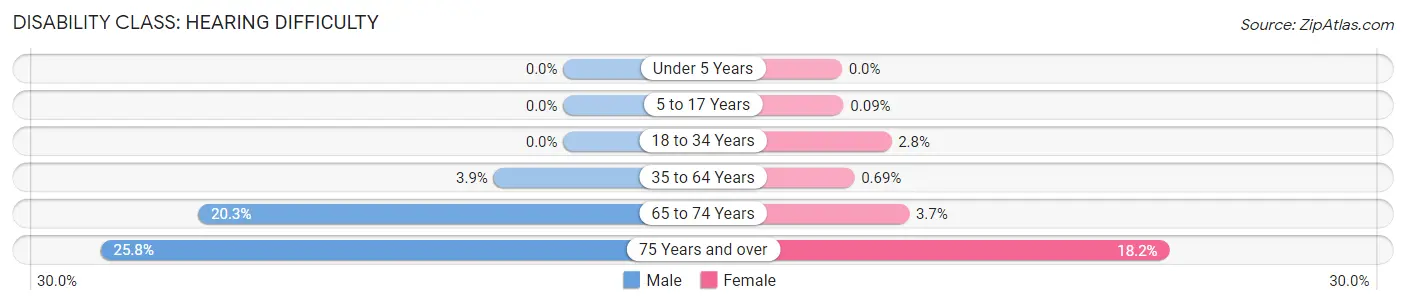
| Age Bracket | Male | Female |
| Under 5 Years | 0 (0.0%) | 0 (0.0%) |
| 5 to 17 Years | 0 (0.0%) | 1 (0.1%) |
| 18 to 34 Years | 0 (0.0%) | 25 (2.8%) |
| 35 to 64 Years | 71 (3.9%) | 14 (0.7%) |
| 65 to 74 Years | 95 (20.3%) | 17 (3.7%) |
| 75 Years and over | 50 (25.8%) | 60 (18.2%) |
Disability Class: Vision Difficulty
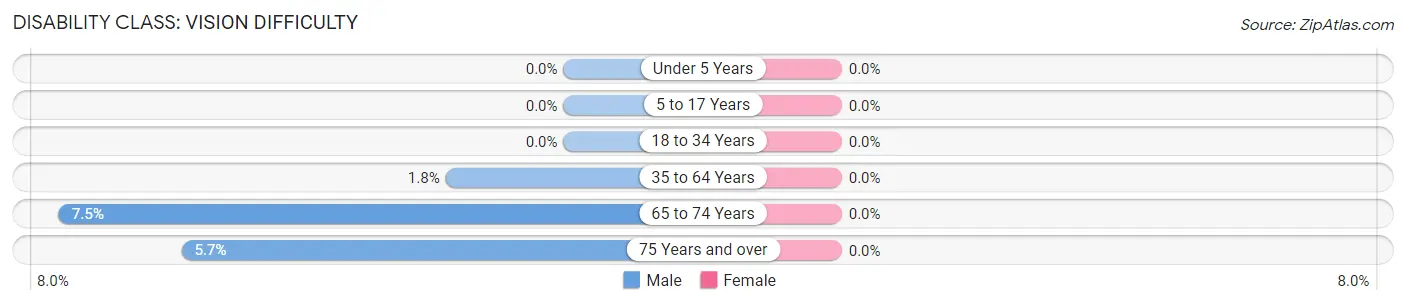
| Age Bracket | Male | Female |
| Under 5 Years | 0 (0.0%) | 0 (0.0%) |
| 5 to 17 Years | 0 (0.0%) | 0 (0.0%) |
| 18 to 34 Years | 0 (0.0%) | 0 (0.0%) |
| 35 to 64 Years | 32 (1.8%) | 0 (0.0%) |
| 65 to 74 Years | 35 (7.5%) | 0 (0.0%) |
| 75 Years and over | 11 (5.7%) | 0 (0.0%) |
Disability Class: Cognitive Difficulty
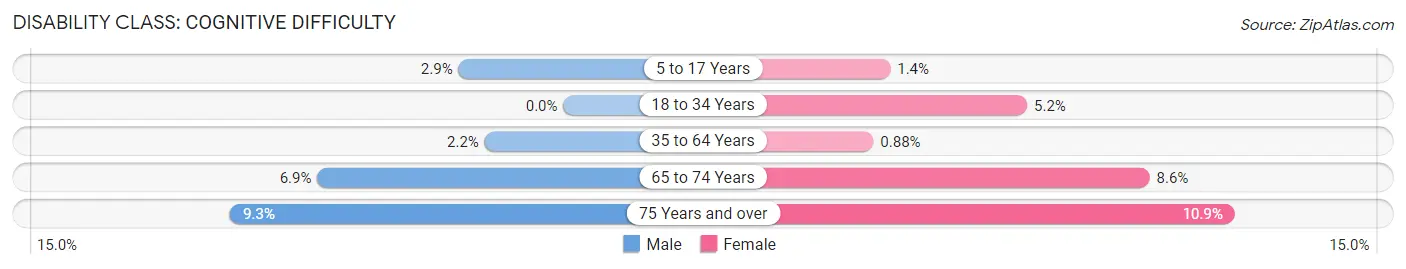
| Age Bracket | Male | Female |
| 5 to 17 Years | 29 (2.9%) | 15 (1.3%) |
| 18 to 34 Years | 0 (0.0%) | 47 (5.2%) |
| 35 to 64 Years | 40 (2.2%) | 18 (0.9%) |
| 65 to 74 Years | 32 (6.9%) | 39 (8.6%) |
| 75 Years and over | 18 (9.3%) | 36 (10.9%) |
Disability Class: Ambulatory Difficulty
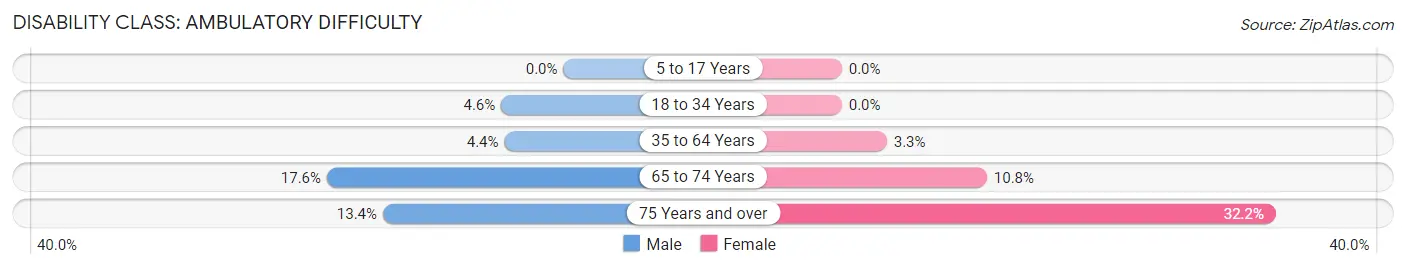
| Age Bracket | Male | Female |
| 5 to 17 Years | 0 (0.0%) | 0 (0.0%) |
| 18 to 34 Years | 44 (4.6%) | 0 (0.0%) |
| 35 to 64 Years | 80 (4.4%) | 68 (3.3%) |
| 65 to 74 Years | 82 (17.6%) | 49 (10.8%) |
| 75 Years and over | 26 (13.4%) | 106 (32.2%) |
Disability Class: Self-Care Difficulty
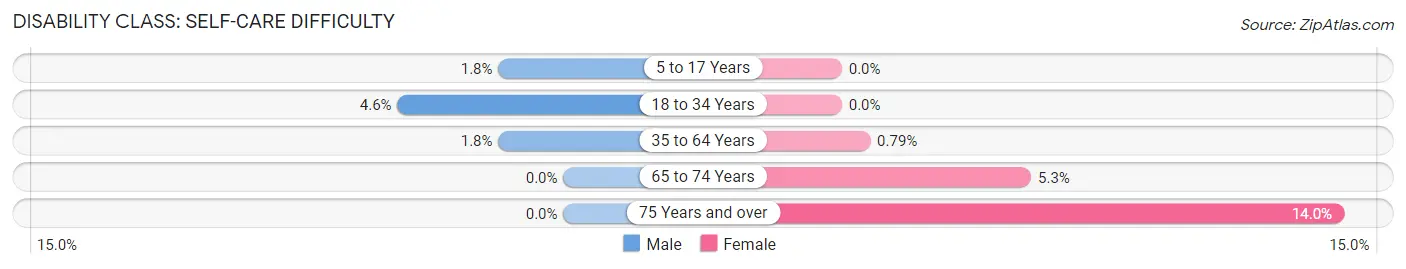
| Age Bracket | Male | Female |
| 5 to 17 Years | 18 (1.8%) | 0 (0.0%) |
| 18 to 34 Years | 44 (4.6%) | 0 (0.0%) |
| 35 to 64 Years | 33 (1.8%) | 16 (0.8%) |
| 65 to 74 Years | 0 (0.0%) | 24 (5.3%) |
| 75 Years and over | 0 (0.0%) | 46 (14.0%) |
Technology Access in Smithville
Computing Device Access in Smithville
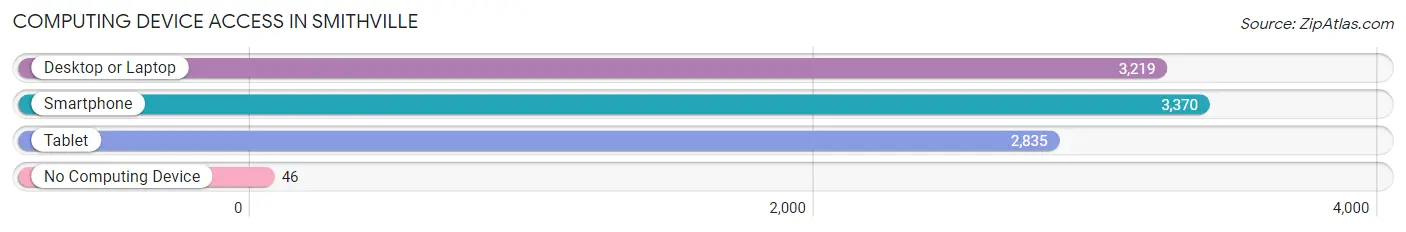
| Device Type | # Households | % Households |
| Desktop or Laptop | 3,219 | 88.5% |
| Smartphone | 3,370 | 92.6% |
| Tablet | 2,835 | 77.9% |
| No Computing Device | 46 | 1.3% |
| Total | 3,638 | 100.0% |
Internet Access in Smithville
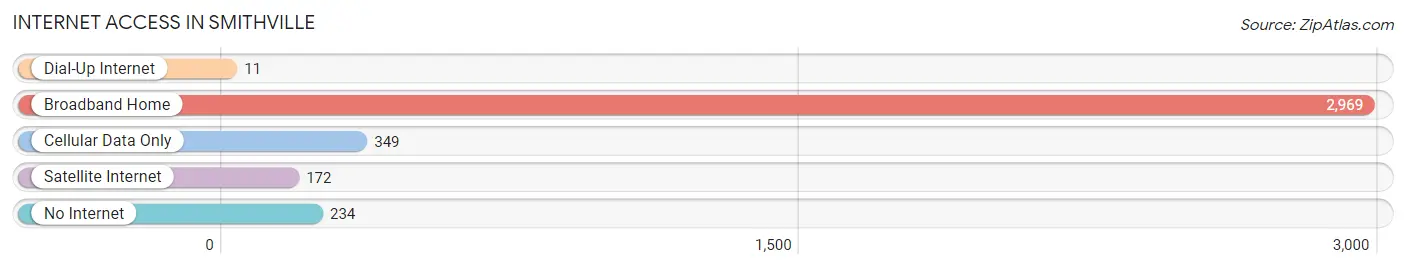
| Internet Type | # Households | % Households |
| Dial-Up Internet | 11 | 0.3% |
| Broadband Home | 2,969 | 81.6% |
| Cellular Data Only | 349 | 9.6% |
| Satellite Internet | 172 | 4.7% |
| No Internet | 234 | 6.4% |
| Total | 3,638 | 100.0% |
Smithville Summary
History
The city of Smithville, Missouri is located in Clay County, approximately 25 miles north of Kansas City. It is a small town with a population of 8,425 as of the 2010 census. The city was founded in 1845 by William Smith, a settler from Kentucky. Smithville was originally known as Smith’s Mill, and was a small farming community. The town was officially incorporated in 1868.
In the late 19th century, Smithville was a thriving community with a population of over 1,000. The town was home to several businesses, including a flour mill, a sawmill, a blacksmith shop, and a general store. The town also had a school, a post office, and a railroad station.
In the early 20th century, Smithville continued to grow and prosper. The town was home to several churches, a bank, a newspaper, and a movie theater. The town also had a library, a hospital, and a fire department.
In the 1950s, Smithville began to experience a decline in population as people moved away to larger cities. The town’s economy suffered as businesses closed and jobs were lost. In the 1970s, Smithville began to experience a resurgence as people moved back to the area and new businesses opened.
Geography
Smithville is located in Clay County, Missouri, approximately 25 miles north of Kansas City. The city is situated on the banks of the Little Platte River. The city is surrounded by rolling hills and farmland. The climate in Smithville is humid continental, with hot summers and cold winters.
The city covers an area of 8.2 square miles, with a population density of 1,023 people per square mile. The city is home to several parks, including Smithville Lake, which is a popular destination for fishing, boating, and camping.
Economy
The economy of Smithville is largely based on agriculture and manufacturing. The city is home to several large employers, including Smithville Manufacturing, which produces automotive parts, and Smithville Foods, which produces canned and frozen foods.
Smithville is also home to several small businesses, including restaurants, retail stores, and service providers. The city is also home to several medical facilities, including a hospital and several clinics.
Demographics
As of the 2010 census, the population of Smithville was 8,425. The racial makeup of the city was 87.3% White, 8.2% African American, 0.7% Native American, 0.7% Asian, 0.2% Pacific Islander, and 2.1% from other races. Hispanic or Latino of any race were 3.2% of the population.
The median household income in Smithville was $45,945, and the median family income was $54,945. The per capita income was $21,945. About 8.2% of families and 10.3% of the population were below the poverty line, including 14.2% of those under age 18 and 8.2% of those age 65 or over.
Common Questions
What is Per Capita Income in Smithville?
Per Capita income in Smithville is $36,059.
What is the Median Family Income in Smithville?
Median Family Income in Smithville is $108,383.
What is the Median Household income in Smithville?
Median Household Income in Smithville is $95,122.
What is Income or Wage Gap in Smithville?
Income or Wage Gap in Smithville is 22.2%.
Women in Smithville earn 77.8 cents for every dollar earned by a man.
What is Inequality or Gini Index in Smithville?
Inequality or Gini Index in Smithville is 0.33.
What is the Total Population of Smithville?
Total Population of Smithville is 10,416.
What is the Total Male Population of Smithville?
Total Male Population of Smithville is 4,942.
What is the Total Female Population of Smithville?
Total Female Population of Smithville is 5,474.
What is the Ratio of Males per 100 Females in Smithville?
There are 90.28 Males per 100 Females in Smithville.
What is the Ratio of Females per 100 Males in Smithville?
There are 110.76 Females per 100 Males in Smithville.
What is the Median Population Age in Smithville?
Median Population Age in Smithville is 36.3 Years.
What is the Average Family Size in Smithville
Average Family Size in Smithville is 3.3 People.
What is the Average Household Size in Smithville
Average Household Size in Smithville is 2.8 People.
How Large is the Labor Force in Smithville?
There are 5,250 People in the Labor Forcein in Smithville.
What is the Percentage of People in the Labor Force in Smithville?
66.9% of People are in the Labor Force in Smithville.
What is the Unemployment Rate in Smithville?
Unemployment Rate in Smithville is 0.7%.