Seymour, MO Map & Demographics
Seymour Map
Seymour Overview
$22,508
PER CAPITA INCOME
$52,294
AVG FAMILY INCOME
$50,194
AVG HOUSEHOLD INCOME
11.4%
WAGE / INCOME GAP [ % ]
88.6¢/ $1
WAGE / INCOME GAP [ $ ]
0.35
INEQUALITY / GINI INDEX
1,932
TOTAL POPULATION
954
MALE POPULATION
978
FEMALE POPULATION
97.55
MALES / 100 FEMALES
102.52
FEMALES / 100 MALES
37.7
MEDIAN AGE
2.7
AVG FAMILY SIZE
2.2
AVG HOUSEHOLD SIZE
902
LABOR FORCE [ PEOPLE ]
58.0%
PERCENT IN LABOR FORCE
4.5%
UNEMPLOYMENT RATE
Seymour Zip Codes
Seymour Area Codes
Income in Seymour
Income Overview in Seymour
Per Capita Income in Seymour is $22,508, while median incomes of families and households are $52,294 and $50,194 respectively.
| Characteristic | Number | Measure |
| Per Capita Income | 1,932 | $22,508 |
| Median Family Income | 543 | $52,294 |
| Mean Family Income | 543 | $60,372 |
| Median Household Income | 850 | $50,194 |
| Mean Household Income | 850 | $51,469 |
| Income Deficit | 543 | $0 |
| Wage / Income Gap (%) | 1,932 | 11.45% |
| Wage / Income Gap ($) | 1,932 | 88.55¢ per $1 |
| Gini / Inequality Index | 1,932 | 0.35 |
Earnings by Sex in Seymour
Average Earnings in Seymour are $31,347, $34,091 for men and $30,188 for women, a difference of 11.5%.
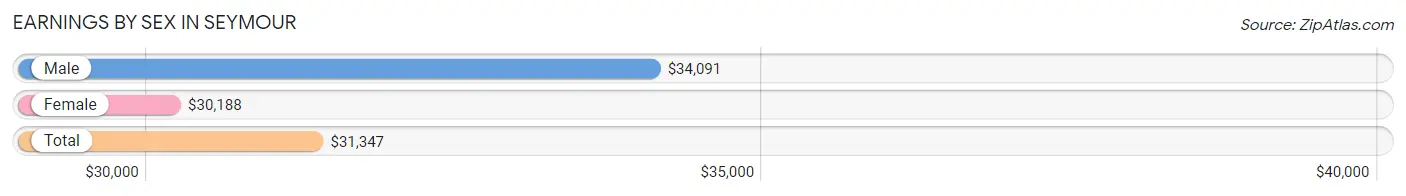
| Sex | Number | Average Earnings |
| Male | 430 (48.0%) | $34,091 |
| Female | 465 (52.0%) | $30,188 |
| Total | 895 (100.0%) | $31,347 |
Earnings by Sex by Income Bracket in Seymour
The most common earnings brackets in Seymour are $30,000 to $34,999 for men (52 | 12.1%) and $30,000 to $34,999 for women (77 | 16.6%).
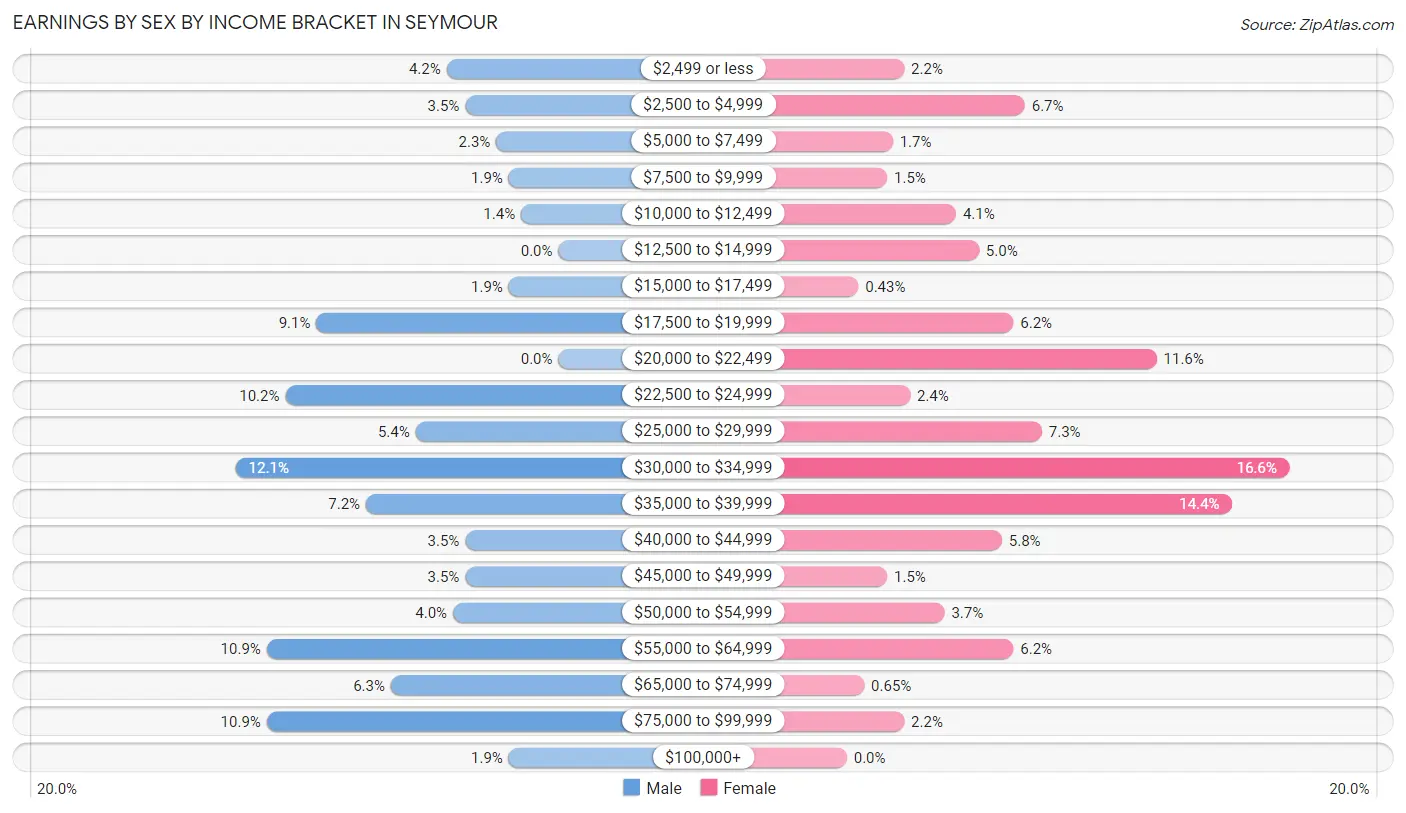
| Income | Male | Female |
| $2,499 or less | 18 (4.2%) | 10 (2.1%) |
| $2,500 to $4,999 | 15 (3.5%) | 31 (6.7%) |
| $5,000 to $7,499 | 10 (2.3%) | 8 (1.7%) |
| $7,500 to $9,999 | 8 (1.9%) | 7 (1.5%) |
| $10,000 to $12,499 | 6 (1.4%) | 19 (4.1%) |
| $12,500 to $14,999 | 0 (0.0%) | 23 (5.0%) |
| $15,000 to $17,499 | 8 (1.9%) | 2 (0.4%) |
| $17,500 to $19,999 | 39 (9.1%) | 29 (6.2%) |
| $20,000 to $22,499 | 0 (0.0%) | 54 (11.6%) |
| $22,500 to $24,999 | 44 (10.2%) | 11 (2.4%) |
| $25,000 to $29,999 | 23 (5.3%) | 34 (7.3%) |
| $30,000 to $34,999 | 52 (12.1%) | 77 (16.6%) |
| $35,000 to $39,999 | 31 (7.2%) | 67 (14.4%) |
| $40,000 to $44,999 | 15 (3.5%) | 27 (5.8%) |
| $45,000 to $49,999 | 15 (3.5%) | 7 (1.5%) |
| $50,000 to $54,999 | 17 (4.0%) | 17 (3.7%) |
| $55,000 to $64,999 | 47 (10.9%) | 29 (6.2%) |
| $65,000 to $74,999 | 27 (6.3%) | 3 (0.6%) |
| $75,000 to $99,999 | 47 (10.9%) | 10 (2.1%) |
| $100,000+ | 8 (1.9%) | 0 (0.0%) |
| Total | 430 (100.0%) | 465 (100.0%) |
Earnings by Sex by Educational Attainment in Seymour
Average earnings in Seymour are $40,000 for men and $31,354 for women, a difference of 21.6%. Men with an educational attainment of bachelor's degree enjoy the highest average annual earnings of $59,423, while those with college or associate's degree education earn the least with $34,063. Women with an educational attainment of bachelor's degree earn the most with the average annual earnings of $41,111, while those with high school diploma education have the smallest earnings of $30,179.
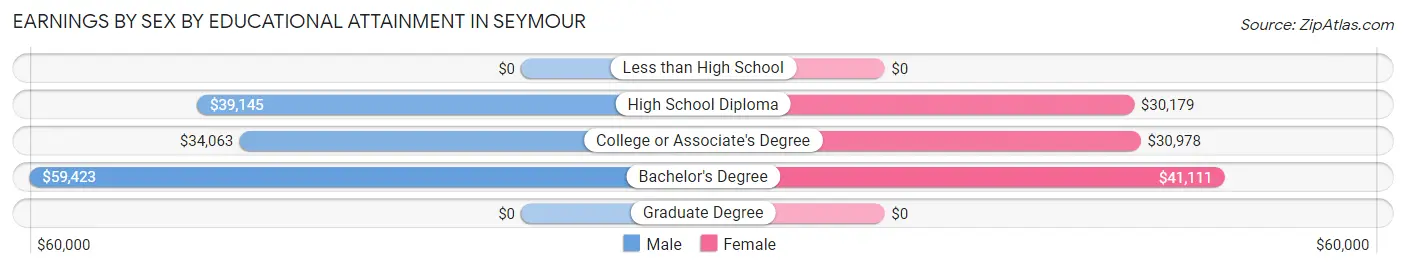
| Educational Attainment | Male Income | Female Income |
| Less than High School | - | - |
| High School Diploma | $39,145 | $30,179 |
| College or Associate's Degree | $34,063 | $30,978 |
| Bachelor's Degree | $59,423 | $41,111 |
| Graduate Degree | - | - |
| Total | $40,000 | $31,354 |
Family Income in Seymour
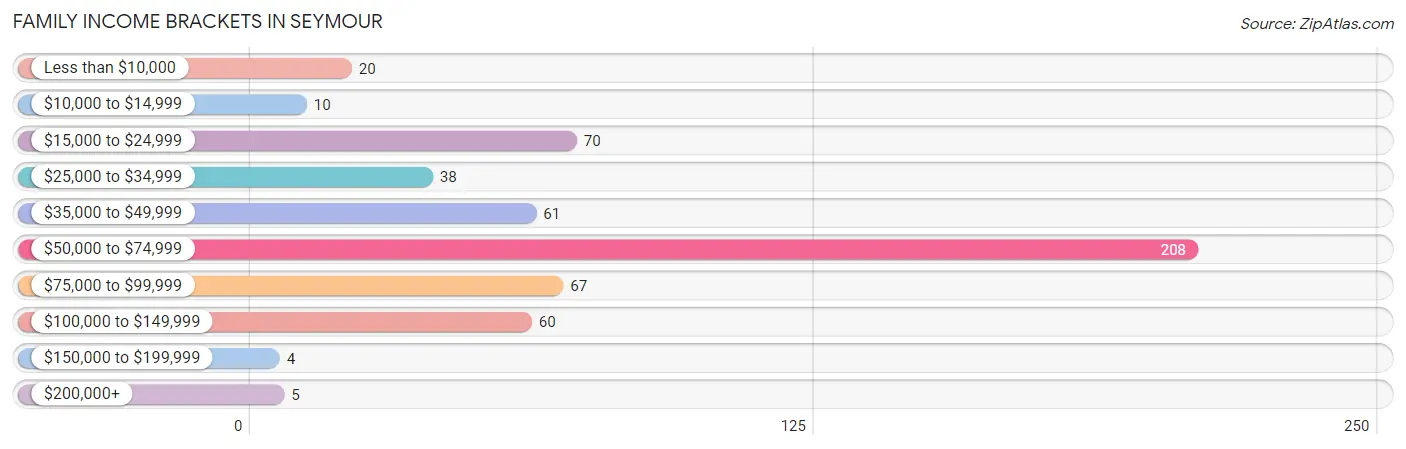
Family Income Brackets in Seymour
According to the Seymour family income data, there are 208 families falling into the $50,000 to $74,999 income range, which is the most common income bracket and makes up 38.3% of all families. Conversely, the $150,000 to $199,999 income bracket is the least frequent group with only 4 families (0.7%) belonging to this category.
| Income Bracket | # Families | % Families |
| Less than $10,000 | 20 | 3.7% |
| $10,000 to $14,999 | 10 | 1.8% |
| $15,000 to $24,999 | 70 | 12.9% |
| $25,000 to $34,999 | 38 | 7.0% |
| $35,000 to $49,999 | 61 | 11.2% |
| $50,000 to $74,999 | 208 | 38.3% |
| $75,000 to $99,999 | 67 | 12.3% |
| $100,000 to $149,999 | 60 | 11.0% |
| $150,000 to $199,999 | 4 | 0.7% |
| $200,000+ | 5 | 0.9% |
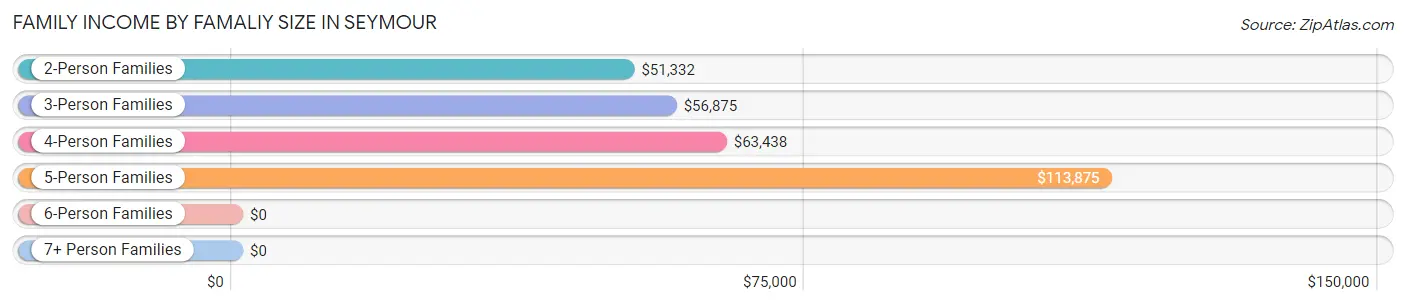
Family Income by Famaliy Size in Seymour
5-person families (35 | 6.5%) account for the highest median family income in Seymour with $113,875 per family, while 2-person families (355 | 65.4%) have the highest median income of $25,666 per family member.
| Income Bracket | # Families | Median Income |
| 2-Person Families | 355 (65.4%) | $51,332 |
| 3-Person Families | 102 (18.8%) | $56,875 |
| 4-Person Families | 35 (6.5%) | $63,438 |
| 5-Person Families | 35 (6.5%) | $113,875 |
| 6-Person Families | 6 (1.1%) | $0 |
| 7+ Person Families | 10 (1.8%) | $0 |
| Total | 543 (100.0%) | $52,294 |
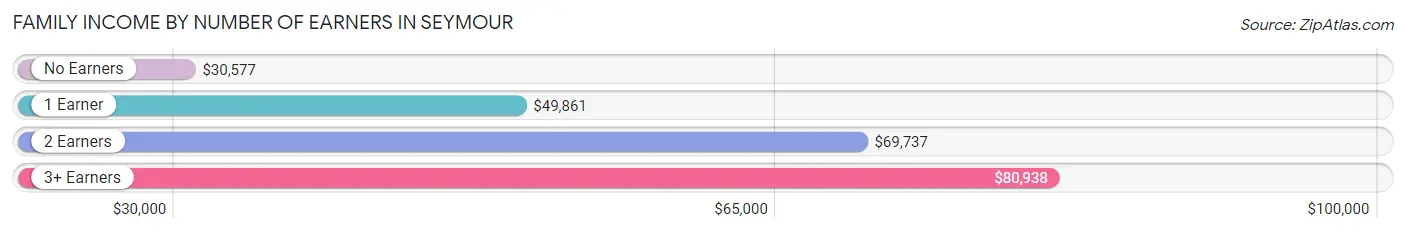
Family Income by Number of Earners in Seymour
The median family income in Seymour is $52,294, with families comprising 3+ earners (19) having the highest median family income of $80,938, while families with no earners (126) have the lowest median family income of $30,577, accounting for 3.5% and 23.2% of families, respectively.
| Number of Earners | # Families | Median Income |
| No Earners | 126 (23.2%) | $30,577 |
| 1 Earner | 170 (31.3%) | $49,861 |
| 2 Earners | 228 (42.0%) | $69,737 |
| 3+ Earners | 19 (3.5%) | $80,938 |
| Total | 543 (100.0%) | $52,294 |
Household Income in Seymour
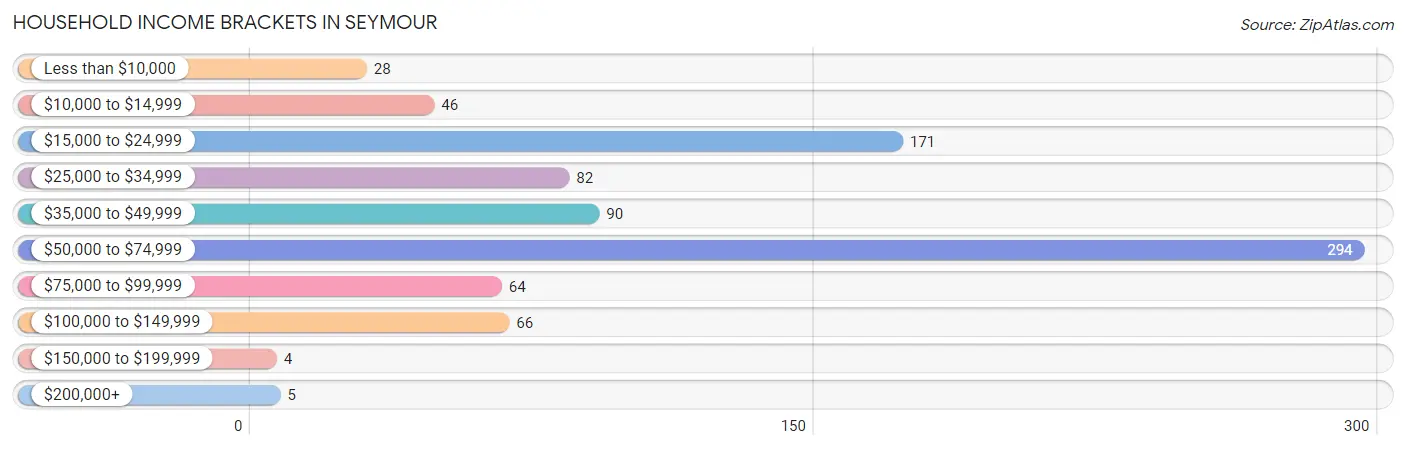
Household Income Brackets in Seymour
With 294 households falling in the category, the $50,000 to $74,999 income range is the most frequent in Seymour, accounting for 34.6% of all households. In contrast, only 4 households (0.5%) fall into the $150,000 to $199,999 income bracket, making it the least populous group.
| Income Bracket | # Households | % Households |
| Less than $10,000 | 28 | 3.3% |
| $10,000 to $14,999 | 46 | 5.4% |
| $15,000 to $24,999 | 171 | 20.1% |
| $25,000 to $34,999 | 82 | 9.6% |
| $35,000 to $49,999 | 90 | 10.6% |
| $50,000 to $74,999 | 294 | 34.6% |
| $75,000 to $99,999 | 64 | 7.5% |
| $100,000 to $149,999 | 66 | 7.8% |
| $150,000 to $199,999 | 4 | 0.5% |
| $200,000+ | 5 | 0.6% |
Household Income by Householder Age in Seymour
The median household income in Seymour is $50,194, with the highest median household income of $67,578 found in the 25 to 44 years age bracket for the primary householder. A total of 244 households (28.7%) fall into this category. Meanwhile, the 65+ years age bracket for the primary householder has the lowest median household income of $30,417, with 207 households (24.3%) in this group.
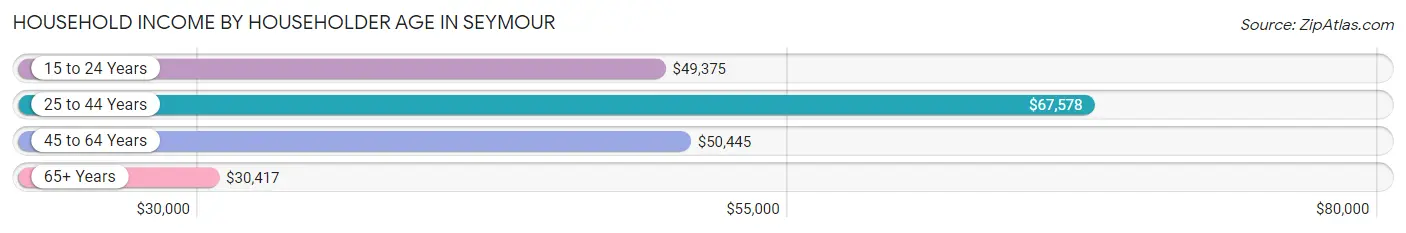
| Income Bracket | # Households | Median Income |
| 15 to 24 Years | 58 (6.8%) | $49,375 |
| 25 to 44 Years | 244 (28.7%) | $67,578 |
| 45 to 64 Years | 341 (40.1%) | $50,445 |
| 65+ Years | 207 (24.3%) | $30,417 |
| Total | 850 (100.0%) | $50,194 |
Poverty in Seymour
Income Below Poverty by Sex and Age in Seymour
With 18.8% poverty level for males and 19.3% for females among the residents of Seymour, under 5 year old males and 16 and 17 year old females are the most vulnerable to poverty, with 58 males (68.2%) and 17 females (58.6%) in their respective age groups living below the poverty level.
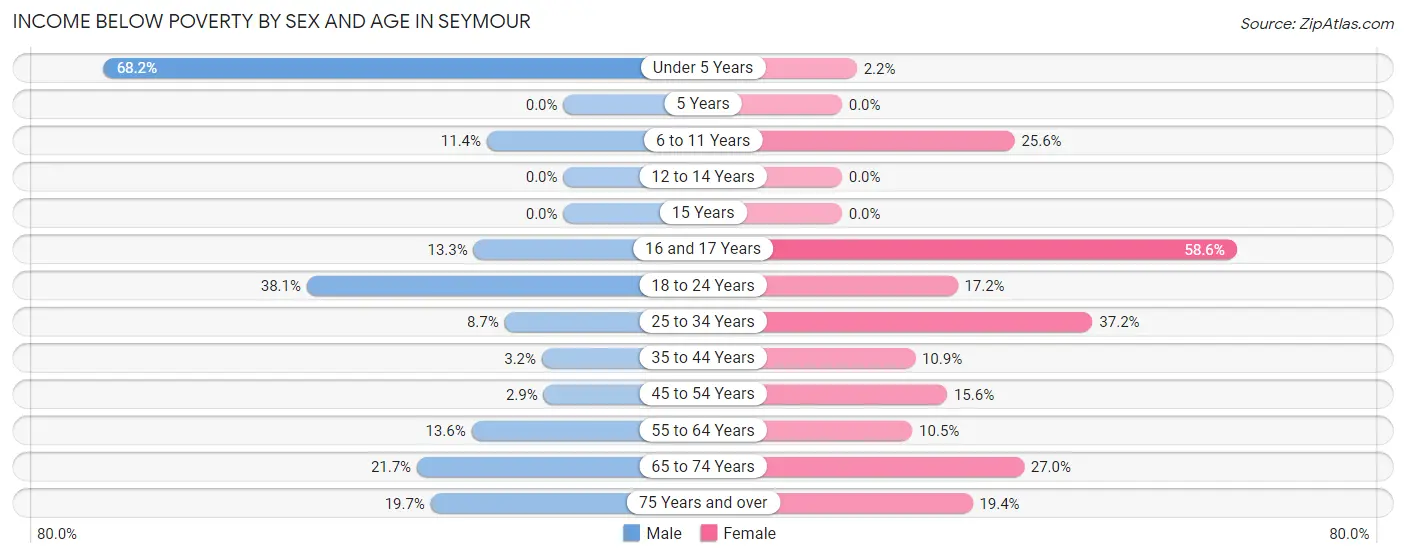
| Age Bracket | Male | Female |
| Under 5 Years | 58 (68.2%) | 1 (2.2%) |
| 5 Years | 0 (0.0%) | 0 (0.0%) |
| 6 to 11 Years | 10 (11.4%) | 10 (25.6%) |
| 12 to 14 Years | 0 (0.0%) | 0 (0.0%) |
| 15 Years | 0 (0.0%) | 0 (0.0%) |
| 16 and 17 Years | 6 (13.3%) | 17 (58.6%) |
| 18 to 24 Years | 40 (38.1%) | 17 (17.2%) |
| 25 to 34 Years | 11 (8.7%) | 48 (37.2%) |
| 35 to 44 Years | 3 (3.2%) | 10 (10.9%) |
| 45 to 54 Years | 3 (2.9%) | 20 (15.6%) |
| 55 to 64 Years | 15 (13.6%) | 14 (10.4%) |
| 65 to 74 Years | 15 (21.7%) | 30 (27.0%) |
| 75 Years and over | 13 (19.7%) | 13 (19.4%) |
| Total | 174 (18.8%) | 180 (19.3%) |
Income Above Poverty by Sex and Age in Seymour
According to the poverty statistics in Seymour, males aged 5 years and females aged 5 years are the age groups that are most secure financially, with 100.0% of males and 100.0% of females in these age groups living above the poverty line.
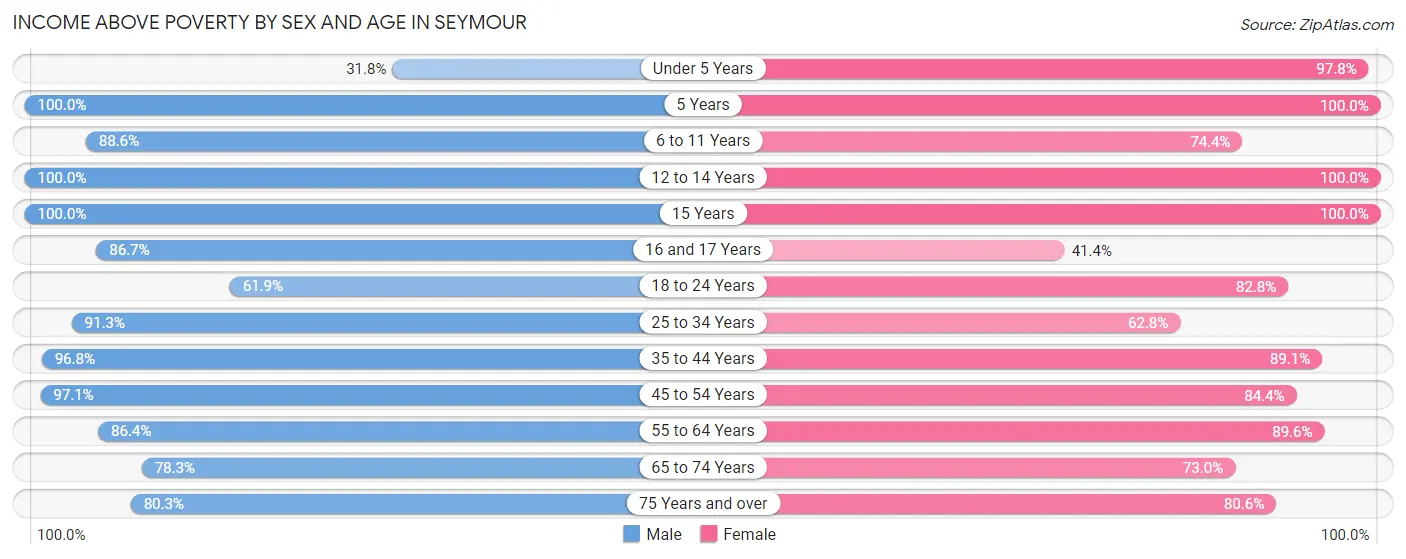
| Age Bracket | Male | Female |
| Under 5 Years | 27 (31.8%) | 44 (97.8%) |
| 5 Years | 4 (100.0%) | 5 (100.0%) |
| 6 to 11 Years | 78 (88.6%) | 29 (74.4%) |
| 12 to 14 Years | 28 (100.0%) | 32 (100.0%) |
| 15 Years | 5 (100.0%) | 23 (100.0%) |
| 16 and 17 Years | 39 (86.7%) | 12 (41.4%) |
| 18 to 24 Years | 65 (61.9%) | 82 (82.8%) |
| 25 to 34 Years | 115 (91.3%) | 81 (62.8%) |
| 35 to 44 Years | 91 (96.8%) | 82 (89.1%) |
| 45 to 54 Years | 99 (97.1%) | 108 (84.4%) |
| 55 to 64 Years | 95 (86.4%) | 120 (89.5%) |
| 65 to 74 Years | 54 (78.3%) | 81 (73.0%) |
| 75 Years and over | 53 (80.3%) | 54 (80.6%) |
| Total | 753 (81.2%) | 753 (80.7%) |
Income Below Poverty Among Married-Couple Families in Seymour
The poverty statistics for married-couple families in Seymour show that 12.9% or 47 of the total 365 families live below the poverty line. Families with 1 or 2 children have the highest poverty rate of 13.8%, comprising of 13 families. On the other hand, families with 5 or more children have the lowest poverty rate of 0.0%, which includes 0 families.
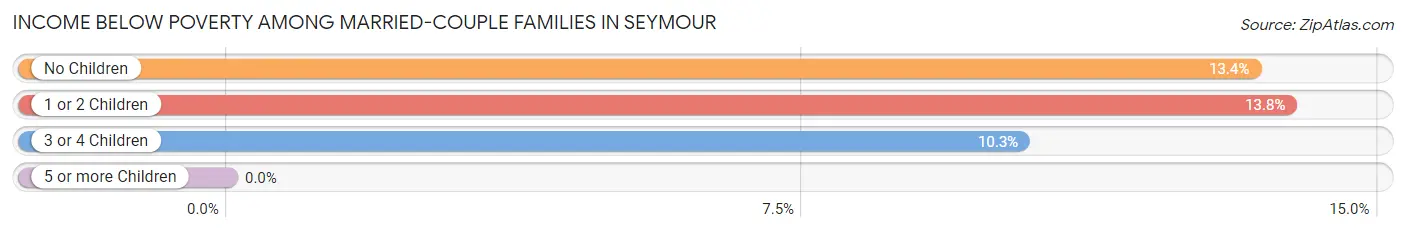
| Children | Above Poverty | Below Poverty |
| No Children | 201 (86.6%) | 31 (13.4%) |
| 1 or 2 Children | 81 (86.2%) | 13 (13.8%) |
| 3 or 4 Children | 26 (89.7%) | 3 (10.3%) |
| 5 or more Children | 10 (100.0%) | 0 (0.0%) |
| Total | 318 (87.1%) | 47 (12.9%) |
Income Below Poverty Among Single-Parent Households in Seymour
According to the poverty data in Seymour, 47.5% or 19 single-father households and 24.6% or 34 single-mother households are living below the poverty line. Among single-father households, those with 1 or 2 children have the highest poverty rate, with 16 households (59.3%) experiencing poverty. Likewise, among single-mother households, those with 3 or 4 children have the highest poverty rate, with 1 households (100.0%) falling below the poverty line.
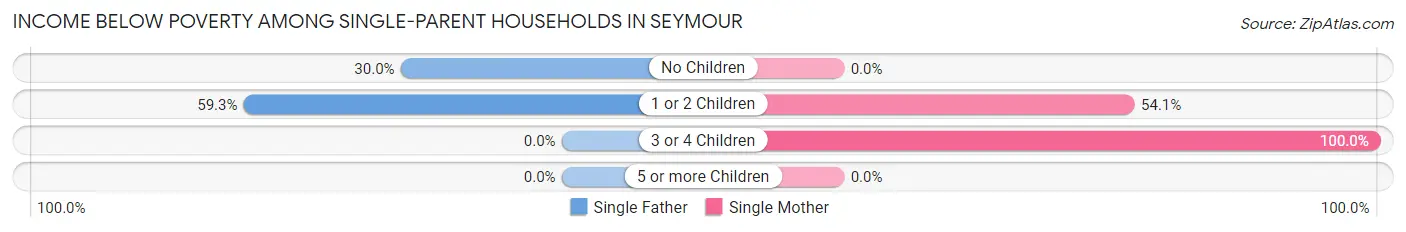
| Children | Single Father | Single Mother |
| No Children | 3 (30.0%) | 0 (0.0%) |
| 1 or 2 Children | 16 (59.3%) | 33 (54.1%) |
| 3 or 4 Children | 0 (0.0%) | 1 (100.0%) |
| 5 or more Children | 0 (0.0%) | 0 (0.0%) |
| Total | 19 (47.5%) | 34 (24.6%) |
Income Below Poverty Among Married-Couple vs Single-Parent Households in Seymour
The poverty data for Seymour shows that 47 of the married-couple family households (12.9%) and 53 of the single-parent households (29.8%) are living below the poverty level. Within the married-couple family households, those with 1 or 2 children have the highest poverty rate, with 13 households (13.8%) falling below the poverty line. Among the single-parent households, those with 1 or 2 children have the highest poverty rate, with 49 household (55.7%) living below poverty.
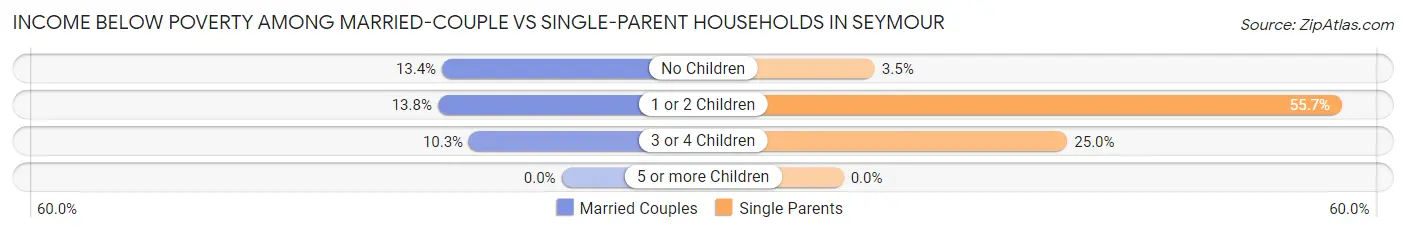
| Children | Married-Couple Families | Single-Parent Households |
| No Children | 31 (13.4%) | 3 (3.5%) |
| 1 or 2 Children | 13 (13.8%) | 49 (55.7%) |
| 3 or 4 Children | 3 (10.3%) | 1 (25.0%) |
| 5 or more Children | 0 (0.0%) | 0 (0.0%) |
| Total | 47 (12.9%) | 53 (29.8%) |
Race in Seymour
The most populous races in Seymour are White / Caucasian (1,760 | 91.1%), Black / African American (72 | 3.7%), and Some other Race (63 | 3.3%).
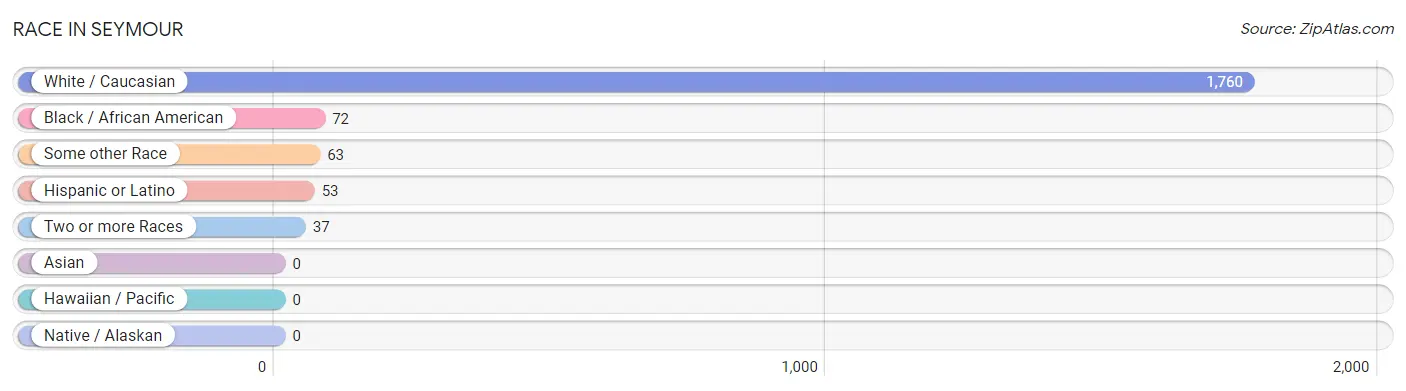
| Race | # Population | % Population |
| Asian | 0 | 0.0% |
| Black / African American | 72 | 3.7% |
| Hawaiian / Pacific | 0 | 0.0% |
| Hispanic or Latino | 53 | 2.7% |
| Native / Alaskan | 0 | 0.0% |
| White / Caucasian | 1,760 | 91.1% |
| Two or more Races | 37 | 1.9% |
| Some other Race | 63 | 3.3% |
| Total | 1,932 | 100.0% |
Ancestry in Seymour
The most populous ancestries reported in Seymour are German (291 | 15.1%), American (227 | 11.7%), English (152 | 7.9%), Irish (122 | 6.3%), and Scottish (71 | 3.7%), together accounting for 44.7% of all Seymour residents.
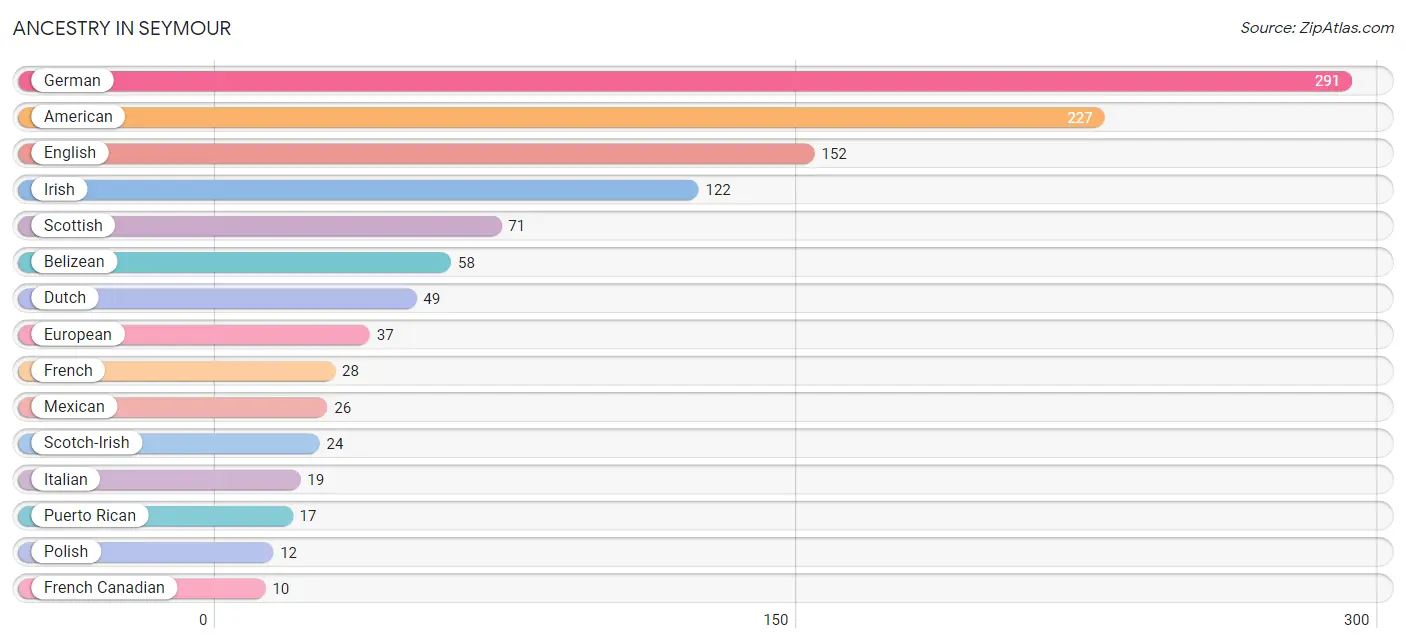
| Ancestry | # Population | % Population |
| American | 227 | 11.7% |
| Belizean | 58 | 3.0% |
| British | 1 | 0.1% |
| Celtic | 8 | 0.4% |
| Cherokee | 1 | 0.1% |
| Dutch | 49 | 2.5% |
| English | 152 | 7.9% |
| European | 37 | 1.9% |
| French | 28 | 1.5% |
| French Canadian | 10 | 0.5% |
| German | 291 | 15.1% |
| Hungarian | 8 | 0.4% |
| Irish | 122 | 6.3% |
| Italian | 19 | 1.0% |
| Mexican | 26 | 1.3% |
| Navajo | 5 | 0.3% |
| Northern European | 1 | 0.1% |
| Norwegian | 6 | 0.3% |
| Polish | 12 | 0.6% |
| Puerto Rican | 17 | 0.9% |
| Russian | 10 | 0.5% |
| Scandinavian | 4 | 0.2% |
| Scotch-Irish | 24 | 1.2% |
| Scottish | 71 | 3.7% |
| Sri Lankan | 6 | 0.3% |
| Swedish | 2 | 0.1% |
| Swiss | 4 | 0.2% |
| Welsh | 3 | 0.2% | View All 28 Rows |
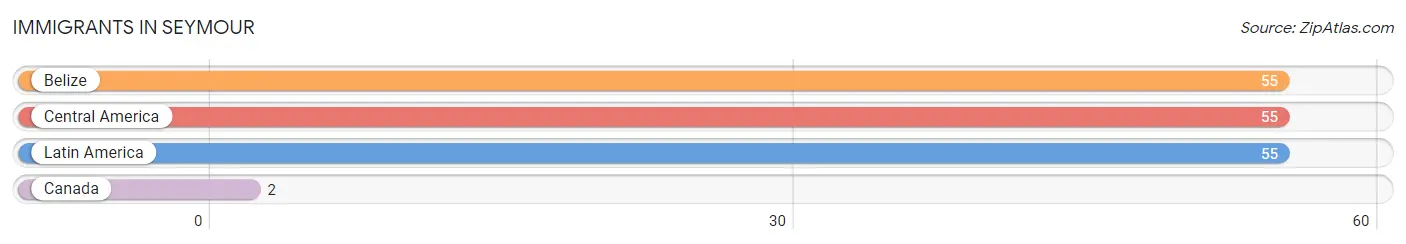
Immigrants in Seymour
The most numerous immigrant groups reported in Seymour came from Belize (55 | 2.9%), Central America (55 | 2.9%), Latin America (55 | 2.9%), and Canada (2 | 0.1%), together accounting for 8.7% of all Seymour residents.
| Immigration Origin | # Population | % Population |
| Belize | 55 | 2.9% |
| Canada | 2 | 0.1% |
| Central America | 55 | 2.9% |
| Latin America | 55 | 2.9% | View All 4 Rows |
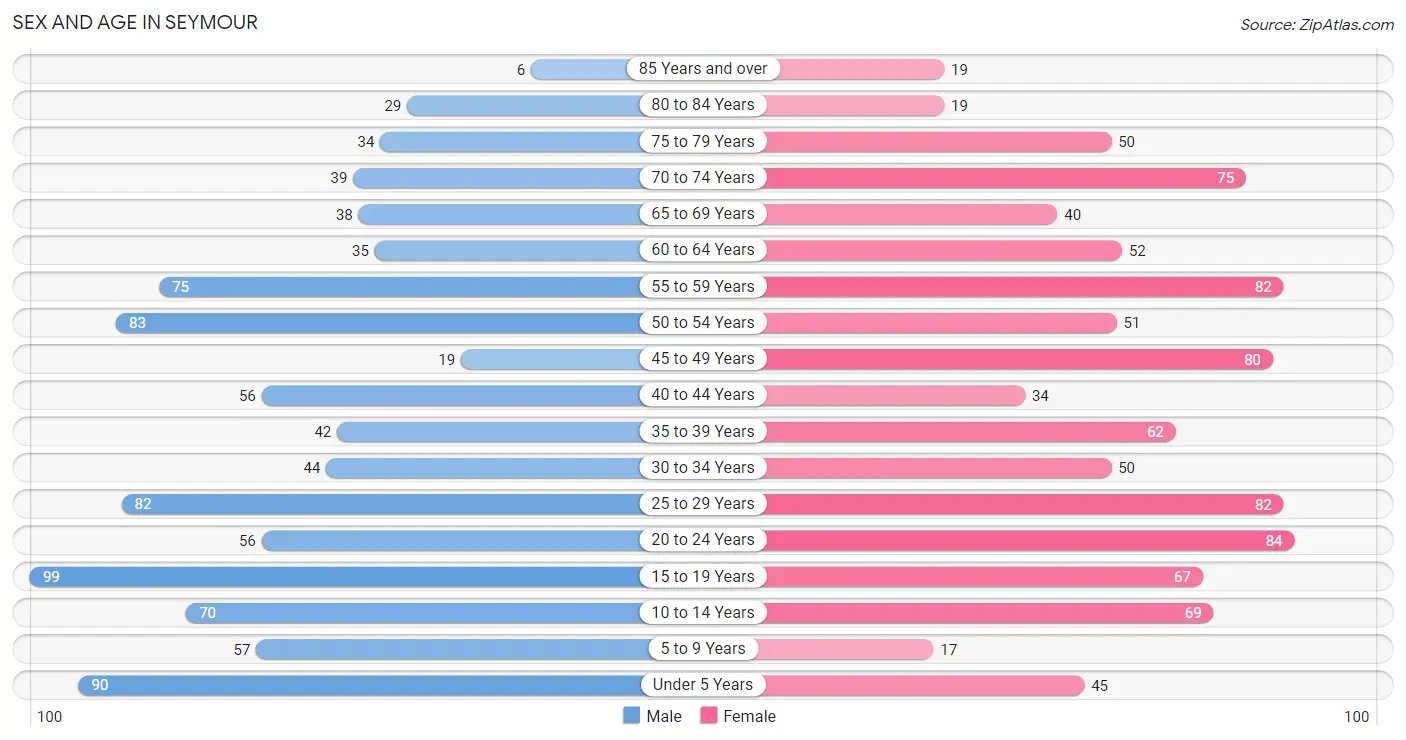
Sex and Age in Seymour
Sex and Age in Seymour
The most populous age groups in Seymour are 15 to 19 Years (99 | 10.4%) for men and 20 to 24 Years (84 | 8.6%) for women.
| Age Bracket | Male | Female |
| Under 5 Years | 90 (9.4%) | 45 (4.6%) |
| 5 to 9 Years | 57 (6.0%) | 17 (1.7%) |
| 10 to 14 Years | 70 (7.3%) | 69 (7.1%) |
| 15 to 19 Years | 99 (10.4%) | 67 (6.9%) |
| 20 to 24 Years | 56 (5.9%) | 84 (8.6%) |
| 25 to 29 Years | 82 (8.6%) | 82 (8.4%) |
| 30 to 34 Years | 44 (4.6%) | 50 (5.1%) |
| 35 to 39 Years | 42 (4.4%) | 62 (6.3%) |
| 40 to 44 Years | 56 (5.9%) | 34 (3.5%) |
| 45 to 49 Years | 19 (2.0%) | 80 (8.2%) |
| 50 to 54 Years | 83 (8.7%) | 51 (5.2%) |
| 55 to 59 Years | 75 (7.9%) | 82 (8.4%) |
| 60 to 64 Years | 35 (3.7%) | 52 (5.3%) |
| 65 to 69 Years | 38 (4.0%) | 40 (4.1%) |
| 70 to 74 Years | 39 (4.1%) | 75 (7.7%) |
| 75 to 79 Years | 34 (3.6%) | 50 (5.1%) |
| 80 to 84 Years | 29 (3.0%) | 19 (1.9%) |
| 85 Years and over | 6 (0.6%) | 19 (1.9%) |
| Total | 954 (100.0%) | 978 (100.0%) |
Families and Households in Seymour
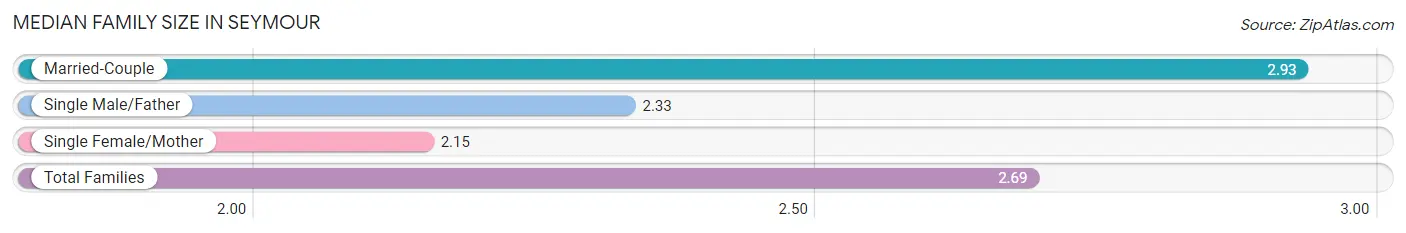
Median Family Size in Seymour
The median family size in Seymour is 2.69 persons per family, with married-couple families (365 | 67.2%) accounting for the largest median family size of 2.93 persons per family. On the other hand, single female/mother families (138 | 25.4%) represent the smallest median family size with 2.15 persons per family.
| Family Type | # Families | Family Size |
| Married-Couple | 365 (67.2%) | 2.93 |
| Single Male/Father | 40 (7.4%) | 2.33 |
| Single Female/Mother | 138 (25.4%) | 2.15 |
| Total Families | 543 (100.0%) | 2.69 |
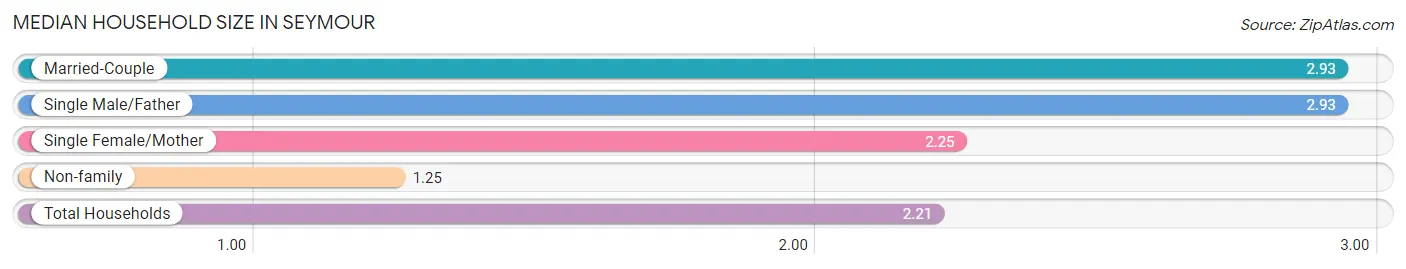
Median Household Size in Seymour
The median household size in Seymour is 2.21 persons per household, with married-couple households (365 | 42.9%) accounting for the largest median household size of 2.93 persons per household. non-family households (307 | 36.1%) represent the smallest median household size with 1.25 persons per household.
| Household Type | # Households | Household Size |
| Married-Couple | 365 (42.9%) | 2.93 |
| Single Male/Father | 40 (4.7%) | 2.93 |
| Single Female/Mother | 138 (16.2%) | 2.25 |
| Non-family | 307 (36.1%) | 1.25 |
| Total Households | 850 (100.0%) | 2.21 |
Household Size by Marriage Status in Seymour
Out of a total of 850 households in Seymour, 543 (63.9%) are family households, while 307 (36.1%) are nonfamily households. The most numerous type of family households are 2-person households, comprising 324, and the most common type of nonfamily households are 1-person households, comprising 258.
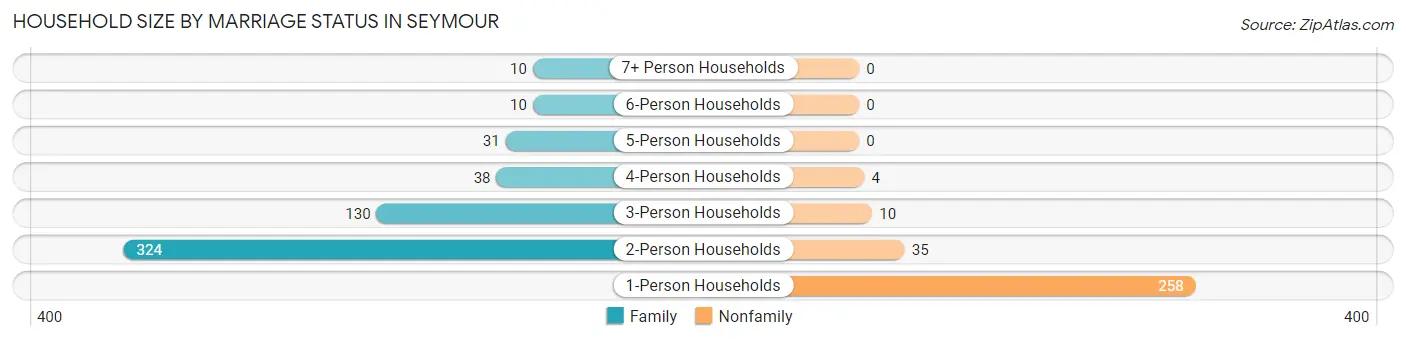
| Household Size | Family Households | Nonfamily Households |
| 1-Person Households | - | 258 (30.3%) |
| 2-Person Households | 324 (38.1%) | 35 (4.1%) |
| 3-Person Households | 130 (15.3%) | 10 (1.2%) |
| 4-Person Households | 38 (4.5%) | 4 (0.5%) |
| 5-Person Households | 31 (3.6%) | 0 (0.0%) |
| 6-Person Households | 10 (1.2%) | 0 (0.0%) |
| 7+ Person Households | 10 (1.2%) | 0 (0.0%) |
| Total | 543 (63.9%) | 307 (36.1%) |
Female Fertility in Seymour
Fertility by Age in Seymour
Average fertility rate in Seymour is 28.0 births per 1,000 women. Women in the age bracket of 20 to 34 years have the highest fertility rate with 60.0 births per 1,000 women. Women in the age bracket of 20 to 34 years acount for 100.0% of all women with births.
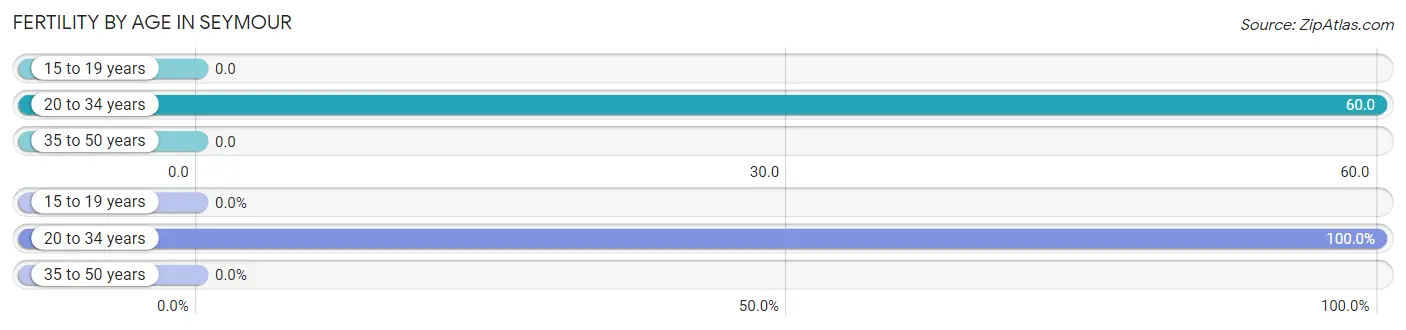
| Age Bracket | Women with Births | Births / 1,000 Women |
| 15 to 19 years | 0 (0.0%) | 0.0 |
| 20 to 34 years | 13 (100.0%) | 60.0 |
| 35 to 50 years | 0 (0.0%) | 0.0 |
| Total | 13 (100.0%) | 28.0 |
Fertility by Age by Marriage Status in Seymour
61.5% of women with births (13) in Seymour are married. The highest percentage of unmarried women with births falls into 20 to 34 years age bracket with 38.5% of them unmarried at the time of birth, while the lowest percentage of unmarried women with births belong to 20 to 34 years age bracket with 38.5% of them unmarried.
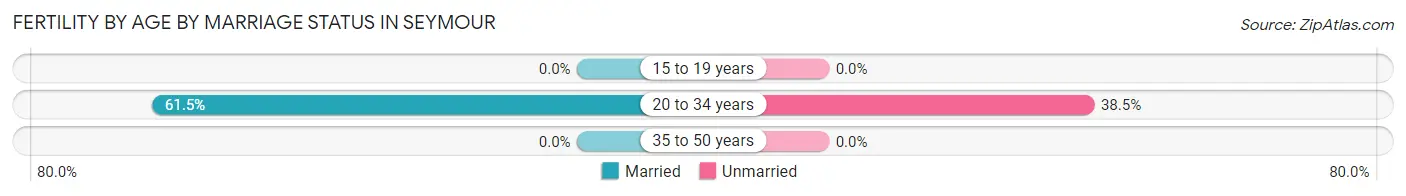
| Age Bracket | Married | Unmarried |
| 15 to 19 years | 0 (0.0%) | 0 (0.0%) |
| 20 to 34 years | 8 (61.5%) | 5 (38.5%) |
| 35 to 50 years | 0 (0.0%) | 0 (0.0%) |
| Total | 8 (61.5%) | 5 (38.5%) |
Fertility by Education in Seymour
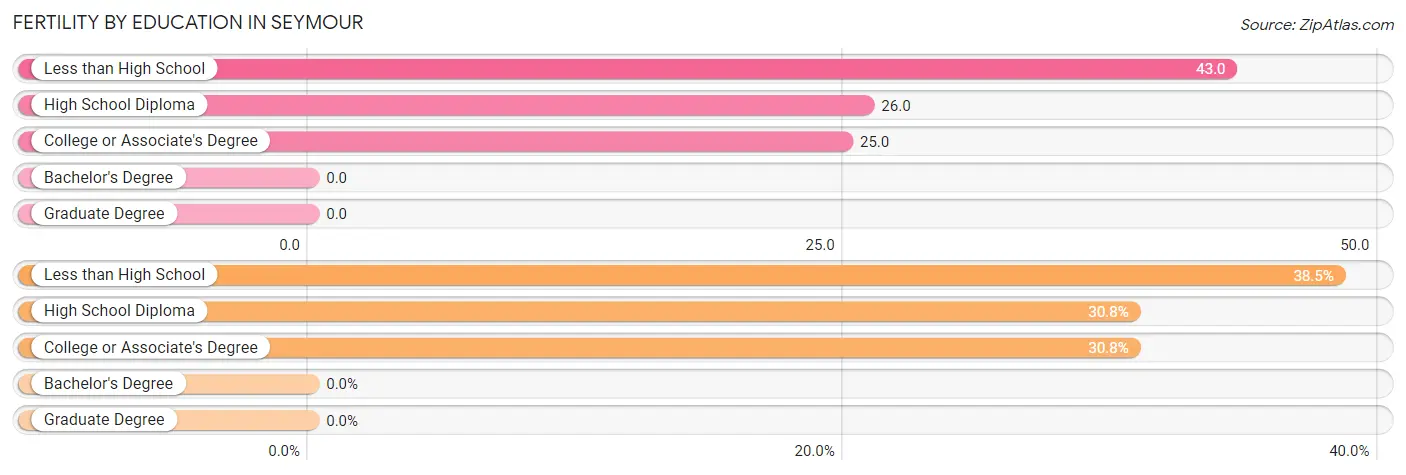
| Educational Attainment | Women with Births | Births / 1,000 Women |
| Less than High School | 5 (38.5%) | 43.0 |
| High School Diploma | 4 (30.8%) | 26.0 |
| College or Associate's Degree | 4 (30.8%) | 25.0 |
| Bachelor's Degree | 0 (0.0%) | 0.0 |
| Graduate Degree | 0 (0.0%) | 0.0 |
| Total | 13 (100.0%) | 28.0 |
Fertility by Education by Marriage Status in Seymour
38.5% of women with births in Seymour are unmarried. Women with the educational attainment of high school diploma are most likely to be married with 100.0% of them married at childbirth, while women with the educational attainment of less than high school are least likely to be married with 100.0% of them unmarried at childbirth.
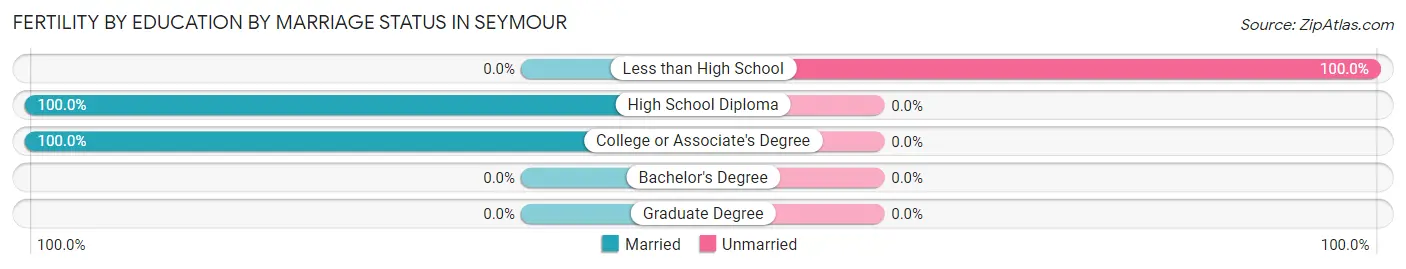
| Educational Attainment | Married | Unmarried |
| Less than High School | 0 (0.0%) | 5 (100.0%) |
| High School Diploma | 4 (100.0%) | 0 (0.0%) |
| College or Associate's Degree | 4 (100.0%) | 0 (0.0%) |
| Bachelor's Degree | 0 (0.0%) | 0 (0.0%) |
| Graduate Degree | 0 (0.0%) | 0 (0.0%) |
| Total | 8 (61.5%) | 5 (38.5%) |
Employment Characteristics in Seymour
Employment by Class of Employer in Seymour
Among the 850 employed individuals in Seymour, private company employees (638 | 75.1%), not-for-profit organizations (91 | 10.7%), and local government employees (44 | 5.2%) make up the most common classes of employment.
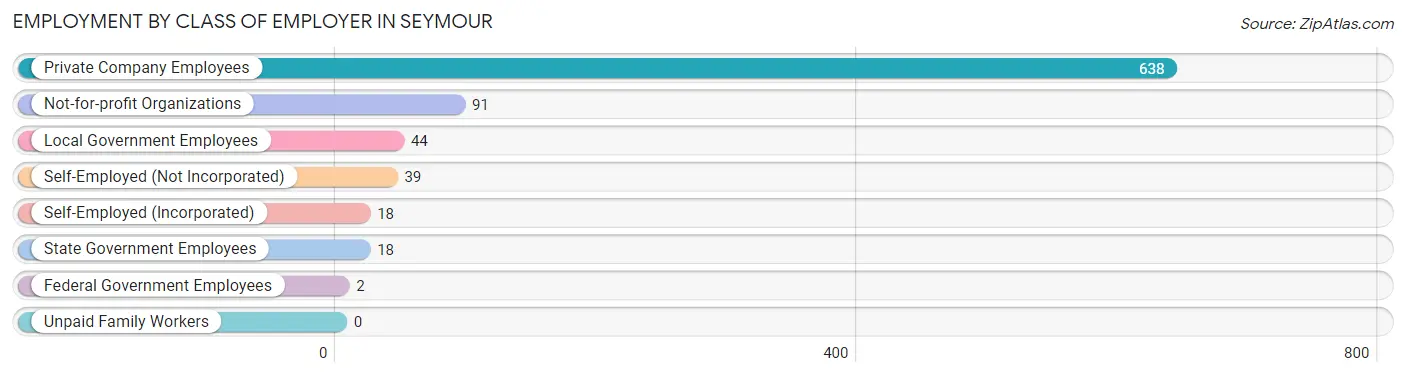
| Employer Class | # Employees | % Employees |
| Private Company Employees | 638 | 75.1% |
| Self-Employed (Incorporated) | 18 | 2.1% |
| Self-Employed (Not Incorporated) | 39 | 4.6% |
| Not-for-profit Organizations | 91 | 10.7% |
| Local Government Employees | 44 | 5.2% |
| State Government Employees | 18 | 2.1% |
| Federal Government Employees | 2 | 0.2% |
| Unpaid Family Workers | 0 | 0.0% |
| Total | 850 | 100.0% |
Employment Status by Age in Seymour
According to the labor force statistics for Seymour, out of the total population over 16 years of age (1,556), 58.0% or 902 individuals are in the labor force, with 4.5% or 41 of them unemployed. The age group with the highest labor force participation rate is 20 to 24 years, with 86.4% or 121 individuals in the labor force. Within the labor force, the 45 to 54 years age range has the highest percentage of unemployed individuals, with 14.0% or 26 of them being unemployed.
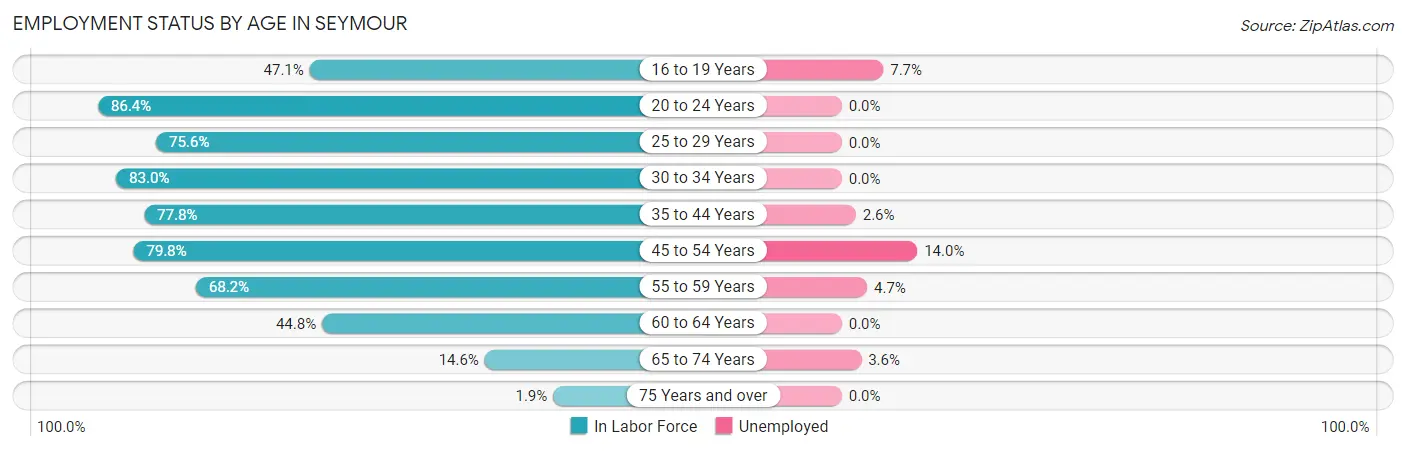
| Age Bracket | In Labor Force | Unemployed |
| 16 to 19 Years | 65 (47.1%) | 5 (7.7%) |
| 20 to 24 Years | 121 (86.4%) | 0 (0.0%) |
| 25 to 29 Years | 124 (75.6%) | 0 (0.0%) |
| 30 to 34 Years | 78 (83.0%) | 0 (0.0%) |
| 35 to 44 Years | 151 (77.8%) | 4 (2.6%) |
| 45 to 54 Years | 186 (79.8%) | 26 (14.0%) |
| 55 to 59 Years | 107 (68.2%) | 5 (4.7%) |
| 60 to 64 Years | 39 (44.8%) | 0 (0.0%) |
| 65 to 74 Years | 28 (14.6%) | 1 (3.6%) |
| 75 Years and over | 3 (1.9%) | 0 (0.0%) |
| Total | 902 (58.0%) | 41 (4.5%) |
Employment Status by Educational Attainment in Seymour
According to labor force statistics for Seymour, 73.7% of individuals (685) out of the total population between 25 and 64 years of age (929) are in the labor force, with 5.1% or 35 of them being unemployed. The group with the highest labor force participation rate are those with the educational attainment of bachelor's degree or higher, with 92.4% or 73 individuals in the labor force. Within the labor force, individuals with college / associate degree education have the highest percentage of unemployment, with 7.1% or 17 of them being unemployed.
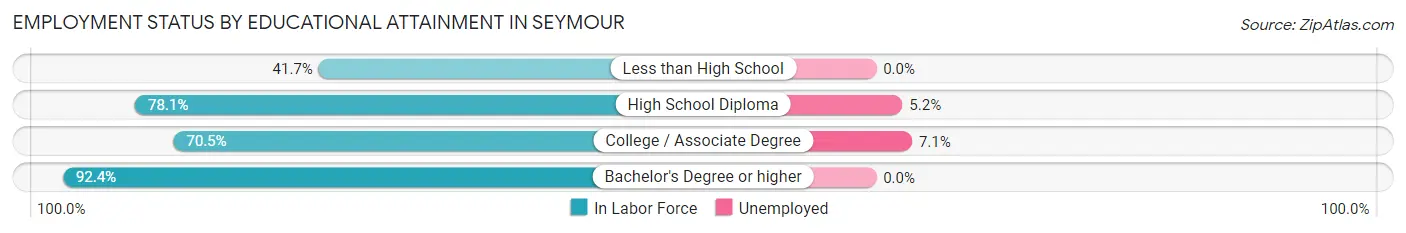
| Educational Attainment | In Labor Force | Unemployed |
| Less than High School | 30 (41.7%) | 0 (0.0%) |
| High School Diploma | 343 (78.1%) | 23 (5.2%) |
| College / Associate Degree | 239 (70.5%) | 24 (7.1%) |
| Bachelor's Degree or higher | 73 (92.4%) | 0 (0.0%) |
| Total | 685 (73.7%) | 47 (5.1%) |
Employment Occupations by Sex in Seymour
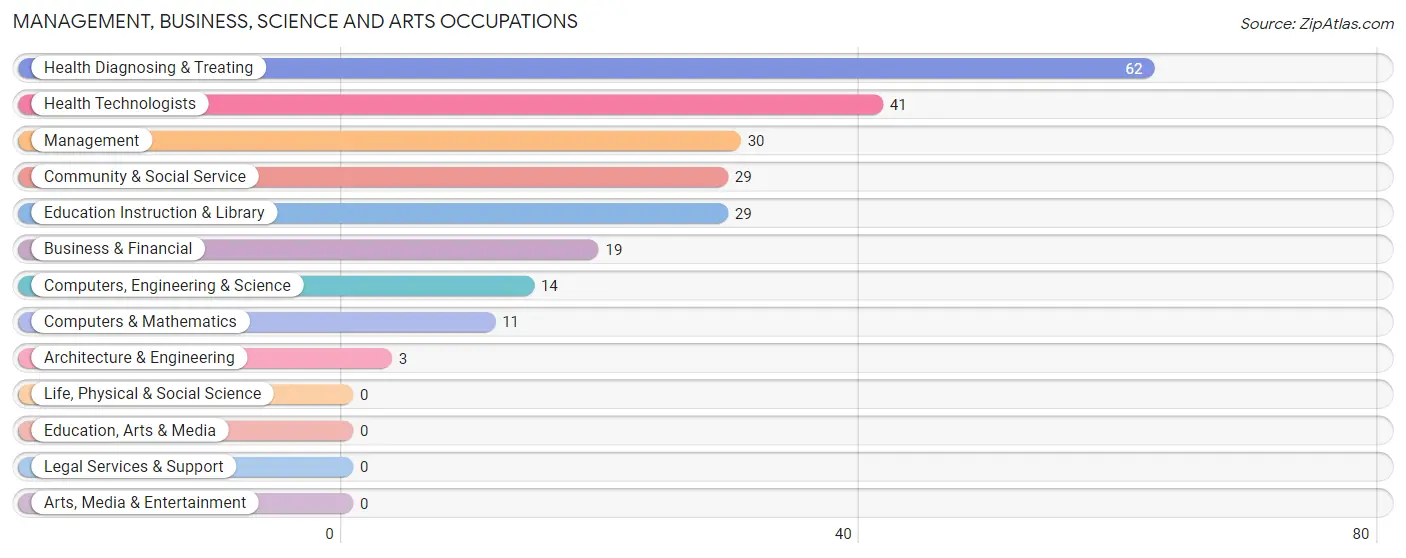
Management, Business, Science and Arts Occupations
The most common Management, Business, Science and Arts occupations in Seymour are Health Diagnosing & Treating (62 | 7.2%), Health Technologists (41 | 4.8%), Management (30 | 3.5%), Community & Social Service (29 | 3.4%), and Education Instruction & Library (29 | 3.4%).
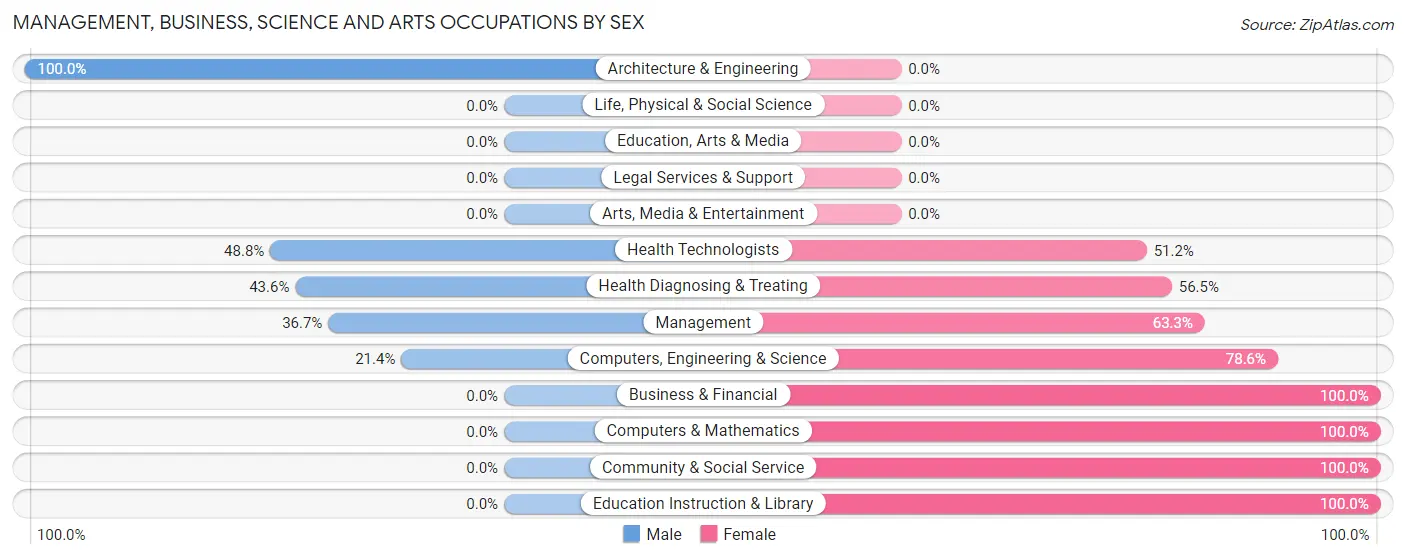
Management, Business, Science and Arts Occupations by Sex
Within the Management, Business, Science and Arts occupations in Seymour, the most male-oriented occupations are Architecture & Engineering (100.0%), Health Technologists (48.8%), and Health Diagnosing & Treating (43.5%), while the most female-oriented occupations are Business & Financial (100.0%), Computers & Mathematics (100.0%), and Community & Social Service (100.0%).
| Occupation | Male | Female |
| Management | 11 (36.7%) | 19 (63.3%) |
| Business & Financial | 0 (0.0%) | 19 (100.0%) |
| Computers, Engineering & Science | 3 (21.4%) | 11 (78.6%) |
| Computers & Mathematics | 0 (0.0%) | 11 (100.0%) |
| Architecture & Engineering | 3 (100.0%) | 0 (0.0%) |
| Life, Physical & Social Science | 0 (0.0%) | 0 (0.0%) |
| Community & Social Service | 0 (0.0%) | 29 (100.0%) |
| Education, Arts & Media | 0 (0.0%) | 0 (0.0%) |
| Legal Services & Support | 0 (0.0%) | 0 (0.0%) |
| Education Instruction & Library | 0 (0.0%) | 29 (100.0%) |
| Arts, Media & Entertainment | 0 (0.0%) | 0 (0.0%) |
| Health Diagnosing & Treating | 27 (43.5%) | 35 (56.5%) |
| Health Technologists | 20 (48.8%) | 21 (51.2%) |
| Total (Category) | 41 (26.6%) | 113 (73.4%) |
| Total (Overall) | 396 (46.0%) | 465 (54.0%) |
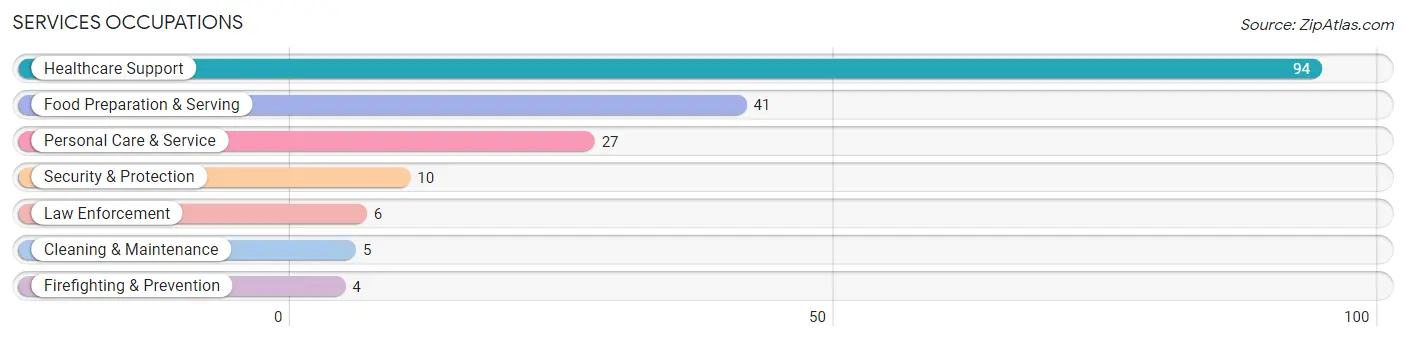
Services Occupations
The most common Services occupations in Seymour are Healthcare Support (94 | 10.9%), Food Preparation & Serving (41 | 4.8%), Personal Care & Service (27 | 3.1%), Security & Protection (10 | 1.2%), and Law Enforcement (6 | 0.7%).
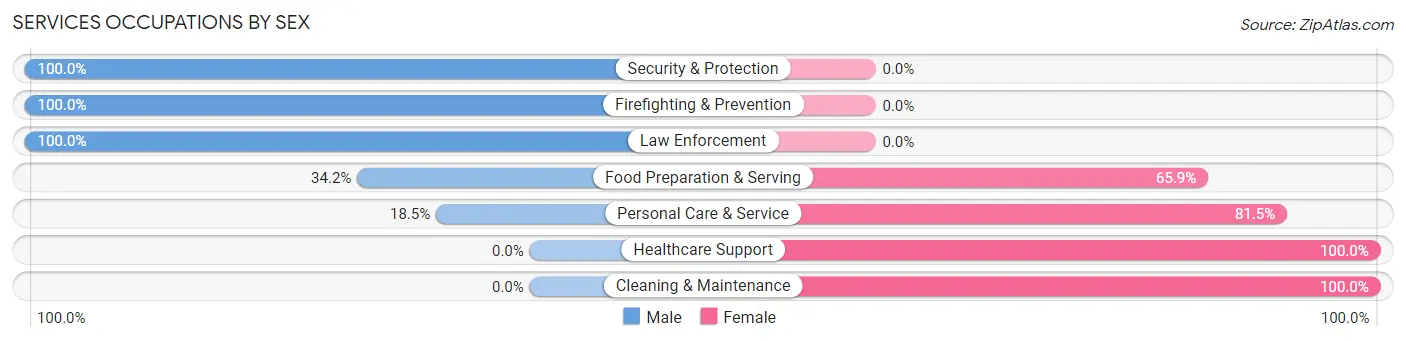
Services Occupations by Sex
Within the Services occupations in Seymour, the most male-oriented occupations are Security & Protection (100.0%), Firefighting & Prevention (100.0%), and Law Enforcement (100.0%), while the most female-oriented occupations are Healthcare Support (100.0%), Cleaning & Maintenance (100.0%), and Personal Care & Service (81.5%).
| Occupation | Male | Female |
| Healthcare Support | 0 (0.0%) | 94 (100.0%) |
| Security & Protection | 10 (100.0%) | 0 (0.0%) |
| Firefighting & Prevention | 4 (100.0%) | 0 (0.0%) |
| Law Enforcement | 6 (100.0%) | 0 (0.0%) |
| Food Preparation & Serving | 14 (34.2%) | 27 (65.8%) |
| Cleaning & Maintenance | 0 (0.0%) | 5 (100.0%) |
| Personal Care & Service | 5 (18.5%) | 22 (81.5%) |
| Total (Category) | 29 (16.4%) | 148 (83.6%) |
| Total (Overall) | 396 (46.0%) | 465 (54.0%) |
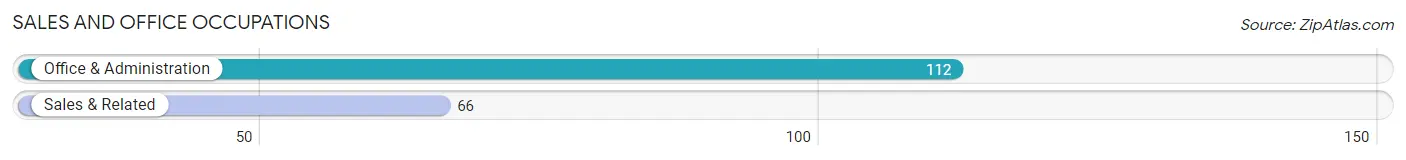
Sales and Office Occupations
The most common Sales and Office occupations in Seymour are Office & Administration (112 | 13.0%), and Sales & Related (66 | 7.7%).
Sales and Office Occupations by Sex
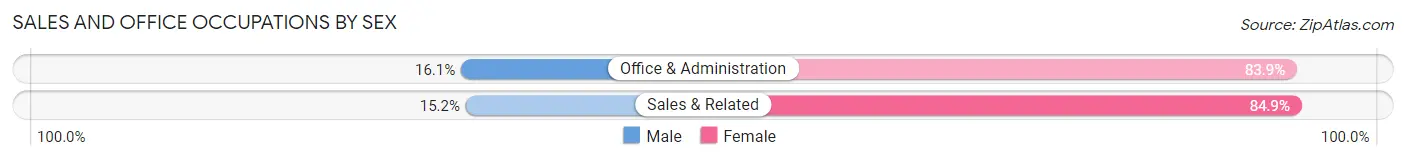
| Occupation | Male | Female |
| Sales & Related | 10 (15.1%) | 56 (84.9%) |
| Office & Administration | 18 (16.1%) | 94 (83.9%) |
| Total (Category) | 28 (15.7%) | 150 (84.3%) |
| Total (Overall) | 396 (46.0%) | 465 (54.0%) |
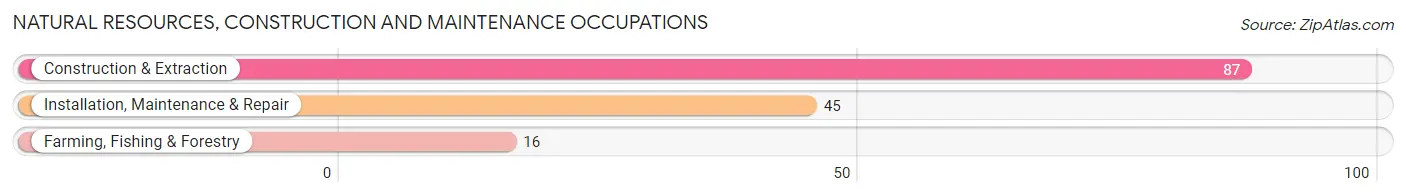
Natural Resources, Construction and Maintenance Occupations
The most common Natural Resources, Construction and Maintenance occupations in Seymour are Construction & Extraction (87 | 10.1%), Installation, Maintenance & Repair (45 | 5.2%), and Farming, Fishing & Forestry (16 | 1.9%).
Natural Resources, Construction and Maintenance Occupations by Sex
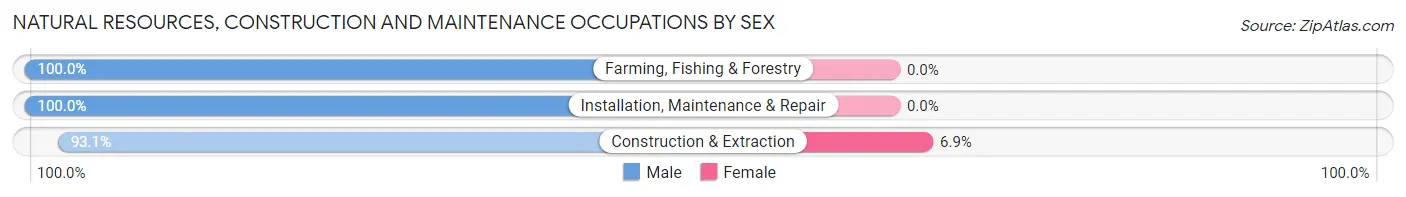
| Occupation | Male | Female |
| Farming, Fishing & Forestry | 16 (100.0%) | 0 (0.0%) |
| Construction & Extraction | 81 (93.1%) | 6 (6.9%) |
| Installation, Maintenance & Repair | 45 (100.0%) | 0 (0.0%) |
| Total (Category) | 142 (96.0%) | 6 (4.1%) |
| Total (Overall) | 396 (46.0%) | 465 (54.0%) |
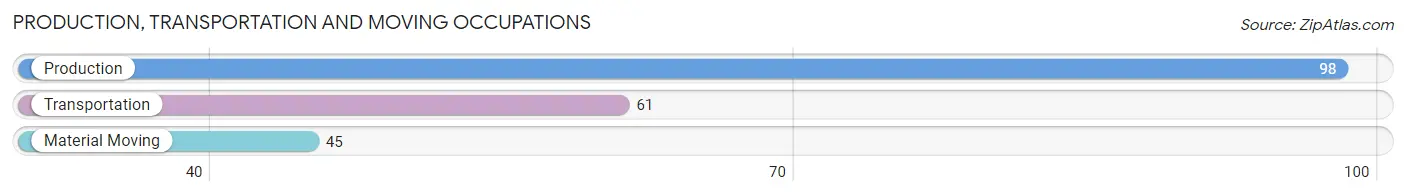
Production, Transportation and Moving Occupations
The most common Production, Transportation and Moving occupations in Seymour are Production (98 | 11.4%), Transportation (61 | 7.1%), and Material Moving (45 | 5.2%).
Production, Transportation and Moving Occupations by Sex
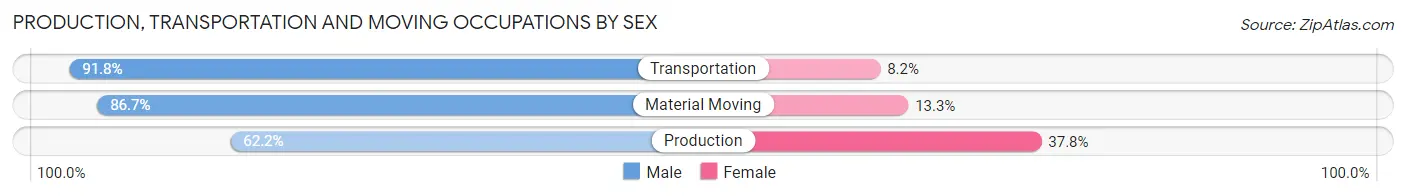
| Occupation | Male | Female |
| Production | 61 (62.2%) | 37 (37.8%) |
| Transportation | 56 (91.8%) | 5 (8.2%) |
| Material Moving | 39 (86.7%) | 6 (13.3%) |
| Total (Category) | 156 (76.5%) | 48 (23.5%) |
| Total (Overall) | 396 (46.0%) | 465 (54.0%) |
Employment Industries by Sex in Seymour
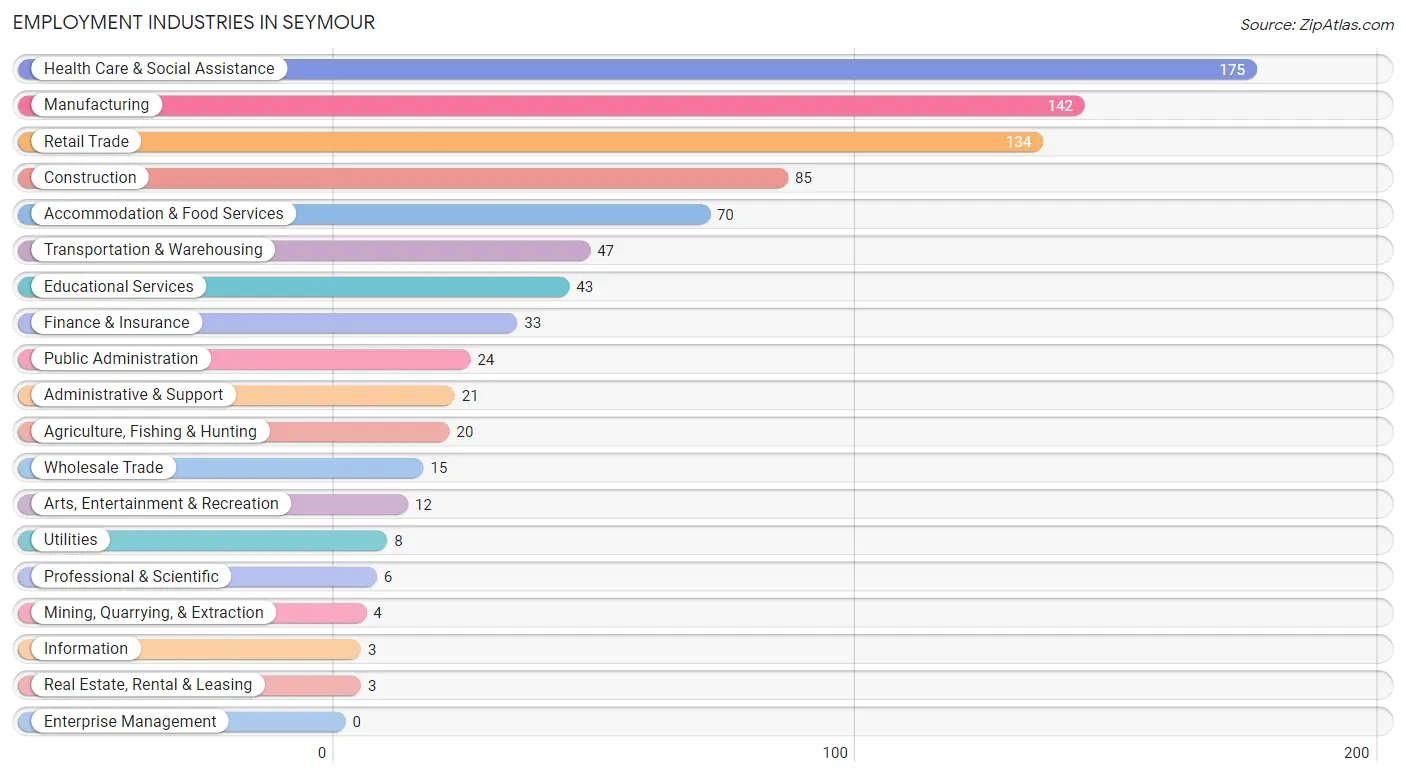
Employment Industries in Seymour
The major employment industries in Seymour include Health Care & Social Assistance (175 | 20.3%), Manufacturing (142 | 16.5%), Retail Trade (134 | 15.6%), Construction (85 | 9.9%), and Accommodation & Food Services (70 | 8.1%).
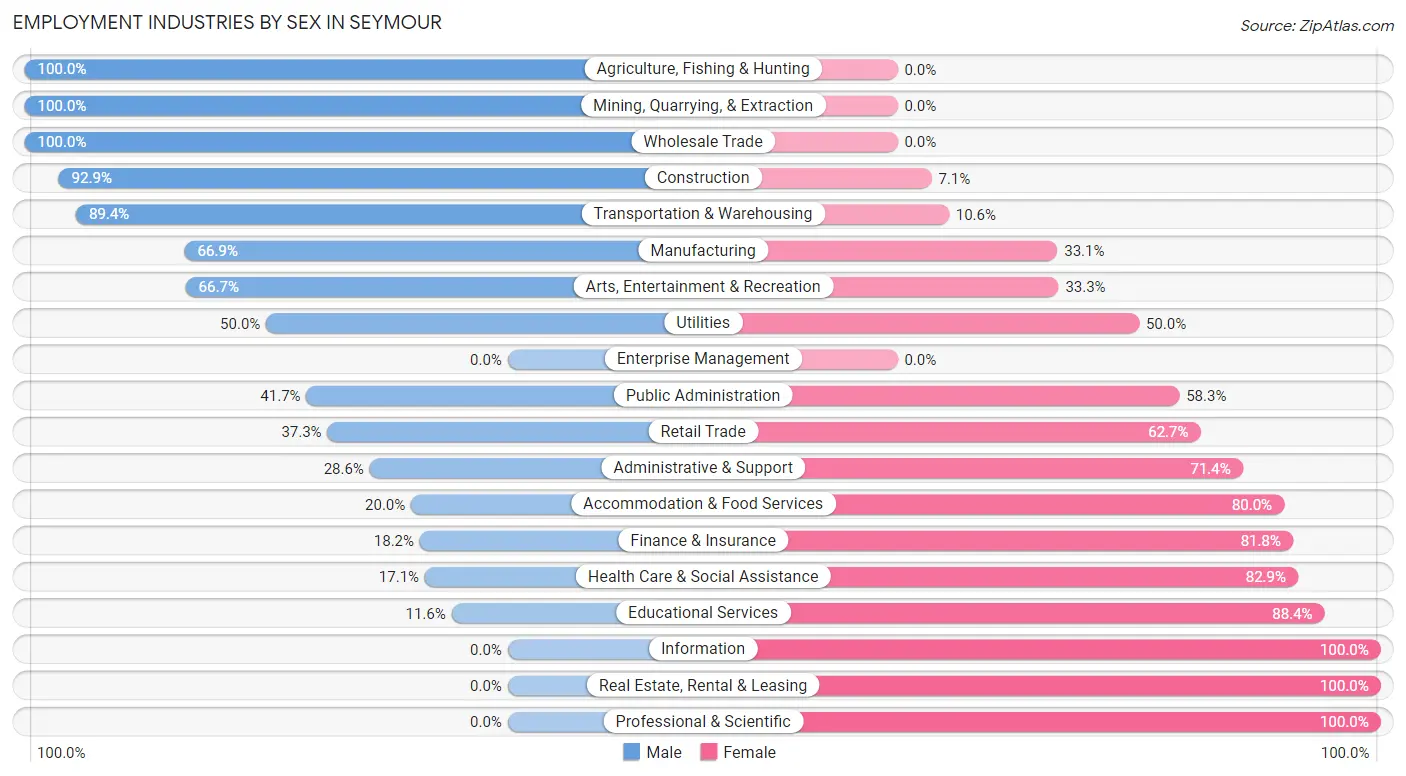
Employment Industries by Sex in Seymour
The Seymour industries that see more men than women are Agriculture, Fishing & Hunting (100.0%), Mining, Quarrying, & Extraction (100.0%), and Wholesale Trade (100.0%), whereas the industries that tend to have a higher number of women are Information (100.0%), Real Estate, Rental & Leasing (100.0%), and Professional & Scientific (100.0%).
| Industry | Male | Female |
| Agriculture, Fishing & Hunting | 20 (100.0%) | 0 (0.0%) |
| Mining, Quarrying, & Extraction | 4 (100.0%) | 0 (0.0%) |
| Construction | 79 (92.9%) | 6 (7.1%) |
| Manufacturing | 95 (66.9%) | 47 (33.1%) |
| Wholesale Trade | 15 (100.0%) | 0 (0.0%) |
| Retail Trade | 50 (37.3%) | 84 (62.7%) |
| Transportation & Warehousing | 42 (89.4%) | 5 (10.6%) |
| Utilities | 4 (50.0%) | 4 (50.0%) |
| Information | 0 (0.0%) | 3 (100.0%) |
| Finance & Insurance | 6 (18.2%) | 27 (81.8%) |
| Real Estate, Rental & Leasing | 0 (0.0%) | 3 (100.0%) |
| Professional & Scientific | 0 (0.0%) | 6 (100.0%) |
| Enterprise Management | 0 (0.0%) | 0 (0.0%) |
| Administrative & Support | 6 (28.6%) | 15 (71.4%) |
| Educational Services | 5 (11.6%) | 38 (88.4%) |
| Health Care & Social Assistance | 30 (17.1%) | 145 (82.9%) |
| Arts, Entertainment & Recreation | 8 (66.7%) | 4 (33.3%) |
| Accommodation & Food Services | 14 (20.0%) | 56 (80.0%) |
| Public Administration | 10 (41.7%) | 14 (58.3%) |
| Total | 396 (46.0%) | 465 (54.0%) |
Education in Seymour
School Enrollment in Seymour
The most common levels of schooling among the 412 students in Seymour are high school (128 | 31.1%), middle school (107 | 26.0%), and elementary school (70 | 17.0%).
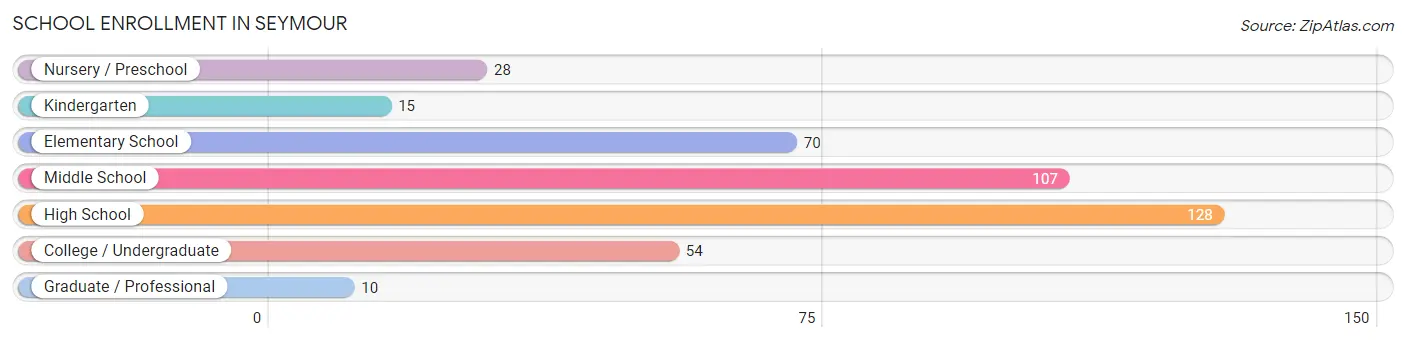
| School Level | # Students | % Students |
| Nursery / Preschool | 28 | 6.8% |
| Kindergarten | 15 | 3.6% |
| Elementary School | 70 | 17.0% |
| Middle School | 107 | 26.0% |
| High School | 128 | 31.1% |
| College / Undergraduate | 54 | 13.1% |
| Graduate / Professional | 10 | 2.4% |
| Total | 412 | 100.0% |
School Enrollment by Age by Funding Source in Seymour
Out of a total of 412 students who are enrolled in schools in Seymour, 62 (15.0%) attend a private institution, while the remaining 350 (85.0%) are enrolled in public schools. The age group of 25 to 34 year olds has the highest likelihood of being enrolled in private schools, with 4 (100.0% in the age bracket) enrolled. Conversely, the age group of 3 to 4 year olds has the lowest likelihood of being enrolled in a private school, with 20 (100.0% in the age bracket) attending a public institution.
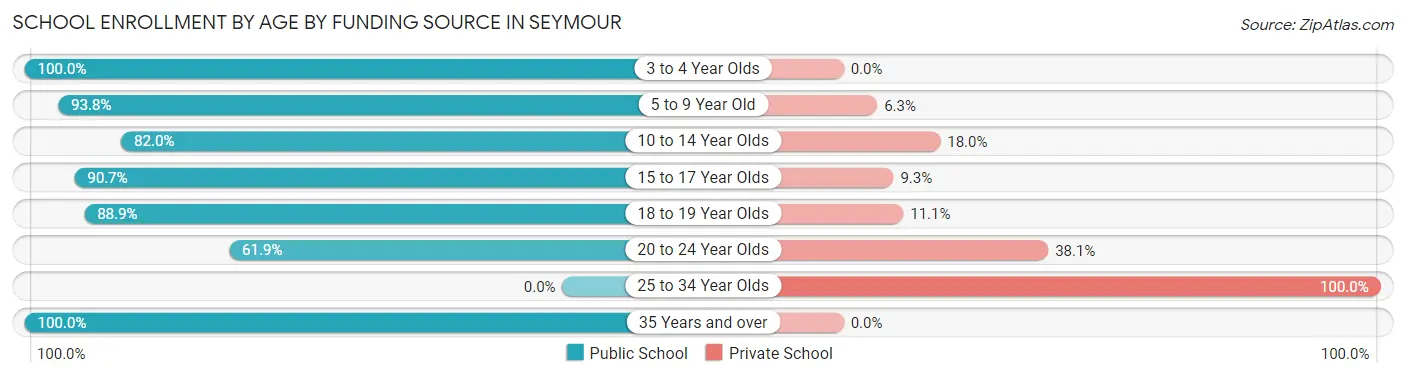
| Age Bracket | Public School | Private School |
| 3 to 4 Year Olds | 20 (100.0%) | 0 (0.0%) |
| 5 to 9 Year Old | 60 (93.8%) | 4 (6.2%) |
| 10 to 14 Year Olds | 114 (82.0%) | 25 (18.0%) |
| 15 to 17 Year Olds | 88 (90.7%) | 9 (9.3%) |
| 18 to 19 Year Olds | 32 (88.9%) | 4 (11.1%) |
| 20 to 24 Year Olds | 26 (61.9%) | 16 (38.1%) |
| 25 to 34 Year Olds | 0 (0.0%) | 4 (100.0%) |
| 35 Years and over | 10 (100.0%) | 0 (0.0%) |
| Total | 350 (85.0%) | 62 (15.0%) |
Educational Attainment by Field of Study in Seymour
Education (28 | 28.9%), business (22 | 22.7%), bio, nature & agricultural (17 | 17.5%), engineering (11 | 11.3%), and social sciences (8 | 8.3%) are the most common fields of study among 97 individuals in Seymour who have obtained a bachelor's degree or higher.
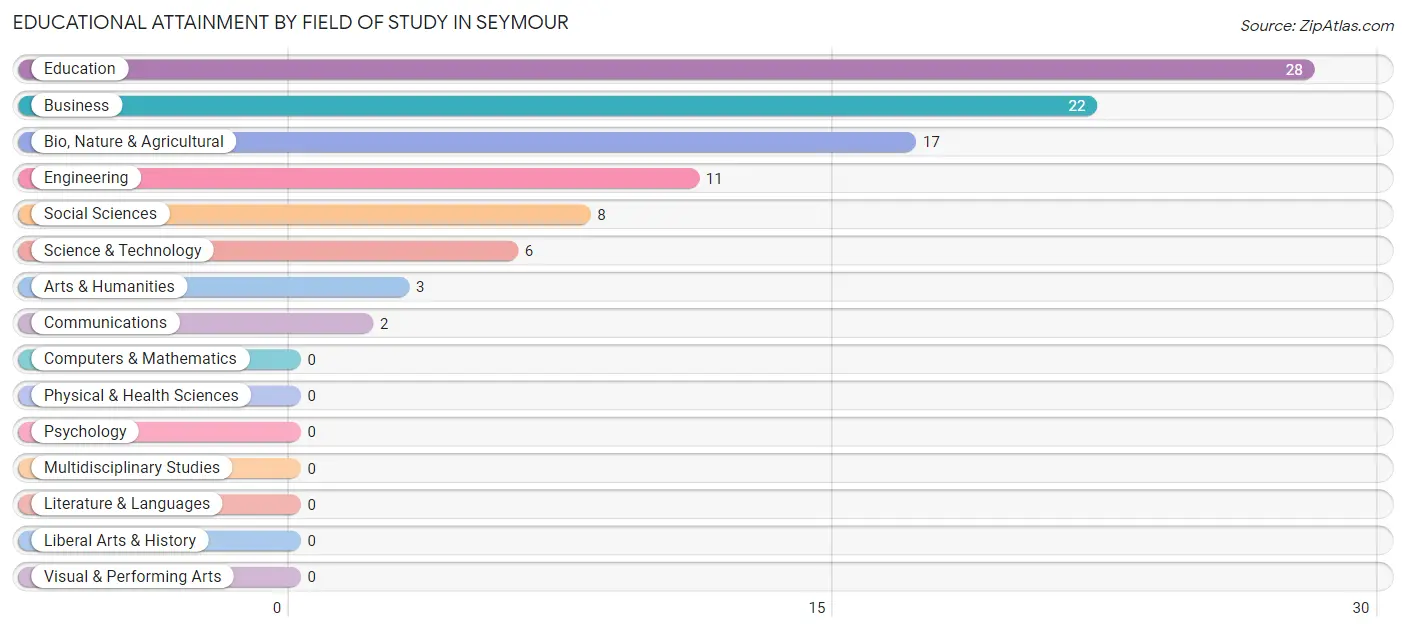
| Field of Study | # Graduates | % Graduates |
| Computers & Mathematics | 0 | 0.0% |
| Bio, Nature & Agricultural | 17 | 17.5% |
| Physical & Health Sciences | 0 | 0.0% |
| Psychology | 0 | 0.0% |
| Social Sciences | 8 | 8.3% |
| Engineering | 11 | 11.3% |
| Multidisciplinary Studies | 0 | 0.0% |
| Science & Technology | 6 | 6.2% |
| Business | 22 | 22.7% |
| Education | 28 | 28.9% |
| Literature & Languages | 0 | 0.0% |
| Liberal Arts & History | 0 | 0.0% |
| Visual & Performing Arts | 0 | 0.0% |
| Communications | 2 | 2.1% |
| Arts & Humanities | 3 | 3.1% |
| Total | 97 | 100.0% |
Transportation & Commute in Seymour
Vehicle Availability by Sex in Seymour
The most prevalent vehicle ownership categories in Seymour are males with 2 vehicles (174, accounting for 43.9%) and females with 2 vehicles (255, making up 38.3%).
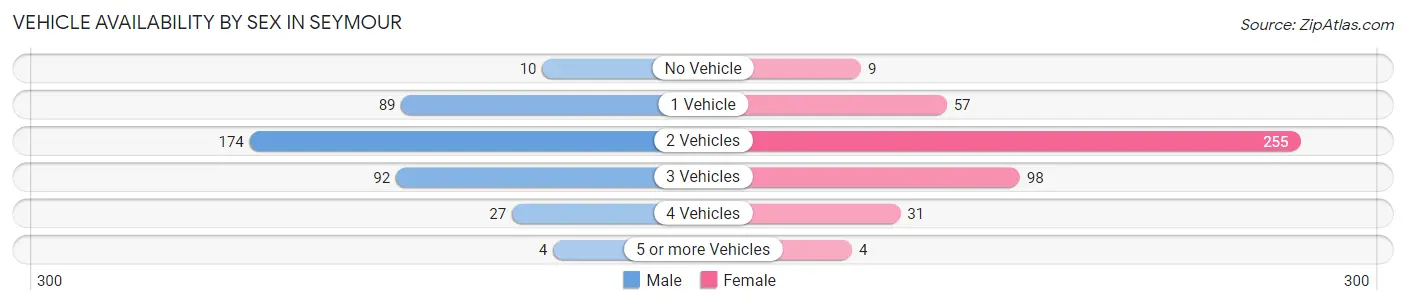
| Vehicles Available | Male | Female |
| No Vehicle | 10 (2.5%) | 9 (2.0%) |
| 1 Vehicle | 89 (22.5%) | 57 (12.6%) |
| 2 Vehicles | 174 (43.9%) | 255 (56.2%) |
| 3 Vehicles | 92 (23.2%) | 98 (21.6%) |
| 4 Vehicles | 27 (6.8%) | 31 (6.8%) |
| 5 or more Vehicles | 4 (1.0%) | 4 (0.9%) |
| Total | 396 (100.0%) | 454 (100.0%) |
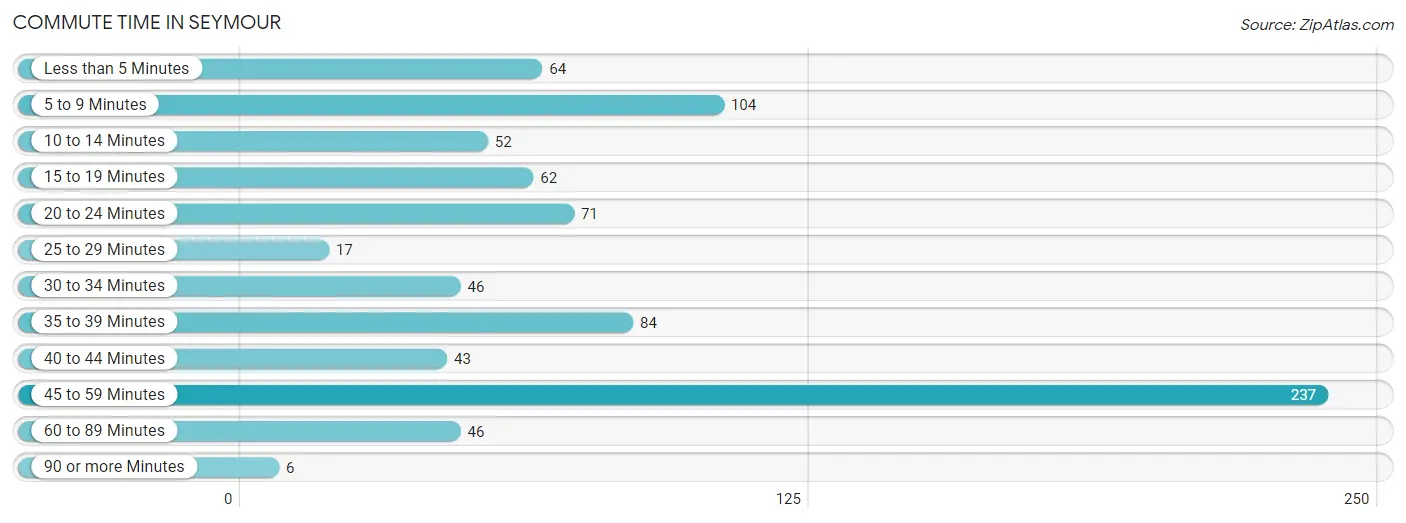
Commute Time in Seymour
The most frequently occuring commute durations in Seymour are 45 to 59 minutes (237 commuters, 28.5%), 5 to 9 minutes (104 commuters, 12.5%), and 35 to 39 minutes (84 commuters, 10.1%).
| Commute Time | # Commuters | % Commuters |
| Less than 5 Minutes | 64 | 7.7% |
| 5 to 9 Minutes | 104 | 12.5% |
| 10 to 14 Minutes | 52 | 6.2% |
| 15 to 19 Minutes | 62 | 7.4% |
| 20 to 24 Minutes | 71 | 8.5% |
| 25 to 29 Minutes | 17 | 2.0% |
| 30 to 34 Minutes | 46 | 5.5% |
| 35 to 39 Minutes | 84 | 10.1% |
| 40 to 44 Minutes | 43 | 5.2% |
| 45 to 59 Minutes | 237 | 28.5% |
| 60 to 89 Minutes | 46 | 5.5% |
| 90 or more Minutes | 6 | 0.7% |
Commute Time by Sex in Seymour
The most common commute times in Seymour are 45 to 59 minutes (88 commuters, 22.6%) for males and 45 to 59 minutes (149 commuters, 33.7%) for females.
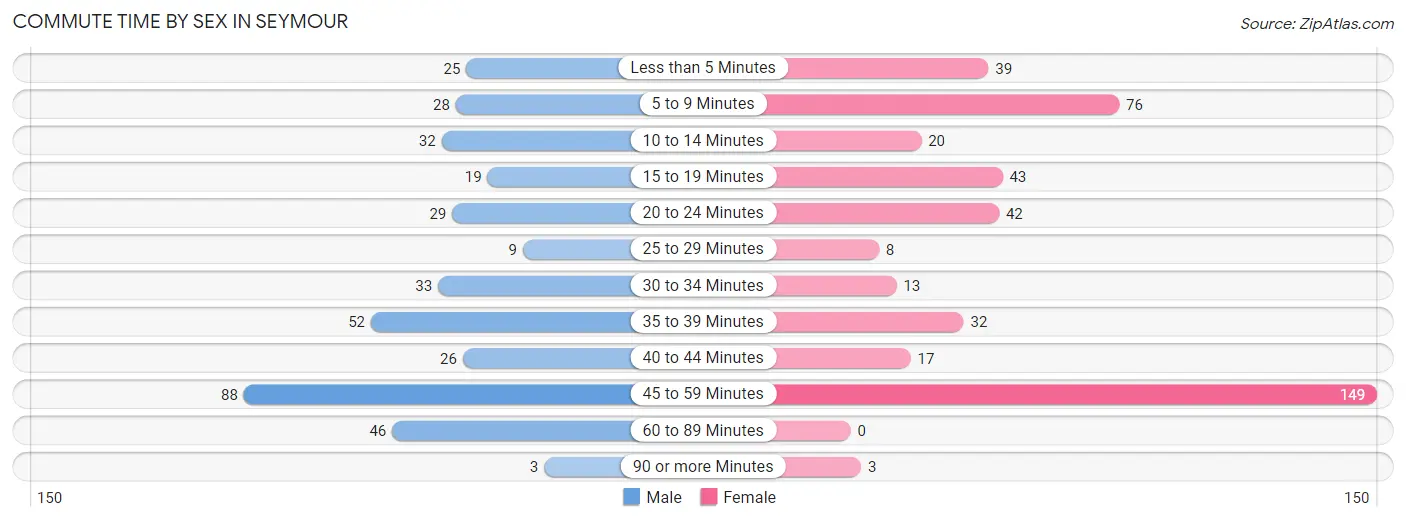
| Commute Time | Male | Female |
| Less than 5 Minutes | 25 (6.4%) | 39 (8.8%) |
| 5 to 9 Minutes | 28 (7.2%) | 76 (17.2%) |
| 10 to 14 Minutes | 32 (8.2%) | 20 (4.5%) |
| 15 to 19 Minutes | 19 (4.9%) | 43 (9.7%) |
| 20 to 24 Minutes | 29 (7.4%) | 42 (9.5%) |
| 25 to 29 Minutes | 9 (2.3%) | 8 (1.8%) |
| 30 to 34 Minutes | 33 (8.5%) | 13 (2.9%) |
| 35 to 39 Minutes | 52 (13.3%) | 32 (7.2%) |
| 40 to 44 Minutes | 26 (6.7%) | 17 (3.8%) |
| 45 to 59 Minutes | 88 (22.6%) | 149 (33.7%) |
| 60 to 89 Minutes | 46 (11.8%) | 0 (0.0%) |
| 90 or more Minutes | 3 (0.8%) | 3 (0.7%) |
Time of Departure to Work by Sex in Seymour
The most frequent times of departure to work in Seymour are 5:30 AM to 5:59 AM (79, 20.3%) for males and 7:00 AM to 7:29 AM (119, 26.9%) for females.
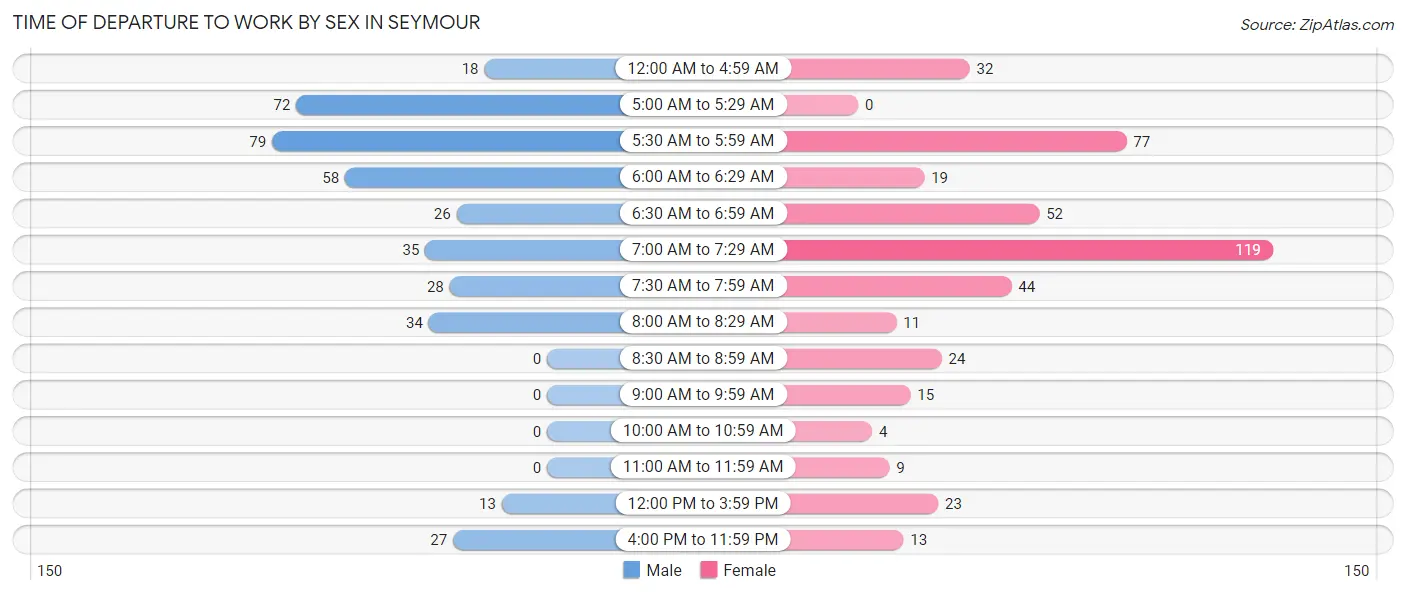
| Time of Departure | Male | Female |
| 12:00 AM to 4:59 AM | 18 (4.6%) | 32 (7.2%) |
| 5:00 AM to 5:29 AM | 72 (18.5%) | 0 (0.0%) |
| 5:30 AM to 5:59 AM | 79 (20.3%) | 77 (17.4%) |
| 6:00 AM to 6:29 AM | 58 (14.9%) | 19 (4.3%) |
| 6:30 AM to 6:59 AM | 26 (6.7%) | 52 (11.8%) |
| 7:00 AM to 7:29 AM | 35 (9.0%) | 119 (26.9%) |
| 7:30 AM to 7:59 AM | 28 (7.2%) | 44 (10.0%) |
| 8:00 AM to 8:29 AM | 34 (8.7%) | 11 (2.5%) |
| 8:30 AM to 8:59 AM | 0 (0.0%) | 24 (5.4%) |
| 9:00 AM to 9:59 AM | 0 (0.0%) | 15 (3.4%) |
| 10:00 AM to 10:59 AM | 0 (0.0%) | 4 (0.9%) |
| 11:00 AM to 11:59 AM | 0 (0.0%) | 9 (2.0%) |
| 12:00 PM to 3:59 PM | 13 (3.3%) | 23 (5.2%) |
| 4:00 PM to 11:59 PM | 27 (6.9%) | 13 (2.9%) |
| Total | 390 (100.0%) | 442 (100.0%) |
Housing Occupancy in Seymour
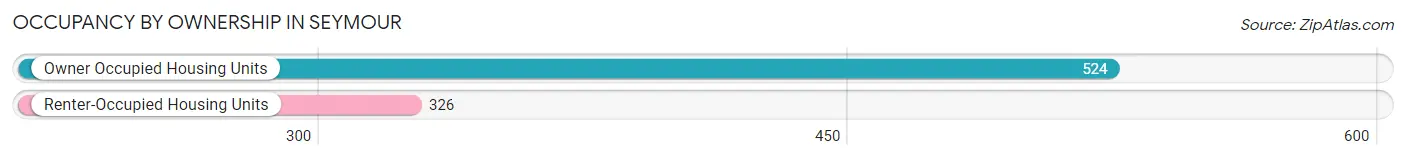
Occupancy by Ownership in Seymour
Of the total 850 dwellings in Seymour, owner-occupied units account for 524 (61.7%), while renter-occupied units make up 326 (38.4%).
| Occupancy | # Housing Units | % Housing Units |
| Owner Occupied Housing Units | 524 | 61.7% |
| Renter-Occupied Housing Units | 326 | 38.4% |
| Total Occupied Housing Units | 850 | 100.0% |
Occupancy by Household Size in Seymour
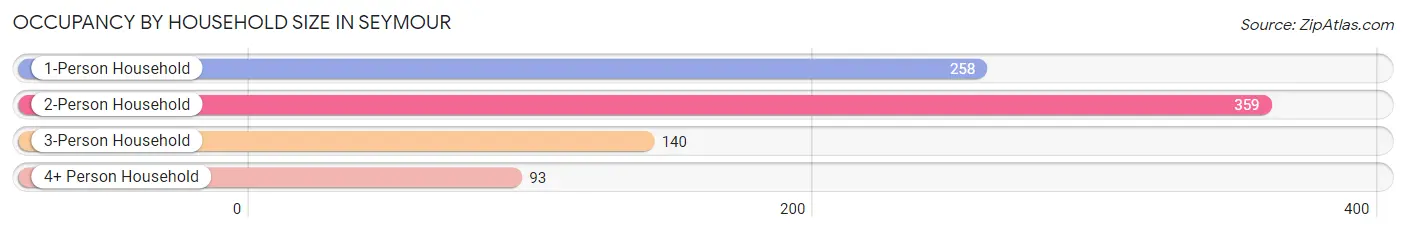
| Household Size | # Housing Units | % Housing Units |
| 1-Person Household | 258 | 30.3% |
| 2-Person Household | 359 | 42.2% |
| 3-Person Household | 140 | 16.5% |
| 4+ Person Household | 93 | 10.9% |
| Total Housing Units | 850 | 100.0% |
Occupancy by Ownership by Household Size in Seymour
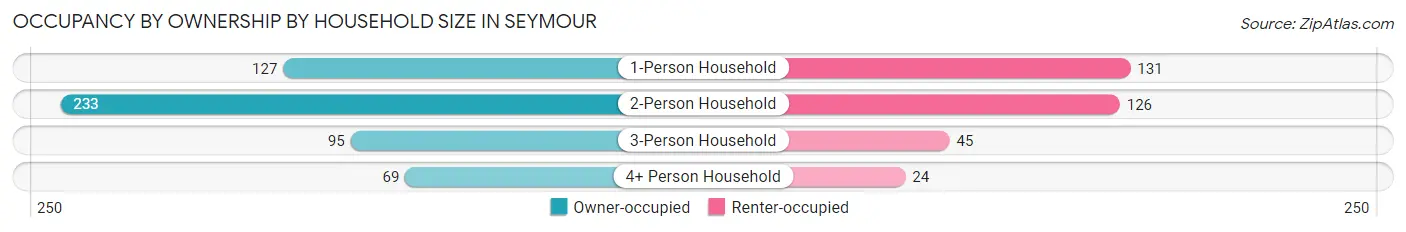
| Household Size | Owner-occupied | Renter-occupied |
| 1-Person Household | 127 (49.2%) | 131 (50.8%) |
| 2-Person Household | 233 (64.9%) | 126 (35.1%) |
| 3-Person Household | 95 (67.9%) | 45 (32.1%) |
| 4+ Person Household | 69 (74.2%) | 24 (25.8%) |
| Total Housing Units | 524 (61.7%) | 326 (38.4%) |
Occupancy by Educational Attainment in Seymour
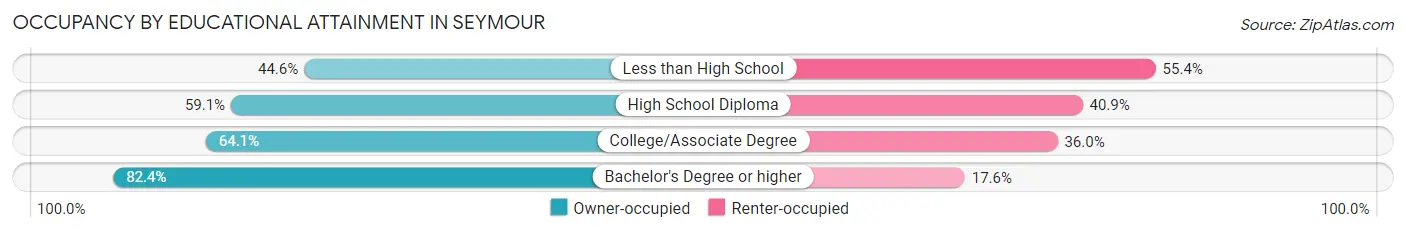
| Household Size | Owner-occupied | Renter-occupied |
| Less than High School | 33 (44.6%) | 41 (55.4%) |
| High School Diploma | 234 (59.1%) | 162 (40.9%) |
| College/Associate Degree | 196 (64.0%) | 110 (35.9%) |
| Bachelor's Degree or higher | 61 (82.4%) | 13 (17.6%) |
Occupancy by Age of Householder in Seymour
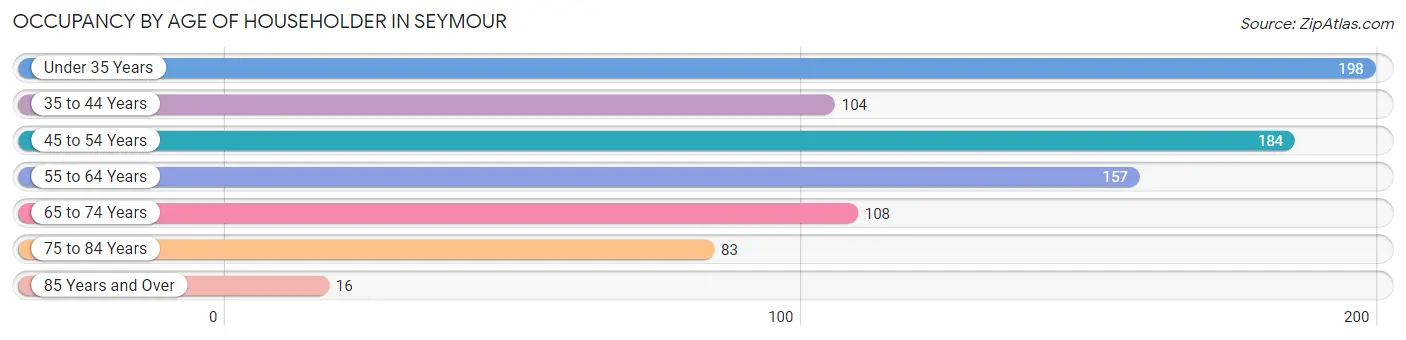
| Age Bracket | # Households | % Households |
| Under 35 Years | 198 | 23.3% |
| 35 to 44 Years | 104 | 12.2% |
| 45 to 54 Years | 184 | 21.6% |
| 55 to 64 Years | 157 | 18.5% |
| 65 to 74 Years | 108 | 12.7% |
| 75 to 84 Years | 83 | 9.8% |
| 85 Years and Over | 16 | 1.9% |
| Total | 850 | 100.0% |
Housing Finances in Seymour
Median Income by Occupancy in Seymour
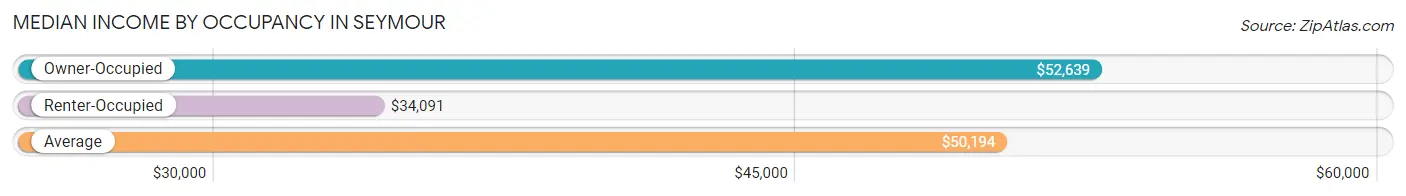
| Occupancy Type | # Households | Median Income |
| Owner-Occupied | 524 (61.7%) | $52,639 |
| Renter-Occupied | 326 (38.4%) | $34,091 |
| Average | 850 (100.0%) | $50,194 |
Occupancy by Householder Income Bracket in Seymour
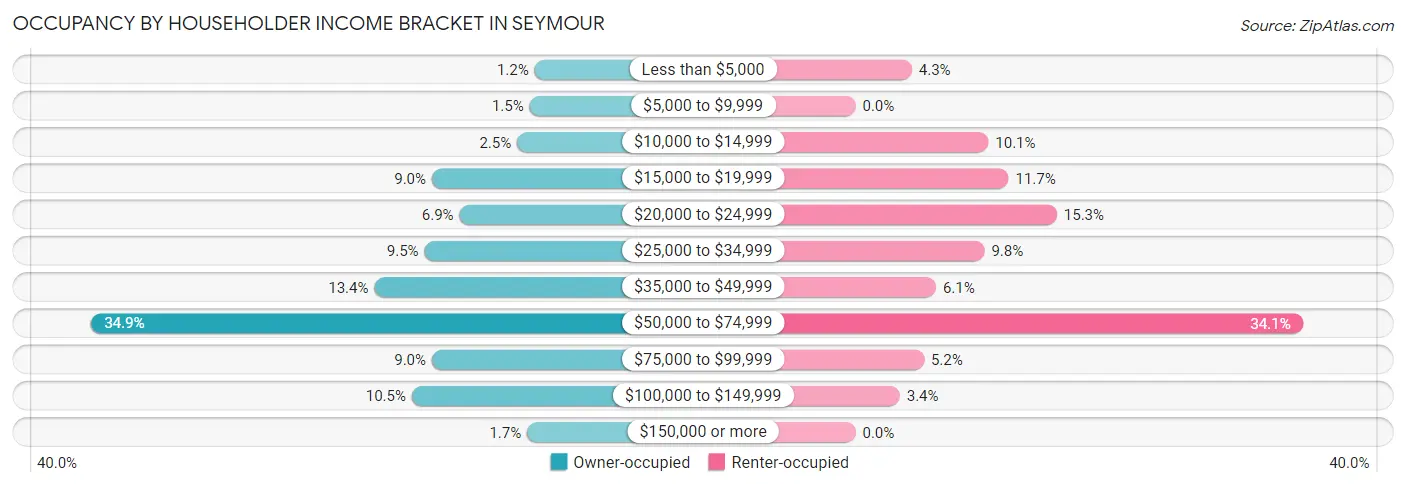
| Income Bracket | Owner-occupied | Renter-occupied |
| Less than $5,000 | 6 (1.1%) | 14 (4.3%) |
| $5,000 to $9,999 | 8 (1.5%) | 0 (0.0%) |
| $10,000 to $14,999 | 13 (2.5%) | 33 (10.1%) |
| $15,000 to $19,999 | 47 (9.0%) | 38 (11.7%) |
| $20,000 to $24,999 | 36 (6.9%) | 50 (15.3%) |
| $25,000 to $34,999 | 50 (9.5%) | 32 (9.8%) |
| $35,000 to $49,999 | 70 (13.4%) | 20 (6.1%) |
| $50,000 to $74,999 | 183 (34.9%) | 111 (34.1%) |
| $75,000 to $99,999 | 47 (9.0%) | 17 (5.2%) |
| $100,000 to $149,999 | 55 (10.5%) | 11 (3.4%) |
| $150,000 or more | 9 (1.7%) | 0 (0.0%) |
| Total | 524 (100.0%) | 326 (100.0%) |
Monthly Housing Cost Tiers in Seymour
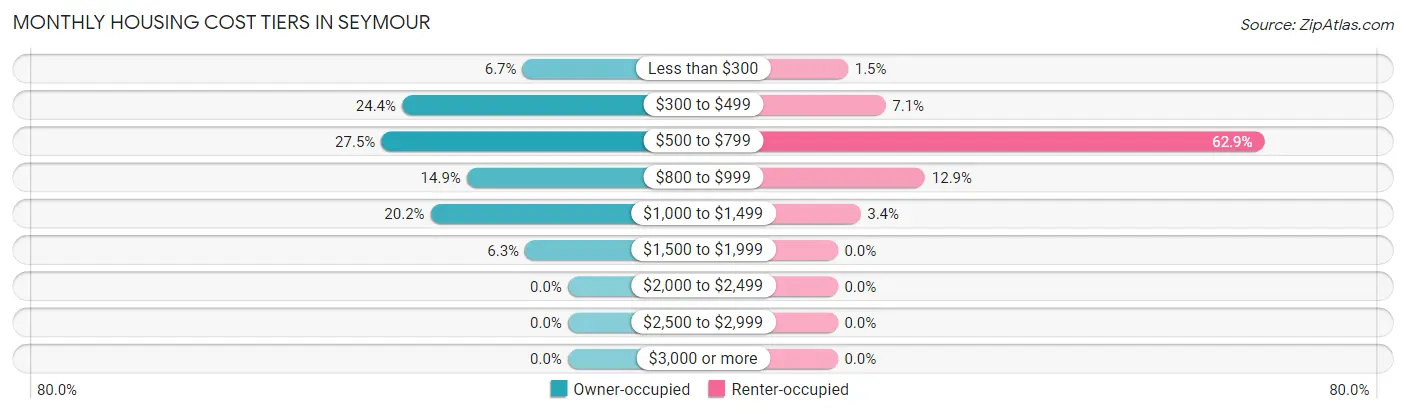
| Monthly Cost | Owner-occupied | Renter-occupied |
| Less than $300 | 35 (6.7%) | 5 (1.5%) |
| $300 to $499 | 128 (24.4%) | 23 (7.1%) |
| $500 to $799 | 144 (27.5%) | 205 (62.9%) |
| $800 to $999 | 78 (14.9%) | 42 (12.9%) |
| $1,000 to $1,499 | 106 (20.2%) | 11 (3.4%) |
| $1,500 to $1,999 | 33 (6.3%) | 0 (0.0%) |
| $2,000 to $2,499 | 0 (0.0%) | 0 (0.0%) |
| $2,500 to $2,999 | 0 (0.0%) | 0 (0.0%) |
| $3,000 or more | 0 (0.0%) | 0 (0.0%) |
| Total | 524 (100.0%) | 326 (100.0%) |
Physical Housing Characteristics in Seymour
Housing Structures in Seymour
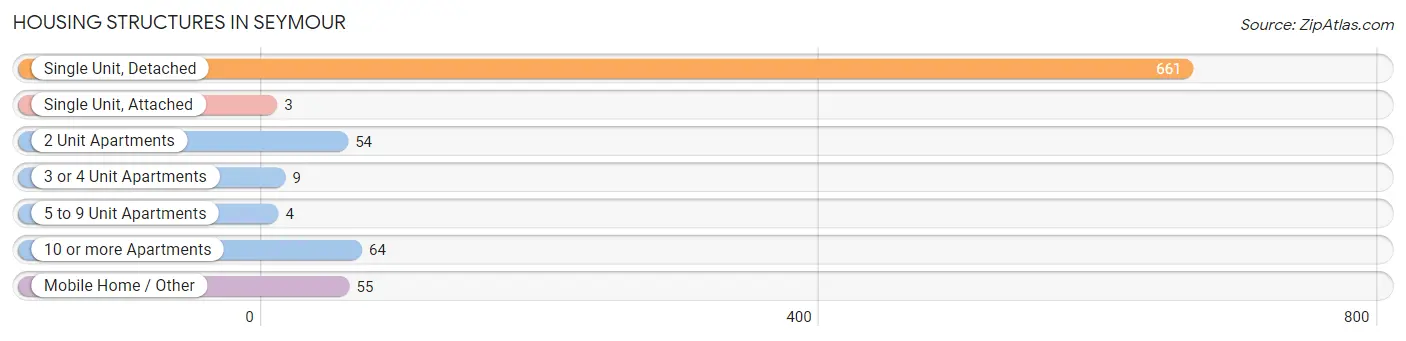
| Structure Type | # Housing Units | % Housing Units |
| Single Unit, Detached | 661 | 77.8% |
| Single Unit, Attached | 3 | 0.4% |
| 2 Unit Apartments | 54 | 6.4% |
| 3 or 4 Unit Apartments | 9 | 1.1% |
| 5 to 9 Unit Apartments | 4 | 0.5% |
| 10 or more Apartments | 64 | 7.5% |
| Mobile Home / Other | 55 | 6.5% |
| Total | 850 | 100.0% |
Housing Structures by Occupancy in Seymour
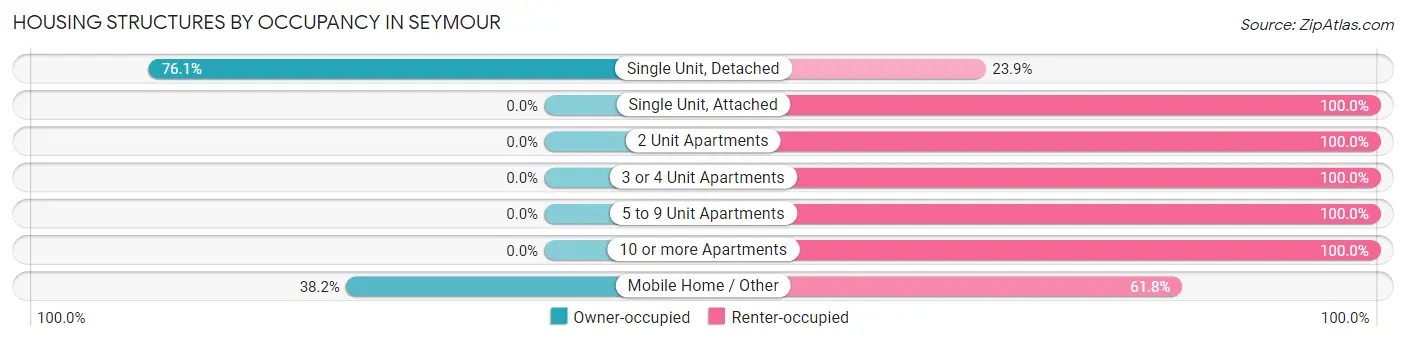
| Structure Type | Owner-occupied | Renter-occupied |
| Single Unit, Detached | 503 (76.1%) | 158 (23.9%) |
| Single Unit, Attached | 0 (0.0%) | 3 (100.0%) |
| 2 Unit Apartments | 0 (0.0%) | 54 (100.0%) |
| 3 or 4 Unit Apartments | 0 (0.0%) | 9 (100.0%) |
| 5 to 9 Unit Apartments | 0 (0.0%) | 4 (100.0%) |
| 10 or more Apartments | 0 (0.0%) | 64 (100.0%) |
| Mobile Home / Other | 21 (38.2%) | 34 (61.8%) |
| Total | 524 (61.7%) | 326 (38.4%) |
Housing Structures by Number of Rooms in Seymour
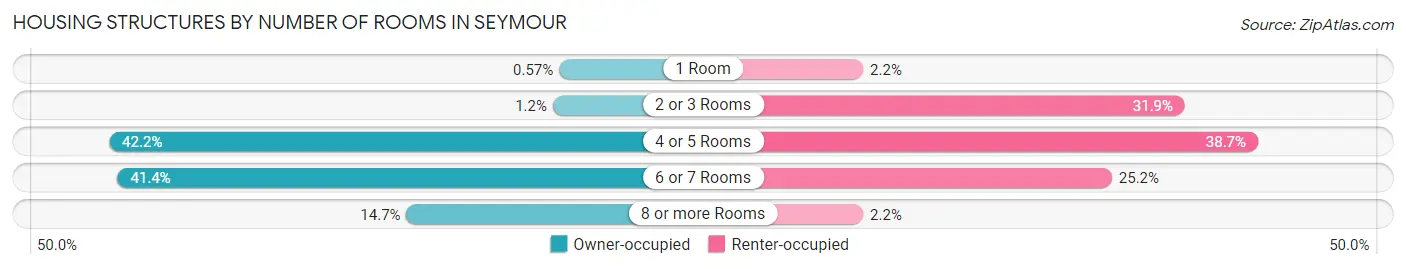
| Number of Rooms | Owner-occupied | Renter-occupied |
| 1 Room | 3 (0.6%) | 7 (2.1%) |
| 2 or 3 Rooms | 6 (1.1%) | 104 (31.9%) |
| 4 or 5 Rooms | 221 (42.2%) | 126 (38.7%) |
| 6 or 7 Rooms | 217 (41.4%) | 82 (25.2%) |
| 8 or more Rooms | 77 (14.7%) | 7 (2.1%) |
| Total | 524 (100.0%) | 326 (100.0%) |
Housing Structure by Heating Type in Seymour
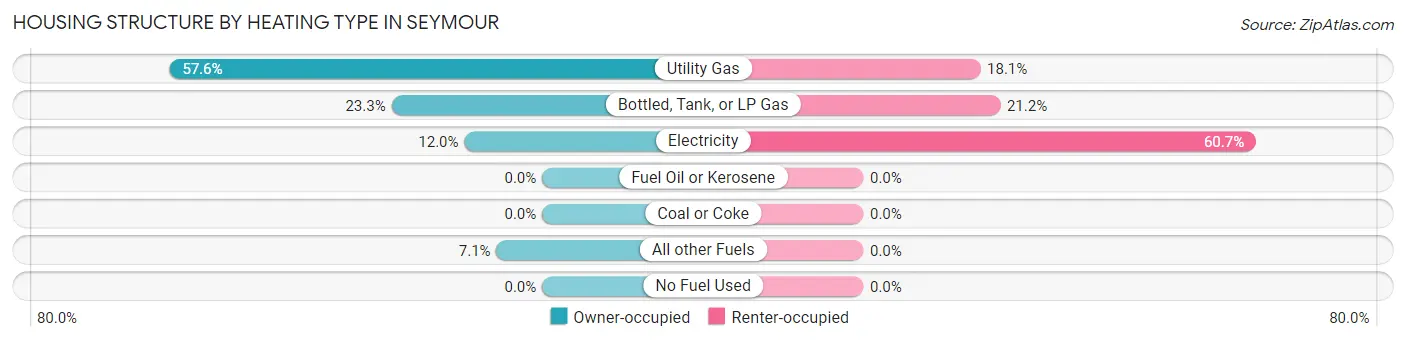
| Heating Type | Owner-occupied | Renter-occupied |
| Utility Gas | 302 (57.6%) | 59 (18.1%) |
| Bottled, Tank, or LP Gas | 122 (23.3%) | 69 (21.2%) |
| Electricity | 63 (12.0%) | 198 (60.7%) |
| Fuel Oil or Kerosene | 0 (0.0%) | 0 (0.0%) |
| Coal or Coke | 0 (0.0%) | 0 (0.0%) |
| All other Fuels | 37 (7.1%) | 0 (0.0%) |
| No Fuel Used | 0 (0.0%) | 0 (0.0%) |
| Total | 524 (100.0%) | 326 (100.0%) |
Household Vehicle Usage in Seymour
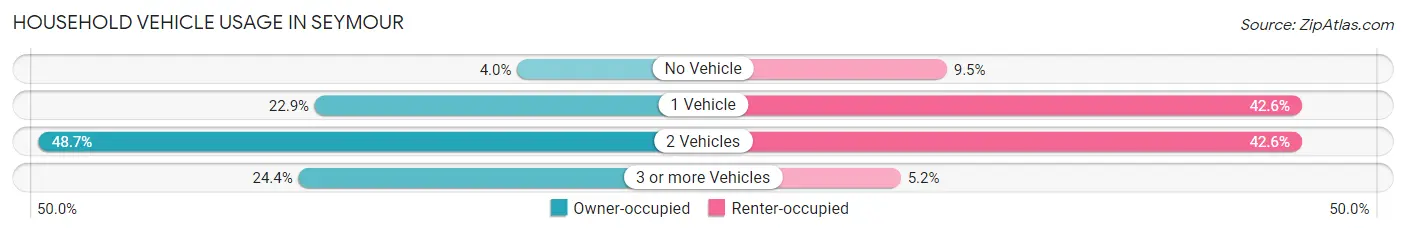
| Vehicles per Household | Owner-occupied | Renter-occupied |
| No Vehicle | 21 (4.0%) | 31 (9.5%) |
| 1 Vehicle | 120 (22.9%) | 139 (42.6%) |
| 2 Vehicles | 255 (48.7%) | 139 (42.6%) |
| 3 or more Vehicles | 128 (24.4%) | 17 (5.2%) |
| Total | 524 (100.0%) | 326 (100.0%) |
Real Estate & Mortgages in Seymour
Real Estate and Mortgage Overview in Seymour
| Characteristic | Without Mortgage | With Mortgage |
| Housing Units | 220 | 304 |
| Median Property Value | $90,300 | $121,700 |
| Median Household Income | $37,000 | $9 |
| Monthly Housing Costs | $443 | $0 |
| Real Estate Taxes | $348 | $3 |
Property Value by Mortgage Status in Seymour
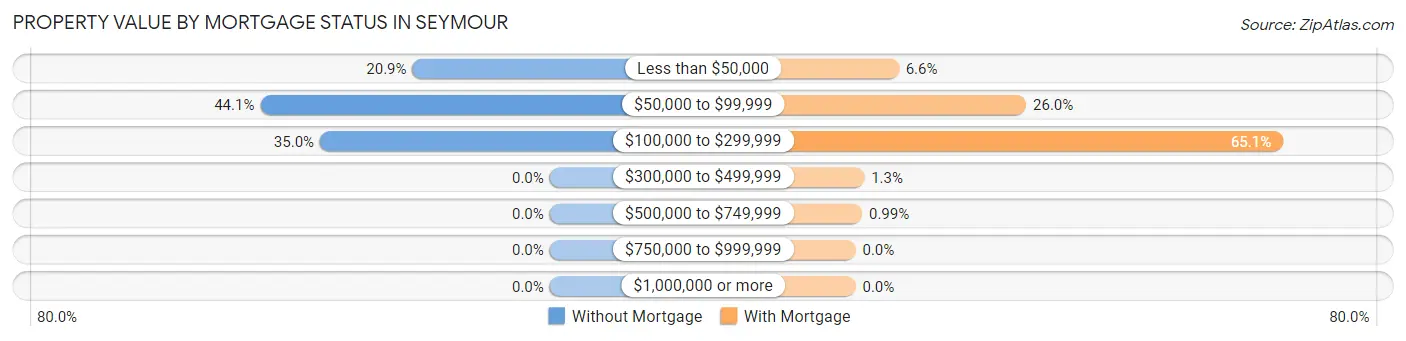
| Property Value | Without Mortgage | With Mortgage |
| Less than $50,000 | 46 (20.9%) | 20 (6.6%) |
| $50,000 to $99,999 | 97 (44.1%) | 79 (26.0%) |
| $100,000 to $299,999 | 77 (35.0%) | 198 (65.1%) |
| $300,000 to $499,999 | 0 (0.0%) | 4 (1.3%) |
| $500,000 to $749,999 | 0 (0.0%) | 3 (1.0%) |
| $750,000 to $999,999 | 0 (0.0%) | 0 (0.0%) |
| $1,000,000 or more | 0 (0.0%) | 0 (0.0%) |
| Total | 220 (100.0%) | 304 (100.0%) |
Household Income by Mortgage Status in Seymour
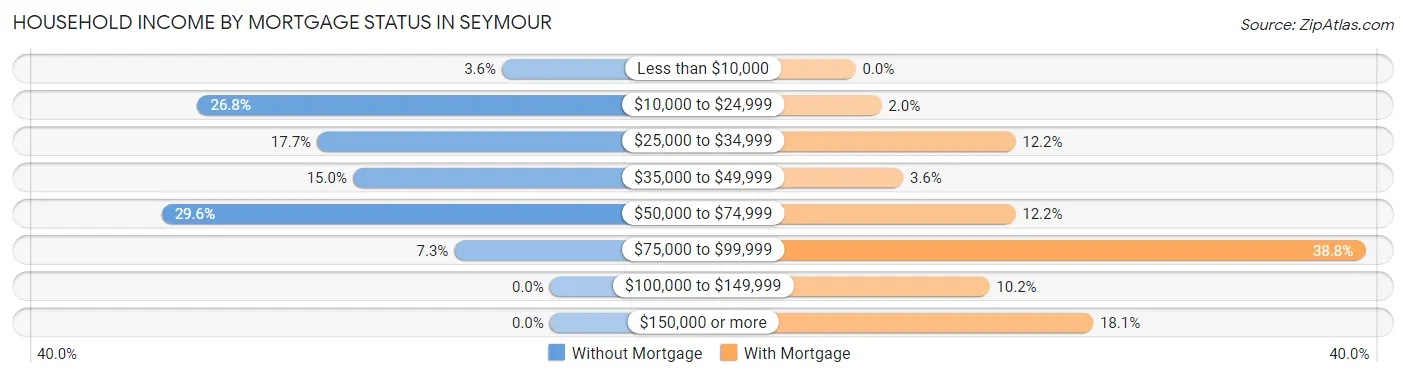
| Household Income | Without Mortgage | With Mortgage |
| Less than $10,000 | 8 (3.6%) | 0 (0.0%) |
| $10,000 to $24,999 | 59 (26.8%) | 6 (2.0%) |
| $25,000 to $34,999 | 39 (17.7%) | 37 (12.2%) |
| $35,000 to $49,999 | 33 (15.0%) | 11 (3.6%) |
| $50,000 to $74,999 | 65 (29.5%) | 37 (12.2%) |
| $75,000 to $99,999 | 16 (7.3%) | 118 (38.8%) |
| $100,000 to $149,999 | 0 (0.0%) | 31 (10.2%) |
| $150,000 or more | 0 (0.0%) | 55 (18.1%) |
| Total | 220 (100.0%) | 304 (100.0%) |
Property Value to Household Income Ratio in Seymour
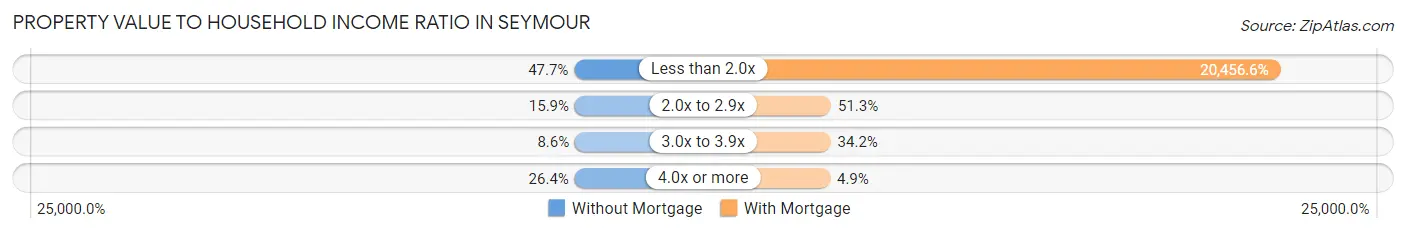
| Value-to-Income Ratio | Without Mortgage | With Mortgage |
| Less than 2.0x | 105 (47.7%) | 62,188 (20,456.6%) |
| 2.0x to 2.9x | 35 (15.9%) | 156 (51.3%) |
| 3.0x to 3.9x | 19 (8.6%) | 104 (34.2%) |
| 4.0x or more | 58 (26.4%) | 15 (4.9%) |
| Total | 220 (100.0%) | 304 (100.0%) |
Real Estate Taxes by Mortgage Status in Seymour
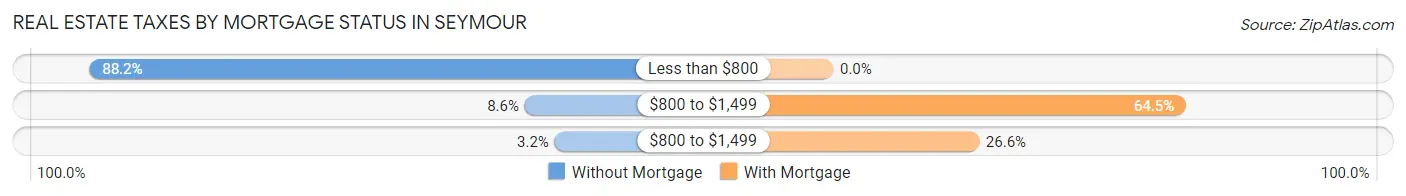
| Property Taxes | Without Mortgage | With Mortgage |
| Less than $800 | 194 (88.2%) | 0 (0.0%) |
| $800 to $1,499 | 19 (8.6%) | 196 (64.5%) |
| $800 to $1,499 | 7 (3.2%) | 81 (26.6%) |
| Total | 220 (100.0%) | 304 (100.0%) |
Health & Disability in Seymour
Health Insurance Coverage by Age in Seymour
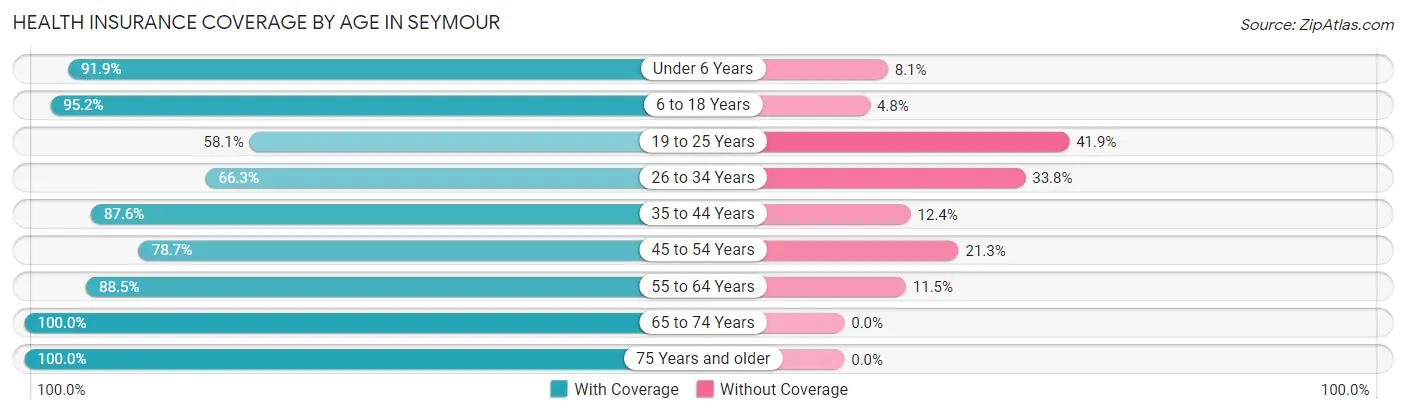
| Age Bracket | With Coverage | Without Coverage |
| Under 6 Years | 136 (91.9%) | 12 (8.1%) |
| 6 to 18 Years | 319 (95.2%) | 16 (4.8%) |
| 19 to 25 Years | 108 (58.1%) | 78 (41.9%) |
| 26 to 34 Years | 159 (66.2%) | 81 (33.8%) |
| 35 to 44 Years | 163 (87.6%) | 23 (12.4%) |
| 45 to 54 Years | 181 (78.7%) | 49 (21.3%) |
| 55 to 64 Years | 216 (88.5%) | 28 (11.5%) |
| 65 to 74 Years | 180 (100.0%) | 0 (0.0%) |
| 75 Years and older | 133 (100.0%) | 0 (0.0%) |
| Total | 1,595 (84.8%) | 287 (15.2%) |
Health Insurance Coverage by Citizenship Status in Seymour
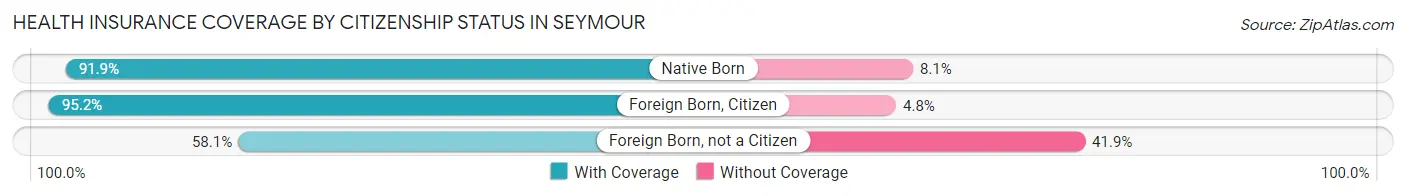
| Citizenship Status | With Coverage | Without Coverage |
| Native Born | 136 (91.9%) | 12 (8.1%) |
| Foreign Born, Citizen | 319 (95.2%) | 16 (4.8%) |
| Foreign Born, not a Citizen | 108 (58.1%) | 78 (41.9%) |
Health Insurance Coverage by Household Income in Seymour
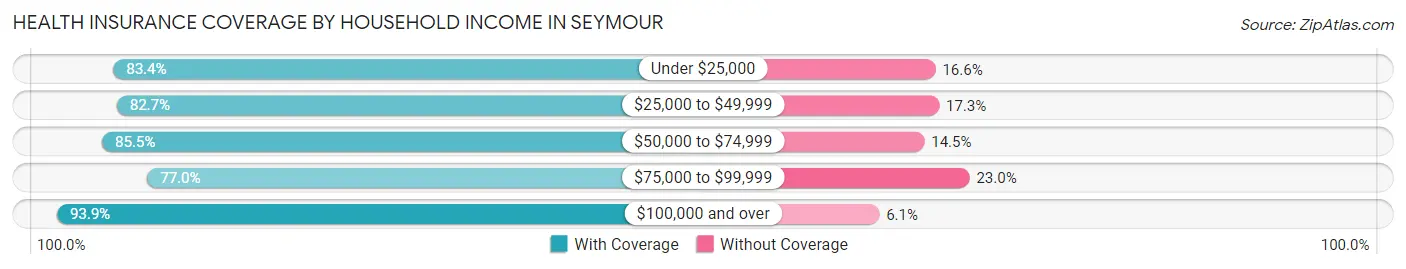
| Household Income | With Coverage | Without Coverage |
| Under $25,000 | 326 (83.4%) | 65 (16.6%) |
| $25,000 to $49,999 | 316 (82.7%) | 66 (17.3%) |
| $50,000 to $74,999 | 577 (85.5%) | 98 (14.5%) |
| $75,000 to $99,999 | 144 (77.0%) | 43 (23.0%) |
| $100,000 and over | 232 (93.9%) | 15 (6.1%) |
Public vs Private Health Insurance Coverage by Age in Seymour
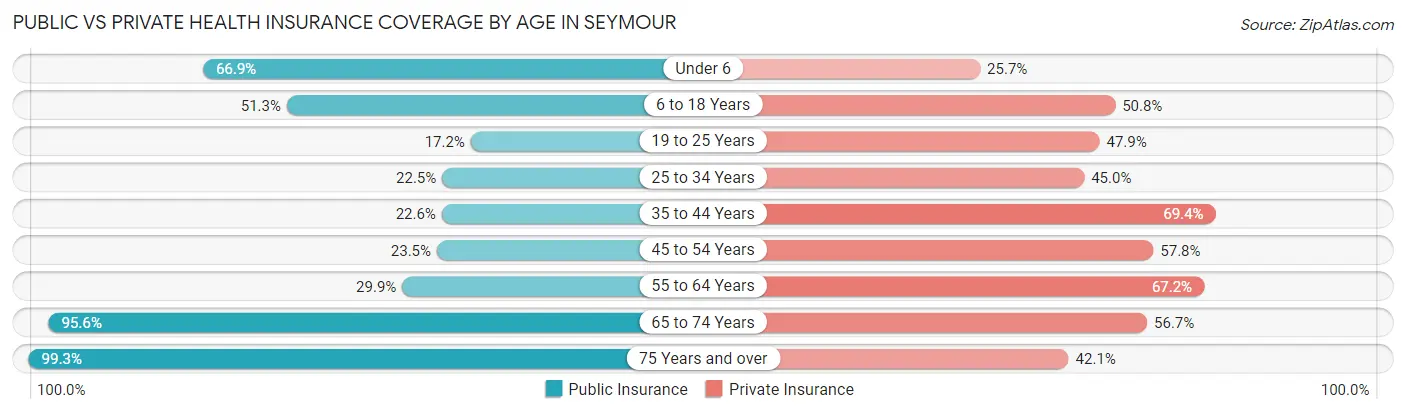
| Age Bracket | Public Insurance | Private Insurance |
| Under 6 | 99 (66.9%) | 38 (25.7%) |
| 6 to 18 Years | 172 (51.3%) | 170 (50.7%) |
| 19 to 25 Years | 32 (17.2%) | 89 (47.8%) |
| 25 to 34 Years | 54 (22.5%) | 108 (45.0%) |
| 35 to 44 Years | 42 (22.6%) | 129 (69.4%) |
| 45 to 54 Years | 54 (23.5%) | 133 (57.8%) |
| 55 to 64 Years | 73 (29.9%) | 164 (67.2%) |
| 65 to 74 Years | 172 (95.6%) | 102 (56.7%) |
| 75 Years and over | 132 (99.3%) | 56 (42.1%) |
| Total | 830 (44.1%) | 989 (52.5%) |
Disability Status by Sex by Age in Seymour
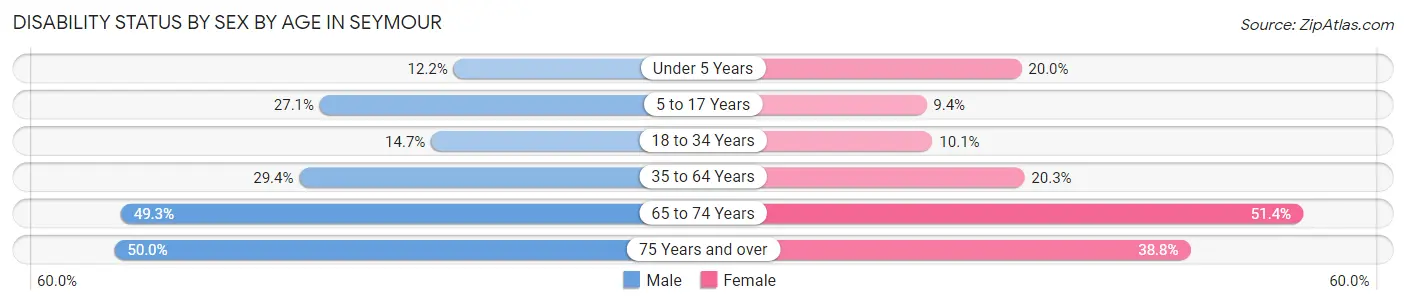
| Age Bracket | Male | Female |
| Under 5 Years | 11 (12.2%) | 9 (20.0%) |
| 5 to 17 Years | 48 (27.1%) | 13 (9.4%) |
| 18 to 34 Years | 34 (14.7%) | 23 (10.1%) |
| 35 to 64 Years | 90 (29.4%) | 72 (20.3%) |
| 65 to 74 Years | 34 (49.3%) | 57 (51.3%) |
| 75 Years and over | 33 (50.0%) | 26 (38.8%) |
Disability Class by Sex by Age in Seymour
Disability Class: Hearing Difficulty
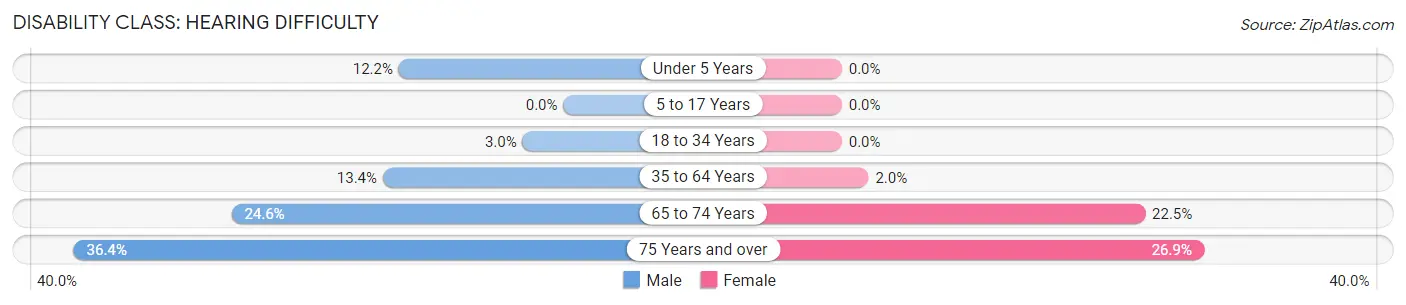
| Age Bracket | Male | Female |
| Under 5 Years | 11 (12.2%) | 0 (0.0%) |
| 5 to 17 Years | 0 (0.0%) | 0 (0.0%) |
| 18 to 34 Years | 7 (3.0%) | 0 (0.0%) |
| 35 to 64 Years | 41 (13.4%) | 7 (2.0%) |
| 65 to 74 Years | 17 (24.6%) | 25 (22.5%) |
| 75 Years and over | 24 (36.4%) | 18 (26.9%) |
Disability Class: Vision Difficulty
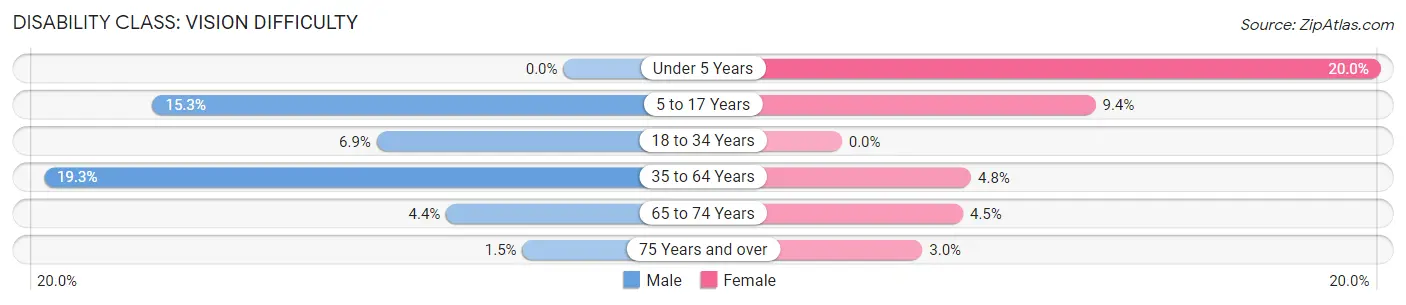
| Age Bracket | Male | Female |
| Under 5 Years | 0 (0.0%) | 9 (20.0%) |
| 5 to 17 Years | 27 (15.2%) | 13 (9.4%) |
| 18 to 34 Years | 16 (6.9%) | 0 (0.0%) |
| 35 to 64 Years | 59 (19.3%) | 17 (4.8%) |
| 65 to 74 Years | 3 (4.3%) | 5 (4.5%) |
| 75 Years and over | 1 (1.5%) | 2 (3.0%) |
Disability Class: Cognitive Difficulty
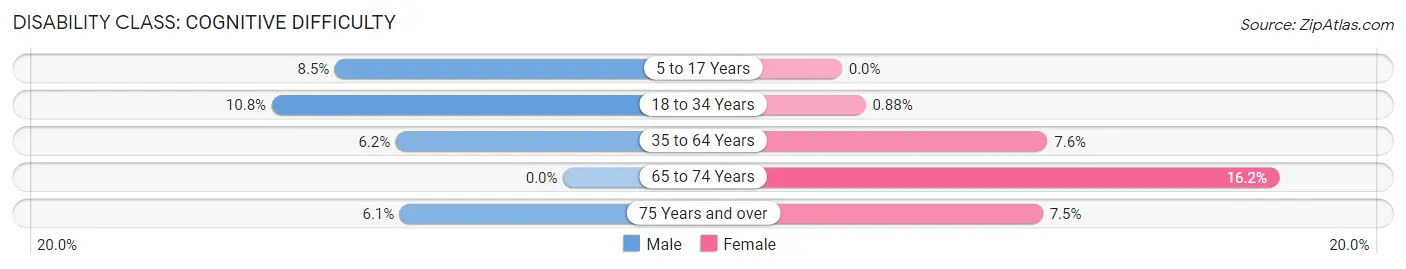
| Age Bracket | Male | Female |
| 5 to 17 Years | 15 (8.5%) | 0 (0.0%) |
| 18 to 34 Years | 25 (10.8%) | 2 (0.9%) |
| 35 to 64 Years | 19 (6.2%) | 27 (7.6%) |
| 65 to 74 Years | 0 (0.0%) | 18 (16.2%) |
| 75 Years and over | 4 (6.1%) | 5 (7.5%) |
Disability Class: Ambulatory Difficulty
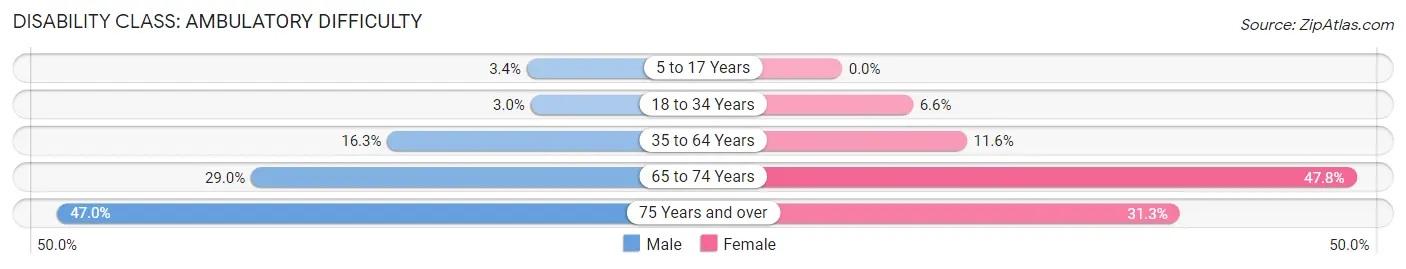
| Age Bracket | Male | Female |
| 5 to 17 Years | 6 (3.4%) | 0 (0.0%) |
| 18 to 34 Years | 7 (3.0%) | 15 (6.6%) |
| 35 to 64 Years | 50 (16.3%) | 41 (11.6%) |
| 65 to 74 Years | 20 (29.0%) | 53 (47.7%) |
| 75 Years and over | 31 (47.0%) | 21 (31.3%) |
Disability Class: Self-Care Difficulty
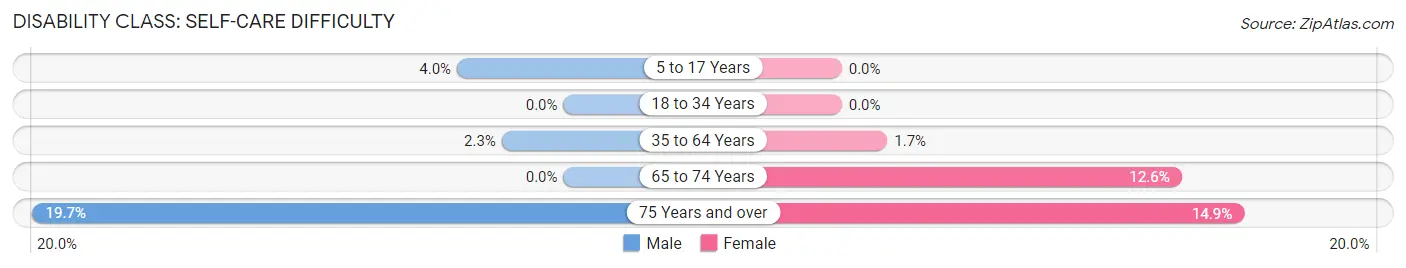
| Age Bracket | Male | Female |
| 5 to 17 Years | 7 (4.0%) | 0 (0.0%) |
| 18 to 34 Years | 0 (0.0%) | 0 (0.0%) |
| 35 to 64 Years | 7 (2.3%) | 6 (1.7%) |
| 65 to 74 Years | 0 (0.0%) | 14 (12.6%) |
| 75 Years and over | 13 (19.7%) | 10 (14.9%) |
Technology Access in Seymour
Computing Device Access in Seymour
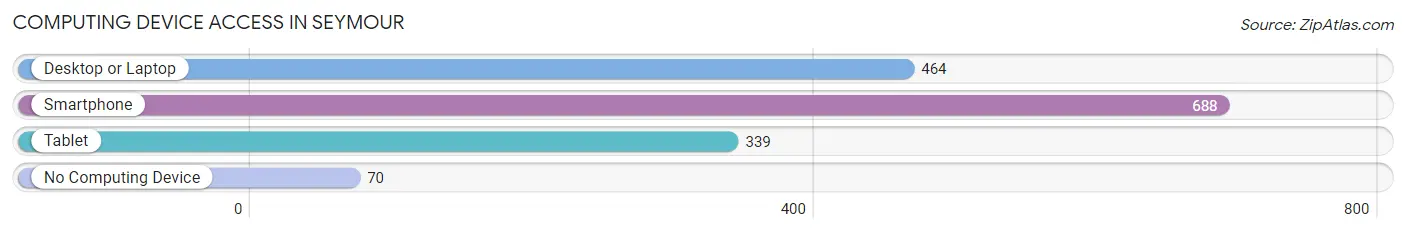
| Device Type | # Households | % Households |
| Desktop or Laptop | 464 | 54.6% |
| Smartphone | 688 | 80.9% |
| Tablet | 339 | 39.9% |
| No Computing Device | 70 | 8.2% |
| Total | 850 | 100.0% |
Internet Access in Seymour
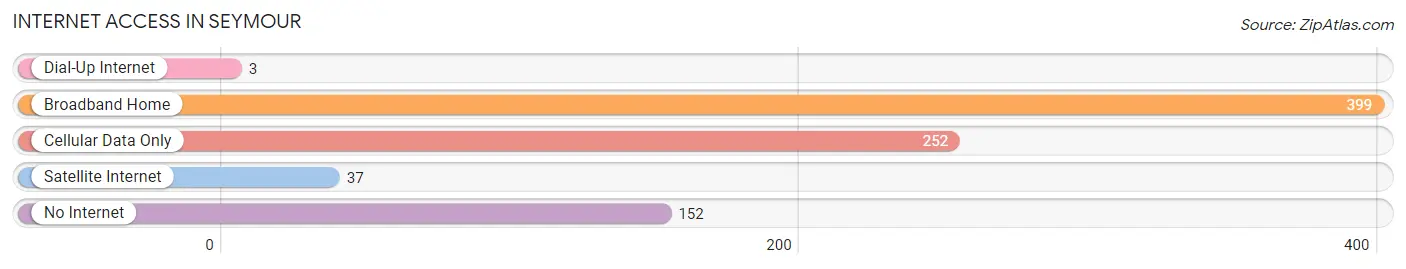
| Internet Type | # Households | % Households |
| Dial-Up Internet | 3 | 0.4% |
| Broadband Home | 399 | 46.9% |
| Cellular Data Only | 252 | 29.6% |
| Satellite Internet | 37 | 4.3% |
| No Internet | 152 | 17.9% |
| Total | 850 | 100.0% |
Seymour Summary
Seymour, Missouri is a small town located in Webster County, in the southwestern corner of the state. It is situated on the banks of the James River, and is surrounded by rolling hills and farmland. The town has a population of just over 1,000 people, and is known for its friendly atmosphere and rural charm.
History
Seymour was founded in 1883 by a group of settlers from Kentucky. The town was named after the nearby Seymour Creek, which was named after a local settler, William Seymour. The town was originally a farming community, and the main crops grown were corn, wheat, and oats. As the town grew, it became a center for trade and commerce, and the first post office was established in 1885.
In the early 1900s, the town began to experience a period of growth and prosperity. The railroad arrived in 1906, and the town was connected to the rest of the state. This allowed for the transportation of goods and services, and the town began to thrive. The population grew to over 1,000 people by the 1920s, and the town was incorporated in 1923.
Geography
Seymour is located in the southwestern corner of Missouri, in Webster County. It is situated on the banks of the James River, and is surrounded by rolling hills and farmland. The town is located about 25 miles from Springfield, the state capital, and about 50 miles from Branson, a popular tourist destination.
The climate in Seymour is humid subtropical, with hot, humid summers and mild winters. The average temperature in the summer is around 80 degrees Fahrenheit, and the average temperature in the winter is around 40 degrees Fahrenheit. The town receives an average of 40 inches of rain per year, and the area is prone to severe thunderstorms and tornadoes.
Economy
The economy of Seymour is largely based on agriculture. The town is surrounded by farmland, and the main crops grown are corn, wheat, and oats. The town also has a few small businesses, including a grocery store, a hardware store, and a few restaurants.
The town is also home to a few manufacturing companies, including a furniture factory and a plastics factory. These companies provide jobs for many of the town's residents.
Demographics
As of the 2010 census, the population of Seymour was 1,072. The racial makeup of the town was 97.2% White, 0.7% African American, 0.3% Native American, 0.2% Asian, 0.1% Pacific Islander, 0.3% from other races, and 1.2% from two or more races. Hispanic or Latino of any race were 1.2% of the population.
The median household income in Seymour was $37,500, and the median family income was $45,000. The per capita income was $19,000. About 11.2% of families and 14.2% of the population were below the poverty line, including 18.2% of those under age 18 and 8.3% of those age 65 or over.
Seymour is a small town with a friendly atmosphere and rural charm. It is a great place to live and work, and the town is proud of its history and heritage. The town is surrounded by farmland, and the economy is largely based on agriculture. The town also has a few small businesses, and the population is mostly white.
Common Questions
What is Per Capita Income in Seymour?
Per Capita income in Seymour is $22,508.
What is the Median Family Income in Seymour?
Median Family Income in Seymour is $52,294.
What is the Median Household income in Seymour?
Median Household Income in Seymour is $50,194.
What is Income or Wage Gap in Seymour?
Income or Wage Gap in Seymour is 11.4%.
Women in Seymour earn 88.6 cents for every dollar earned by a man.
What is Inequality or Gini Index in Seymour?
Inequality or Gini Index in Seymour is 0.35.
What is the Total Population of Seymour?
Total Population of Seymour is 1,932.
What is the Total Male Population of Seymour?
Total Male Population of Seymour is 954.
What is the Total Female Population of Seymour?
Total Female Population of Seymour is 978.
What is the Ratio of Males per 100 Females in Seymour?
There are 97.55 Males per 100 Females in Seymour.
What is the Ratio of Females per 100 Males in Seymour?
There are 102.52 Females per 100 Males in Seymour.
What is the Median Population Age in Seymour?
Median Population Age in Seymour is 37.7 Years.
What is the Average Family Size in Seymour
Average Family Size in Seymour is 2.7 People.
What is the Average Household Size in Seymour
Average Household Size in Seymour is 2.2 People.
How Large is the Labor Force in Seymour?
There are 902 People in the Labor Forcein in Seymour.
What is the Percentage of People in the Labor Force in Seymour?
58.0% of People are in the Labor Force in Seymour.
What is the Unemployment Rate in Seymour?
Unemployment Rate in Seymour is 4.5%.