Rockaway Beach, MO Map & Demographics
Rockaway Beach Map
Rockaway Beach Overview
$22,816
PER CAPITA INCOME
$61,136
AVG FAMILY INCOME
$52,813
AVG HOUSEHOLD INCOME
27.8%
WAGE / INCOME GAP [ % ]
72.2¢/ $1
WAGE / INCOME GAP [ $ ]
0.32
INEQUALITY / GINI INDEX
649
TOTAL POPULATION
313
MALE POPULATION
336
FEMALE POPULATION
93.15
MALES / 100 FEMALES
107.35
FEMALES / 100 MALES
55.4
MEDIAN AGE
3.0
AVG FAMILY SIZE
2.6
AVG HOUSEHOLD SIZE
259
LABOR FORCE [ PEOPLE ]
45.1%
PERCENT IN LABOR FORCE
6.7%
UNEMPLOYMENT RATE
Rockaway Beach Zip Codes
Rockaway Beach Area Codes
Income in Rockaway Beach
Income Overview in Rockaway Beach
Per Capita Income in Rockaway Beach is $22,816, while median incomes of families and households are $61,136 and $52,813 respectively.
| Characteristic | Number | Measure |
| Per Capita Income | 649 | $22,816 |
| Median Family Income | 176 | $61,136 |
| Mean Family Income | 176 | $66,461 |
| Median Household Income | 254 | $52,813 |
| Mean Household Income | 254 | $56,259 |
| Income Deficit | 176 | $0 |
| Wage / Income Gap (%) | 649 | 27.78% |
| Wage / Income Gap ($) | 649 | 72.22¢ per $1 |
| Gini / Inequality Index | 649 | 0.32 |
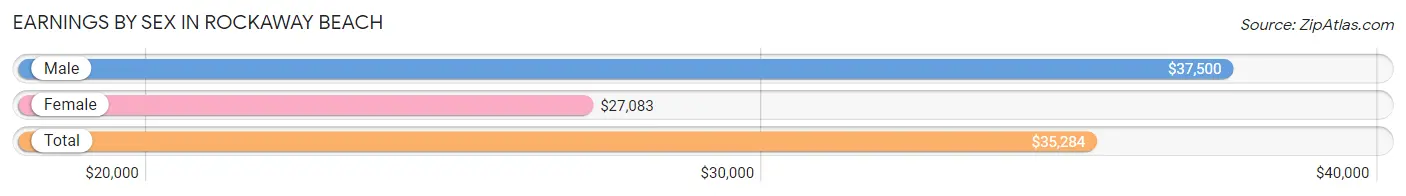
Earnings by Sex in Rockaway Beach
Average Earnings in Rockaway Beach are $35,284, $37,500 for men and $27,083 for women, a difference of 27.8%.
| Sex | Number | Average Earnings |
| Male | 160 (59.5%) | $37,500 |
| Female | 109 (40.5%) | $27,083 |
| Total | 269 (100.0%) | $35,284 |
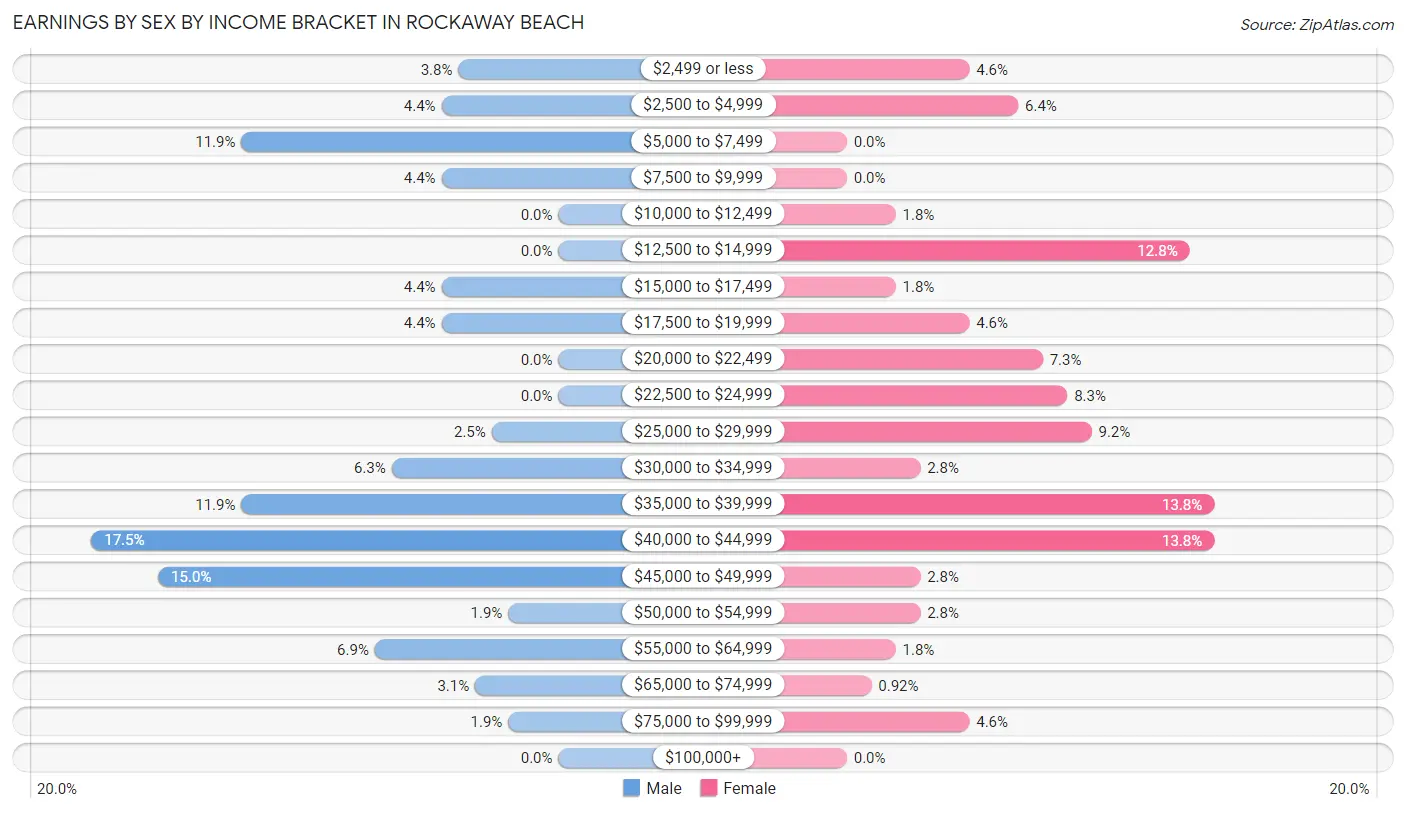
Earnings by Sex by Income Bracket in Rockaway Beach
The most common earnings brackets in Rockaway Beach are $40,000 to $44,999 for men (28 | 17.5%) and $35,000 to $39,999 for women (15 | 13.8%).
| Income | Male | Female |
| $2,499 or less | 6 (3.7%) | 5 (4.6%) |
| $2,500 to $4,999 | 7 (4.4%) | 7 (6.4%) |
| $5,000 to $7,499 | 19 (11.9%) | 0 (0.0%) |
| $7,500 to $9,999 | 7 (4.4%) | 0 (0.0%) |
| $10,000 to $12,499 | 0 (0.0%) | 2 (1.8%) |
| $12,500 to $14,999 | 0 (0.0%) | 14 (12.8%) |
| $15,000 to $17,499 | 7 (4.4%) | 2 (1.8%) |
| $17,500 to $19,999 | 7 (4.4%) | 5 (4.6%) |
| $20,000 to $22,499 | 0 (0.0%) | 8 (7.3%) |
| $22,500 to $24,999 | 0 (0.0%) | 9 (8.3%) |
| $25,000 to $29,999 | 4 (2.5%) | 10 (9.2%) |
| $30,000 to $34,999 | 10 (6.2%) | 3 (2.8%) |
| $35,000 to $39,999 | 19 (11.9%) | 15 (13.8%) |
| $40,000 to $44,999 | 28 (17.5%) | 15 (13.8%) |
| $45,000 to $49,999 | 24 (15.0%) | 3 (2.8%) |
| $50,000 to $54,999 | 3 (1.9%) | 3 (2.8%) |
| $55,000 to $64,999 | 11 (6.9%) | 2 (1.8%) |
| $65,000 to $74,999 | 5 (3.1%) | 1 (0.9%) |
| $75,000 to $99,999 | 3 (1.9%) | 5 (4.6%) |
| $100,000+ | 0 (0.0%) | 0 (0.0%) |
| Total | 160 (100.0%) | 109 (100.0%) |
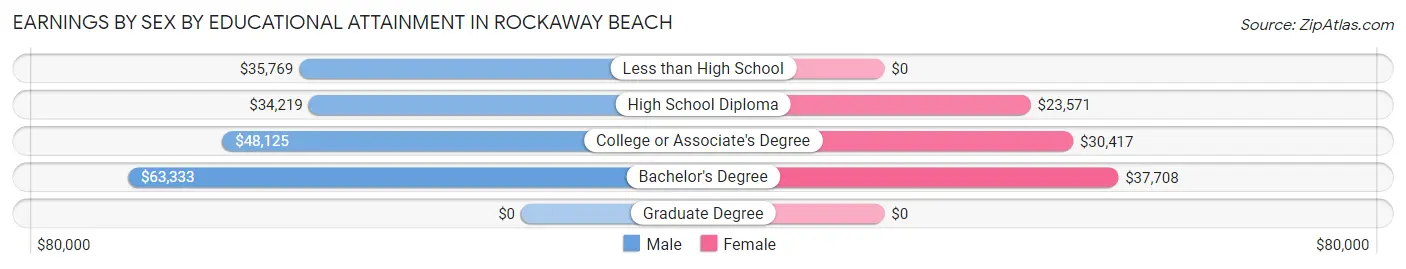
Earnings by Sex by Educational Attainment in Rockaway Beach
Average earnings in Rockaway Beach are $37,708 for men and $28,214 for women, a difference of 25.2%. Men with an educational attainment of bachelor's degree enjoy the highest average annual earnings of $63,333, while those with high school diploma education earn the least with $34,219. Women with an educational attainment of bachelor's degree earn the most with the average annual earnings of $37,708, while those with high school diploma education have the smallest earnings of $23,571.
| Educational Attainment | Male Income | Female Income |
| Less than High School | $35,769 | $0 |
| High School Diploma | $34,219 | $23,571 |
| College or Associate's Degree | $48,125 | $30,417 |
| Bachelor's Degree | $63,333 | $37,708 |
| Graduate Degree | - | - |
| Total | $37,708 | $28,214 |
Family Income in Rockaway Beach
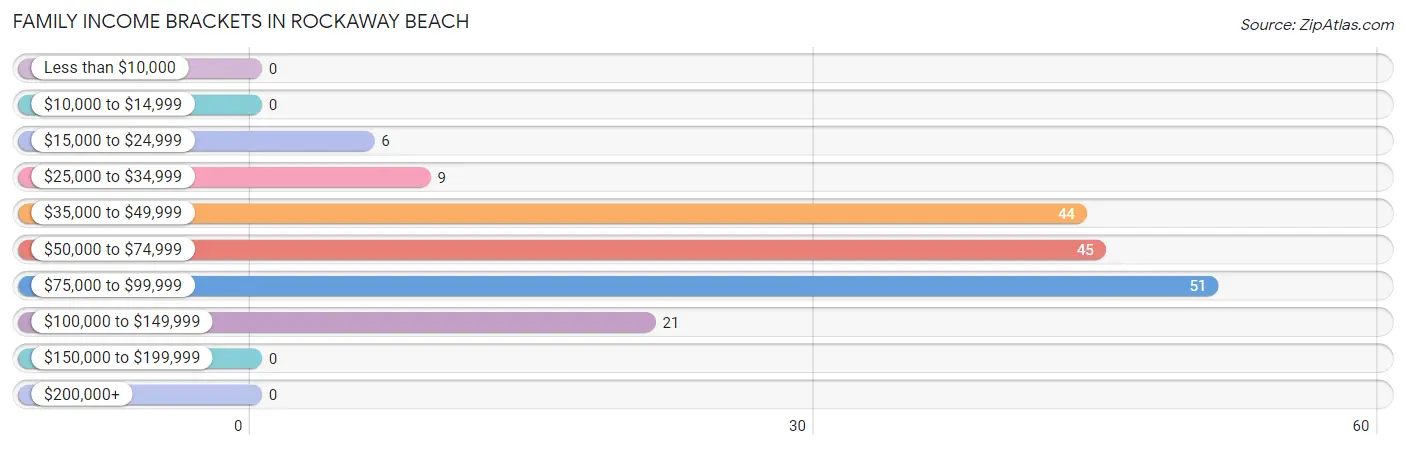
Family Income Brackets in Rockaway Beach
According to the Rockaway Beach family income data, there are 51 families falling into the $75,000 to $99,999 income range, which is the most common income bracket and makes up 29.0% of all families.
| Income Bracket | # Families | % Families |
| Less than $10,000 | 0 | 0.0% |
| $10,000 to $14,999 | 0 | 0.0% |
| $15,000 to $24,999 | 6 | 3.4% |
| $25,000 to $34,999 | 9 | 5.1% |
| $35,000 to $49,999 | 44 | 25.0% |
| $50,000 to $74,999 | 45 | 25.6% |
| $75,000 to $99,999 | 51 | 29.0% |
| $100,000 to $149,999 | 21 | 11.9% |
| $150,000 to $199,999 | 0 | 0.0% |
| $200,000+ | 0 | 0.0% |
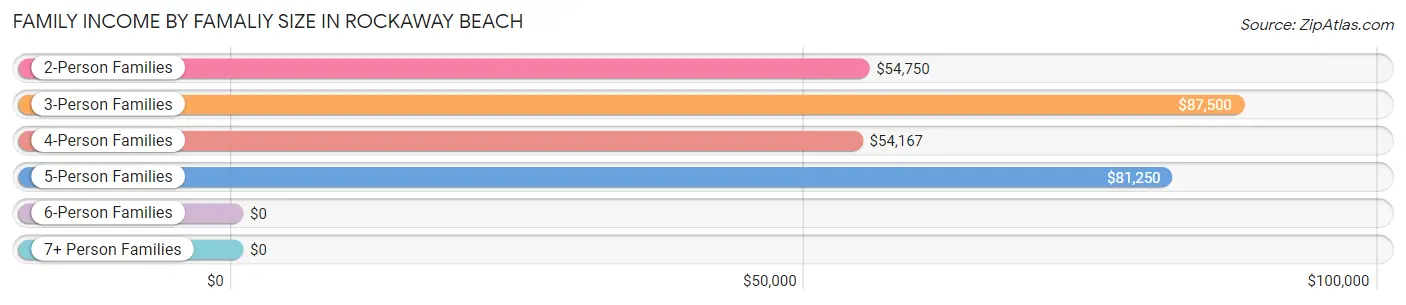
Family Income by Famaliy Size in Rockaway Beach
3-person families (40 | 22.7%) account for the highest median family income in Rockaway Beach with $87,500 per family, while 3-person families (40 | 22.7%) have the highest median income of $29,167 per family member.
| Income Bracket | # Families | Median Income |
| 2-Person Families | 106 (60.2%) | $54,750 |
| 3-Person Families | 40 (22.7%) | $87,500 |
| 4-Person Families | 12 (6.8%) | $54,167 |
| 5-Person Families | 18 (10.2%) | $81,250 |
| 6-Person Families | 0 (0.0%) | $0 |
| 7+ Person Families | 0 (0.0%) | $0 |
| Total | 176 (100.0%) | $61,136 |
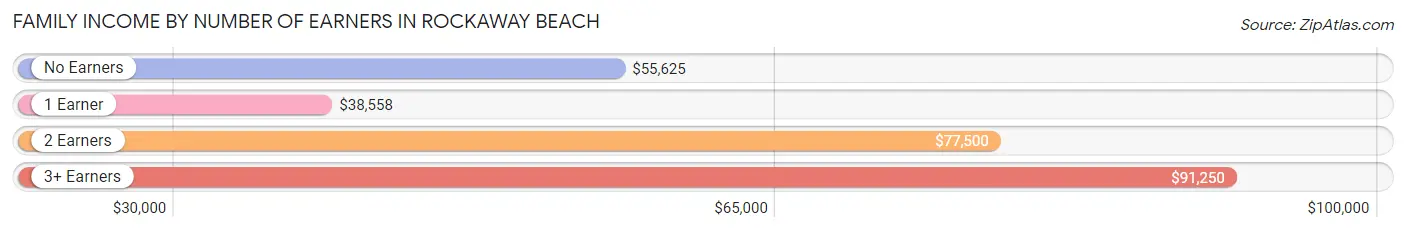
Family Income by Number of Earners in Rockaway Beach
The median family income in Rockaway Beach is $61,136, with families comprising 3+ earners (12) having the highest median family income of $91,250, while families with 1 earner (31) have the lowest median family income of $38,558, accounting for 6.8% and 17.6% of families, respectively.
| Number of Earners | # Families | Median Income |
| No Earners | 69 (39.2%) | $55,625 |
| 1 Earner | 31 (17.6%) | $38,558 |
| 2 Earners | 64 (36.4%) | $77,500 |
| 3+ Earners | 12 (6.8%) | $91,250 |
| Total | 176 (100.0%) | $61,136 |
Household Income in Rockaway Beach
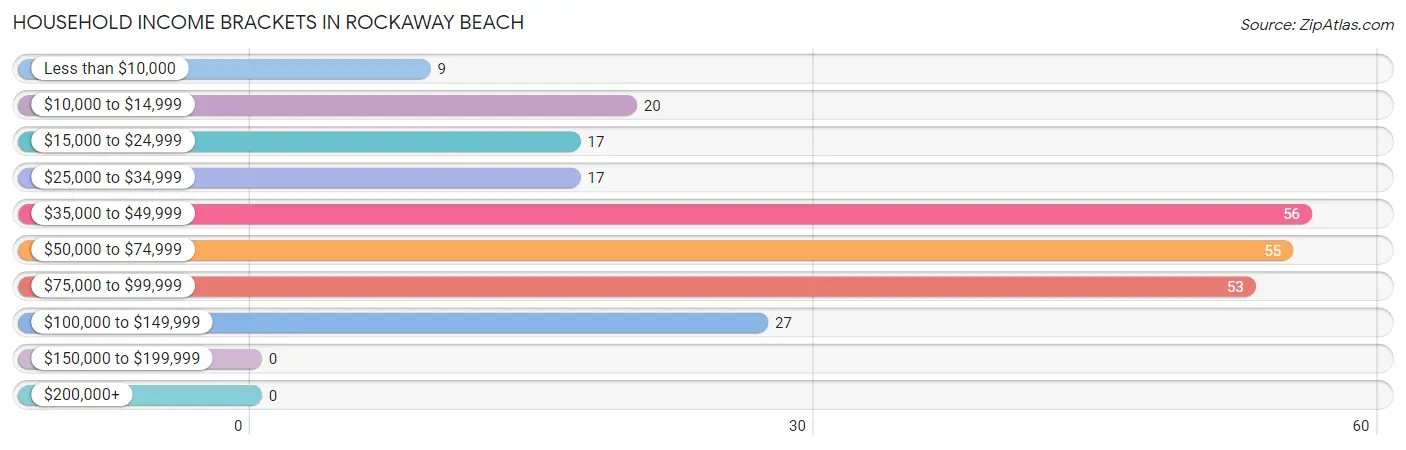
Household Income Brackets in Rockaway Beach
With 56 households falling in the category, the $35,000 to $49,999 income range is the most frequent in Rockaway Beach, accounting for 22.1% of all households.
| Income Bracket | # Households | % Households |
| Less than $10,000 | 9 | 3.5% |
| $10,000 to $14,999 | 20 | 7.9% |
| $15,000 to $24,999 | 17 | 6.7% |
| $25,000 to $34,999 | 17 | 6.7% |
| $35,000 to $49,999 | 56 | 22.0% |
| $50,000 to $74,999 | 55 | 21.7% |
| $75,000 to $99,999 | 53 | 20.9% |
| $100,000 to $149,999 | 27 | 10.6% |
| $150,000 to $199,999 | 0 | 0.0% |
| $200,000+ | 0 | 0.0% |
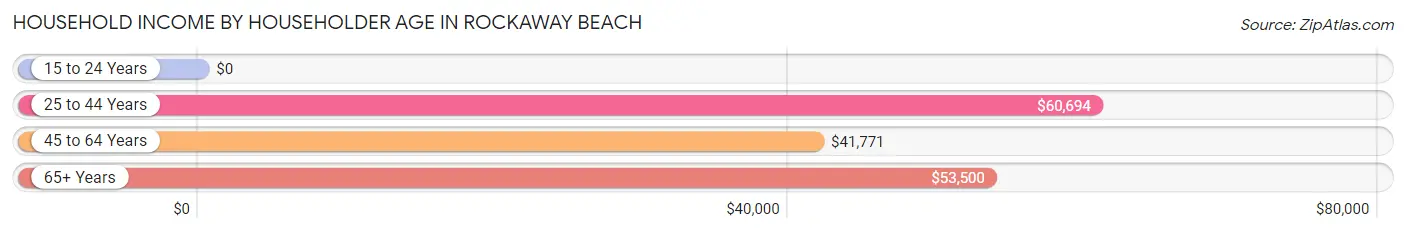
Household Income by Householder Age in Rockaway Beach
The median household income in Rockaway Beach is $52,813, with the highest median household income of $60,694 found in the 25 to 44 years age bracket for the primary householder. A total of 43 households (16.9%) fall into this category.
| Income Bracket | # Households | Median Income |
| 15 to 24 Years | 0 (0.0%) | $0 |
| 25 to 44 Years | 43 (16.9%) | $60,694 |
| 45 to 64 Years | 113 (44.5%) | $41,771 |
| 65+ Years | 98 (38.6%) | $53,500 |
| Total | 254 (100.0%) | $52,813 |
Poverty in Rockaway Beach
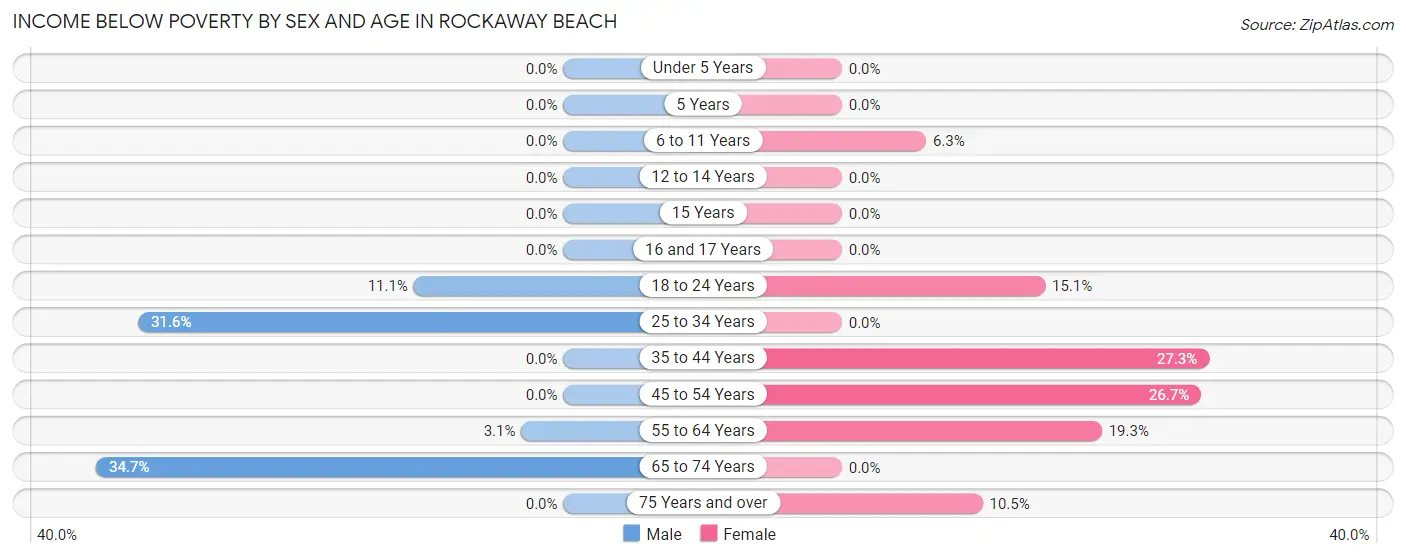
Income Below Poverty by Sex and Age in Rockaway Beach
With 10.0% poverty level for males and 13.7% for females among the residents of Rockaway Beach, 65 to 74 year old males and 35 to 44 year old females are the most vulnerable to poverty, with 17 males (34.7%) and 6 females (27.3%) in their respective age groups living below the poverty level.
| Age Bracket | Male | Female |
| Under 5 Years | 0 (0.0%) | 0 (0.0%) |
| 5 Years | 0 (0.0%) | 0 (0.0%) |
| 6 to 11 Years | 0 (0.0%) | 2 (6.2%) |
| 12 to 14 Years | 0 (0.0%) | 0 (0.0%) |
| 15 Years | 0 (0.0%) | 0 (0.0%) |
| 16 and 17 Years | 0 (0.0%) | 0 (0.0%) |
| 18 to 24 Years | 5 (11.1%) | 8 (15.1%) |
| 25 to 34 Years | 6 (31.6%) | 0 (0.0%) |
| 35 to 44 Years | 0 (0.0%) | 6 (27.3%) |
| 45 to 54 Years | 0 (0.0%) | 12 (26.7%) |
| 55 to 64 Years | 3 (3.1%) | 11 (19.3%) |
| 65 to 74 Years | 17 (34.7%) | 0 (0.0%) |
| 75 Years and over | 0 (0.0%) | 7 (10.4%) |
| Total | 31 (10.0%) | 46 (13.7%) |
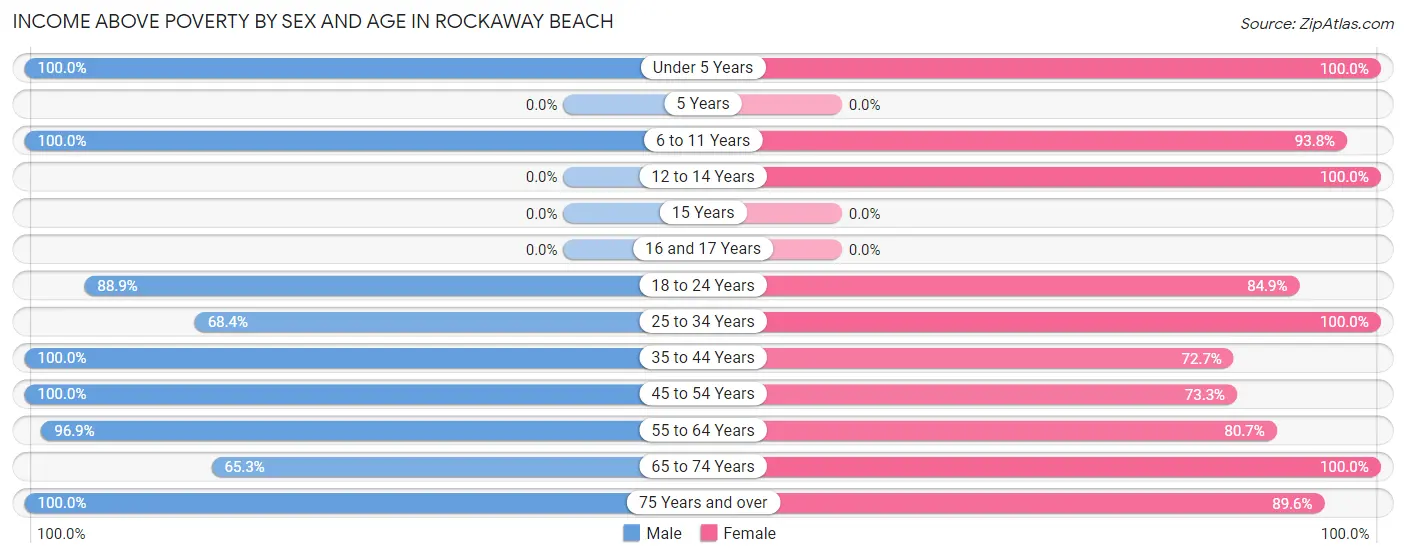
Income Above Poverty by Sex and Age in Rockaway Beach
According to the poverty statistics in Rockaway Beach, males aged under 5 years and females aged under 5 years are the age groups that are most secure financially, with 100.0% of males and 100.0% of females in these age groups living above the poverty line.
| Age Bracket | Male | Female |
| Under 5 Years | 11 (100.0%) | 3 (100.0%) |
| 5 Years | 0 (0.0%) | 0 (0.0%) |
| 6 to 11 Years | 16 (100.0%) | 30 (93.8%) |
| 12 to 14 Years | 0 (0.0%) | 10 (100.0%) |
| 15 Years | 0 (0.0%) | 0 (0.0%) |
| 16 and 17 Years | 0 (0.0%) | 0 (0.0%) |
| 18 to 24 Years | 40 (88.9%) | 45 (84.9%) |
| 25 to 34 Years | 13 (68.4%) | 25 (100.0%) |
| 35 to 44 Years | 24 (100.0%) | 16 (72.7%) |
| 45 to 54 Years | 11 (100.0%) | 33 (73.3%) |
| 55 to 64 Years | 93 (96.9%) | 46 (80.7%) |
| 65 to 74 Years | 32 (65.3%) | 22 (100.0%) |
| 75 Years and over | 39 (100.0%) | 60 (89.5%) |
| Total | 279 (90.0%) | 290 (86.3%) |
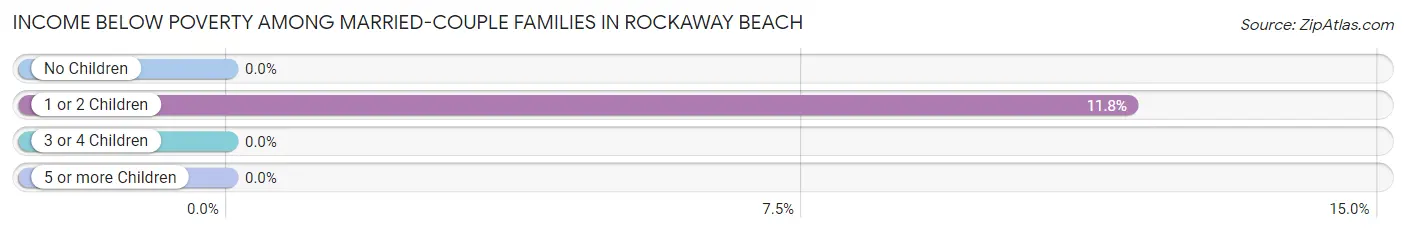
Income Below Poverty Among Married-Couple Families in Rockaway Beach
The poverty statistics for married-couple families in Rockaway Beach show that 1.3% or 2 of the total 156 families live below the poverty line. Families with 1 or 2 children have the highest poverty rate of 11.8%, comprising of 2 families. On the other hand, families with no children have the lowest poverty rate of 0.0%, which includes 0 families.
| Children | Above Poverty | Below Poverty |
| No Children | 125 (100.0%) | 0 (0.0%) |
| 1 or 2 Children | 15 (88.2%) | 2 (11.8%) |
| 3 or 4 Children | 14 (100.0%) | 0 (0.0%) |
| 5 or more Children | 0 (0.0%) | 0 (0.0%) |
| Total | 154 (98.7%) | 2 (1.3%) |
Income Below Poverty Among Single-Parent Households in Rockaway Beach
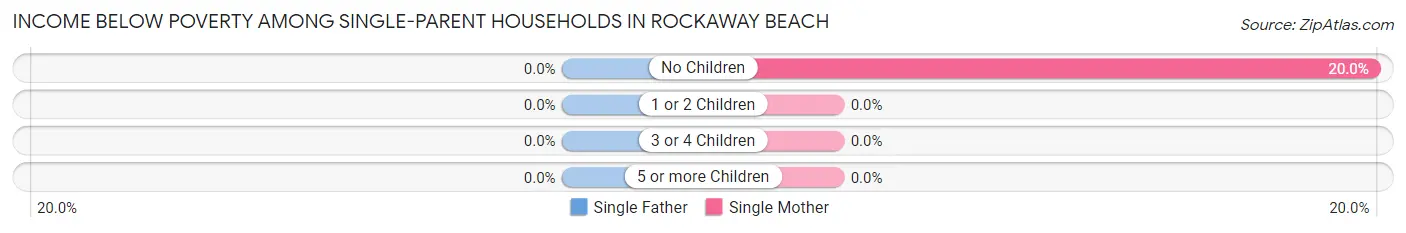
| Children | Single Father | Single Mother |
| No Children | 0 (0.0%) | 2 (20.0%) |
| 1 or 2 Children | 0 (0.0%) | 0 (0.0%) |
| 3 or 4 Children | 0 (0.0%) | 0 (0.0%) |
| 5 or more Children | 0 (0.0%) | 0 (0.0%) |
| Total | 0 (0.0%) | 2 (15.4%) |
Income Below Poverty Among Married-Couple vs Single-Parent Households in Rockaway Beach
The poverty data for Rockaway Beach shows that 2 of the married-couple family households (1.3%) and 2 of the single-parent households (10.0%) are living below the poverty level. Within the married-couple family households, those with 1 or 2 children have the highest poverty rate, with 2 households (11.8%) falling below the poverty line. Among the single-parent households, those with no children have the highest poverty rate, with 2 household (11.8%) living below poverty.
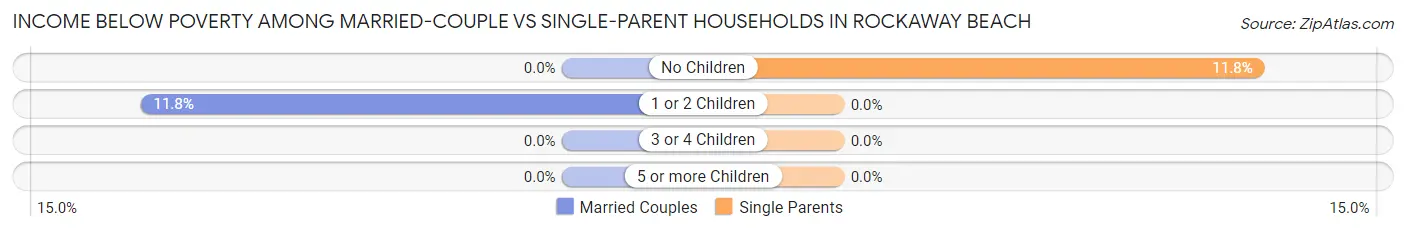
| Children | Married-Couple Families | Single-Parent Households |
| No Children | 0 (0.0%) | 2 (11.8%) |
| 1 or 2 Children | 2 (11.8%) | 0 (0.0%) |
| 3 or 4 Children | 0 (0.0%) | 0 (0.0%) |
| 5 or more Children | 0 (0.0%) | 0 (0.0%) |
| Total | 2 (1.3%) | 2 (10.0%) |
Race in Rockaway Beach
The most populous races in Rockaway Beach are White / Caucasian (593 | 91.4%), Black / African American (46 | 7.1%), and Two or more Races (9 | 1.4%).
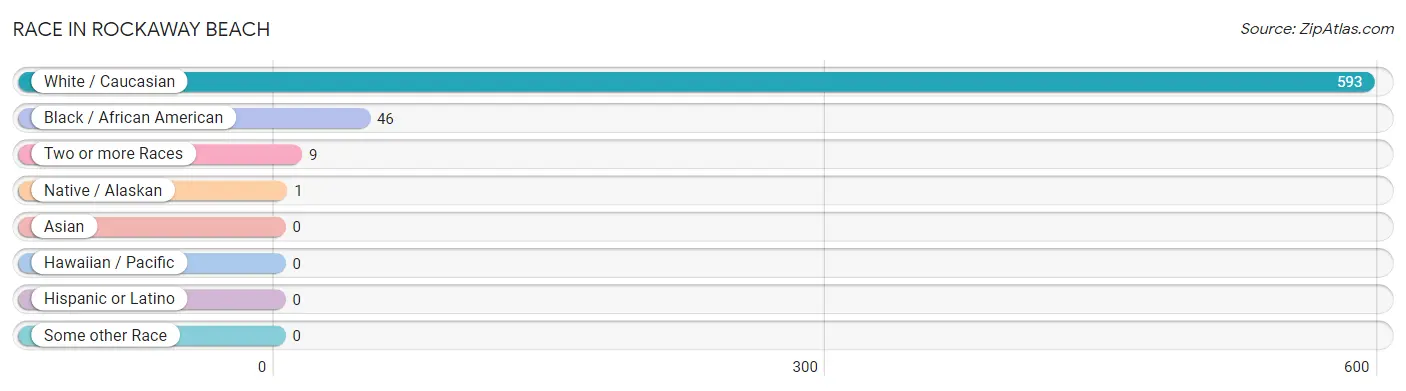
| Race | # Population | % Population |
| Asian | 0 | 0.0% |
| Black / African American | 46 | 7.1% |
| Hawaiian / Pacific | 0 | 0.0% |
| Hispanic or Latino | 0 | 0.0% |
| Native / Alaskan | 1 | 0.2% |
| White / Caucasian | 593 | 91.4% |
| Two or more Races | 9 | 1.4% |
| Some other Race | 0 | 0.0% |
| Total | 649 | 100.0% |
Ancestry in Rockaway Beach
The most populous ancestries reported in Rockaway Beach are English (92 | 14.2%), American (89 | 13.7%), Irish (75 | 11.6%), German (59 | 9.1%), and Dutch (43 | 6.6%), together accounting for 55.2% of all Rockaway Beach residents.
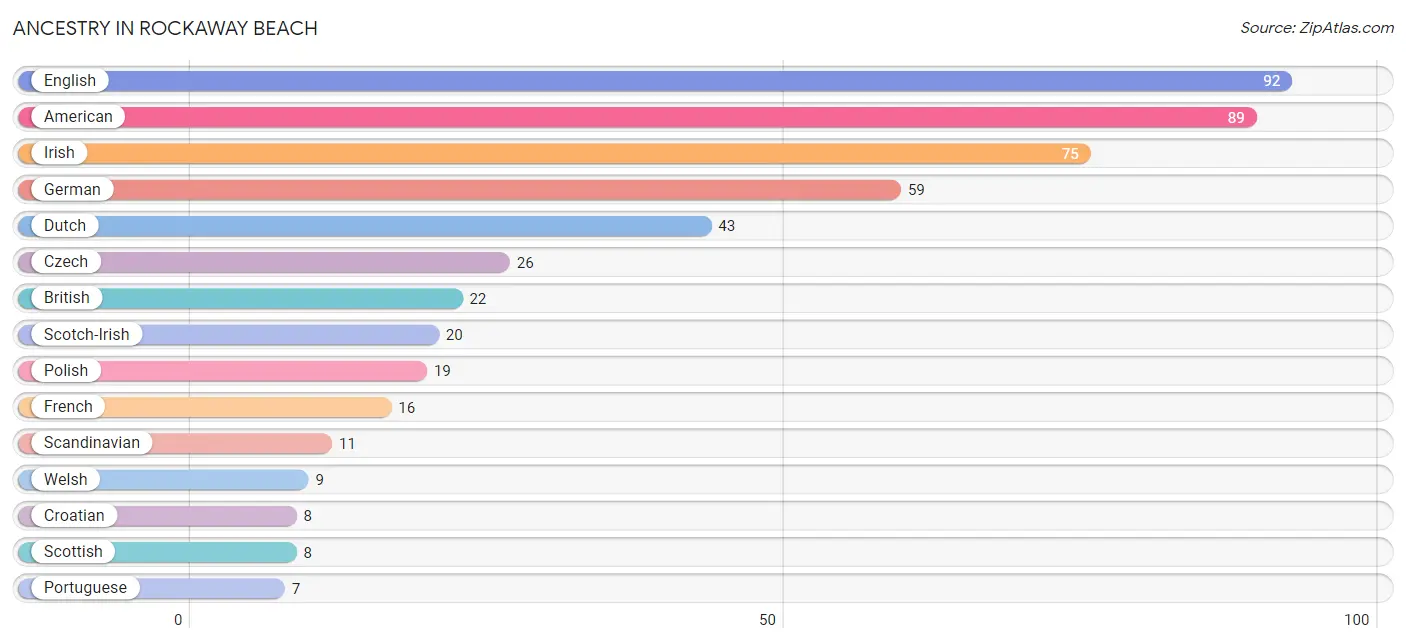
| Ancestry | # Population | % Population |
| American | 89 | 13.7% |
| British | 22 | 3.4% |
| Croatian | 8 | 1.2% |
| Czech | 26 | 4.0% |
| Danish | 4 | 0.6% |
| Dutch | 43 | 6.6% |
| English | 92 | 14.2% |
| European | 3 | 0.5% |
| French | 16 | 2.5% |
| German | 59 | 9.1% |
| Hungarian | 2 | 0.3% |
| Irish | 75 | 11.6% |
| Italian | 3 | 0.5% |
| Norwegian | 4 | 0.6% |
| Polish | 19 | 2.9% |
| Portuguese | 7 | 1.1% |
| Scandinavian | 11 | 1.7% |
| Scotch-Irish | 20 | 3.1% |
| Scottish | 8 | 1.2% |
| Swedish | 5 | 0.8% |
| Welsh | 9 | 1.4% | View All 21 Rows |
Immigrants in Rockaway Beach

| Immigration Origin | # Population | % Population | View All 0 Rows |
Sex and Age in Rockaway Beach
Sex and Age in Rockaway Beach
The most populous age groups in Rockaway Beach are 60 to 64 Years (53 | 16.9%) for men and 75 to 79 Years (59 | 17.6%) for women.
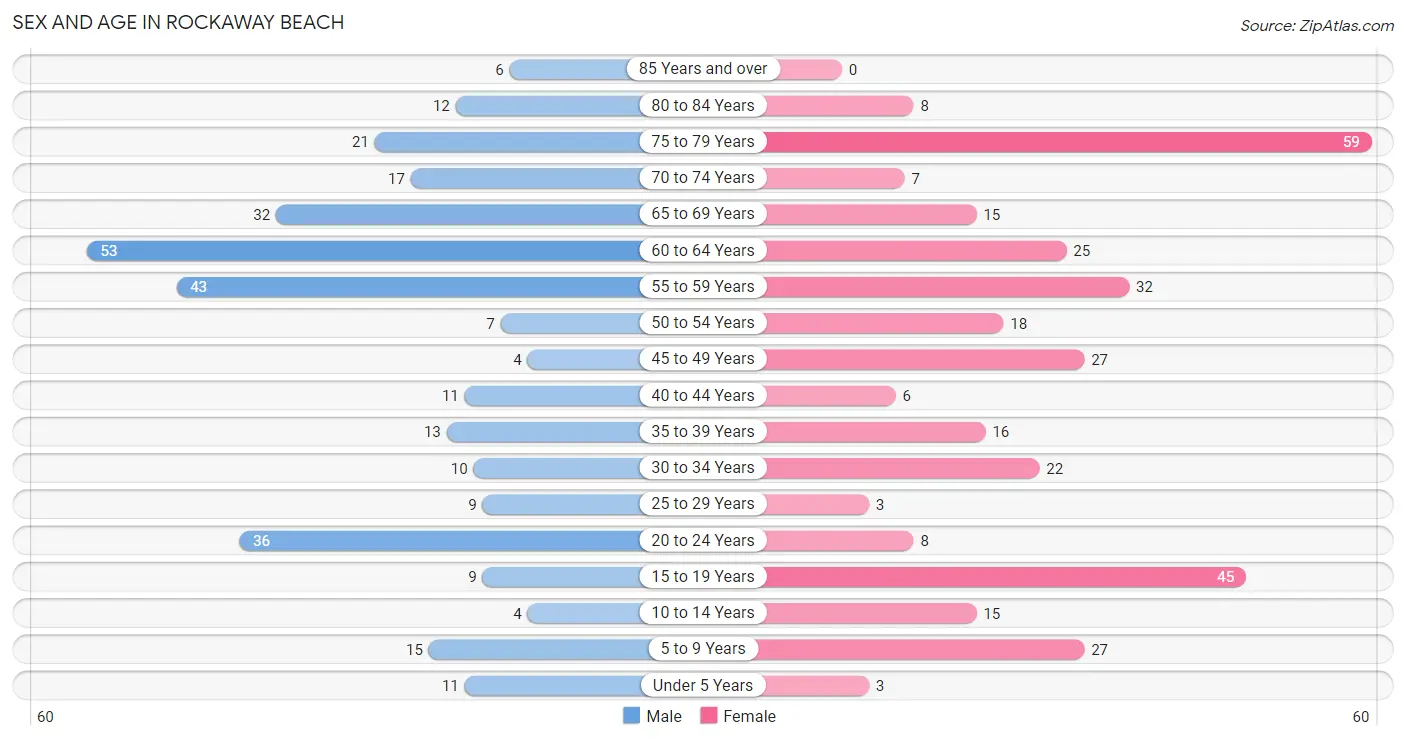
| Age Bracket | Male | Female |
| Under 5 Years | 11 (3.5%) | 3 (0.9%) |
| 5 to 9 Years | 15 (4.8%) | 27 (8.0%) |
| 10 to 14 Years | 4 (1.3%) | 15 (4.5%) |
| 15 to 19 Years | 9 (2.9%) | 45 (13.4%) |
| 20 to 24 Years | 36 (11.5%) | 8 (2.4%) |
| 25 to 29 Years | 9 (2.9%) | 3 (0.9%) |
| 30 to 34 Years | 10 (3.2%) | 22 (6.6%) |
| 35 to 39 Years | 13 (4.2%) | 16 (4.8%) |
| 40 to 44 Years | 11 (3.5%) | 6 (1.8%) |
| 45 to 49 Years | 4 (1.3%) | 27 (8.0%) |
| 50 to 54 Years | 7 (2.2%) | 18 (5.4%) |
| 55 to 59 Years | 43 (13.7%) | 32 (9.5%) |
| 60 to 64 Years | 53 (16.9%) | 25 (7.4%) |
| 65 to 69 Years | 32 (10.2%) | 15 (4.5%) |
| 70 to 74 Years | 17 (5.4%) | 7 (2.1%) |
| 75 to 79 Years | 21 (6.7%) | 59 (17.6%) |
| 80 to 84 Years | 12 (3.8%) | 8 (2.4%) |
| 85 Years and over | 6 (1.9%) | 0 (0.0%) |
| Total | 313 (100.0%) | 336 (100.0%) |
Families and Households in Rockaway Beach
Median Family Size in Rockaway Beach
The median family size in Rockaway Beach is 3.02 persons per family, with single male/father families (7 | 4.0%) accounting for the largest median family size of 3.14 persons per family. On the other hand, single female/mother families (13 | 7.4%) represent the smallest median family size with 2.92 persons per family.
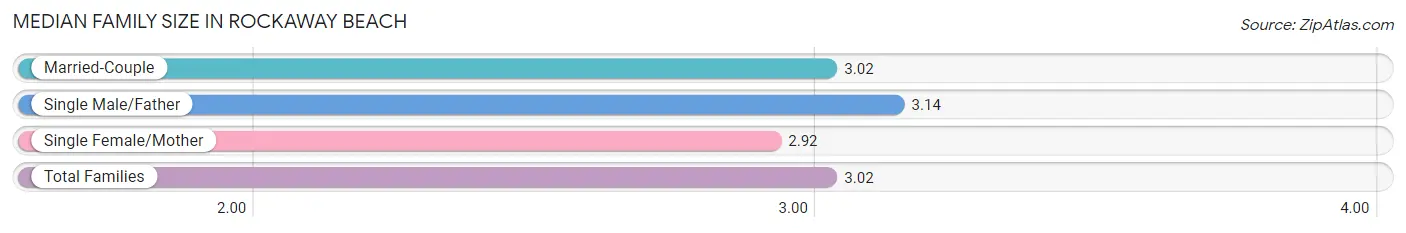
| Family Type | # Families | Family Size |
| Married-Couple | 156 (88.6%) | 3.02 |
| Single Male/Father | 7 (4.0%) | 3.14 |
| Single Female/Mother | 13 (7.4%) | 2.92 |
| Total Families | 176 (100.0%) | 3.02 |
Median Household Size in Rockaway Beach
The median household size in Rockaway Beach is 2.56 persons per household, with single female/mother households (13 | 5.1%) accounting for the largest median household size of 3.15 persons per household. non-family households (78 | 30.7%) represent the smallest median household size with 1.41 persons per household.
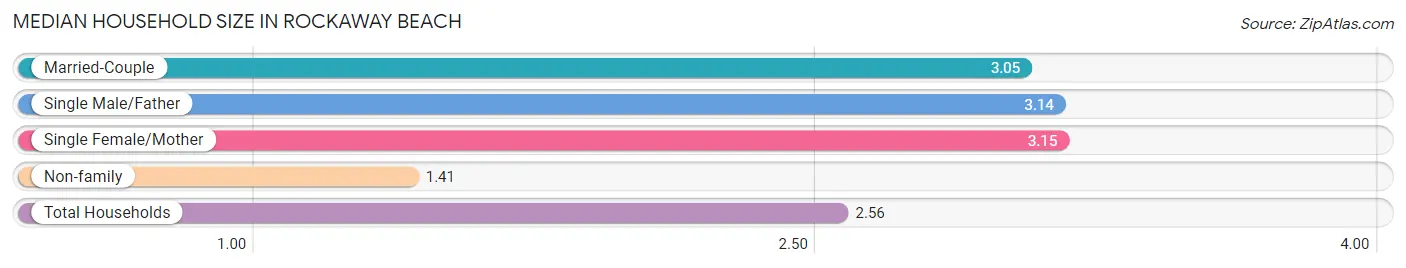
| Household Type | # Households | Household Size |
| Married-Couple | 156 (61.4%) | 3.05 |
| Single Male/Father | 7 (2.8%) | 3.14 |
| Single Female/Mother | 13 (5.1%) | 3.15 |
| Non-family | 78 (30.7%) | 1.41 |
| Total Households | 254 (100.0%) | 2.56 |
Household Size by Marriage Status in Rockaway Beach
Out of a total of 254 households in Rockaway Beach, 176 (69.3%) are family households, while 78 (30.7%) are nonfamily households. The most numerous type of family households are 2-person households, comprising 106, and the most common type of nonfamily households are 1-person households, comprising 55.
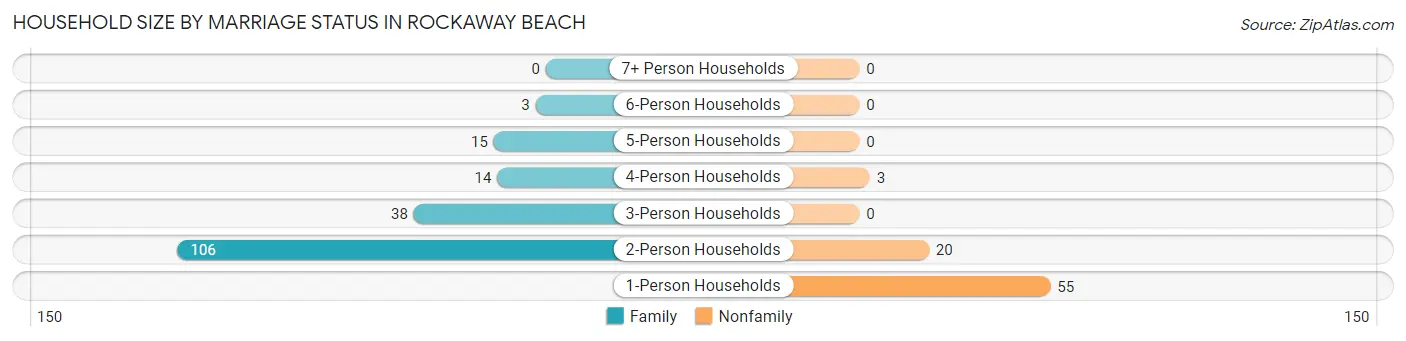
| Household Size | Family Households | Nonfamily Households |
| 1-Person Households | - | 55 (21.6%) |
| 2-Person Households | 106 (41.7%) | 20 (7.9%) |
| 3-Person Households | 38 (15.0%) | 0 (0.0%) |
| 4-Person Households | 14 (5.5%) | 3 (1.2%) |
| 5-Person Households | 15 (5.9%) | 0 (0.0%) |
| 6-Person Households | 3 (1.2%) | 0 (0.0%) |
| 7+ Person Households | 0 (0.0%) | 0 (0.0%) |
| Total | 176 (69.3%) | 78 (30.7%) |
Female Fertility in Rockaway Beach
Fertility by Age in Rockaway Beach
Average fertility rate in Rockaway Beach is 47.0 births per 1,000 women. Women in the age bracket of 20 to 34 years have the highest fertility rate with 182.0 births per 1,000 women. Women in the age bracket of 20 to 34 years acount for 100.0% of all women with births.
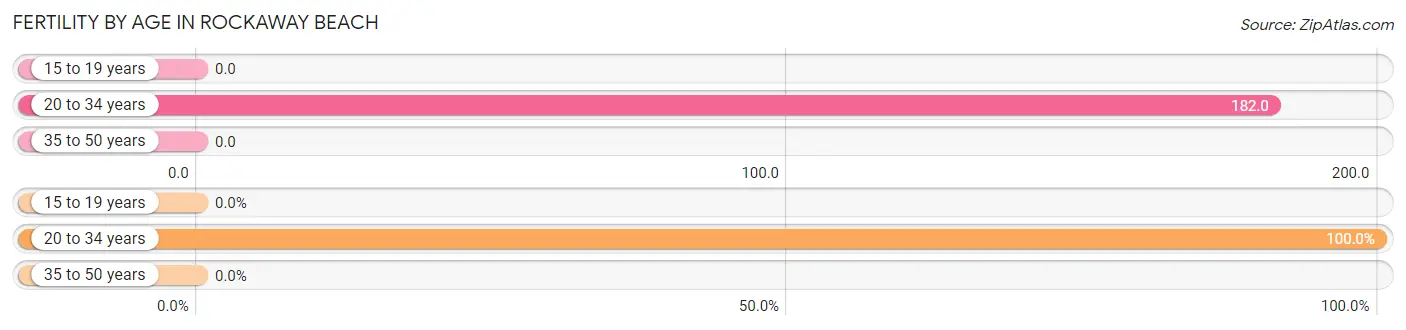
| Age Bracket | Women with Births | Births / 1,000 Women |
| 15 to 19 years | 0 (0.0%) | 0.0 |
| 20 to 34 years | 6 (100.0%) | 182.0 |
| 35 to 50 years | 0 (0.0%) | 0.0 |
| Total | 6 (100.0%) | 47.0 |
Fertility by Age by Marriage Status in Rockaway Beach
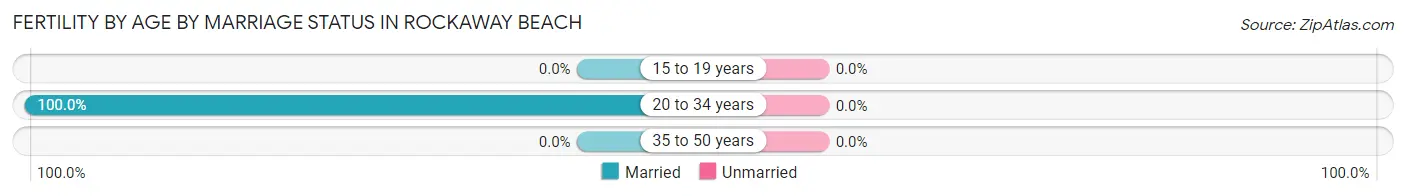
| Age Bracket | Married | Unmarried |
| 15 to 19 years | 0 (0.0%) | 0 (0.0%) |
| 20 to 34 years | 6 (100.0%) | 0 (0.0%) |
| 35 to 50 years | 0 (0.0%) | 0 (0.0%) |
| Total | 6 (100.0%) | 0 (0.0%) |
Fertility by Education in Rockaway Beach
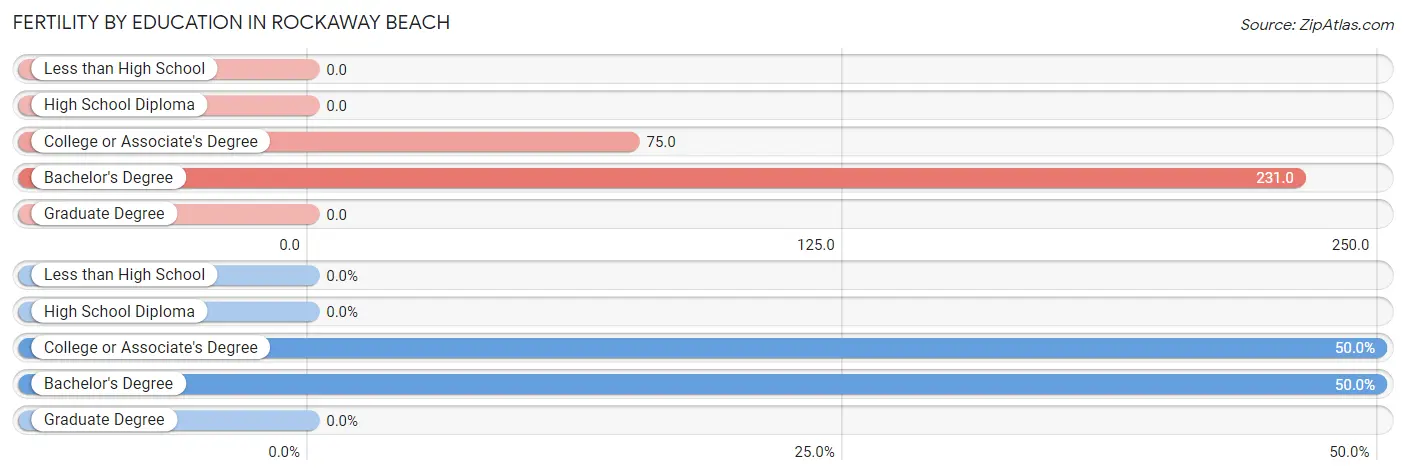
| Educational Attainment | Women with Births | Births / 1,000 Women |
| Less than High School | 0 (0.0%) | 0.0 |
| High School Diploma | 0 (0.0%) | 0.0 |
| College or Associate's Degree | 3 (50.0%) | 75.0 |
| Bachelor's Degree | 3 (50.0%) | 231.0 |
| Graduate Degree | 0 (0.0%) | 0.0 |
| Total | 6 (100.0%) | 47.0 |
Fertility by Education by Marriage Status in Rockaway Beach
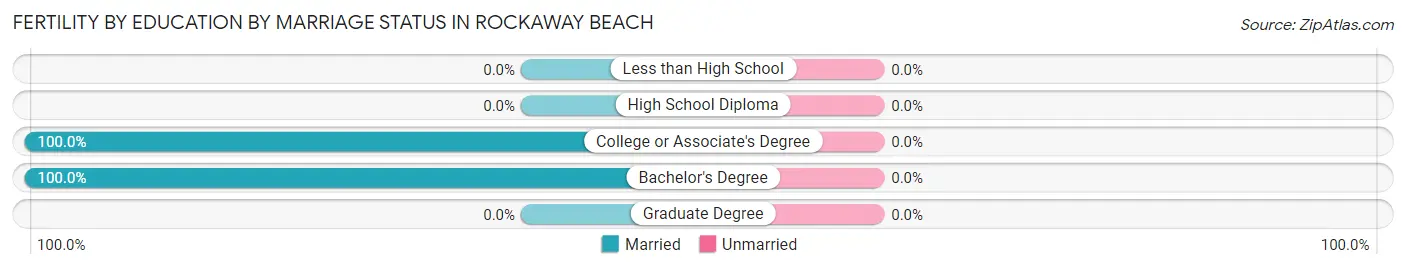
| Educational Attainment | Married | Unmarried |
| Less than High School | 0 (0.0%) | 0 (0.0%) |
| High School Diploma | 0 (0.0%) | 0 (0.0%) |
| College or Associate's Degree | 3 (100.0%) | 0 (0.0%) |
| Bachelor's Degree | 3 (100.0%) | 0 (0.0%) |
| Graduate Degree | 0 (0.0%) | 0 (0.0%) |
| Total | 6 (100.0%) | 0 (0.0%) |
Employment Characteristics in Rockaway Beach
Employment by Class of Employer in Rockaway Beach
Among the 239 employed individuals in Rockaway Beach, private company employees (185 | 77.4%), not-for-profit organizations (30 | 12.6%), and self-employed (not incorporated) (9 | 3.8%) make up the most common classes of employment.
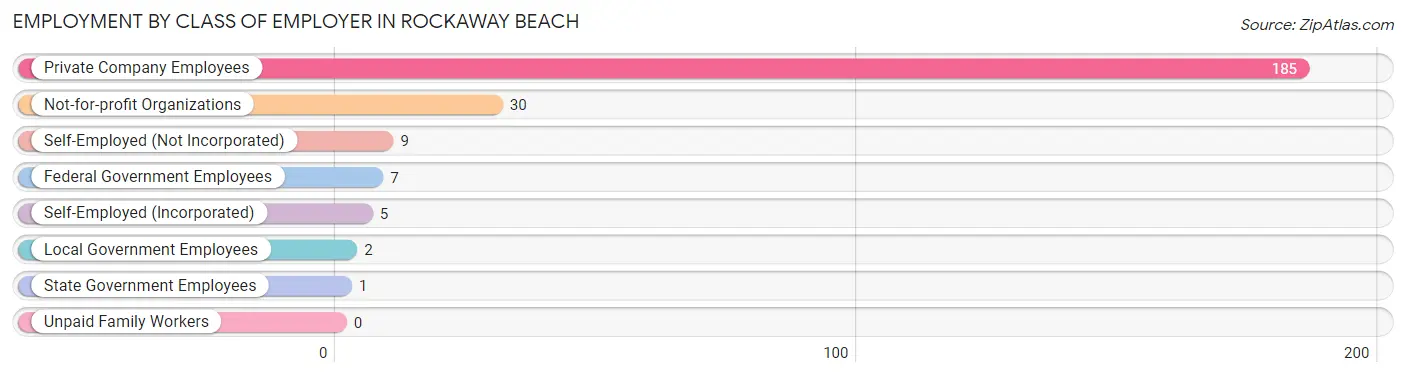
| Employer Class | # Employees | % Employees |
| Private Company Employees | 185 | 77.4% |
| Self-Employed (Incorporated) | 5 | 2.1% |
| Self-Employed (Not Incorporated) | 9 | 3.8% |
| Not-for-profit Organizations | 30 | 12.6% |
| Local Government Employees | 2 | 0.8% |
| State Government Employees | 1 | 0.4% |
| Federal Government Employees | 7 | 2.9% |
| Unpaid Family Workers | 0 | 0.0% |
| Total | 239 | 100.0% |
Employment Status by Age in Rockaway Beach
According to the labor force statistics for Rockaway Beach, out of the total population over 16 years of age (574), 45.1% or 259 individuals are in the labor force, with 6.7% or 17 of them unemployed. The age group with the highest labor force participation rate is 25 to 29 years, with 100.0% or 12 individuals in the labor force. Within the labor force, the 55 to 59 years age range has the highest percentage of unemployed individuals, with 19.4% or 7 of them being unemployed.
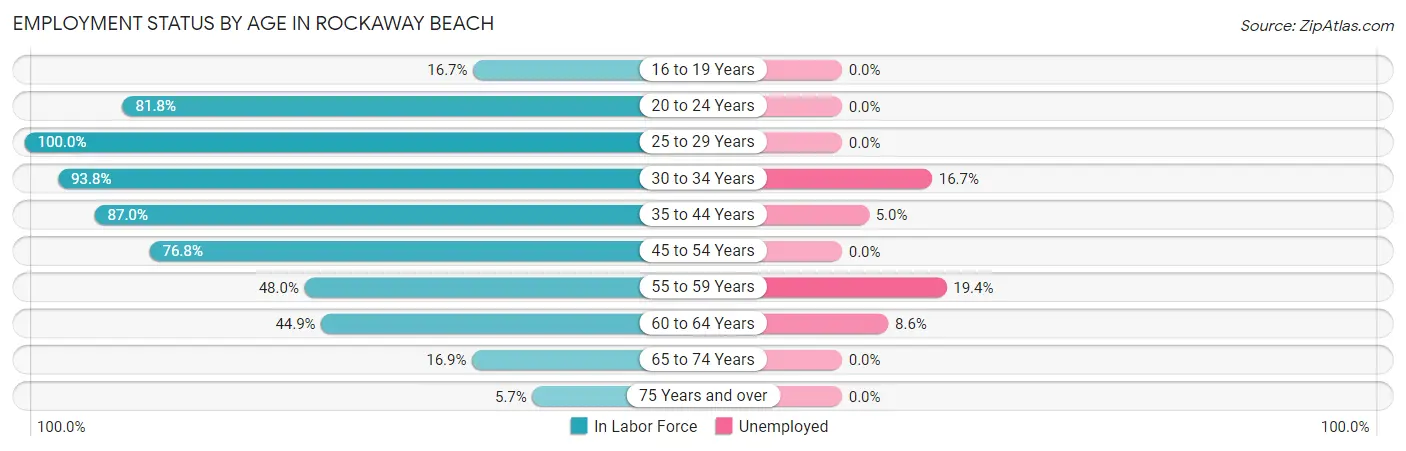
| Age Bracket | In Labor Force | Unemployed |
| 16 to 19 Years | 9 (16.7%) | 0 (0.0%) |
| 20 to 24 Years | 36 (81.8%) | 0 (0.0%) |
| 25 to 29 Years | 12 (100.0%) | 0 (0.0%) |
| 30 to 34 Years | 30 (93.8%) | 5 (16.7%) |
| 35 to 44 Years | 40 (87.0%) | 2 (5.0%) |
| 45 to 54 Years | 43 (76.8%) | 0 (0.0%) |
| 55 to 59 Years | 36 (48.0%) | 7 (19.4%) |
| 60 to 64 Years | 35 (44.9%) | 3 (8.6%) |
| 65 to 74 Years | 12 (16.9%) | 0 (0.0%) |
| 75 Years and over | 6 (5.7%) | 0 (0.0%) |
| Total | 259 (45.1%) | 17 (6.7%) |
Employment Status by Educational Attainment in Rockaway Beach
According to labor force statistics for Rockaway Beach, 65.6% of individuals (196) out of the total population between 25 and 64 years of age (299) are in the labor force, with 8.7% or 17 of them being unemployed. The group with the highest labor force participation rate are those with the educational attainment of bachelor's degree or higher, with 70.6% or 24 individuals in the labor force. Within the labor force, individuals with bachelor's degree or higher education have the highest percentage of unemployment, with 20.8% or 5 of them being unemployed.
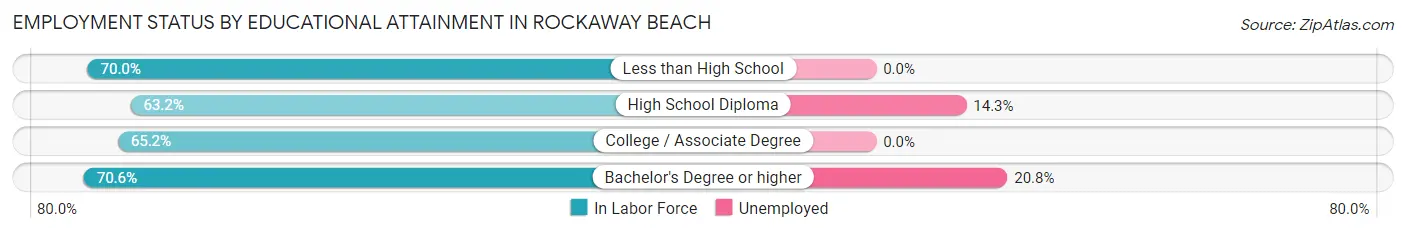
| Educational Attainment | In Labor Force | Unemployed |
| Less than High School | 28 (70.0%) | 0 (0.0%) |
| High School Diploma | 84 (63.2%) | 19 (14.3%) |
| College / Associate Degree | 60 (65.2%) | 0 (0.0%) |
| Bachelor's Degree or higher | 24 (70.6%) | 7 (20.8%) |
| Total | 196 (65.6%) | 26 (8.7%) |
Employment Occupations by Sex in Rockaway Beach
Management, Business, Science and Arts Occupations
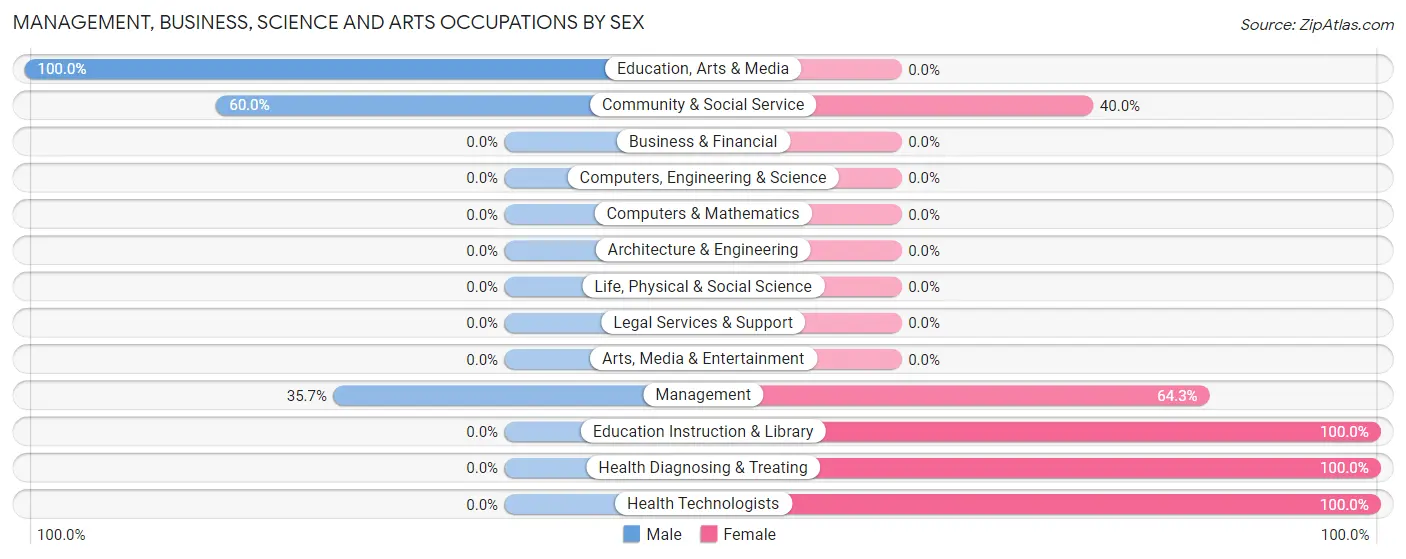
The most common Management, Business, Science and Arts occupations in Rockaway Beach are Community & Social Service (15 | 6.3%), Management (14 | 5.9%), Education, Arts & Media (9 | 3.8%), Health Diagnosing & Treating (9 | 3.8%), and Health Technologists (8 | 3.4%).
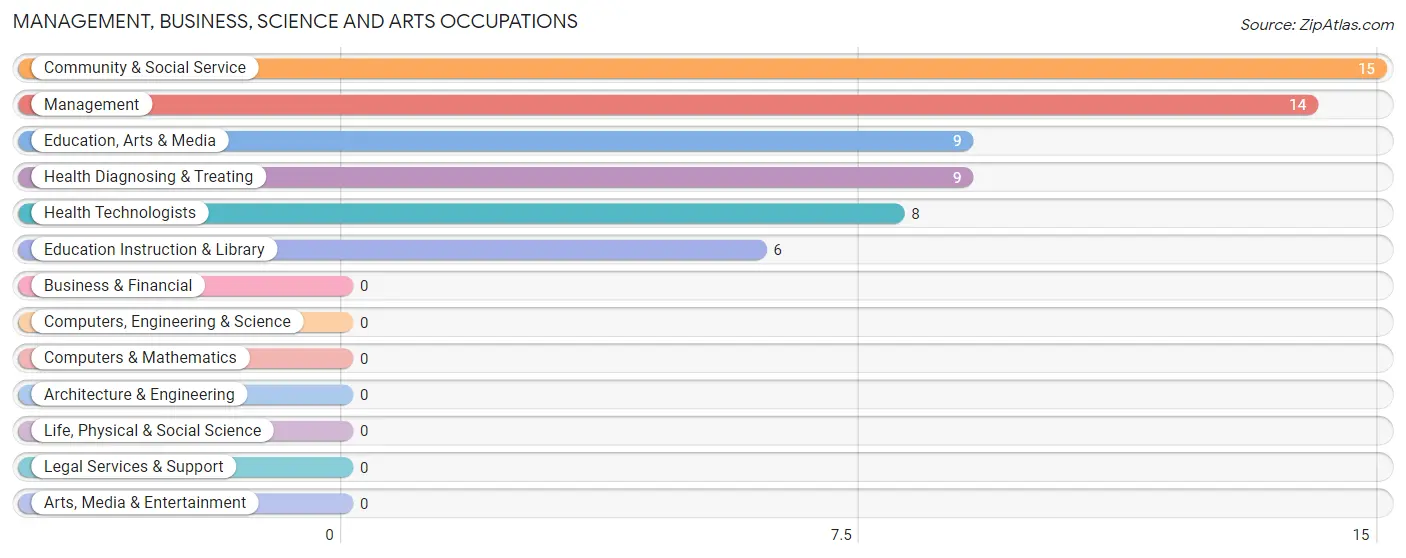
Management, Business, Science and Arts Occupations by Sex
Within the Management, Business, Science and Arts occupations in Rockaway Beach, the most male-oriented occupations are Education, Arts & Media (100.0%), Community & Social Service (60.0%), and Management (35.7%), while the most female-oriented occupations are Education Instruction & Library (100.0%), Health Diagnosing & Treating (100.0%), and Health Technologists (100.0%).
| Occupation | Male | Female |
| Management | 5 (35.7%) | 9 (64.3%) |
| Business & Financial | 0 (0.0%) | 0 (0.0%) |
| Computers, Engineering & Science | 0 (0.0%) | 0 (0.0%) |
| Computers & Mathematics | 0 (0.0%) | 0 (0.0%) |
| Architecture & Engineering | 0 (0.0%) | 0 (0.0%) |
| Life, Physical & Social Science | 0 (0.0%) | 0 (0.0%) |
| Community & Social Service | 9 (60.0%) | 6 (40.0%) |
| Education, Arts & Media | 9 (100.0%) | 0 (0.0%) |
| Legal Services & Support | 0 (0.0%) | 0 (0.0%) |
| Education Instruction & Library | 0 (0.0%) | 6 (100.0%) |
| Arts, Media & Entertainment | 0 (0.0%) | 0 (0.0%) |
| Health Diagnosing & Treating | 0 (0.0%) | 9 (100.0%) |
| Health Technologists | 0 (0.0%) | 8 (100.0%) |
| Total (Category) | 14 (36.8%) | 24 (63.2%) |
| Total (Overall) | 146 (61.6%) | 91 (38.4%) |
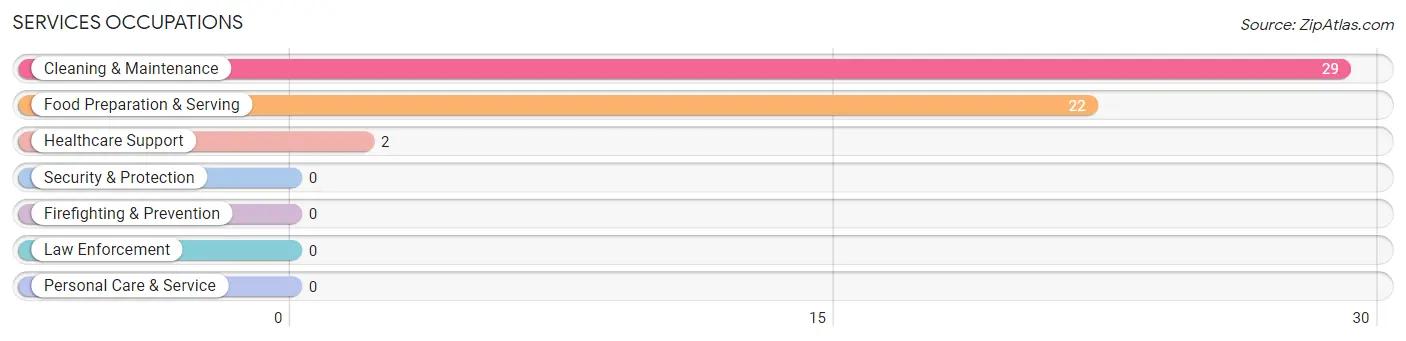
Services Occupations
The most common Services occupations in Rockaway Beach are Cleaning & Maintenance (29 | 12.2%), Food Preparation & Serving (22 | 9.3%), and Healthcare Support (2 | 0.8%).
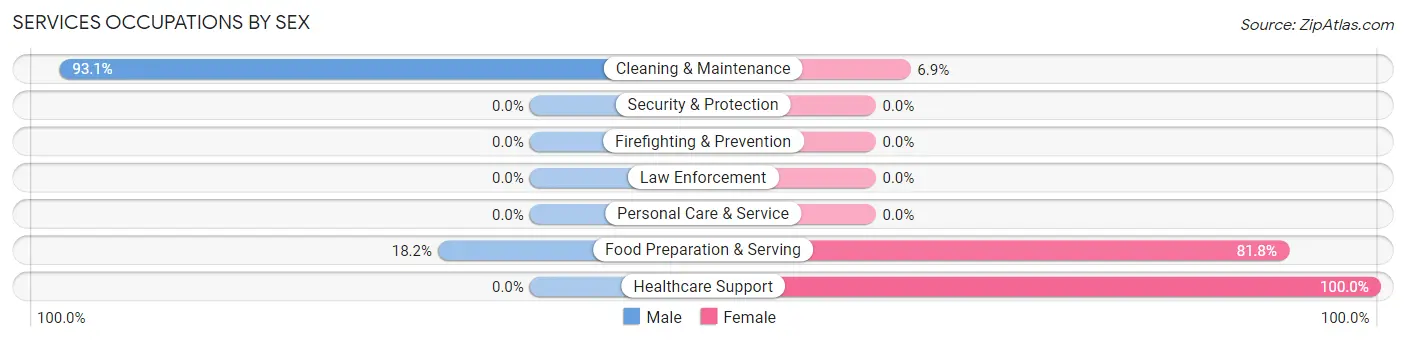
Services Occupations by Sex
Within the Services occupations in Rockaway Beach, the most male-oriented occupations are Cleaning & Maintenance (93.1%), and Food Preparation & Serving (18.2%), while the most female-oriented occupations are Healthcare Support (100.0%), Food Preparation & Serving (81.8%), and Cleaning & Maintenance (6.9%).
| Occupation | Male | Female |
| Healthcare Support | 0 (0.0%) | 2 (100.0%) |
| Security & Protection | 0 (0.0%) | 0 (0.0%) |
| Firefighting & Prevention | 0 (0.0%) | 0 (0.0%) |
| Law Enforcement | 0 (0.0%) | 0 (0.0%) |
| Food Preparation & Serving | 4 (18.2%) | 18 (81.8%) |
| Cleaning & Maintenance | 27 (93.1%) | 2 (6.9%) |
| Personal Care & Service | 0 (0.0%) | 0 (0.0%) |
| Total (Category) | 31 (58.5%) | 22 (41.5%) |
| Total (Overall) | 146 (61.6%) | 91 (38.4%) |
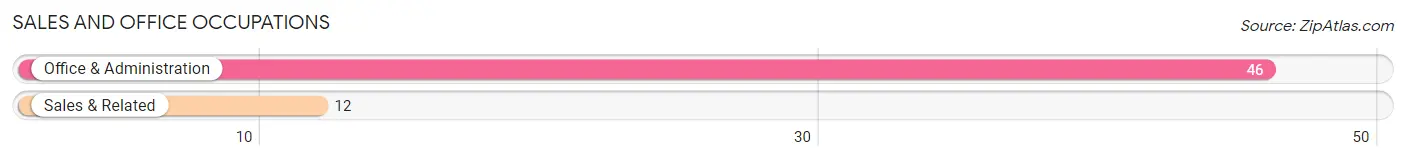
Sales and Office Occupations
The most common Sales and Office occupations in Rockaway Beach are Office & Administration (46 | 19.4%), and Sales & Related (12 | 5.1%).
Sales and Office Occupations by Sex
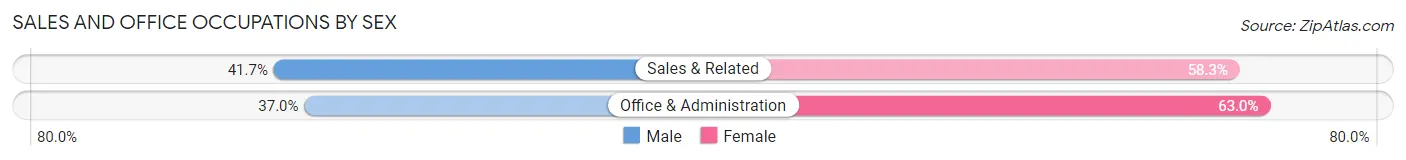
| Occupation | Male | Female |
| Sales & Related | 5 (41.7%) | 7 (58.3%) |
| Office & Administration | 17 (37.0%) | 29 (63.0%) |
| Total (Category) | 22 (37.9%) | 36 (62.1%) |
| Total (Overall) | 146 (61.6%) | 91 (38.4%) |
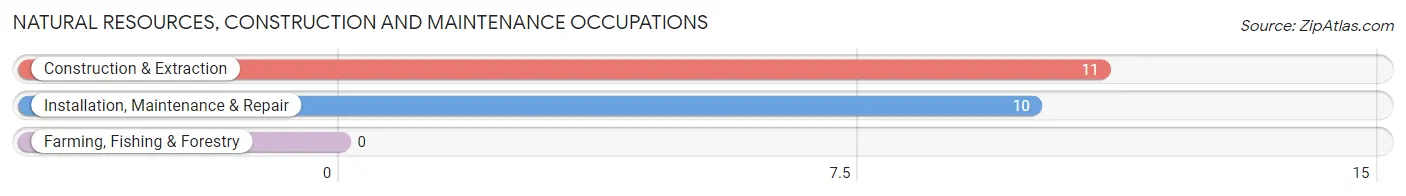
Natural Resources, Construction and Maintenance Occupations
The most common Natural Resources, Construction and Maintenance occupations in Rockaway Beach are Construction & Extraction (11 | 4.6%), and Installation, Maintenance & Repair (10 | 4.2%).
Natural Resources, Construction and Maintenance Occupations by Sex
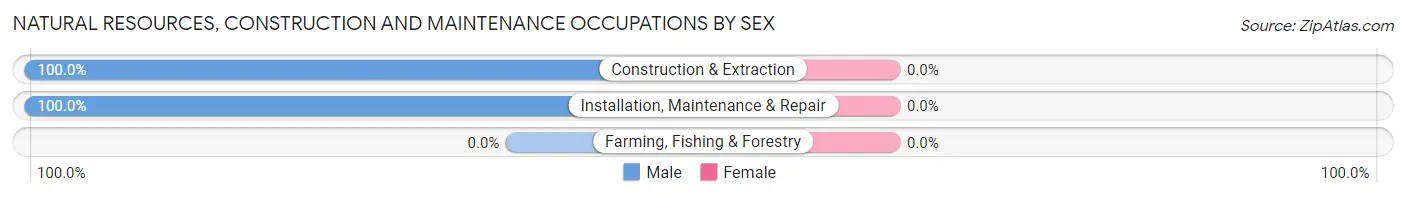
| Occupation | Male | Female |
| Farming, Fishing & Forestry | 0 (0.0%) | 0 (0.0%) |
| Construction & Extraction | 11 (100.0%) | 0 (0.0%) |
| Installation, Maintenance & Repair | 10 (100.0%) | 0 (0.0%) |
| Total (Category) | 21 (100.0%) | 0 (0.0%) |
| Total (Overall) | 146 (61.6%) | 91 (38.4%) |
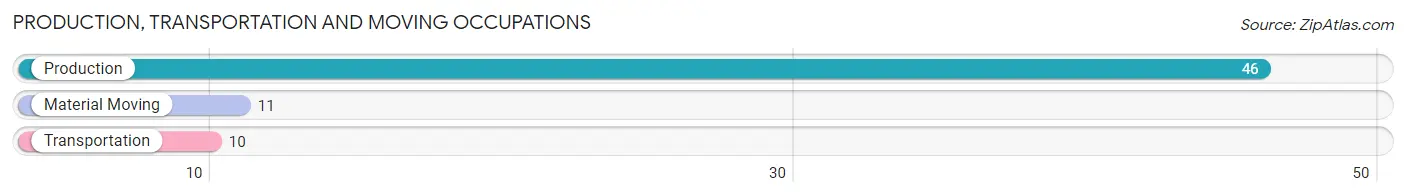
Production, Transportation and Moving Occupations
The most common Production, Transportation and Moving occupations in Rockaway Beach are Production (46 | 19.4%), Material Moving (11 | 4.6%), and Transportation (10 | 4.2%).
Production, Transportation and Moving Occupations by Sex
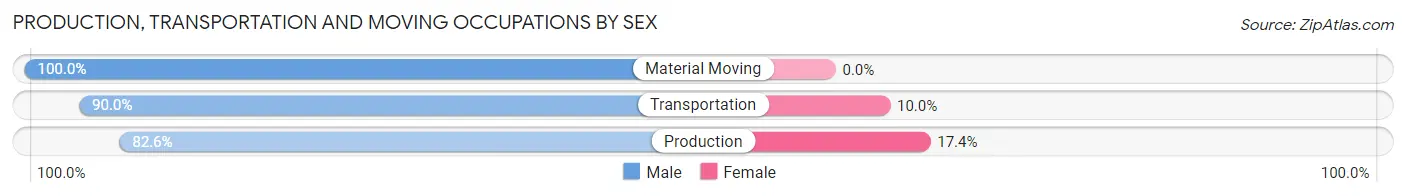
| Occupation | Male | Female |
| Production | 38 (82.6%) | 8 (17.4%) |
| Transportation | 9 (90.0%) | 1 (10.0%) |
| Material Moving | 11 (100.0%) | 0 (0.0%) |
| Total (Category) | 58 (86.6%) | 9 (13.4%) |
| Total (Overall) | 146 (61.6%) | 91 (38.4%) |
Employment Industries by Sex in Rockaway Beach
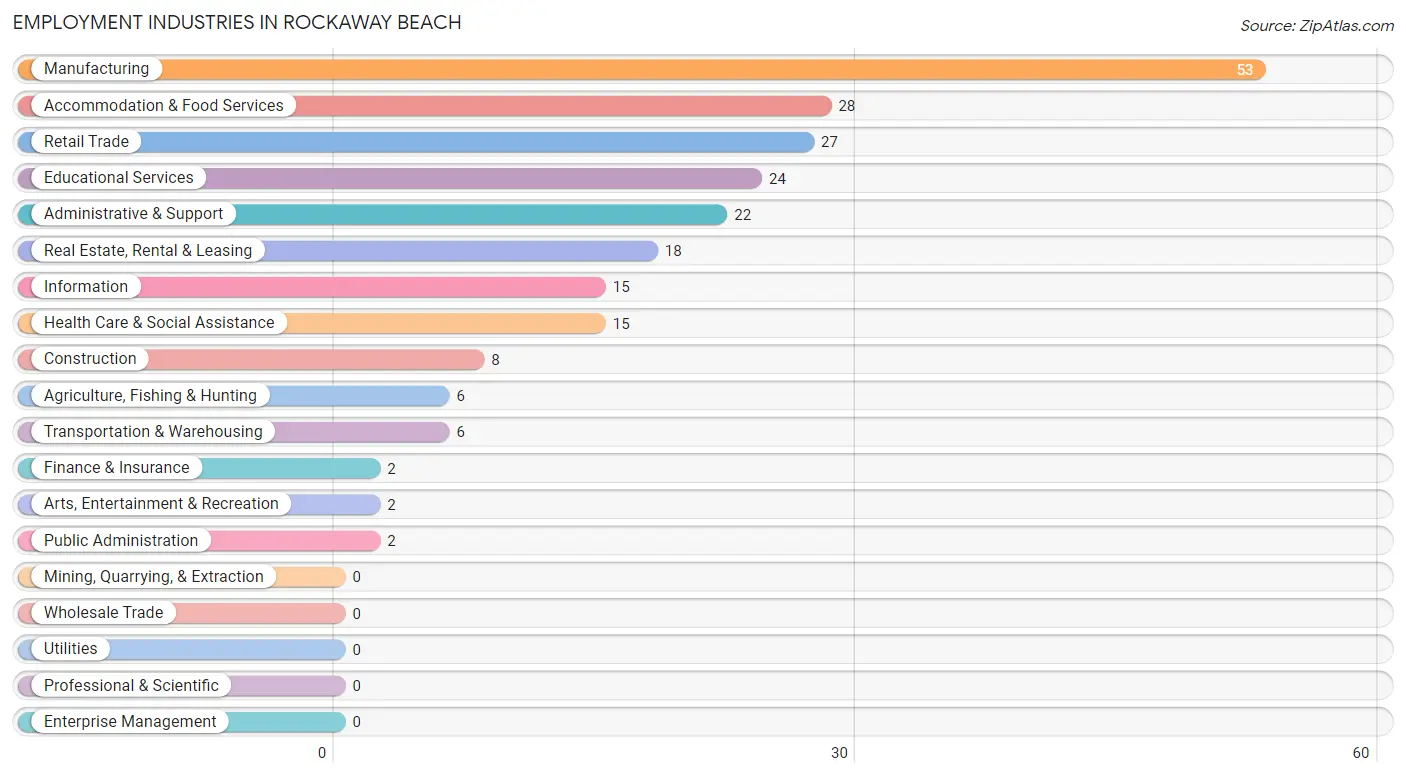
Employment Industries in Rockaway Beach
The major employment industries in Rockaway Beach include Manufacturing (53 | 22.4%), Accommodation & Food Services (28 | 11.8%), Retail Trade (27 | 11.4%), Educational Services (24 | 10.1%), and Administrative & Support (22 | 9.3%).
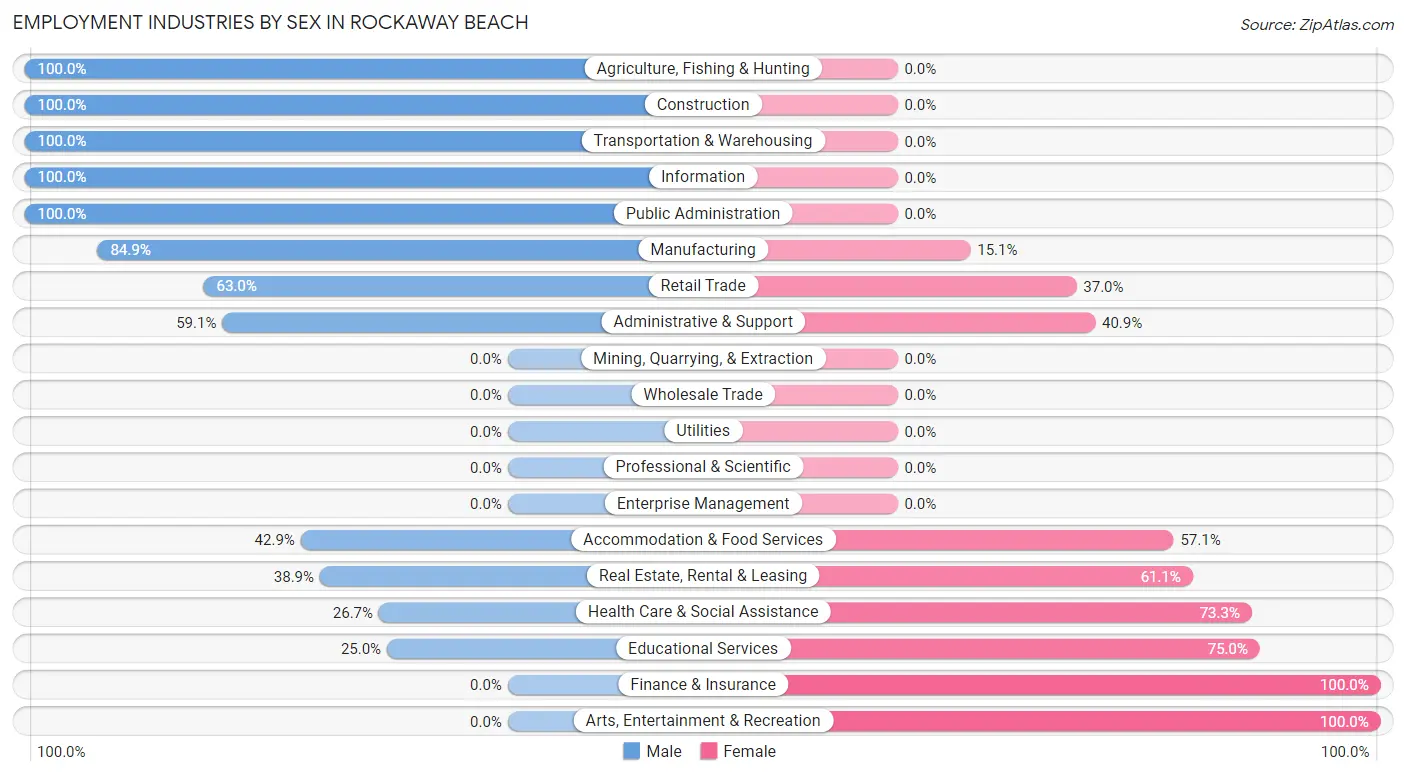
Employment Industries by Sex in Rockaway Beach
The Rockaway Beach industries that see more men than women are Agriculture, Fishing & Hunting (100.0%), Construction (100.0%), and Transportation & Warehousing (100.0%), whereas the industries that tend to have a higher number of women are Finance & Insurance (100.0%), Arts, Entertainment & Recreation (100.0%), and Educational Services (75.0%).
| Industry | Male | Female |
| Agriculture, Fishing & Hunting | 6 (100.0%) | 0 (0.0%) |
| Mining, Quarrying, & Extraction | 0 (0.0%) | 0 (0.0%) |
| Construction | 8 (100.0%) | 0 (0.0%) |
| Manufacturing | 45 (84.9%) | 8 (15.1%) |
| Wholesale Trade | 0 (0.0%) | 0 (0.0%) |
| Retail Trade | 17 (63.0%) | 10 (37.0%) |
| Transportation & Warehousing | 6 (100.0%) | 0 (0.0%) |
| Utilities | 0 (0.0%) | 0 (0.0%) |
| Information | 15 (100.0%) | 0 (0.0%) |
| Finance & Insurance | 0 (0.0%) | 2 (100.0%) |
| Real Estate, Rental & Leasing | 7 (38.9%) | 11 (61.1%) |
| Professional & Scientific | 0 (0.0%) | 0 (0.0%) |
| Enterprise Management | 0 (0.0%) | 0 (0.0%) |
| Administrative & Support | 13 (59.1%) | 9 (40.9%) |
| Educational Services | 6 (25.0%) | 18 (75.0%) |
| Health Care & Social Assistance | 4 (26.7%) | 11 (73.3%) |
| Arts, Entertainment & Recreation | 0 (0.0%) | 2 (100.0%) |
| Accommodation & Food Services | 12 (42.9%) | 16 (57.1%) |
| Public Administration | 2 (100.0%) | 0 (0.0%) |
| Total | 146 (61.6%) | 91 (38.4%) |
Education in Rockaway Beach
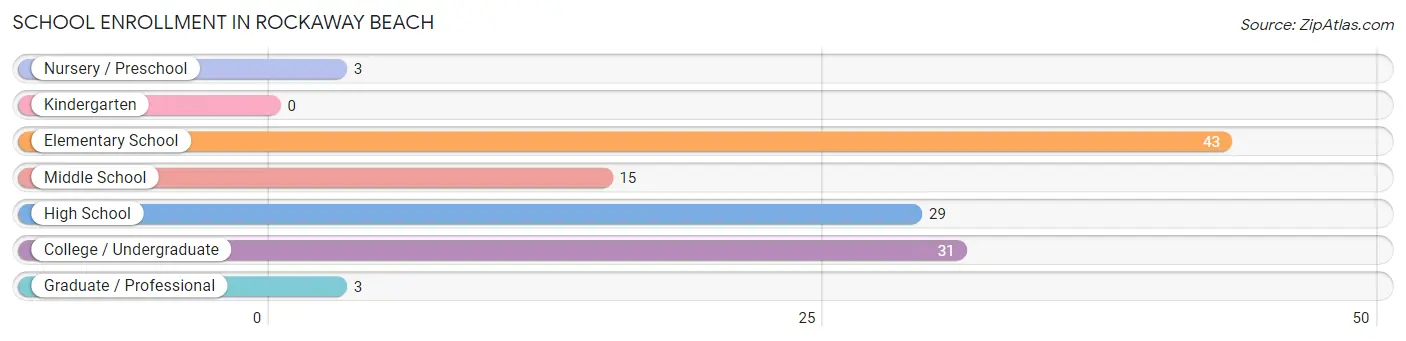
School Enrollment in Rockaway Beach
The most common levels of schooling among the 124 students in Rockaway Beach are elementary school (43 | 34.7%), college / undergraduate (31 | 25.0%), and high school (29 | 23.4%).
| School Level | # Students | % Students |
| Nursery / Preschool | 3 | 2.4% |
| Kindergarten | 0 | 0.0% |
| Elementary School | 43 | 34.7% |
| Middle School | 15 | 12.1% |
| High School | 29 | 23.4% |
| College / Undergraduate | 31 | 25.0% |
| Graduate / Professional | 3 | 2.4% |
| Total | 124 | 100.0% |
School Enrollment by Age by Funding Source in Rockaway Beach
Out of a total of 124 students who are enrolled in schools in Rockaway Beach, 3 (2.4%) attend a private institution, while the remaining 121 (97.6%) are enrolled in public schools. The age group of 25 to 34 year olds has the highest likelihood of being enrolled in private schools, with 3 (100.0% in the age bracket) enrolled. Conversely, the age group of 3 to 4 year olds has the lowest likelihood of being enrolled in a private school, with 3 (100.0% in the age bracket) attending a public institution.
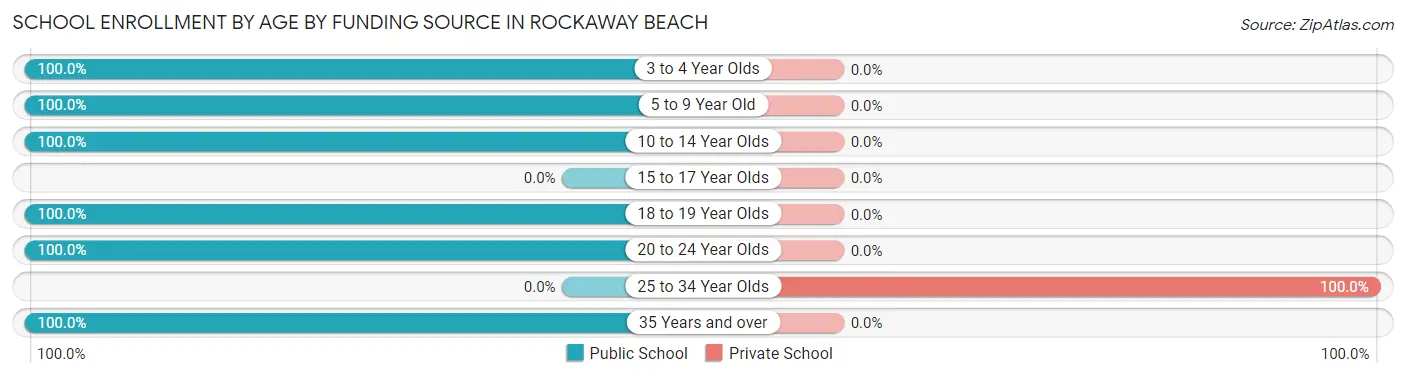
| Age Bracket | Public School | Private School |
| 3 to 4 Year Olds | 3 (100.0%) | 0 (0.0%) |
| 5 to 9 Year Old | 39 (100.0%) | 0 (0.0%) |
| 10 to 14 Year Olds | 19 (100.0%) | 0 (0.0%) |
| 15 to 17 Year Olds | 0 (0.0%) | 0 (0.0%) |
| 18 to 19 Year Olds | 49 (100.0%) | 0 (0.0%) |
| 20 to 24 Year Olds | 5 (100.0%) | 0 (0.0%) |
| 25 to 34 Year Olds | 0 (0.0%) | 3 (100.0%) |
| 35 Years and over | 6 (100.0%) | 0 (0.0%) |
| Total | 121 (97.6%) | 3 (2.4%) |
Educational Attainment by Field of Study in Rockaway Beach
Bio, nature & agricultural (24 | 22.2%), arts & humanities (24 | 22.2%), liberal arts & history (18 | 16.7%), psychology (13 | 12.0%), and education (10 | 9.3%) are the most common fields of study among 108 individuals in Rockaway Beach who have obtained a bachelor's degree or higher.
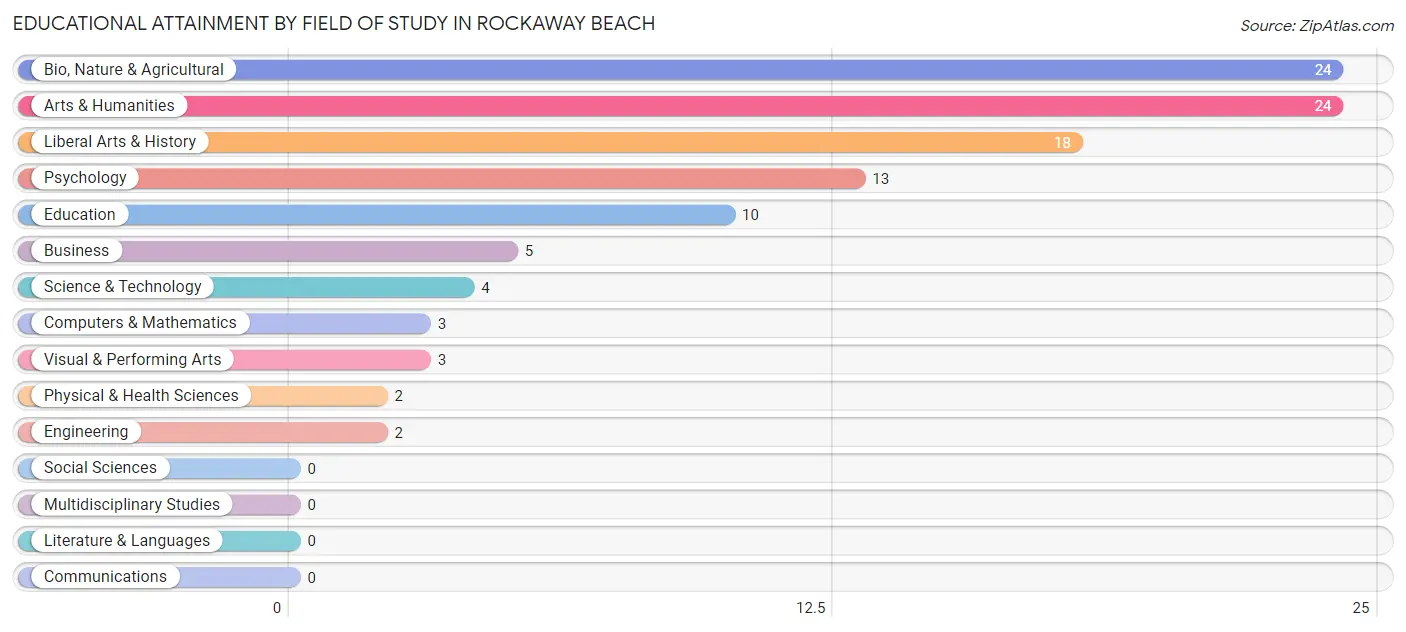
| Field of Study | # Graduates | % Graduates |
| Computers & Mathematics | 3 | 2.8% |
| Bio, Nature & Agricultural | 24 | 22.2% |
| Physical & Health Sciences | 2 | 1.8% |
| Psychology | 13 | 12.0% |
| Social Sciences | 0 | 0.0% |
| Engineering | 2 | 1.8% |
| Multidisciplinary Studies | 0 | 0.0% |
| Science & Technology | 4 | 3.7% |
| Business | 5 | 4.6% |
| Education | 10 | 9.3% |
| Literature & Languages | 0 | 0.0% |
| Liberal Arts & History | 18 | 16.7% |
| Visual & Performing Arts | 3 | 2.8% |
| Communications | 0 | 0.0% |
| Arts & Humanities | 24 | 22.2% |
| Total | 108 | 100.0% |
Transportation & Commute in Rockaway Beach
Vehicle Availability by Sex in Rockaway Beach
The most prevalent vehicle ownership categories in Rockaway Beach are males with 2 vehicles (50, accounting for 33.1%) and females with 2 vehicles (41, making up 56.8%).
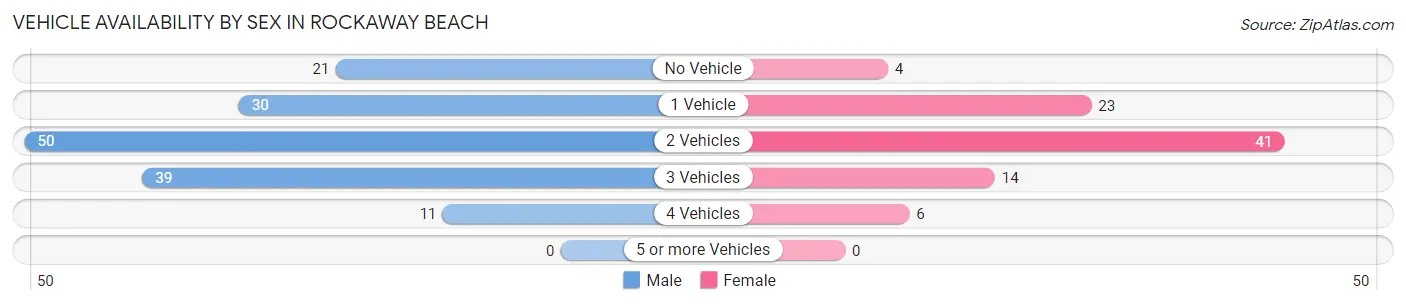
| Vehicles Available | Male | Female |
| No Vehicle | 21 (13.9%) | 4 (4.5%) |
| 1 Vehicle | 30 (19.9%) | 23 (26.1%) |
| 2 Vehicles | 50 (33.1%) | 41 (46.6%) |
| 3 Vehicles | 39 (25.8%) | 14 (15.9%) |
| 4 Vehicles | 11 (7.3%) | 6 (6.8%) |
| 5 or more Vehicles | 0 (0.0%) | 0 (0.0%) |
| Total | 151 (100.0%) | 88 (100.0%) |
Commute Time in Rockaway Beach
The most frequently occuring commute durations in Rockaway Beach are 25 to 29 minutes (52 commuters, 22.5%), 20 to 24 minutes (31 commuters, 13.4%), and 60 to 89 minutes (30 commuters, 13.0%).
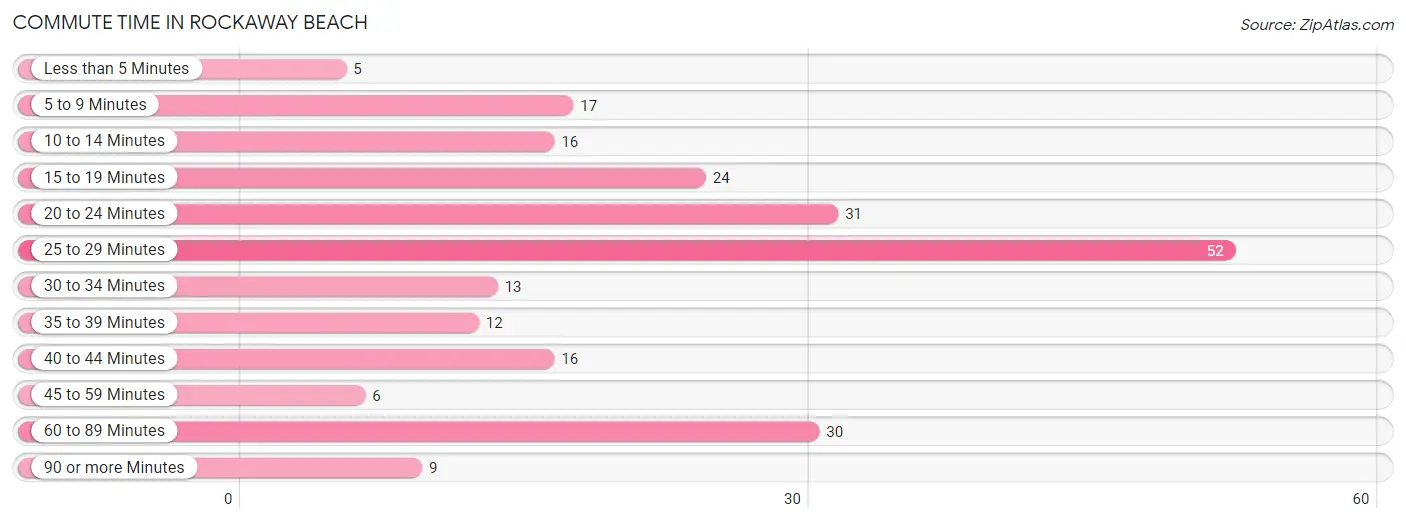
| Commute Time | # Commuters | % Commuters |
| Less than 5 Minutes | 5 | 2.2% |
| 5 to 9 Minutes | 17 | 7.4% |
| 10 to 14 Minutes | 16 | 6.9% |
| 15 to 19 Minutes | 24 | 10.4% |
| 20 to 24 Minutes | 31 | 13.4% |
| 25 to 29 Minutes | 52 | 22.5% |
| 30 to 34 Minutes | 13 | 5.6% |
| 35 to 39 Minutes | 12 | 5.2% |
| 40 to 44 Minutes | 16 | 6.9% |
| 45 to 59 Minutes | 6 | 2.6% |
| 60 to 89 Minutes | 30 | 13.0% |
| 90 or more Minutes | 9 | 3.9% |
Commute Time by Sex in Rockaway Beach
The most common commute times in Rockaway Beach are 25 to 29 minutes (43 commuters, 29.4%) for males and 20 to 24 minutes (27 commuters, 31.8%) for females.
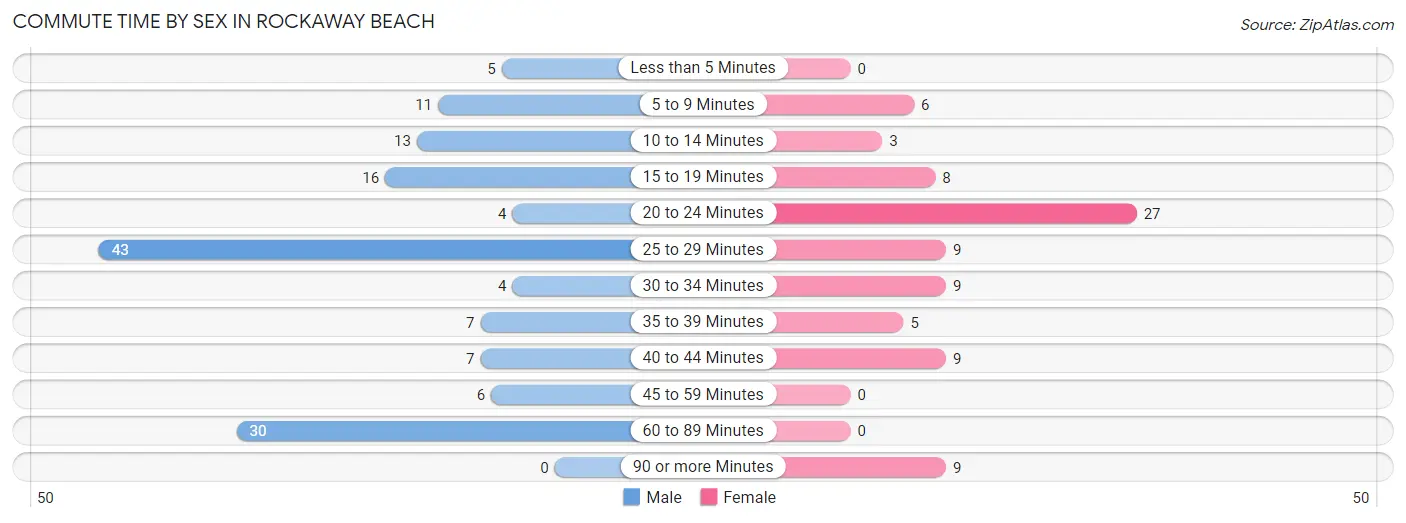
| Commute Time | Male | Female |
| Less than 5 Minutes | 5 (3.4%) | 0 (0.0%) |
| 5 to 9 Minutes | 11 (7.5%) | 6 (7.1%) |
| 10 to 14 Minutes | 13 (8.9%) | 3 (3.5%) |
| 15 to 19 Minutes | 16 (11.0%) | 8 (9.4%) |
| 20 to 24 Minutes | 4 (2.7%) | 27 (31.8%) |
| 25 to 29 Minutes | 43 (29.4%) | 9 (10.6%) |
| 30 to 34 Minutes | 4 (2.7%) | 9 (10.6%) |
| 35 to 39 Minutes | 7 (4.8%) | 5 (5.9%) |
| 40 to 44 Minutes | 7 (4.8%) | 9 (10.6%) |
| 45 to 59 Minutes | 6 (4.1%) | 0 (0.0%) |
| 60 to 89 Minutes | 30 (20.5%) | 0 (0.0%) |
| 90 or more Minutes | 0 (0.0%) | 9 (10.6%) |
Time of Departure to Work by Sex in Rockaway Beach
The most frequent times of departure to work in Rockaway Beach are 5:30 AM to 5:59 AM (28, 19.2%) for males and 7:00 AM to 7:29 AM (23, 27.1%) for females.
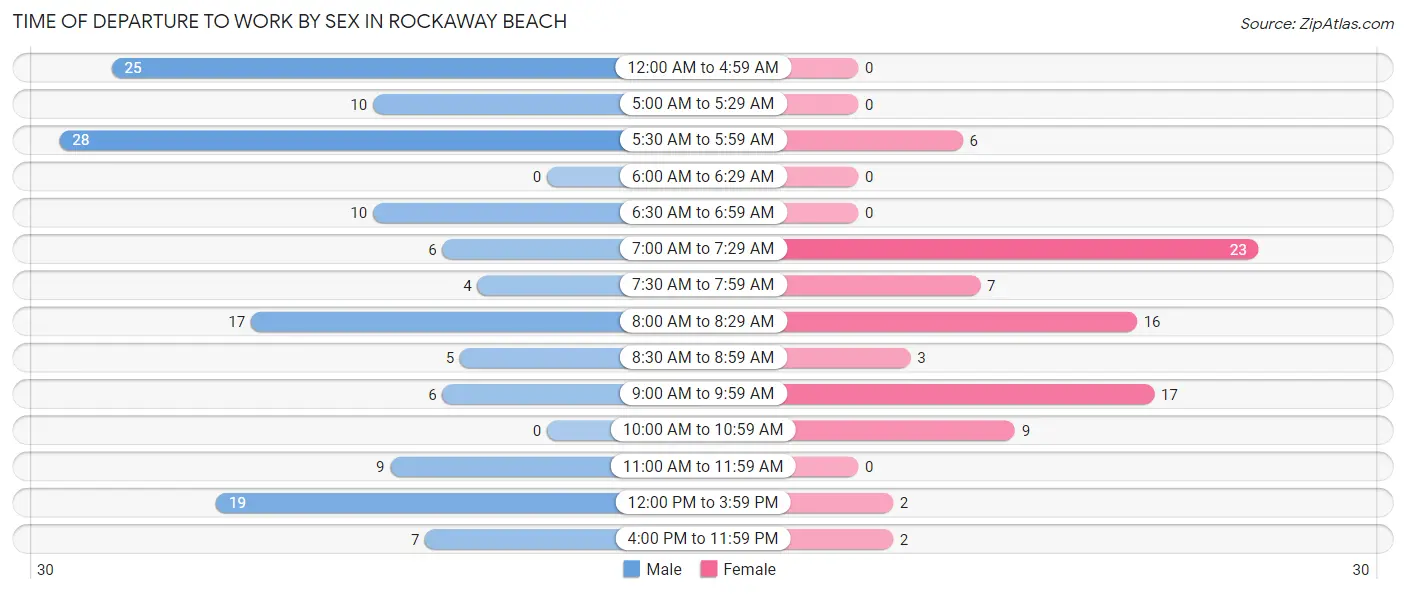
| Time of Departure | Male | Female |
| 12:00 AM to 4:59 AM | 25 (17.1%) | 0 (0.0%) |
| 5:00 AM to 5:29 AM | 10 (6.9%) | 0 (0.0%) |
| 5:30 AM to 5:59 AM | 28 (19.2%) | 6 (7.1%) |
| 6:00 AM to 6:29 AM | 0 (0.0%) | 0 (0.0%) |
| 6:30 AM to 6:59 AM | 10 (6.9%) | 0 (0.0%) |
| 7:00 AM to 7:29 AM | 6 (4.1%) | 23 (27.1%) |
| 7:30 AM to 7:59 AM | 4 (2.7%) | 7 (8.2%) |
| 8:00 AM to 8:29 AM | 17 (11.6%) | 16 (18.8%) |
| 8:30 AM to 8:59 AM | 5 (3.4%) | 3 (3.5%) |
| 9:00 AM to 9:59 AM | 6 (4.1%) | 17 (20.0%) |
| 10:00 AM to 10:59 AM | 0 (0.0%) | 9 (10.6%) |
| 11:00 AM to 11:59 AM | 9 (6.2%) | 0 (0.0%) |
| 12:00 PM to 3:59 PM | 19 (13.0%) | 2 (2.4%) |
| 4:00 PM to 11:59 PM | 7 (4.8%) | 2 (2.4%) |
| Total | 146 (100.0%) | 85 (100.0%) |
Housing Occupancy in Rockaway Beach
Occupancy by Ownership in Rockaway Beach
Of the total 254 dwellings in Rockaway Beach, owner-occupied units account for 187 (73.6%), while renter-occupied units make up 67 (26.4%).
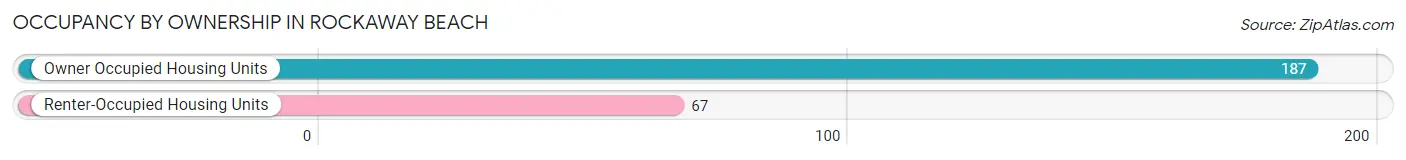
| Occupancy | # Housing Units | % Housing Units |
| Owner Occupied Housing Units | 187 | 73.6% |
| Renter-Occupied Housing Units | 67 | 26.4% |
| Total Occupied Housing Units | 254 | 100.0% |
Occupancy by Household Size in Rockaway Beach
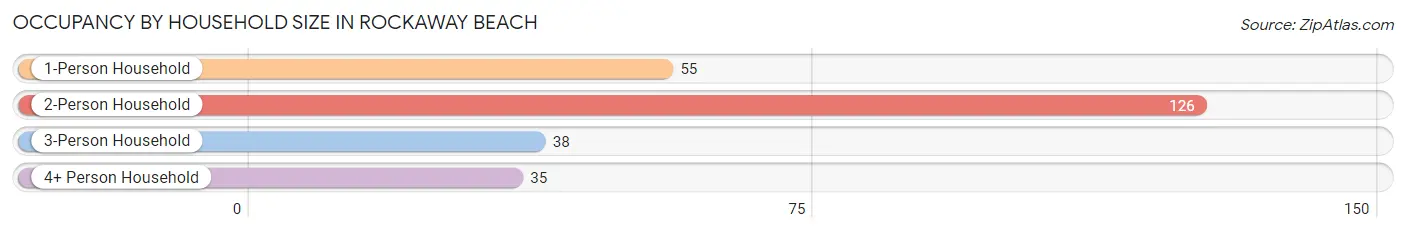
| Household Size | # Housing Units | % Housing Units |
| 1-Person Household | 55 | 21.6% |
| 2-Person Household | 126 | 49.6% |
| 3-Person Household | 38 | 15.0% |
| 4+ Person Household | 35 | 13.8% |
| Total Housing Units | 254 | 100.0% |
Occupancy by Ownership by Household Size in Rockaway Beach
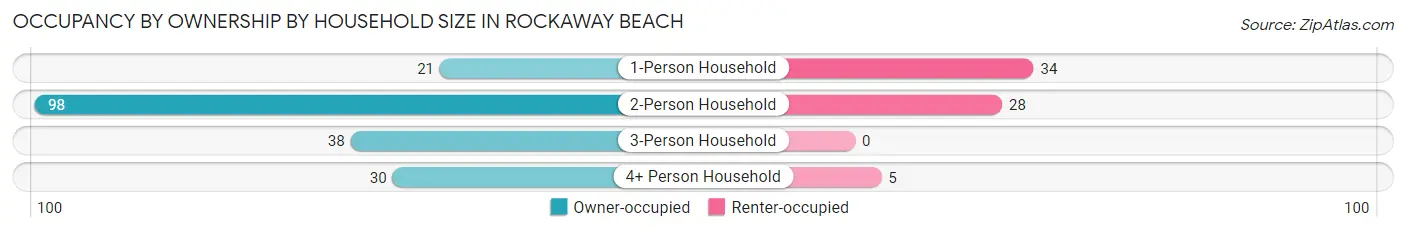
| Household Size | Owner-occupied | Renter-occupied |
| 1-Person Household | 21 (38.2%) | 34 (61.8%) |
| 2-Person Household | 98 (77.8%) | 28 (22.2%) |
| 3-Person Household | 38 (100.0%) | 0 (0.0%) |
| 4+ Person Household | 30 (85.7%) | 5 (14.3%) |
| Total Housing Units | 187 (73.6%) | 67 (26.4%) |
Occupancy by Educational Attainment in Rockaway Beach
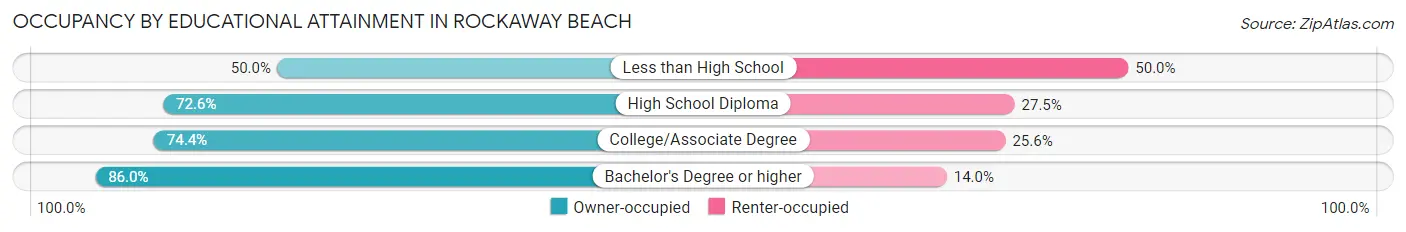
| Household Size | Owner-occupied | Renter-occupied |
| Less than High School | 12 (50.0%) | 12 (50.0%) |
| High School Diploma | 74 (72.6%) | 28 (27.5%) |
| College/Associate Degree | 58 (74.4%) | 20 (25.6%) |
| Bachelor's Degree or higher | 43 (86.0%) | 7 (14.0%) |
Occupancy by Age of Householder in Rockaway Beach
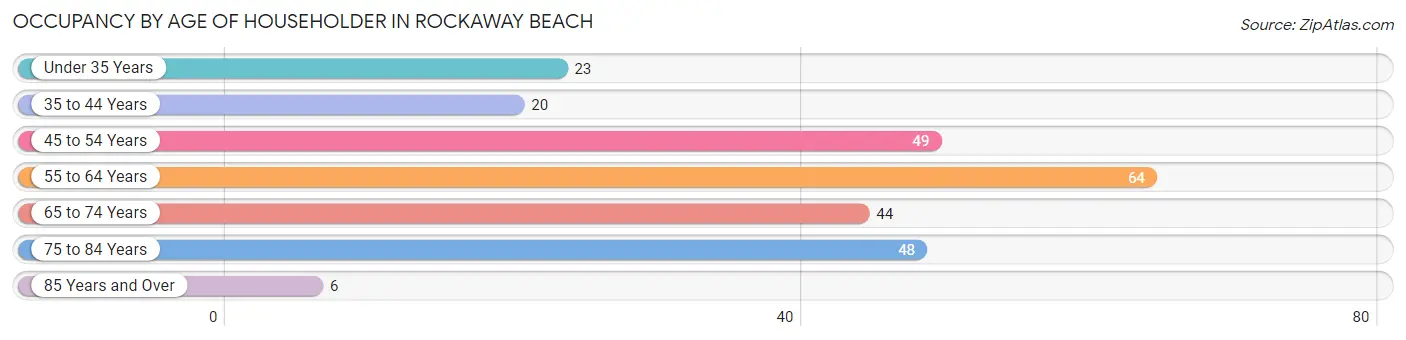
| Age Bracket | # Households | % Households |
| Under 35 Years | 23 | 9.1% |
| 35 to 44 Years | 20 | 7.9% |
| 45 to 54 Years | 49 | 19.3% |
| 55 to 64 Years | 64 | 25.2% |
| 65 to 74 Years | 44 | 17.3% |
| 75 to 84 Years | 48 | 18.9% |
| 85 Years and Over | 6 | 2.4% |
| Total | 254 | 100.0% |
Housing Finances in Rockaway Beach
Median Income by Occupancy in Rockaway Beach
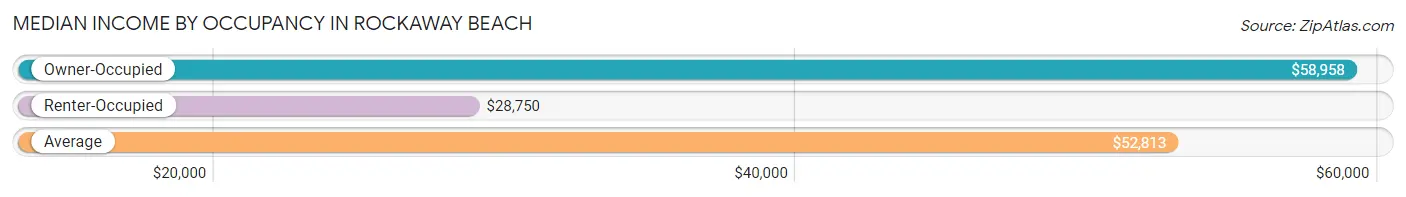
| Occupancy Type | # Households | Median Income |
| Owner-Occupied | 187 (73.6%) | $58,958 |
| Renter-Occupied | 67 (26.4%) | $28,750 |
| Average | 254 (100.0%) | $52,813 |
Occupancy by Householder Income Bracket in Rockaway Beach
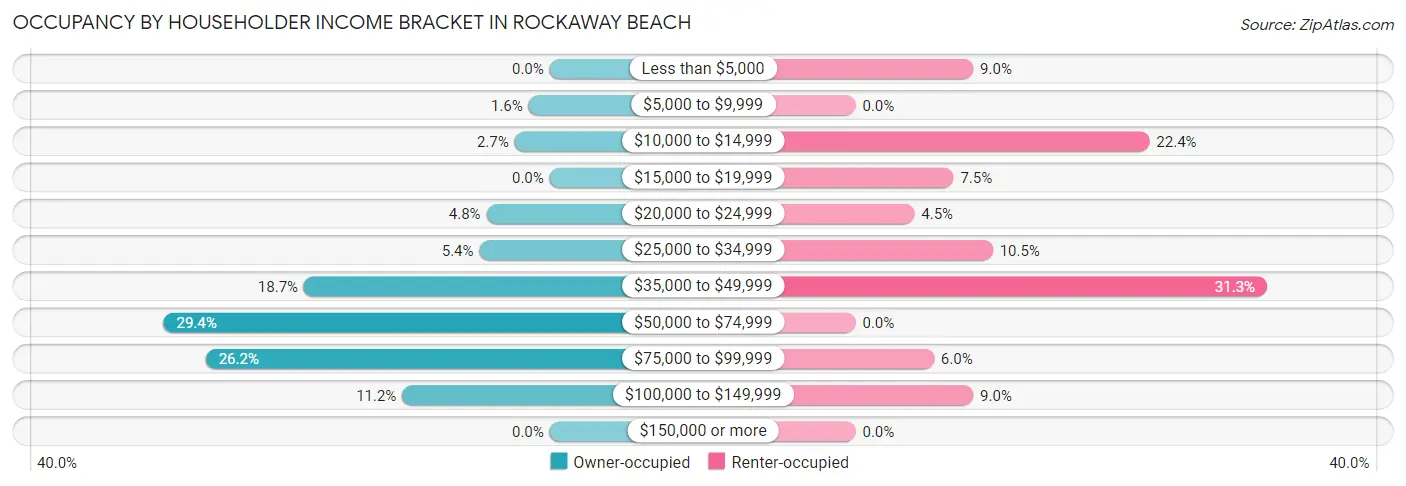
| Income Bracket | Owner-occupied | Renter-occupied |
| Less than $5,000 | 0 (0.0%) | 6 (9.0%) |
| $5,000 to $9,999 | 3 (1.6%) | 0 (0.0%) |
| $10,000 to $14,999 | 5 (2.7%) | 15 (22.4%) |
| $15,000 to $19,999 | 0 (0.0%) | 5 (7.5%) |
| $20,000 to $24,999 | 9 (4.8%) | 3 (4.5%) |
| $25,000 to $34,999 | 10 (5.3%) | 7 (10.4%) |
| $35,000 to $49,999 | 35 (18.7%) | 21 (31.3%) |
| $50,000 to $74,999 | 55 (29.4%) | 0 (0.0%) |
| $75,000 to $99,999 | 49 (26.2%) | 4 (6.0%) |
| $100,000 to $149,999 | 21 (11.2%) | 6 (9.0%) |
| $150,000 or more | 0 (0.0%) | 0 (0.0%) |
| Total | 187 (100.0%) | 67 (100.0%) |
Monthly Housing Cost Tiers in Rockaway Beach
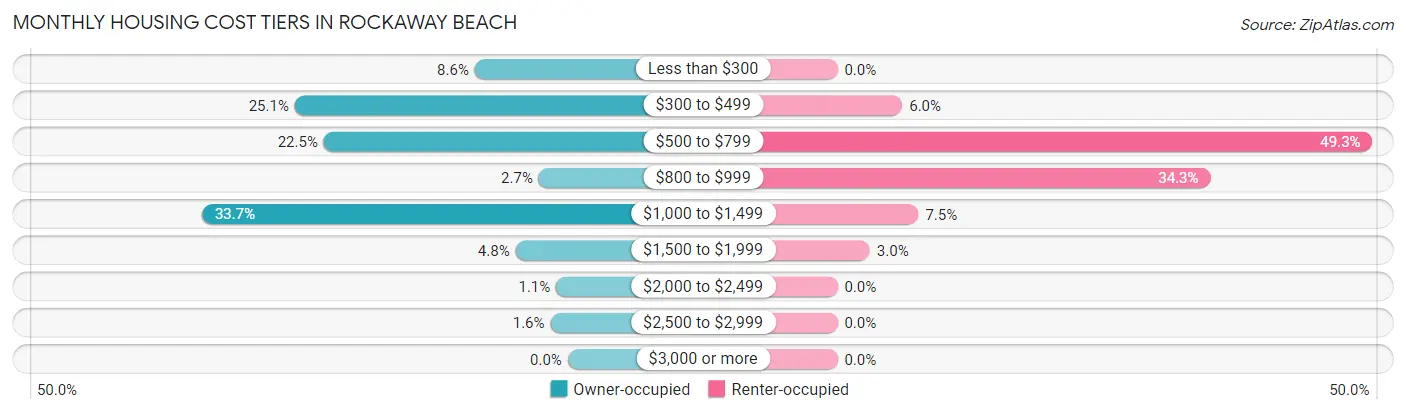
| Monthly Cost | Owner-occupied | Renter-occupied |
| Less than $300 | 16 (8.6%) | 0 (0.0%) |
| $300 to $499 | 47 (25.1%) | 4 (6.0%) |
| $500 to $799 | 42 (22.5%) | 33 (49.2%) |
| $800 to $999 | 5 (2.7%) | 23 (34.3%) |
| $1,000 to $1,499 | 63 (33.7%) | 5 (7.5%) |
| $1,500 to $1,999 | 9 (4.8%) | 2 (3.0%) |
| $2,000 to $2,499 | 2 (1.1%) | 0 (0.0%) |
| $2,500 to $2,999 | 3 (1.6%) | 0 (0.0%) |
| $3,000 or more | 0 (0.0%) | 0 (0.0%) |
| Total | 187 (100.0%) | 67 (100.0%) |
Physical Housing Characteristics in Rockaway Beach
Housing Structures in Rockaway Beach
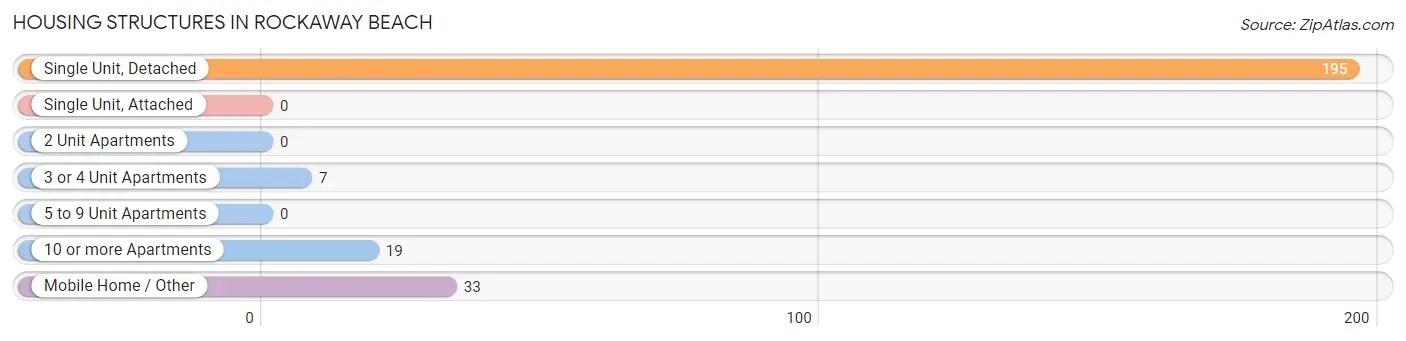
| Structure Type | # Housing Units | % Housing Units |
| Single Unit, Detached | 195 | 76.8% |
| Single Unit, Attached | 0 | 0.0% |
| 2 Unit Apartments | 0 | 0.0% |
| 3 or 4 Unit Apartments | 7 | 2.8% |
| 5 to 9 Unit Apartments | 0 | 0.0% |
| 10 or more Apartments | 19 | 7.5% |
| Mobile Home / Other | 33 | 13.0% |
| Total | 254 | 100.0% |
Housing Structures by Occupancy in Rockaway Beach
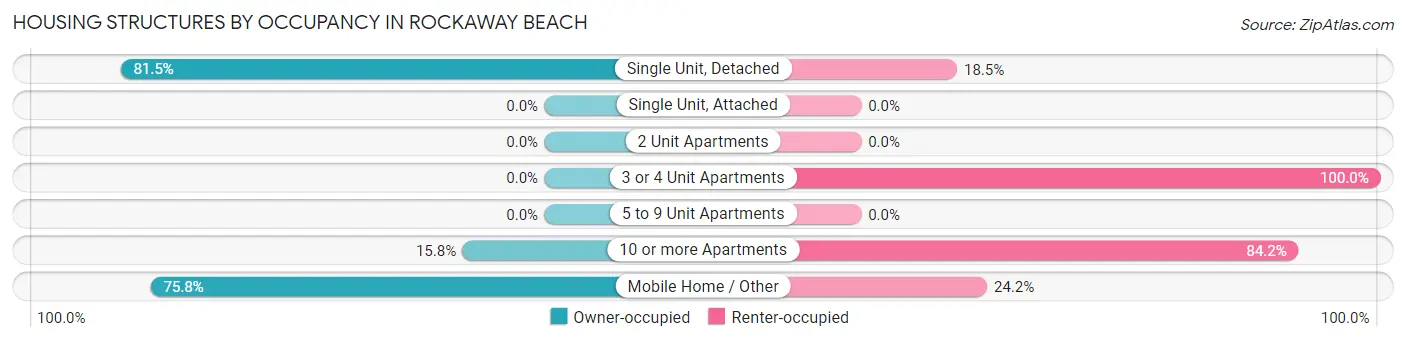
| Structure Type | Owner-occupied | Renter-occupied |
| Single Unit, Detached | 159 (81.5%) | 36 (18.5%) |
| Single Unit, Attached | 0 (0.0%) | 0 (0.0%) |
| 2 Unit Apartments | 0 (0.0%) | 0 (0.0%) |
| 3 or 4 Unit Apartments | 0 (0.0%) | 7 (100.0%) |
| 5 to 9 Unit Apartments | 0 (0.0%) | 0 (0.0%) |
| 10 or more Apartments | 3 (15.8%) | 16 (84.2%) |
| Mobile Home / Other | 25 (75.8%) | 8 (24.2%) |
| Total | 187 (73.6%) | 67 (26.4%) |
Housing Structures by Number of Rooms in Rockaway Beach
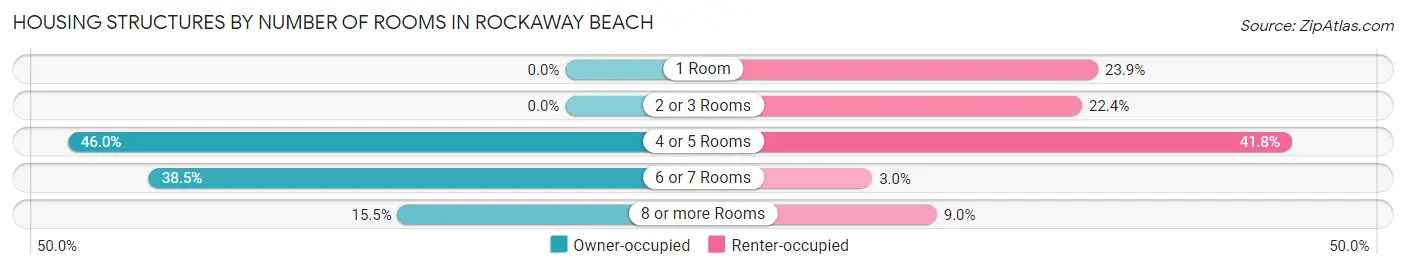
| Number of Rooms | Owner-occupied | Renter-occupied |
| 1 Room | 0 (0.0%) | 16 (23.9%) |
| 2 or 3 Rooms | 0 (0.0%) | 15 (22.4%) |
| 4 or 5 Rooms | 86 (46.0%) | 28 (41.8%) |
| 6 or 7 Rooms | 72 (38.5%) | 2 (3.0%) |
| 8 or more Rooms | 29 (15.5%) | 6 (9.0%) |
| Total | 187 (100.0%) | 67 (100.0%) |
Housing Structure by Heating Type in Rockaway Beach
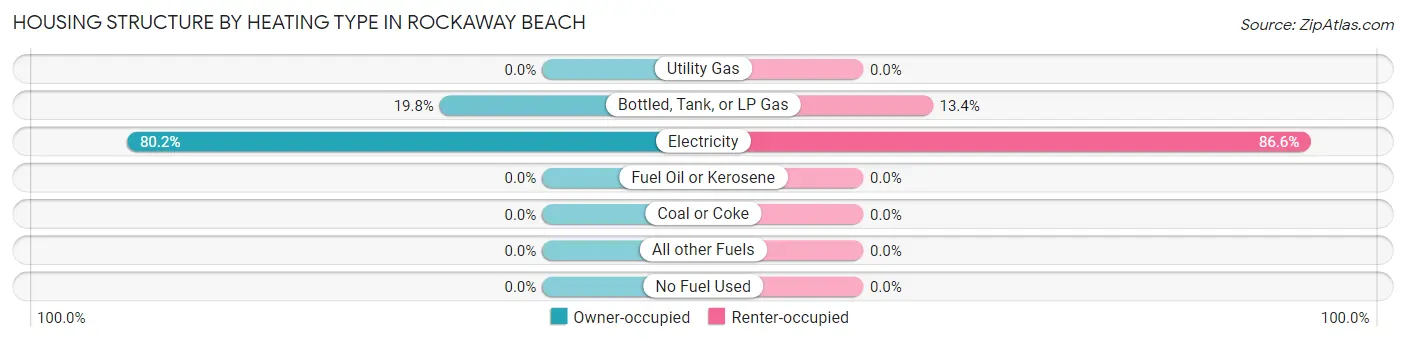
| Heating Type | Owner-occupied | Renter-occupied |
| Utility Gas | 0 (0.0%) | 0 (0.0%) |
| Bottled, Tank, or LP Gas | 37 (19.8%) | 9 (13.4%) |
| Electricity | 150 (80.2%) | 58 (86.6%) |
| Fuel Oil or Kerosene | 0 (0.0%) | 0 (0.0%) |
| Coal or Coke | 0 (0.0%) | 0 (0.0%) |
| All other Fuels | 0 (0.0%) | 0 (0.0%) |
| No Fuel Used | 0 (0.0%) | 0 (0.0%) |
| Total | 187 (100.0%) | 67 (100.0%) |
Household Vehicle Usage in Rockaway Beach
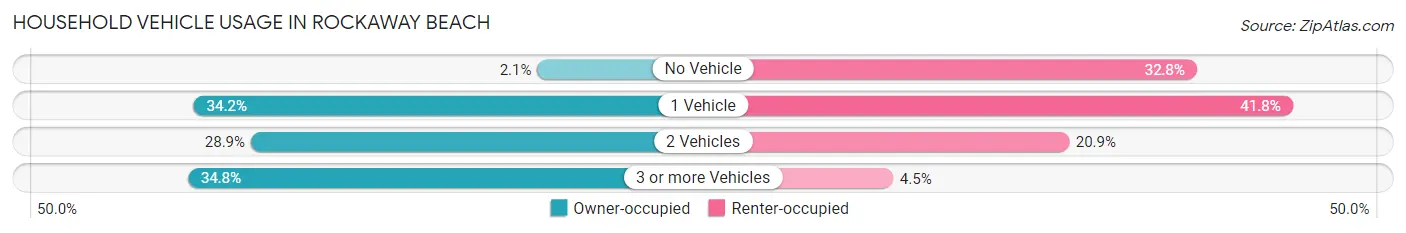
| Vehicles per Household | Owner-occupied | Renter-occupied |
| No Vehicle | 4 (2.1%) | 22 (32.8%) |
| 1 Vehicle | 64 (34.2%) | 28 (41.8%) |
| 2 Vehicles | 54 (28.9%) | 14 (20.9%) |
| 3 or more Vehicles | 65 (34.8%) | 3 (4.5%) |
| Total | 187 (100.0%) | 67 (100.0%) |
Real Estate & Mortgages in Rockaway Beach
Real Estate and Mortgage Overview in Rockaway Beach
| Characteristic | Without Mortgage | With Mortgage |
| Housing Units | 72 | 115 |
| Median Property Value | $157,100 | $108,800 |
| Median Household Income | $53,250 | $0 |
| Monthly Housing Costs | $423 | $0 |
| Real Estate Taxes | $908 | $0 |
Property Value by Mortgage Status in Rockaway Beach
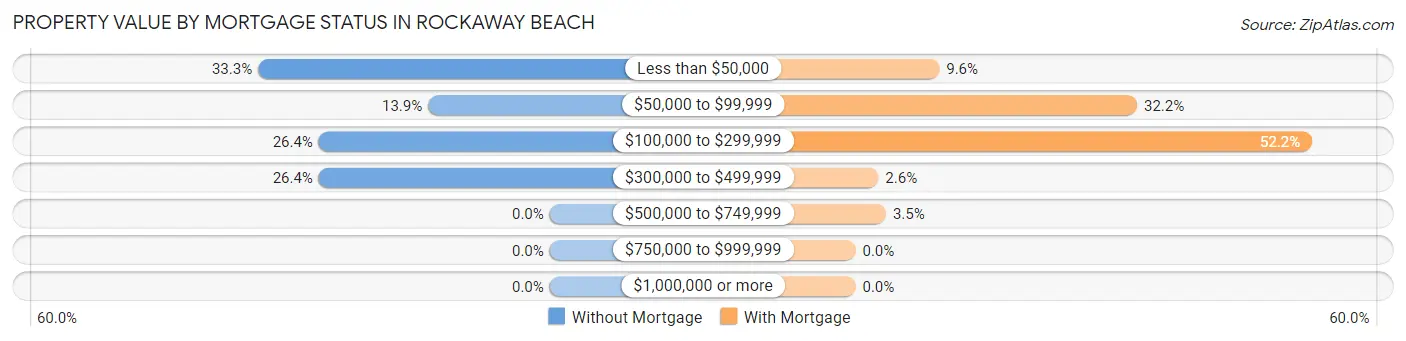
| Property Value | Without Mortgage | With Mortgage |
| Less than $50,000 | 24 (33.3%) | 11 (9.6%) |
| $50,000 to $99,999 | 10 (13.9%) | 37 (32.2%) |
| $100,000 to $299,999 | 19 (26.4%) | 60 (52.2%) |
| $300,000 to $499,999 | 19 (26.4%) | 3 (2.6%) |
| $500,000 to $749,999 | 0 (0.0%) | 4 (3.5%) |
| $750,000 to $999,999 | 0 (0.0%) | 0 (0.0%) |
| $1,000,000 or more | 0 (0.0%) | 0 (0.0%) |
| Total | 72 (100.0%) | 115 (100.0%) |
Household Income by Mortgage Status in Rockaway Beach
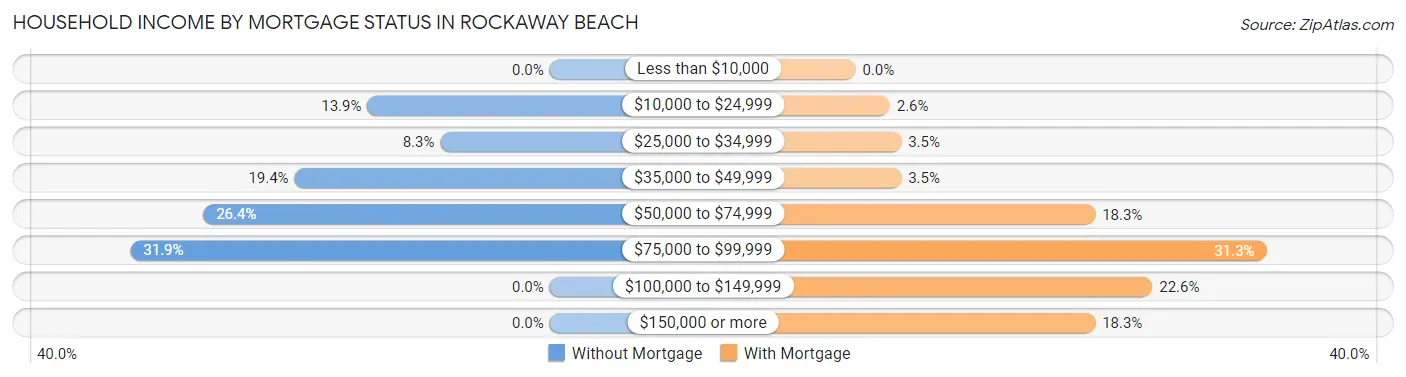
| Household Income | Without Mortgage | With Mortgage |
| Less than $10,000 | 0 (0.0%) | 0 (0.0%) |
| $10,000 to $24,999 | 10 (13.9%) | 3 (2.6%) |
| $25,000 to $34,999 | 6 (8.3%) | 4 (3.5%) |
| $35,000 to $49,999 | 14 (19.4%) | 4 (3.5%) |
| $50,000 to $74,999 | 19 (26.4%) | 21 (18.3%) |
| $75,000 to $99,999 | 23 (31.9%) | 36 (31.3%) |
| $100,000 to $149,999 | 0 (0.0%) | 26 (22.6%) |
| $150,000 or more | 0 (0.0%) | 21 (18.3%) |
| Total | 72 (100.0%) | 115 (100.0%) |
Property Value to Household Income Ratio in Rockaway Beach
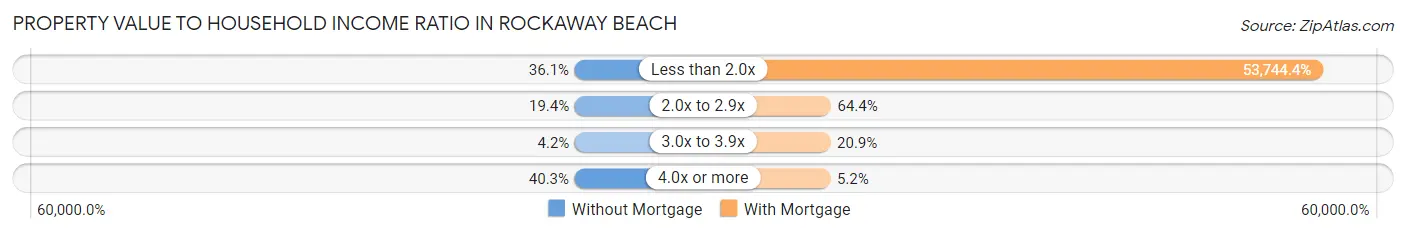
| Value-to-Income Ratio | Without Mortgage | With Mortgage |
| Less than 2.0x | 26 (36.1%) | 61,806 (53,744.3%) |
| 2.0x to 2.9x | 14 (19.4%) | 74 (64.3%) |
| 3.0x to 3.9x | 3 (4.2%) | 24 (20.9%) |
| 4.0x or more | 29 (40.3%) | 6 (5.2%) |
| Total | 72 (100.0%) | 115 (100.0%) |
Real Estate Taxes by Mortgage Status in Rockaway Beach
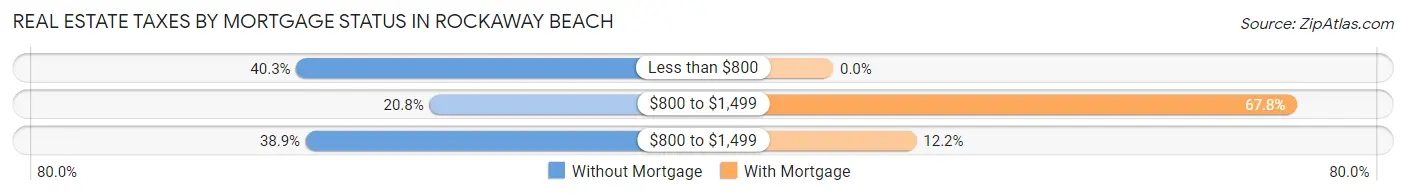
| Property Taxes | Without Mortgage | With Mortgage |
| Less than $800 | 29 (40.3%) | 0 (0.0%) |
| $800 to $1,499 | 15 (20.8%) | 78 (67.8%) |
| $800 to $1,499 | 28 (38.9%) | 14 (12.2%) |
| Total | 72 (100.0%) | 115 (100.0%) |
Health & Disability in Rockaway Beach
Health Insurance Coverage by Age in Rockaway Beach
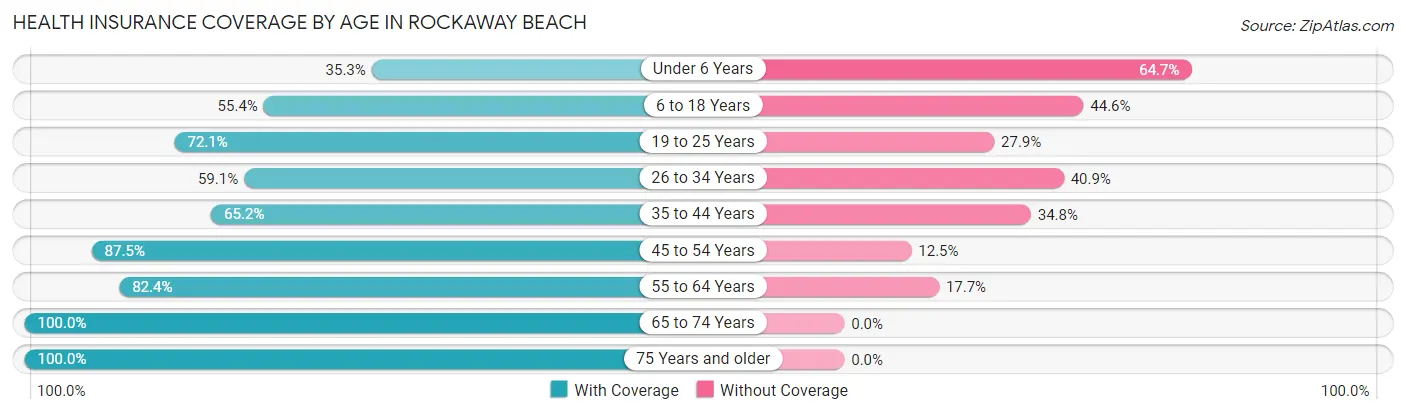
| Age Bracket | With Coverage | Without Coverage |
| Under 6 Years | 6 (35.3%) | 11 (64.7%) |
| 6 to 18 Years | 46 (55.4%) | 37 (44.6%) |
| 19 to 25 Years | 49 (72.1%) | 19 (27.9%) |
| 26 to 34 Years | 26 (59.1%) | 18 (40.9%) |
| 35 to 44 Years | 30 (65.2%) | 16 (34.8%) |
| 45 to 54 Years | 49 (87.5%) | 7 (12.5%) |
| 55 to 64 Years | 126 (82.4%) | 27 (17.6%) |
| 65 to 74 Years | 71 (100.0%) | 0 (0.0%) |
| 75 Years and older | 106 (100.0%) | 0 (0.0%) |
| Total | 509 (79.0%) | 135 (21.0%) |
Health Insurance Coverage by Citizenship Status in Rockaway Beach
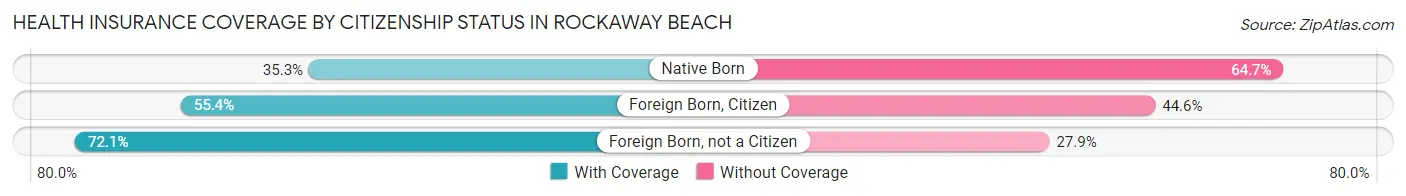
| Citizenship Status | With Coverage | Without Coverage |
| Native Born | 6 (35.3%) | 11 (64.7%) |
| Foreign Born, Citizen | 46 (55.4%) | 37 (44.6%) |
| Foreign Born, not a Citizen | 49 (72.1%) | 19 (27.9%) |
Health Insurance Coverage by Household Income in Rockaway Beach
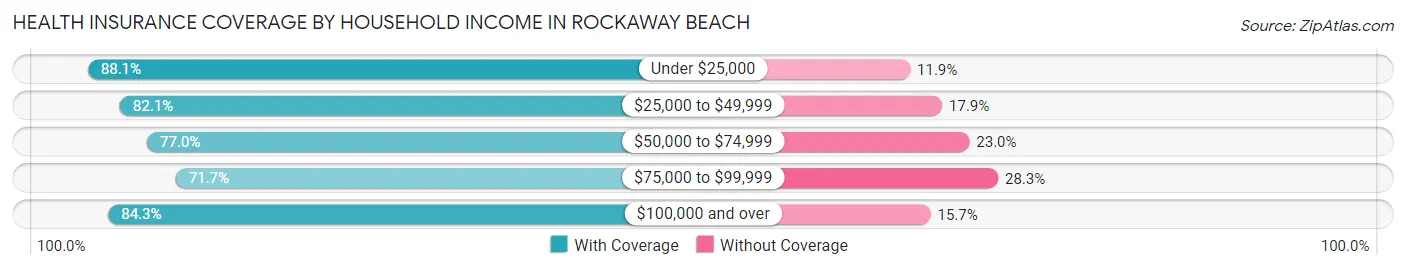
| Household Income | With Coverage | Without Coverage |
| Under $25,000 | 52 (88.1%) | 7 (11.9%) |
| $25,000 to $49,999 | 138 (82.1%) | 30 (17.9%) |
| $50,000 to $74,999 | 104 (77.0%) | 31 (23.0%) |
| $75,000 to $99,999 | 129 (71.7%) | 51 (28.3%) |
| $100,000 and over | 86 (84.3%) | 16 (15.7%) |
Public vs Private Health Insurance Coverage by Age in Rockaway Beach
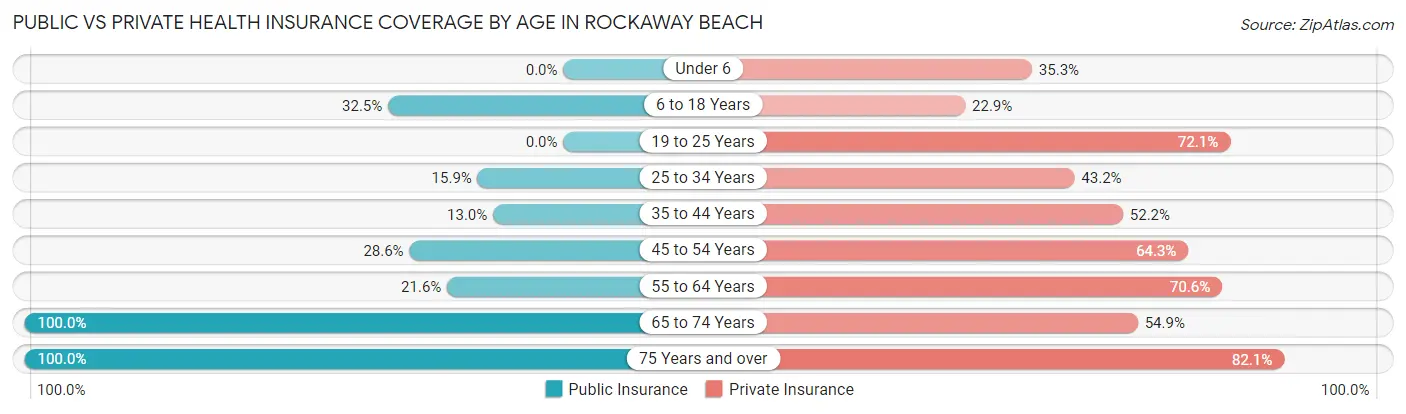
| Age Bracket | Public Insurance | Private Insurance |
| Under 6 | 0 (0.0%) | 6 (35.3%) |
| 6 to 18 Years | 27 (32.5%) | 19 (22.9%) |
| 19 to 25 Years | 0 (0.0%) | 49 (72.1%) |
| 25 to 34 Years | 7 (15.9%) | 19 (43.2%) |
| 35 to 44 Years | 6 (13.0%) | 24 (52.2%) |
| 45 to 54 Years | 16 (28.6%) | 36 (64.3%) |
| 55 to 64 Years | 33 (21.6%) | 108 (70.6%) |
| 65 to 74 Years | 71 (100.0%) | 39 (54.9%) |
| 75 Years and over | 106 (100.0%) | 87 (82.1%) |
| Total | 266 (41.3%) | 387 (60.1%) |
Disability Status by Sex by Age in Rockaway Beach
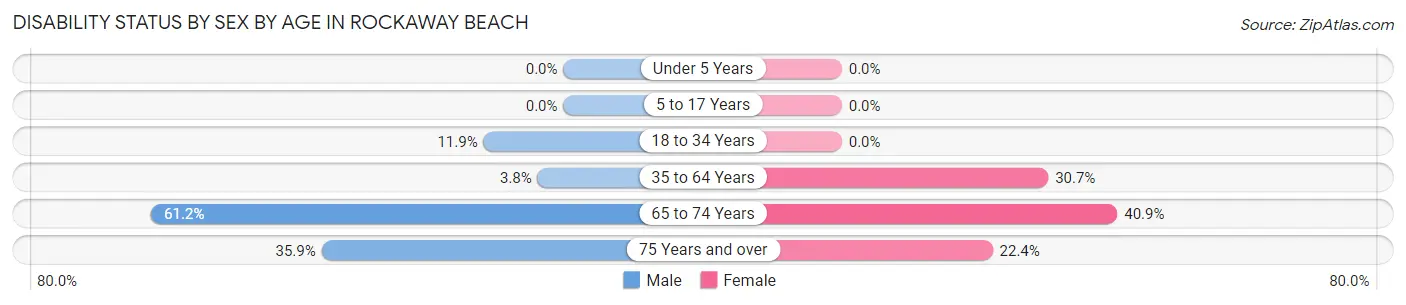
| Age Bracket | Male | Female |
| Under 5 Years | 0 (0.0%) | 0 (0.0%) |
| 5 to 17 Years | 0 (0.0%) | 0 (0.0%) |
| 18 to 34 Years | 7 (11.9%) | 0 (0.0%) |
| 35 to 64 Years | 5 (3.8%) | 38 (30.6%) |
| 65 to 74 Years | 30 (61.2%) | 9 (40.9%) |
| 75 Years and over | 14 (35.9%) | 15 (22.4%) |
Disability Class by Sex by Age in Rockaway Beach
Disability Class: Hearing Difficulty
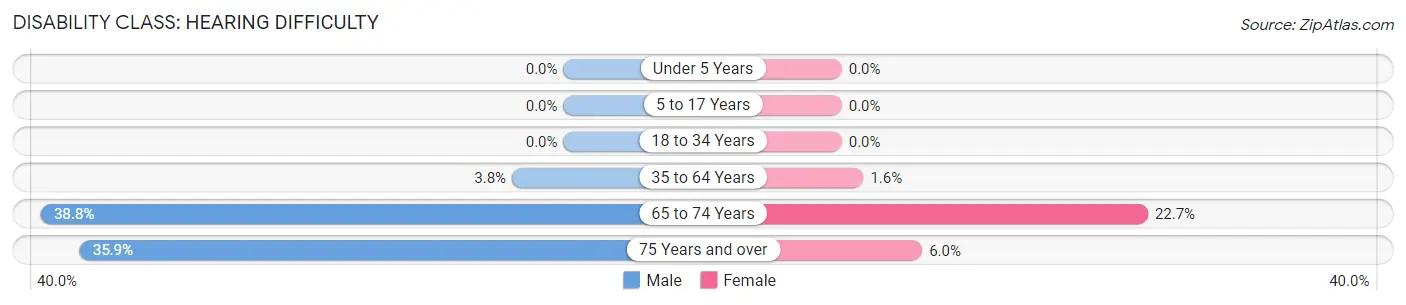
| Age Bracket | Male | Female |
| Under 5 Years | 0 (0.0%) | 0 (0.0%) |
| 5 to 17 Years | 0 (0.0%) | 0 (0.0%) |
| 18 to 34 Years | 0 (0.0%) | 0 (0.0%) |
| 35 to 64 Years | 5 (3.8%) | 2 (1.6%) |
| 65 to 74 Years | 19 (38.8%) | 5 (22.7%) |
| 75 Years and over | 14 (35.9%) | 4 (6.0%) |
Disability Class: Vision Difficulty
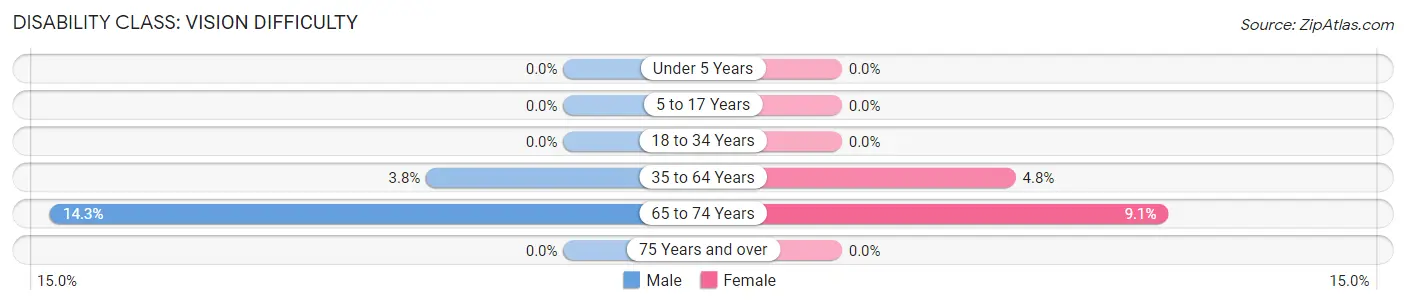
| Age Bracket | Male | Female |
| Under 5 Years | 0 (0.0%) | 0 (0.0%) |
| 5 to 17 Years | 0 (0.0%) | 0 (0.0%) |
| 18 to 34 Years | 0 (0.0%) | 0 (0.0%) |
| 35 to 64 Years | 5 (3.8%) | 6 (4.8%) |
| 65 to 74 Years | 7 (14.3%) | 2 (9.1%) |
| 75 Years and over | 0 (0.0%) | 0 (0.0%) |
Disability Class: Cognitive Difficulty
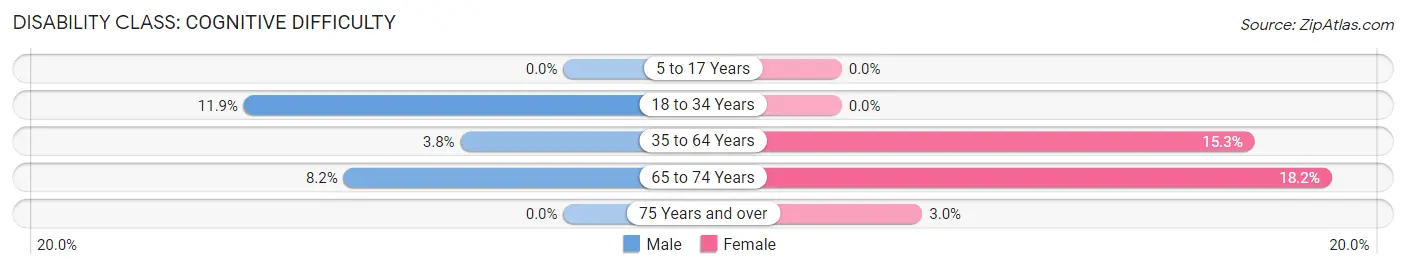
| Age Bracket | Male | Female |
| 5 to 17 Years | 0 (0.0%) | 0 (0.0%) |
| 18 to 34 Years | 7 (11.9%) | 0 (0.0%) |
| 35 to 64 Years | 5 (3.8%) | 19 (15.3%) |
| 65 to 74 Years | 4 (8.2%) | 4 (18.2%) |
| 75 Years and over | 0 (0.0%) | 2 (3.0%) |
Disability Class: Ambulatory Difficulty
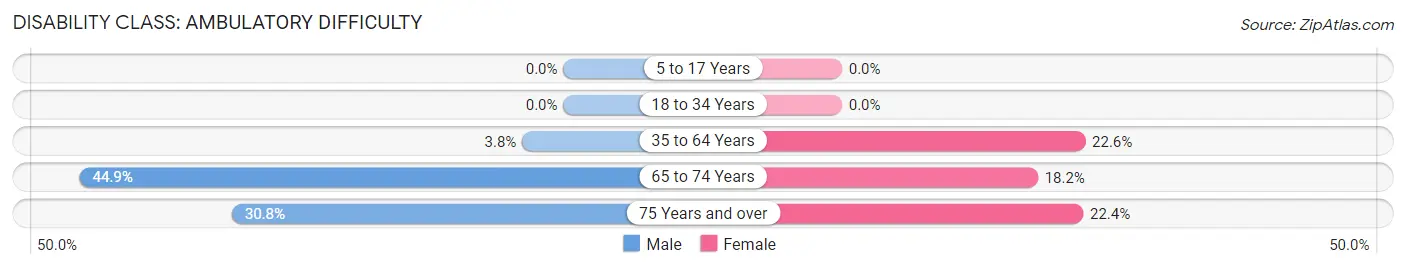
| Age Bracket | Male | Female |
| 5 to 17 Years | 0 (0.0%) | 0 (0.0%) |
| 18 to 34 Years | 0 (0.0%) | 0 (0.0%) |
| 35 to 64 Years | 5 (3.8%) | 28 (22.6%) |
| 65 to 74 Years | 22 (44.9%) | 4 (18.2%) |
| 75 Years and over | 12 (30.8%) | 15 (22.4%) |
Disability Class: Self-Care Difficulty
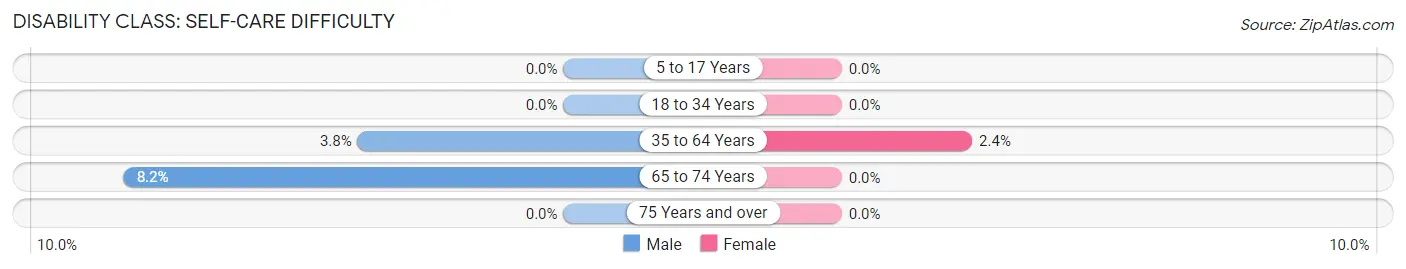
| Age Bracket | Male | Female |
| 5 to 17 Years | 0 (0.0%) | 0 (0.0%) |
| 18 to 34 Years | 0 (0.0%) | 0 (0.0%) |
| 35 to 64 Years | 5 (3.8%) | 3 (2.4%) |
| 65 to 74 Years | 4 (8.2%) | 0 (0.0%) |
| 75 Years and over | 0 (0.0%) | 0 (0.0%) |
Technology Access in Rockaway Beach
Computing Device Access in Rockaway Beach
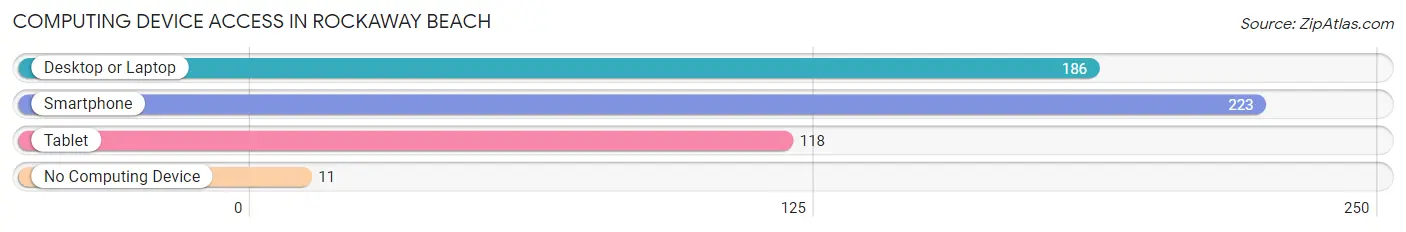
| Device Type | # Households | % Households |
| Desktop or Laptop | 186 | 73.2% |
| Smartphone | 223 | 87.8% |
| Tablet | 118 | 46.5% |
| No Computing Device | 11 | 4.3% |
| Total | 254 | 100.0% |
Internet Access in Rockaway Beach
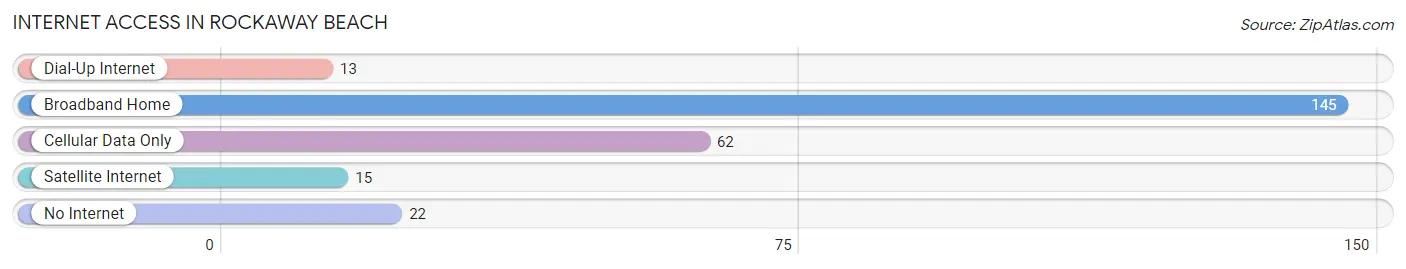
| Internet Type | # Households | % Households |
| Dial-Up Internet | 13 | 5.1% |
| Broadband Home | 145 | 57.1% |
| Cellular Data Only | 62 | 24.4% |
| Satellite Internet | 15 | 5.9% |
| No Internet | 22 | 8.7% |
| Total | 254 | 100.0% |
Rockaway Beach Summary
Introduction
Rockaway Beach, Missouri is a small town located in Taney County, Missouri. It is situated on the shores of Table Rock Lake, a popular destination for fishing, boating, and other recreational activities. The town has a population of approximately 1,000 people and is known for its laid-back atmosphere and friendly locals. Rockaway Beach is a popular tourist destination, with many visitors coming to enjoy the lake and the surrounding area.
History
Rockaway Beach was founded in the late 1800s by a group of settlers from the Ozarks. The town was originally known as “Rockaway” and was named after the rocky shoreline of Table Rock Lake. The town was incorporated in 1901 and was originally a farming community. In the early 1900s, the town began to grow as a resort destination, with many visitors coming to enjoy the lake and the surrounding area.
In the 1950s, the town began to experience a decline in population as many of the residents moved away to larger cities. However, in the late 1970s, the town began to experience a resurgence in popularity as a tourist destination. The town has since become a popular destination for fishing, boating, and other recreational activities.
Geography
Rockaway Beach is located in Taney County, Missouri. It is situated on the shores of Table Rock Lake, a popular destination for fishing, boating, and other recreational activities. The town is located in the Ozark Mountains and is surrounded by rolling hills and forests. The town is located approximately 30 miles south of Branson, Missouri and is accessible by car or boat.
Economy
The economy of Rockaway Beach is largely based on tourism. The town is a popular destination for fishing, boating, and other recreational activities. The town also has several restaurants, bars, and shops that cater to tourists. Additionally, the town is home to several marinas and boat rental companies.
Demographics
As of the 2010 census, the population of Rockaway Beach was 1,000 people. The town is predominantly white, with approximately 95% of the population being white. The median household income in the town is $37,000, and the median age is 44 years old.
Conclusion
Rockaway Beach, Missouri is a small town located in Taney County, Missouri. It is situated on the shores of Table Rock Lake, a popular destination for fishing, boating, and other recreational activities. The town has a population of approximately 1,000 people and is known for its laid-back atmosphere and friendly locals. The economy of Rockaway Beach is largely based on tourism, with many visitors coming to enjoy the lake and the surrounding area. The town is predominantly white, with approximately 95% of the population being white. The median household income in the town is $37,000, and the median age is 44 years old.
Common Questions
What is Per Capita Income in Rockaway Beach?
Per Capita income in Rockaway Beach is $22,816.
What is the Median Family Income in Rockaway Beach?
Median Family Income in Rockaway Beach is $61,136.
What is the Median Household income in Rockaway Beach?
Median Household Income in Rockaway Beach is $52,813.
What is Income or Wage Gap in Rockaway Beach?
Income or Wage Gap in Rockaway Beach is 27.8%.
Women in Rockaway Beach earn 72.2 cents for every dollar earned by a man.
What is Inequality or Gini Index in Rockaway Beach?
Inequality or Gini Index in Rockaway Beach is 0.32.
What is the Total Population of Rockaway Beach?
Total Population of Rockaway Beach is 649.
What is the Total Male Population of Rockaway Beach?
Total Male Population of Rockaway Beach is 313.
What is the Total Female Population of Rockaway Beach?
Total Female Population of Rockaway Beach is 336.
What is the Ratio of Males per 100 Females in Rockaway Beach?
There are 93.15 Males per 100 Females in Rockaway Beach.
What is the Ratio of Females per 100 Males in Rockaway Beach?
There are 107.35 Females per 100 Males in Rockaway Beach.
What is the Median Population Age in Rockaway Beach?
Median Population Age in Rockaway Beach is 55.4 Years.
What is the Average Family Size in Rockaway Beach
Average Family Size in Rockaway Beach is 3.0 People.
What is the Average Household Size in Rockaway Beach
Average Household Size in Rockaway Beach is 2.6 People.
How Large is the Labor Force in Rockaway Beach?
There are 259 People in the Labor Forcein in Rockaway Beach.
What is the Percentage of People in the Labor Force in Rockaway Beach?
45.1% of People are in the Labor Force in Rockaway Beach.
What is the Unemployment Rate in Rockaway Beach?
Unemployment Rate in Rockaway Beach is 6.7%.