Raymondville, MO Map & Demographics
Raymondville Map
Raymondville Overview
$22,880
PER CAPITA INCOME
$55,625
AVG FAMILY INCOME
$31,250
AVG HOUSEHOLD INCOME
30.7%
WAGE / INCOME GAP [ % ]
69.3¢/ $1
WAGE / INCOME GAP [ $ ]
0.57
INEQUALITY / GINI INDEX
528
TOTAL POPULATION
259
MALE POPULATION
269
FEMALE POPULATION
96.28
MALES / 100 FEMALES
103.86
FEMALES / 100 MALES
34.3
MEDIAN AGE
3.9
AVG FAMILY SIZE
2.8
AVG HOUSEHOLD SIZE
212
LABOR FORCE [ PEOPLE ]
58.4%
PERCENT IN LABOR FORCE
8.5%
UNEMPLOYMENT RATE
Raymondville Zip Codes
Income in Raymondville
Income Overview in Raymondville
Per Capita Income in Raymondville is $22,880, while median incomes of families and households are $55,625 and $31,250 respectively.
| Characteristic | Number | Measure |
| Per Capita Income | 528 | $22,880 |
| Median Family Income | 106 | $55,625 |
| Mean Family Income | 106 | $89,186 |
| Median Household Income | 188 | $31,250 |
| Mean Household Income | 188 | $62,669 |
| Income Deficit | 106 | $0 |
| Wage / Income Gap (%) | 528 | 30.70% |
| Wage / Income Gap ($) | 528 | 69.30¢ per $1 |
| Gini / Inequality Index | 528 | 0.57 |
Earnings by Sex in Raymondville
Average Earnings in Raymondville are $23,512, $32,813 for men and $22,738 for women, a difference of 30.7%.
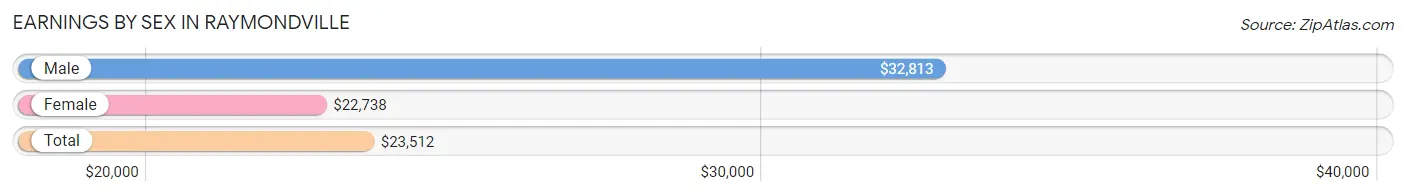
| Sex | Number | Average Earnings |
| Male | 109 (50.2%) | $32,813 |
| Female | 108 (49.8%) | $22,738 |
| Total | 217 (100.0%) | $23,512 |
Earnings by Sex by Income Bracket in Raymondville
The most common earnings brackets in Raymondville are $55,000 to $64,999 for men (19 | 17.4%) and $10,000 to $12,499 for women (21 | 19.4%).
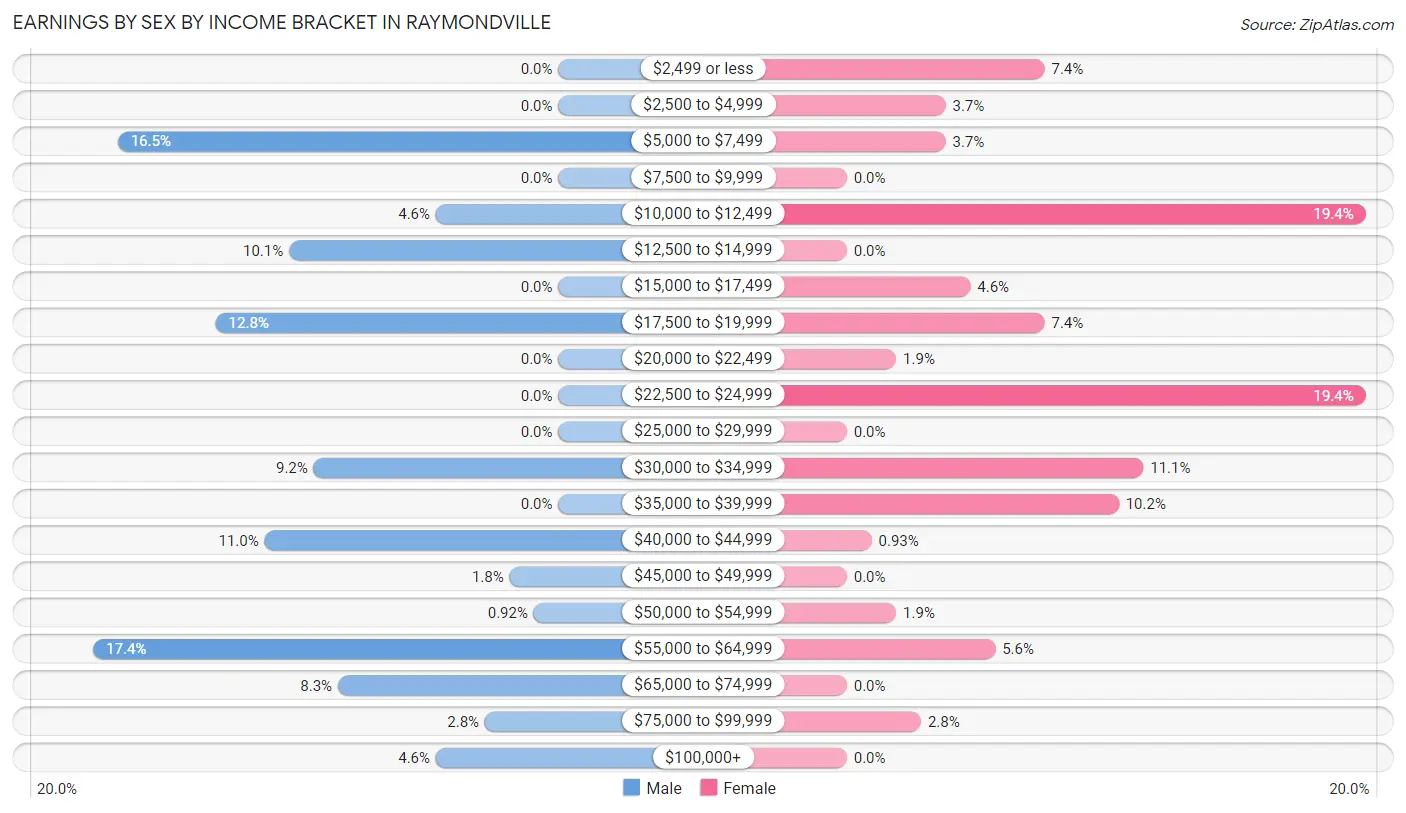
| Income | Male | Female |
| $2,499 or less | 0 (0.0%) | 8 (7.4%) |
| $2,500 to $4,999 | 0 (0.0%) | 4 (3.7%) |
| $5,000 to $7,499 | 18 (16.5%) | 4 (3.7%) |
| $7,500 to $9,999 | 0 (0.0%) | 0 (0.0%) |
| $10,000 to $12,499 | 5 (4.6%) | 21 (19.4%) |
| $12,500 to $14,999 | 11 (10.1%) | 0 (0.0%) |
| $15,000 to $17,499 | 0 (0.0%) | 5 (4.6%) |
| $17,500 to $19,999 | 14 (12.8%) | 8 (7.4%) |
| $20,000 to $22,499 | 0 (0.0%) | 2 (1.8%) |
| $22,500 to $24,999 | 0 (0.0%) | 21 (19.4%) |
| $25,000 to $29,999 | 0 (0.0%) | 0 (0.0%) |
| $30,000 to $34,999 | 10 (9.2%) | 12 (11.1%) |
| $35,000 to $39,999 | 0 (0.0%) | 11 (10.2%) |
| $40,000 to $44,999 | 12 (11.0%) | 1 (0.9%) |
| $45,000 to $49,999 | 2 (1.8%) | 0 (0.0%) |
| $50,000 to $54,999 | 1 (0.9%) | 2 (1.8%) |
| $55,000 to $64,999 | 19 (17.4%) | 6 (5.6%) |
| $65,000 to $74,999 | 9 (8.3%) | 0 (0.0%) |
| $75,000 to $99,999 | 3 (2.8%) | 3 (2.8%) |
| $100,000+ | 5 (4.6%) | 0 (0.0%) |
| Total | 109 (100.0%) | 108 (100.0%) |
Earnings by Sex by Educational Attainment in Raymondville
Average earnings in Raymondville are $40,500 for men and $23,594 for women, a difference of 41.7%. Men with an educational attainment of high school diploma enjoy the highest average annual earnings of $46,875, while those with less than high school education earn the least with $14,886. Women with an educational attainment of high school diploma earn the most with the average annual earnings of $31,875, while those with college or associate's degree education have the smallest earnings of $23,828.
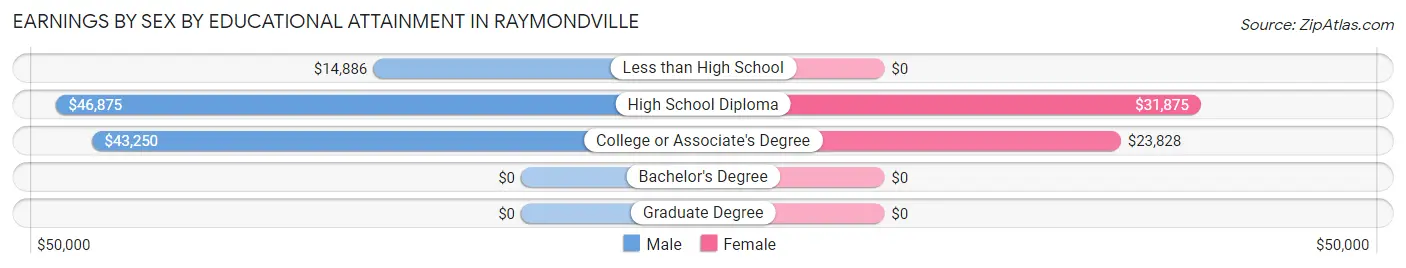
| Educational Attainment | Male Income | Female Income |
| Less than High School | $14,886 | $0 |
| High School Diploma | $46,875 | $31,875 |
| College or Associate's Degree | $43,250 | $23,828 |
| Bachelor's Degree | - | - |
| Graduate Degree | - | - |
| Total | $40,500 | $23,594 |
Family Income in Raymondville
Family Income Brackets in Raymondville
According to the Raymondville family income data, there are 31 families falling into the $50,000 to $74,999 income range, which is the most common income bracket and makes up 29.2% of all families.
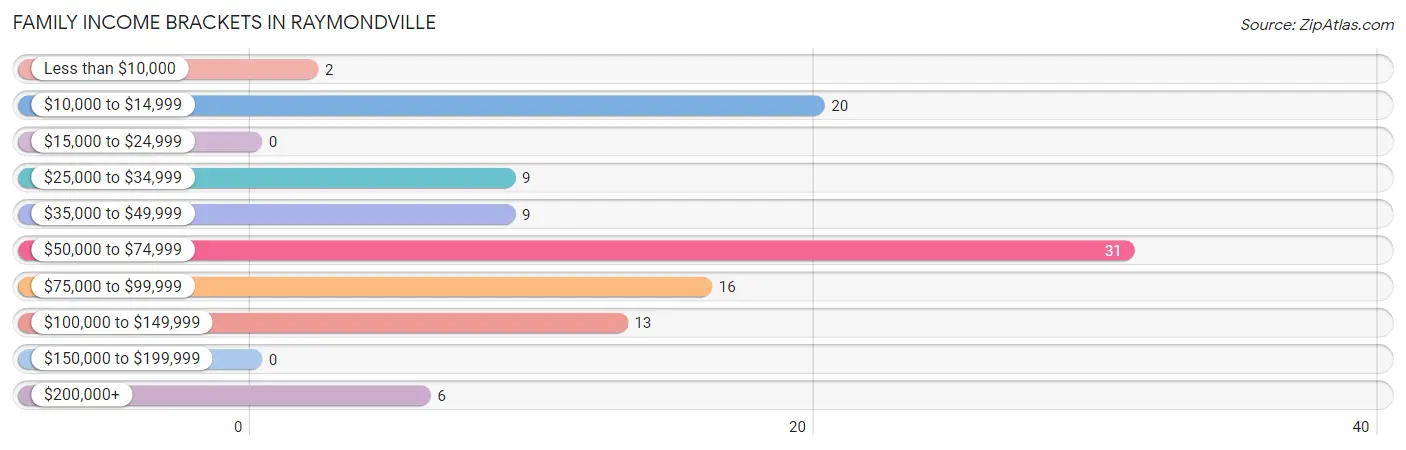
| Income Bracket | # Families | % Families |
| Less than $10,000 | 2 | 1.9% |
| $10,000 to $14,999 | 20 | 18.9% |
| $15,000 to $24,999 | 0 | 0.0% |
| $25,000 to $34,999 | 9 | 8.5% |
| $35,000 to $49,999 | 9 | 8.5% |
| $50,000 to $74,999 | 31 | 29.2% |
| $75,000 to $99,999 | 16 | 15.1% |
| $100,000 to $149,999 | 13 | 12.3% |
| $150,000 to $199,999 | 0 | 0.0% |
| $200,000+ | 6 | 5.7% |
Family Income by Famaliy Size in Raymondville
3-person families (12 | 11.3%) account for the highest median family income in Raymondville with $123,333 per family, while 3-person families (12 | 11.3%) have the highest median income of $41,111 per family member.
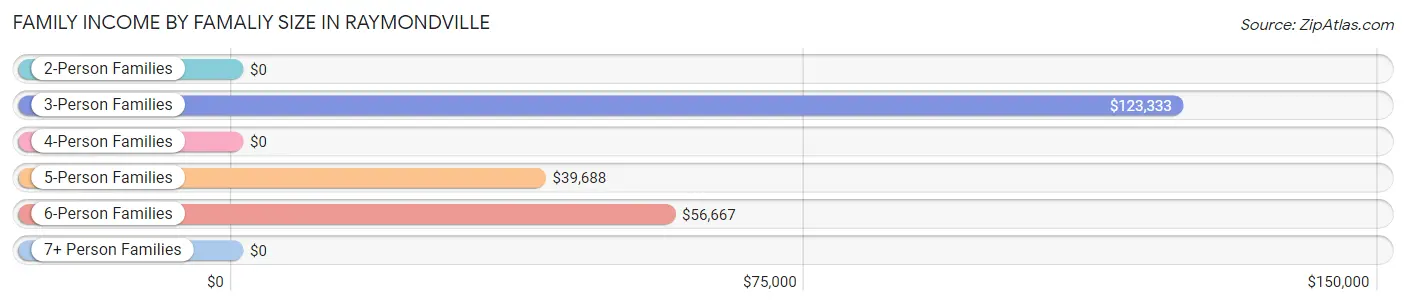
| Income Bracket | # Families | Median Income |
| 2-Person Families | 41 (38.7%) | $0 |
| 3-Person Families | 12 (11.3%) | $123,333 |
| 4-Person Families | 7 (6.6%) | $0 |
| 5-Person Families | 34 (32.1%) | $39,688 |
| 6-Person Families | 8 (7.5%) | $56,667 |
| 7+ Person Families | 4 (3.8%) | $0 |
| Total | 106 (100.0%) | $55,625 |
Family Income by Number of Earners in Raymondville
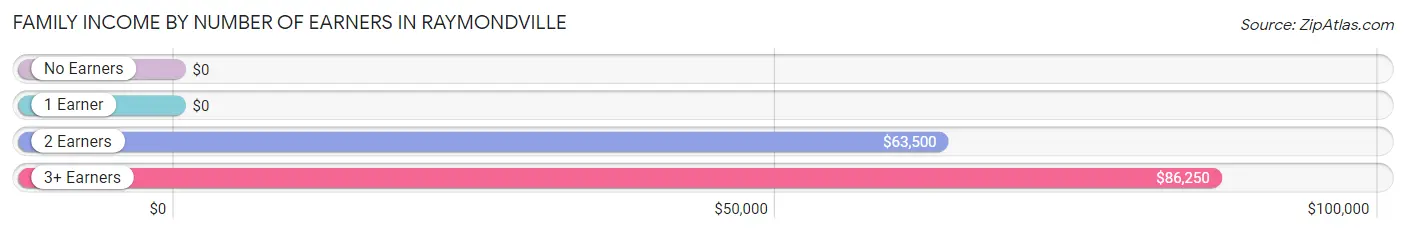
| Number of Earners | # Families | Median Income |
| No Earners | 7 (6.6%) | $0 |
| 1 Earner | 45 (42.4%) | $0 |
| 2 Earners | 46 (43.4%) | $63,500 |
| 3+ Earners | 8 (7.5%) | $86,250 |
| Total | 106 (100.0%) | $55,625 |
Household Income in Raymondville
Household Income Brackets in Raymondville
With 37 households falling in the category, the $25,000 to $34,999 income range is the most frequent in Raymondville, accounting for 19.7% of all households.
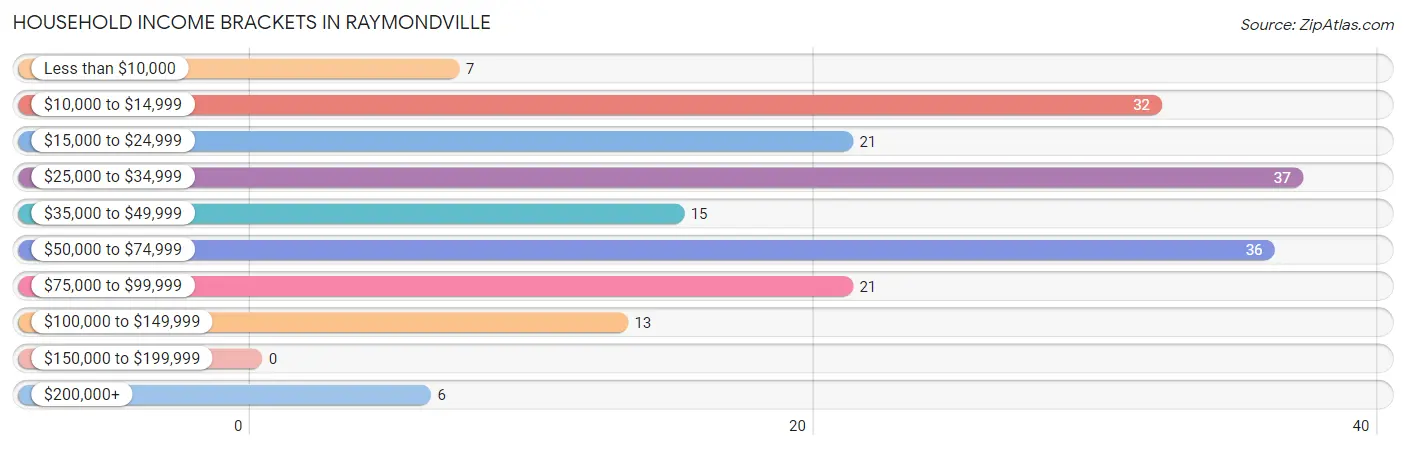
| Income Bracket | # Households | % Households |
| Less than $10,000 | 7 | 3.7% |
| $10,000 to $14,999 | 32 | 17.0% |
| $15,000 to $24,999 | 21 | 11.2% |
| $25,000 to $34,999 | 37 | 19.7% |
| $35,000 to $49,999 | 15 | 8.0% |
| $50,000 to $74,999 | 36 | 19.1% |
| $75,000 to $99,999 | 21 | 11.2% |
| $100,000 to $149,999 | 13 | 6.9% |
| $150,000 to $199,999 | 0 | 0.0% |
| $200,000+ | 6 | 3.2% |
Household Income by Householder Age in Raymondville
The median household income in Raymondville is $31,250, with the highest median household income of $50,375 found in the 45 to 64 years age bracket for the primary householder. A total of 91 households (48.4%) fall into this category. Meanwhile, the 15 to 24 years age bracket for the primary householder has the lowest median household income of $0, with 13 households (6.9%) in this group.
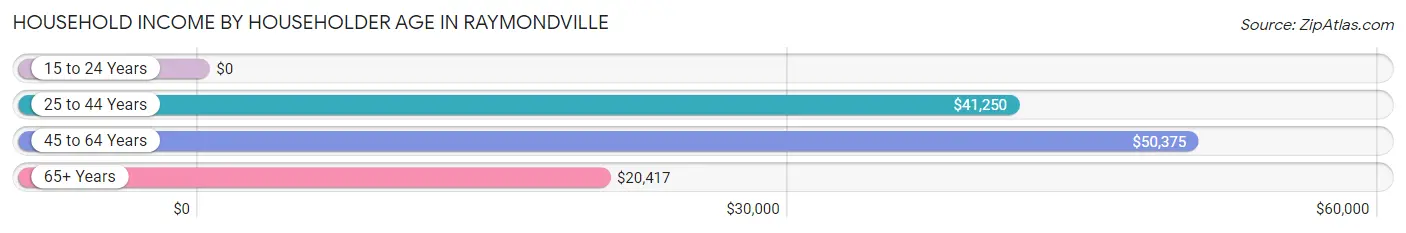
| Income Bracket | # Households | Median Income |
| 15 to 24 Years | 13 (6.9%) | $0 |
| 25 to 44 Years | 38 (20.2%) | $41,250 |
| 45 to 64 Years | 91 (48.4%) | $50,375 |
| 65+ Years | 46 (24.5%) | $20,417 |
| Total | 188 (100.0%) | $31,250 |
Poverty in Raymondville
Income Below Poverty by Sex and Age in Raymondville
With 20.6% poverty level for males and 23.4% for females among the residents of Raymondville, 5 year old males and 5 year old females are the most vulnerable to poverty, with 3 males (100.0%) and 3 females (100.0%) in their respective age groups living below the poverty level.
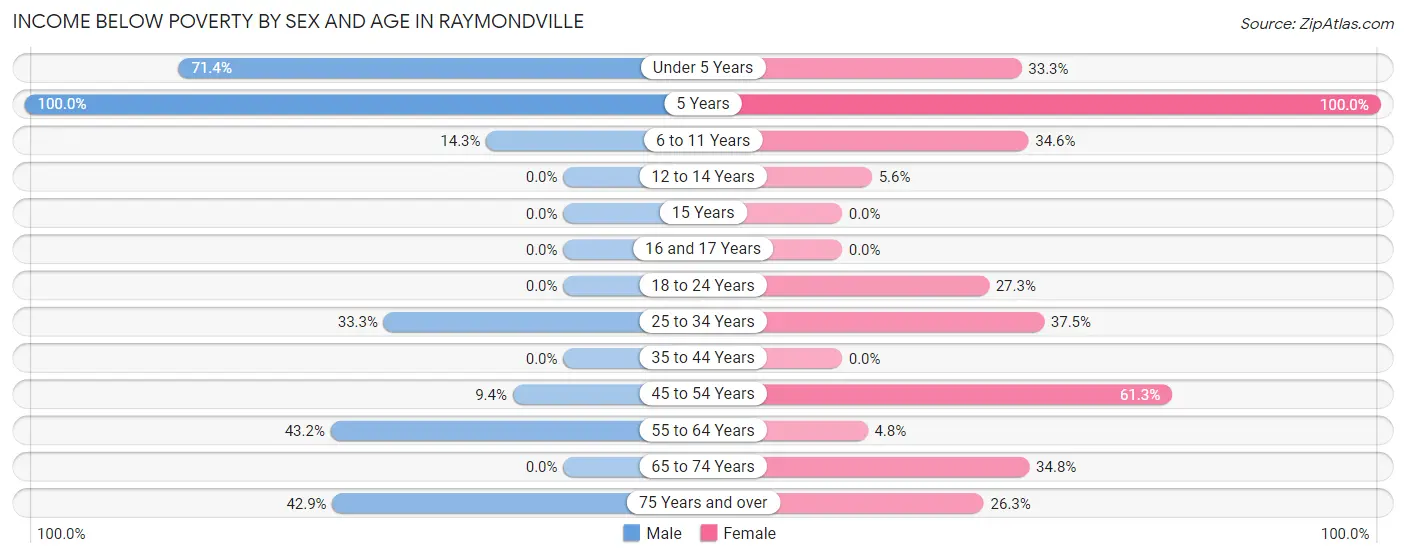
| Age Bracket | Male | Female |
| Under 5 Years | 10 (71.4%) | 3 (33.3%) |
| 5 Years | 3 (100.0%) | 3 (100.0%) |
| 6 to 11 Years | 5 (14.3%) | 9 (34.6%) |
| 12 to 14 Years | 0 (0.0%) | 2 (5.6%) |
| 15 Years | 0 (0.0%) | 0 (0.0%) |
| 16 and 17 Years | 0 (0.0%) | 0 (0.0%) |
| 18 to 24 Years | 0 (0.0%) | 6 (27.3%) |
| 25 to 34 Years | 5 (33.3%) | 6 (37.5%) |
| 35 to 44 Years | 0 (0.0%) | 0 (0.0%) |
| 45 to 54 Years | 3 (9.4%) | 19 (61.3%) |
| 55 to 64 Years | 19 (43.2%) | 2 (4.8%) |
| 65 to 74 Years | 0 (0.0%) | 8 (34.8%) |
| 75 Years and over | 6 (42.9%) | 5 (26.3%) |
| Total | 51 (20.6%) | 63 (23.4%) |
Income Above Poverty by Sex and Age in Raymondville
According to the poverty statistics in Raymondville, males aged 12 to 14 years and females aged 15 years are the age groups that are most secure financially, with 100.0% of males and 100.0% of females in these age groups living above the poverty line.
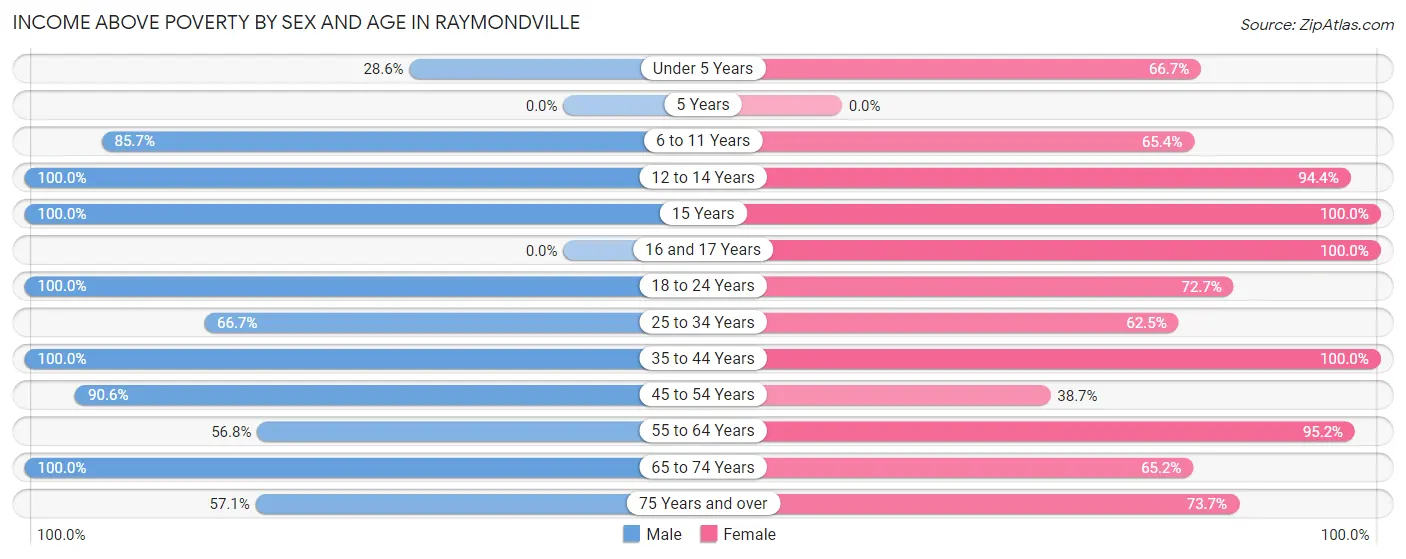
| Age Bracket | Male | Female |
| Under 5 Years | 4 (28.6%) | 6 (66.7%) |
| 5 Years | 0 (0.0%) | 0 (0.0%) |
| 6 to 11 Years | 30 (85.7%) | 17 (65.4%) |
| 12 to 14 Years | 20 (100.0%) | 34 (94.4%) |
| 15 Years | 4 (100.0%) | 4 (100.0%) |
| 16 and 17 Years | 0 (0.0%) | 9 (100.0%) |
| 18 to 24 Years | 40 (100.0%) | 16 (72.7%) |
| 25 to 34 Years | 10 (66.7%) | 10 (62.5%) |
| 35 to 44 Years | 17 (100.0%) | 29 (100.0%) |
| 45 to 54 Years | 29 (90.6%) | 12 (38.7%) |
| 55 to 64 Years | 25 (56.8%) | 40 (95.2%) |
| 65 to 74 Years | 10 (100.0%) | 15 (65.2%) |
| 75 Years and over | 8 (57.1%) | 14 (73.7%) |
| Total | 197 (79.4%) | 206 (76.6%) |
Income Below Poverty Among Married-Couple Families in Raymondville
The poverty statistics for married-couple families in Raymondville show that 24.0% or 24 of the total 100 families live below the poverty line. Families with 3 or 4 children have the highest poverty rate of 34.5%, comprising of 10 families. On the other hand, families with 1 or 2 children have the lowest poverty rate of 0.0%, which includes 0 families.
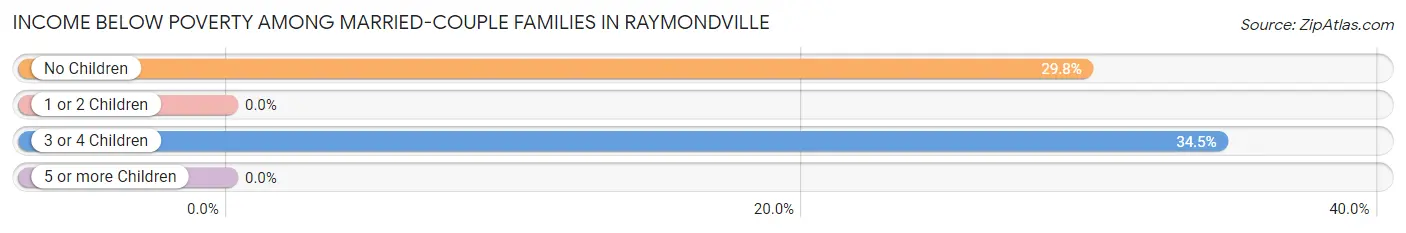
| Children | Above Poverty | Below Poverty |
| No Children | 33 (70.2%) | 14 (29.8%) |
| 1 or 2 Children | 20 (100.0%) | 0 (0.0%) |
| 3 or 4 Children | 19 (65.5%) | 10 (34.5%) |
| 5 or more Children | 4 (100.0%) | 0 (0.0%) |
| Total | 76 (76.0%) | 24 (24.0%) |
Income Below Poverty Among Single-Parent Households in Raymondville
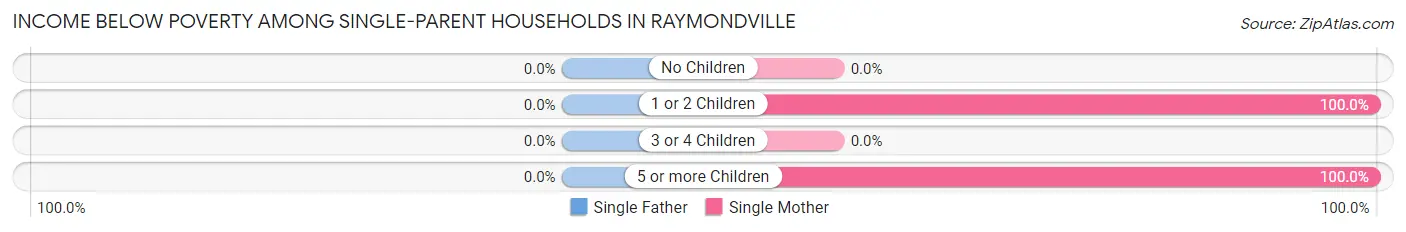
| Children | Single Father | Single Mother |
| No Children | 0 (0.0%) | 0 (0.0%) |
| 1 or 2 Children | 0 (0.0%) | 2 (100.0%) |
| 3 or 4 Children | 0 (0.0%) | 0 (0.0%) |
| 5 or more Children | 0 (0.0%) | 2 (100.0%) |
| Total | 0 (0.0%) | 4 (80.0%) |
Income Below Poverty Among Married-Couple vs Single-Parent Households in Raymondville
The poverty data for Raymondville shows that 24 of the married-couple family households (24.0%) and 4 of the single-parent households (66.7%) are living below the poverty level. Within the married-couple family households, those with 3 or 4 children have the highest poverty rate, with 10 households (34.5%) falling below the poverty line. Among the single-parent households, those with 1 or 2 children have the highest poverty rate, with 2 household (100.0%) living below poverty.
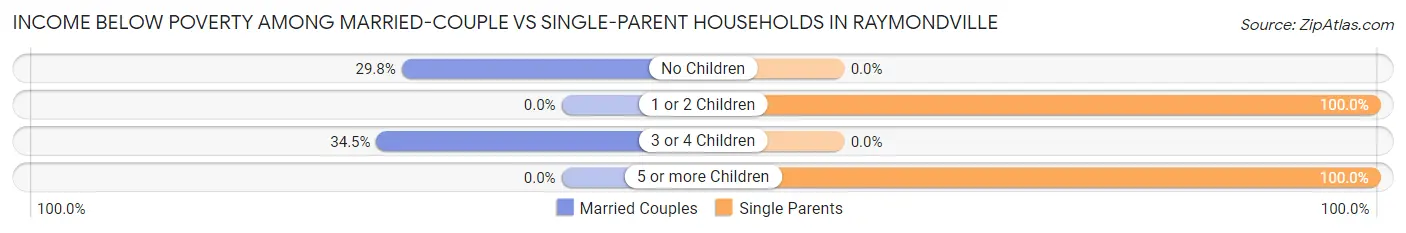
| Children | Married-Couple Families | Single-Parent Households |
| No Children | 14 (29.8%) | 0 (0.0%) |
| 1 or 2 Children | 0 (0.0%) | 2 (100.0%) |
| 3 or 4 Children | 10 (34.5%) | 0 (0.0%) |
| 5 or more Children | 0 (0.0%) | 2 (100.0%) |
| Total | 24 (24.0%) | 4 (66.7%) |
Race in Raymondville
The most populous races in Raymondville are White / Caucasian (514 | 97.4%), and Two or more Races (14 | 2.6%).
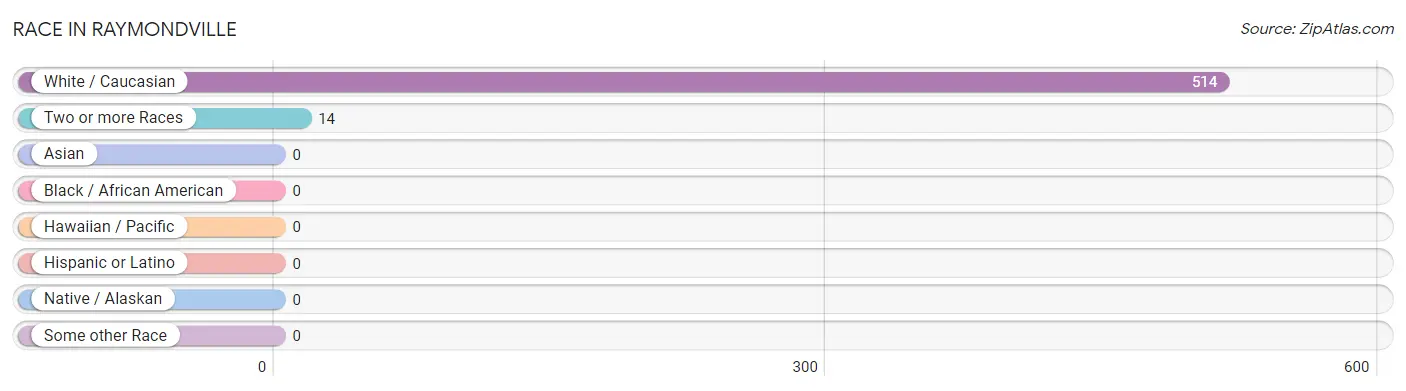
| Race | # Population | % Population |
| Asian | 0 | 0.0% |
| Black / African American | 0 | 0.0% |
| Hawaiian / Pacific | 0 | 0.0% |
| Hispanic or Latino | 0 | 0.0% |
| Native / Alaskan | 0 | 0.0% |
| White / Caucasian | 514 | 97.4% |
| Two or more Races | 14 | 2.6% |
| Some other Race | 0 | 0.0% |
| Total | 528 | 100.0% |
Ancestry in Raymondville
The most populous ancestries reported in Raymondville are Irish (84 | 15.9%), German (83 | 15.7%), English (46 | 8.7%), American (41 | 7.8%), and European (40 | 7.6%), together accounting for 55.7% of all Raymondville residents.
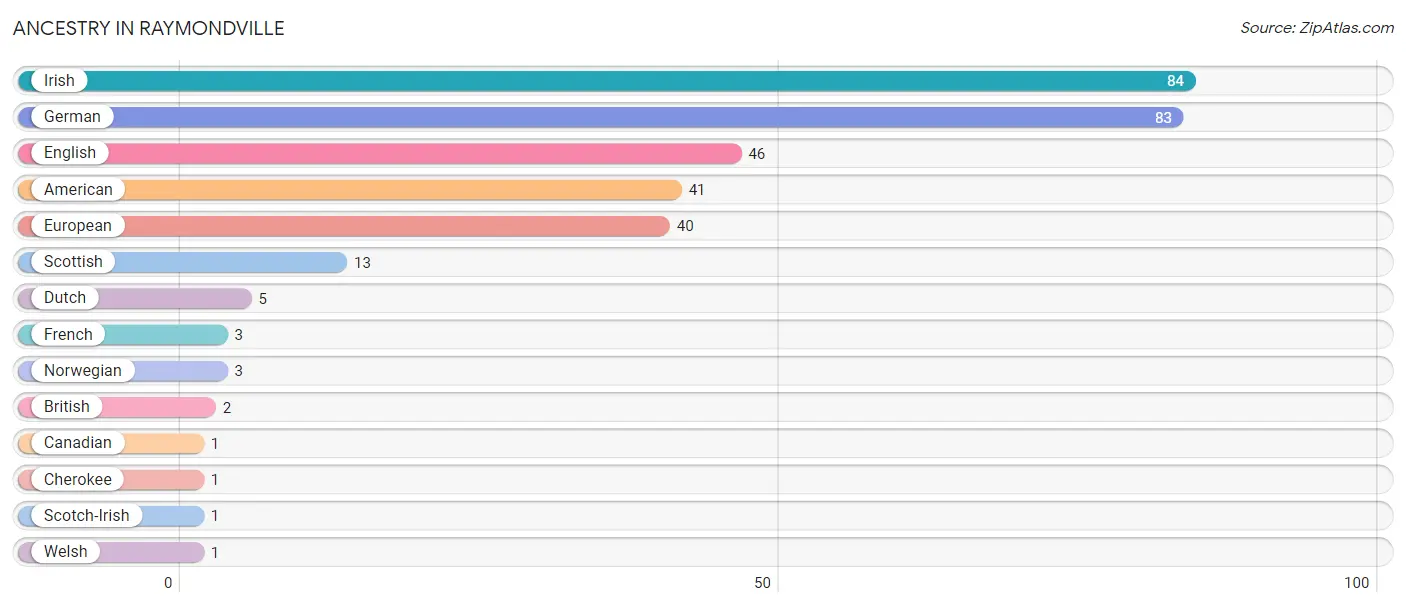
| Ancestry | # Population | % Population |
| American | 41 | 7.8% |
| British | 2 | 0.4% |
| Canadian | 1 | 0.2% |
| Cherokee | 1 | 0.2% |
| Dutch | 5 | 0.9% |
| English | 46 | 8.7% |
| European | 40 | 7.6% |
| French | 3 | 0.6% |
| German | 83 | 15.7% |
| Irish | 84 | 15.9% |
| Norwegian | 3 | 0.6% |
| Scotch-Irish | 1 | 0.2% |
| Scottish | 13 | 2.5% |
| Welsh | 1 | 0.2% | View All 14 Rows |
Immigrants in Raymondville

| Immigration Origin | # Population | % Population | View All 0 Rows |
Sex and Age in Raymondville
Sex and Age in Raymondville
The most populous age groups in Raymondville are 20 to 24 Years (40 | 15.4%) for men and 10 to 14 Years (38 | 14.1%) for women.
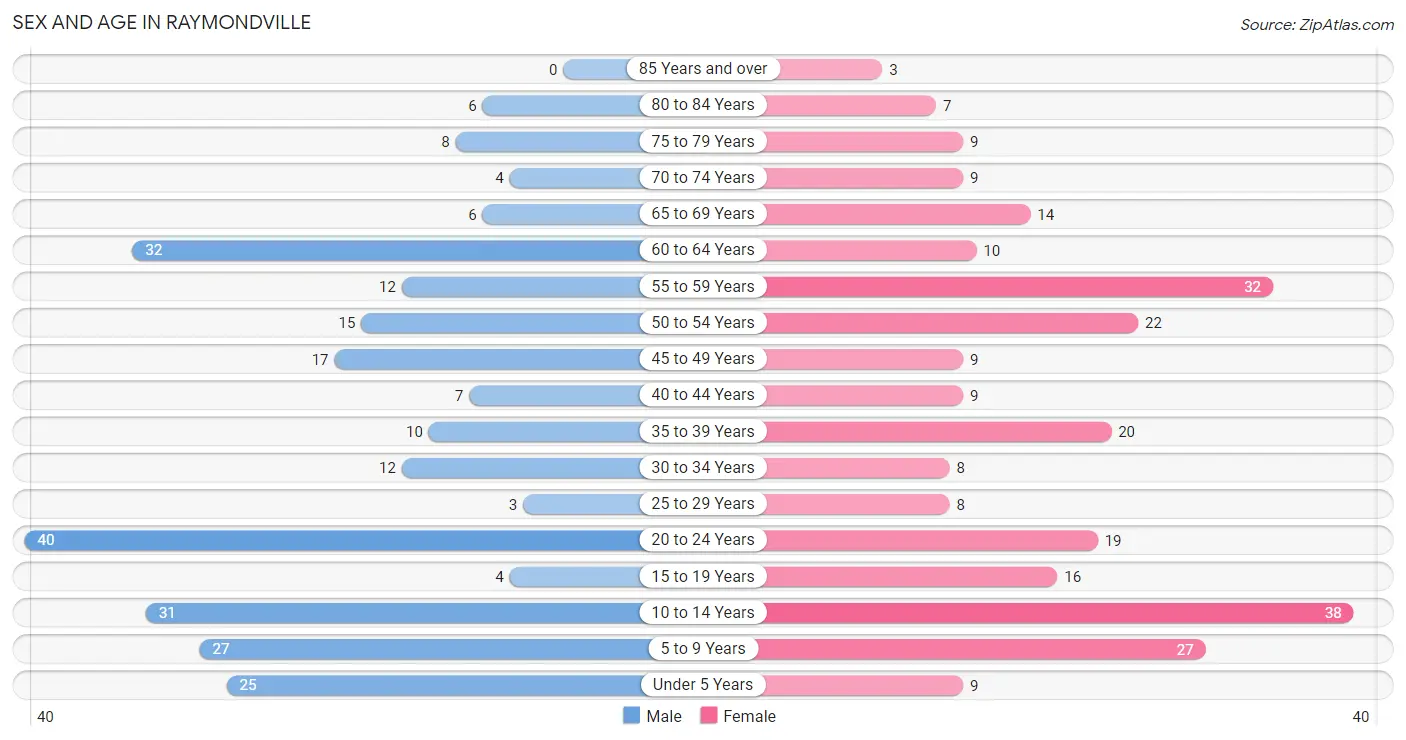
| Age Bracket | Male | Female |
| Under 5 Years | 25 (9.7%) | 9 (3.4%) |
| 5 to 9 Years | 27 (10.4%) | 27 (10.0%) |
| 10 to 14 Years | 31 (12.0%) | 38 (14.1%) |
| 15 to 19 Years | 4 (1.5%) | 16 (5.9%) |
| 20 to 24 Years | 40 (15.4%) | 19 (7.1%) |
| 25 to 29 Years | 3 (1.2%) | 8 (3.0%) |
| 30 to 34 Years | 12 (4.6%) | 8 (3.0%) |
| 35 to 39 Years | 10 (3.9%) | 20 (7.4%) |
| 40 to 44 Years | 7 (2.7%) | 9 (3.4%) |
| 45 to 49 Years | 17 (6.6%) | 9 (3.4%) |
| 50 to 54 Years | 15 (5.8%) | 22 (8.2%) |
| 55 to 59 Years | 12 (4.6%) | 32 (11.9%) |
| 60 to 64 Years | 32 (12.4%) | 10 (3.7%) |
| 65 to 69 Years | 6 (2.3%) | 14 (5.2%) |
| 70 to 74 Years | 4 (1.5%) | 9 (3.4%) |
| 75 to 79 Years | 8 (3.1%) | 9 (3.4%) |
| 80 to 84 Years | 6 (2.3%) | 7 (2.6%) |
| 85 Years and over | 0 (0.0%) | 3 (1.1%) |
| Total | 259 (100.0%) | 269 (100.0%) |
Families and Households in Raymondville
Median Family Size in Raymondville
The median family size in Raymondville is 3.93 persons per family, with single female/mother families (5 | 4.7%) accounting for the largest median family size of 4.6 persons per family. On the other hand, single male/father families (1 | 0.9%) represent the smallest median family size with 2.00 persons per family.
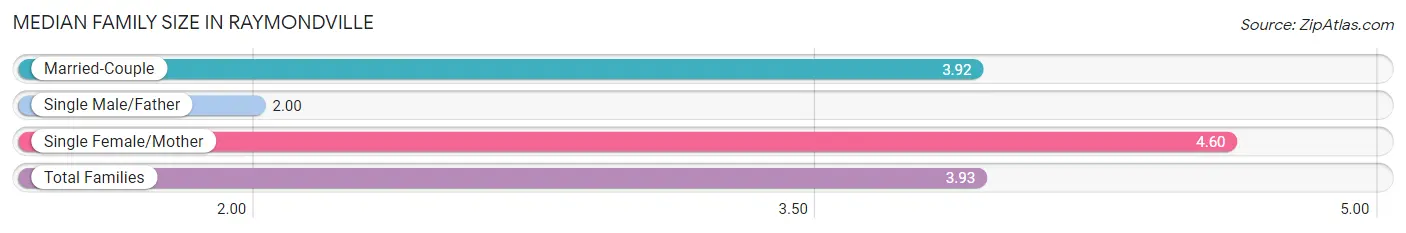
| Family Type | # Families | Family Size |
| Married-Couple | 100 (94.3%) | 3.92 |
| Single Male/Father | 1 (0.9%) | 2.00 |
| Single Female/Mother | 5 (4.7%) | 4.60 |
| Total Families | 106 (100.0%) | 3.93 |
Median Household Size in Raymondville
The median household size in Raymondville is 2.81 persons per household, with single female/mother households (5 | 2.7%) accounting for the largest median household size of 5 persons per household. non-family households (82 | 43.6%) represent the smallest median household size with 1.20 persons per household.
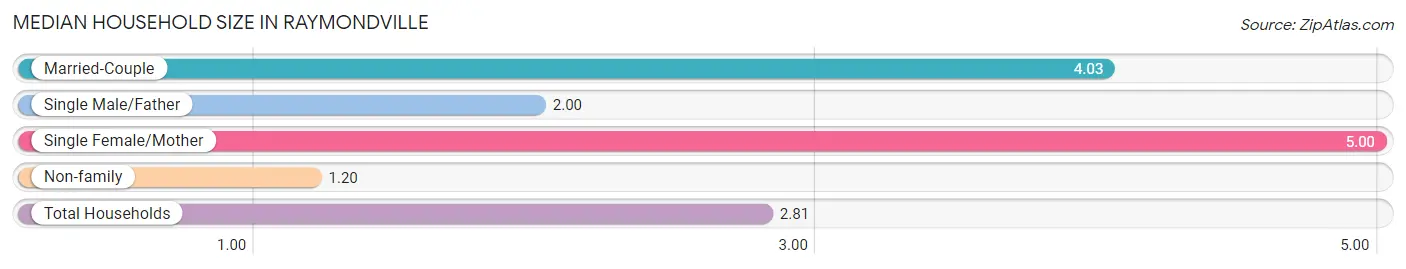
| Household Type | # Households | Household Size |
| Married-Couple | 100 (53.2%) | 4.03 |
| Single Male/Father | 1 (0.5%) | 2.00 |
| Single Female/Mother | 5 (2.7%) | 5.00 |
| Non-family | 82 (43.6%) | 1.20 |
| Total Households | 188 (100.0%) | 2.81 |
Household Size by Marriage Status in Raymondville
Out of a total of 188 households in Raymondville, 106 (56.4%) are family households, while 82 (43.6%) are nonfamily households. The most numerous type of family households are 2-person households, comprising 41, and the most common type of nonfamily households are 1-person households, comprising 66.
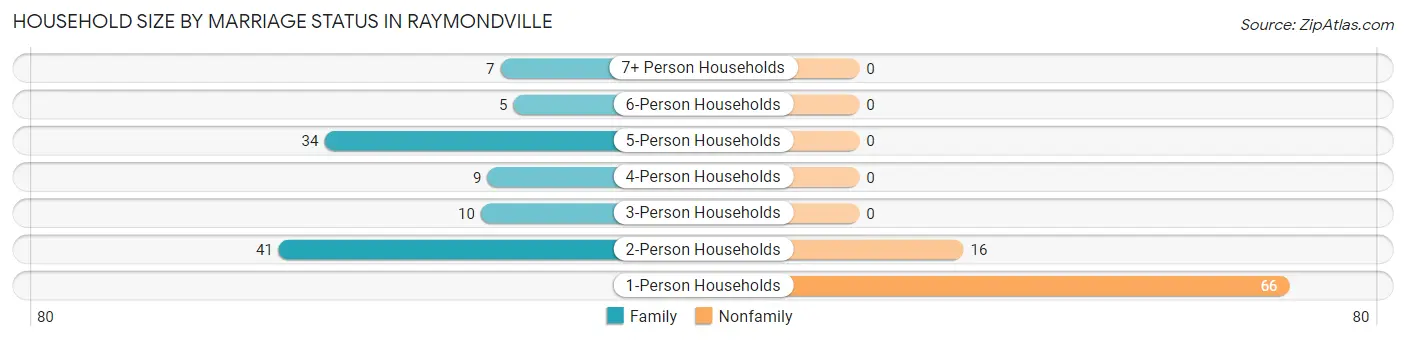
| Household Size | Family Households | Nonfamily Households |
| 1-Person Households | - | 66 (35.1%) |
| 2-Person Households | 41 (21.8%) | 16 (8.5%) |
| 3-Person Households | 10 (5.3%) | 0 (0.0%) |
| 4-Person Households | 9 (4.8%) | 0 (0.0%) |
| 5-Person Households | 34 (18.1%) | 0 (0.0%) |
| 6-Person Households | 5 (2.7%) | 0 (0.0%) |
| 7+ Person Households | 7 (3.7%) | 0 (0.0%) |
| Total | 106 (56.4%) | 82 (43.6%) |
Female Fertility in Raymondville
Fertility by Age in Raymondville
Average fertility rate in Raymondville is 79.0 births per 1,000 women. Women in the age bracket of 20 to 34 years have the highest fertility rate with 200.0 births per 1,000 women. Women in the age bracket of 20 to 34 years acount for 100.0% of all women with births.
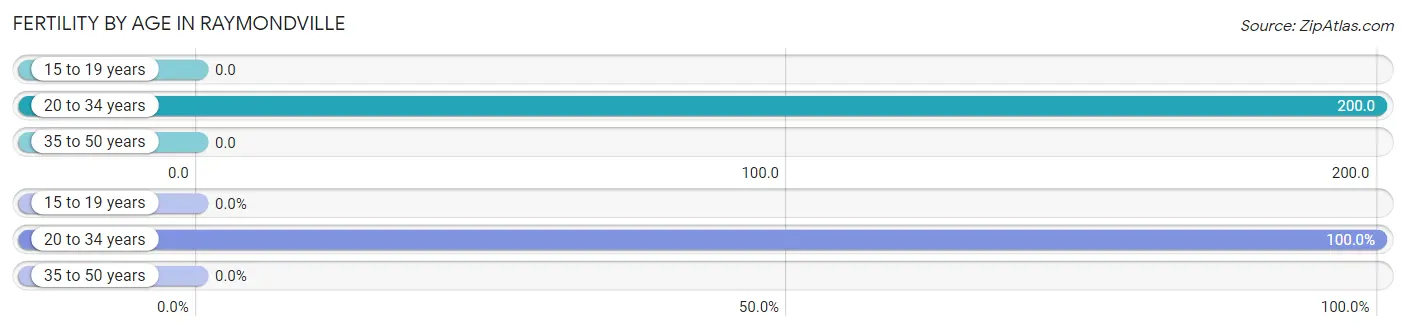
| Age Bracket | Women with Births | Births / 1,000 Women |
| 15 to 19 years | 0 (0.0%) | 0.0 |
| 20 to 34 years | 7 (100.0%) | 200.0 |
| 35 to 50 years | 0 (0.0%) | 0.0 |
| Total | 7 (100.0%) | 79.0 |
Fertility by Age by Marriage Status in Raymondville
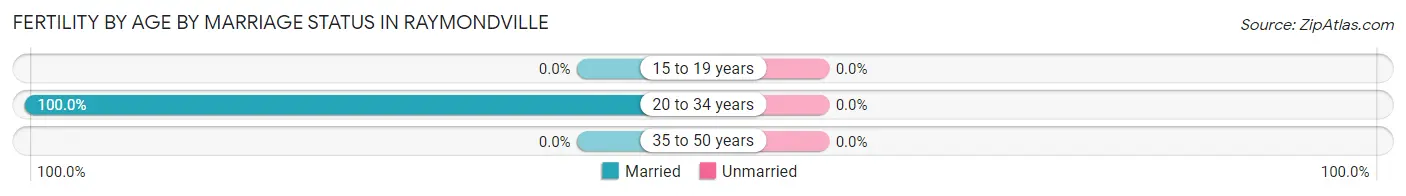
| Age Bracket | Married | Unmarried |
| 15 to 19 years | 0 (0.0%) | 0 (0.0%) |
| 20 to 34 years | 7 (100.0%) | 0 (0.0%) |
| 35 to 50 years | 0 (0.0%) | 0 (0.0%) |
| Total | 7 (100.0%) | 0 (0.0%) |
Fertility by Education in Raymondville
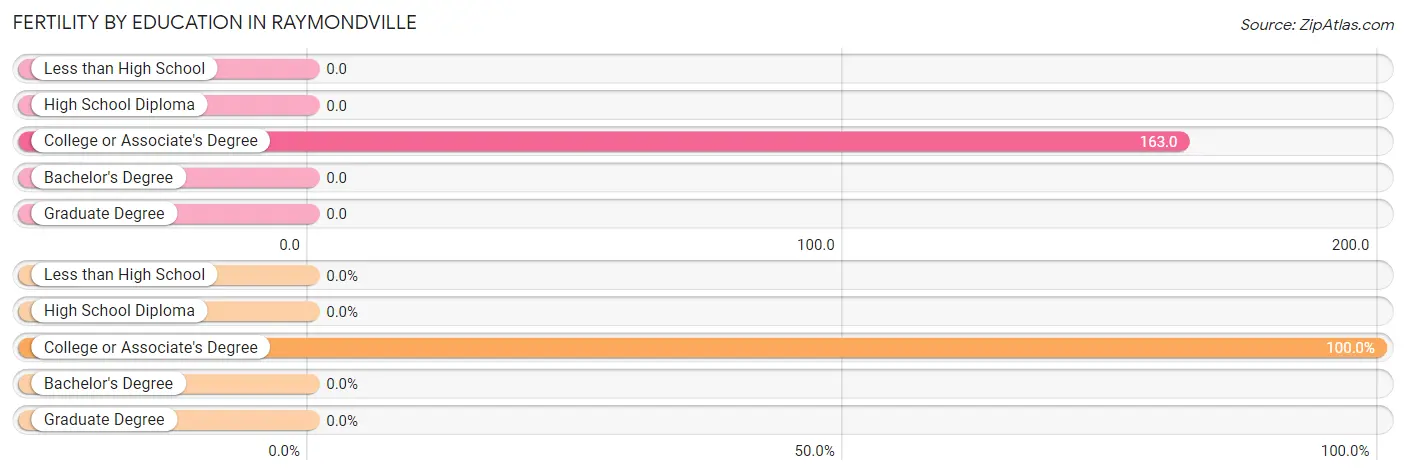
| Educational Attainment | Women with Births | Births / 1,000 Women |
| Less than High School | 0 (0.0%) | 0.0 |
| High School Diploma | 0 (0.0%) | 0.0 |
| College or Associate's Degree | 7 (100.0%) | 163.0 |
| Bachelor's Degree | 0 (0.0%) | 0.0 |
| Graduate Degree | 0 (0.0%) | 0.0 |
| Total | 7 (100.0%) | 79.0 |
Fertility by Education by Marriage Status in Raymondville
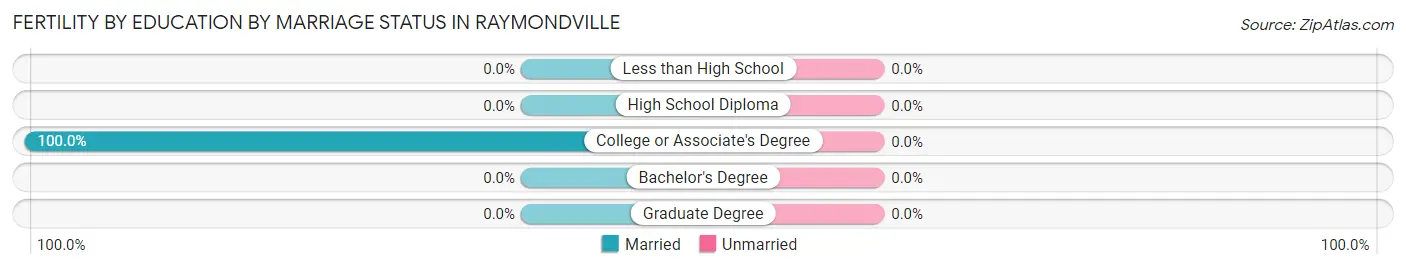
| Educational Attainment | Married | Unmarried |
| Less than High School | 0 (0.0%) | 0 (0.0%) |
| High School Diploma | 0 (0.0%) | 0 (0.0%) |
| College or Associate's Degree | 7 (100.0%) | 0 (0.0%) |
| Bachelor's Degree | 0 (0.0%) | 0 (0.0%) |
| Graduate Degree | 0 (0.0%) | 0 (0.0%) |
| Total | 7 (100.0%) | 0 (0.0%) |
Employment Characteristics in Raymondville
Employment by Class of Employer in Raymondville
Among the 188 employed individuals in Raymondville, private company employees (117 | 62.2%), not-for-profit organizations (43 | 22.9%), and state government employees (9 | 4.8%) make up the most common classes of employment.
| Employer Class | # Employees | % Employees |
| Private Company Employees | 117 | 62.2% |
| Self-Employed (Incorporated) | 0 | 0.0% |
| Self-Employed (Not Incorporated) | 7 | 3.7% |
| Not-for-profit Organizations | 43 | 22.9% |
| Local Government Employees | 6 | 3.2% |
| State Government Employees | 9 | 4.8% |
| Federal Government Employees | 6 | 3.2% |
| Unpaid Family Workers | 0 | 0.0% |
| Total | 188 | 100.0% |
Employment Status by Age in Raymondville
According to the labor force statistics for Raymondville, out of the total population over 16 years of age (363), 58.4% or 212 individuals are in the labor force, with 8.5% or 18 of them unemployed. The age group with the highest labor force participation rate is 25 to 29 years, with 100.0% or 11 individuals in the labor force. Within the labor force, the 16 to 19 years age range has the highest percentage of unemployed individuals, with 42.9% or 3 of them being unemployed.
| Age Bracket | In Labor Force | Unemployed |
| 16 to 19 Years | 7 (58.3%) | 3 (42.9%) |
| 20 to 24 Years | 32 (54.2%) | 6 (18.8%) |
| 25 to 29 Years | 11 (100.0%) | 0 (0.0%) |
| 30 to 34 Years | 16 (80.0%) | 0 (0.0%) |
| 35 to 44 Years | 31 (67.4%) | 1 (3.2%) |
| 45 to 54 Years | 52 (82.5%) | 0 (0.0%) |
| 55 to 59 Years | 37 (84.1%) | 2 (5.4%) |
| 60 to 64 Years | 23 (54.8%) | 6 (26.1%) |
| 65 to 74 Years | 1 (3.0%) | 0 (0.0%) |
| 75 Years and over | 2 (6.1%) | 0 (0.0%) |
| Total | 212 (58.4%) | 18 (8.5%) |
Employment Status by Educational Attainment in Raymondville
According to labor force statistics for Raymondville, 75.2% of individuals (170) out of the total population between 25 and 64 years of age (226) are in the labor force, with 5.3% or 9 of them being unemployed. The group with the highest labor force participation rate are those with the educational attainment of college / associate degree, with 95.1% or 58 individuals in the labor force. Within the labor force, individuals with high school diploma education have the highest percentage of unemployment, with 11.1% or 7 of them being unemployed.
| Educational Attainment | In Labor Force | Unemployed |
| Less than High School | 23 (63.9%) | 0 (0.0%) |
| High School Diploma | 63 (63.0%) | 11 (11.1%) |
| College / Associate Degree | 58 (95.1%) | 0 (0.0%) |
| Bachelor's Degree or higher | 26 (89.7%) | 2 (7.7%) |
| Total | 170 (75.2%) | 12 (5.3%) |
Employment Occupations by Sex in Raymondville
Management, Business, Science and Arts Occupations
The most common Management, Business, Science and Arts occupations in Raymondville are Community & Social Service (29 | 14.9%), Education Instruction & Library (29 | 14.9%), Management (11 | 5.7%), Health Diagnosing & Treating (11 | 5.7%), and Computers, Engineering & Science (2 | 1.0%).
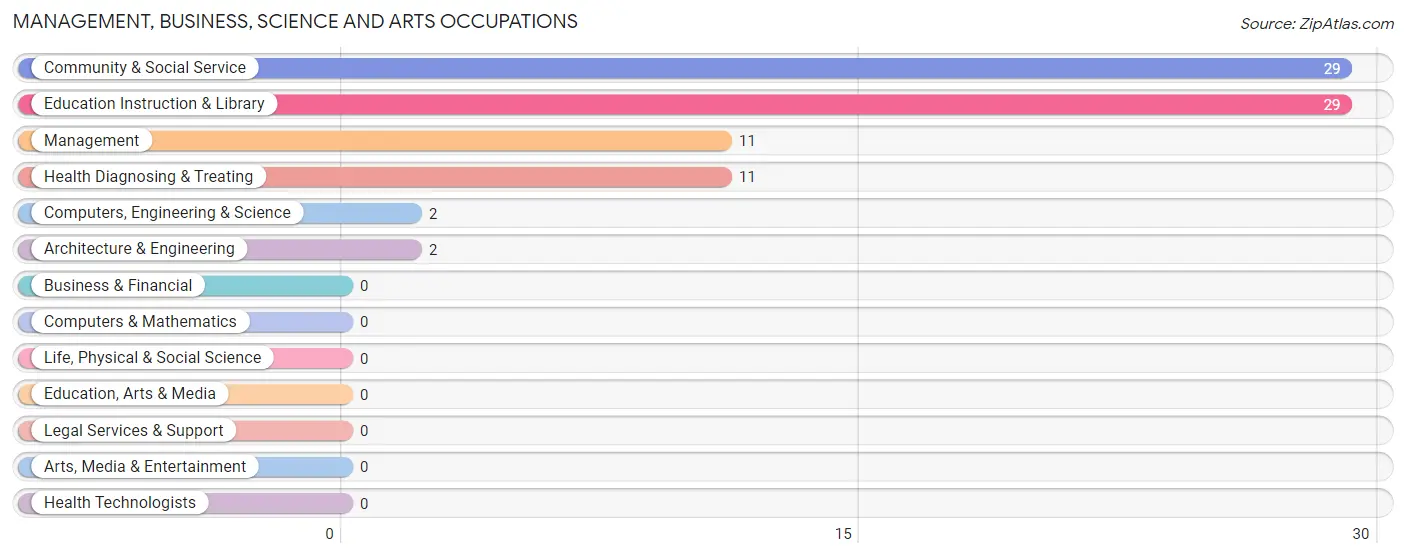
Management, Business, Science and Arts Occupations by Sex
Within the Management, Business, Science and Arts occupations in Raymondville, the most male-oriented occupations are Computers, Engineering & Science (100.0%), Architecture & Engineering (100.0%), and Management (45.5%), while the most female-oriented occupations are Community & Social Service (96.6%), Education Instruction & Library (96.6%), and Health Diagnosing & Treating (90.9%).
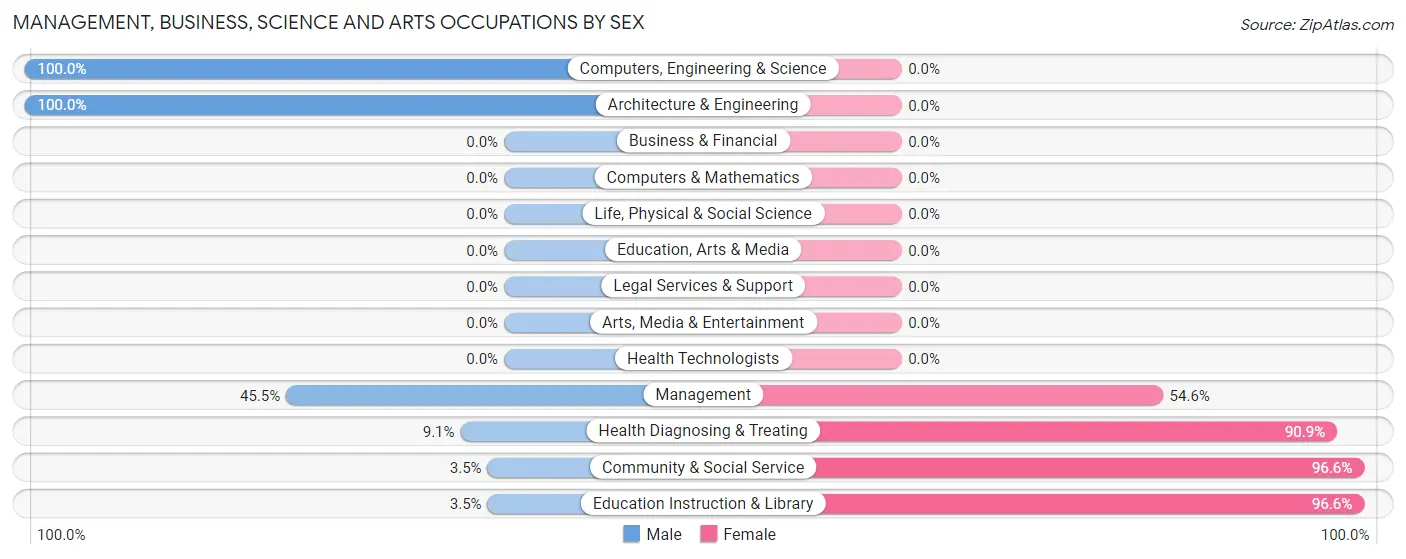
| Occupation | Male | Female |
| Management | 5 (45.5%) | 6 (54.5%) |
| Business & Financial | 0 (0.0%) | 0 (0.0%) |
| Computers, Engineering & Science | 2 (100.0%) | 0 (0.0%) |
| Computers & Mathematics | 0 (0.0%) | 0 (0.0%) |
| Architecture & Engineering | 2 (100.0%) | 0 (0.0%) |
| Life, Physical & Social Science | 0 (0.0%) | 0 (0.0%) |
| Community & Social Service | 1 (3.5%) | 28 (96.6%) |
| Education, Arts & Media | 0 (0.0%) | 0 (0.0%) |
| Legal Services & Support | 0 (0.0%) | 0 (0.0%) |
| Education Instruction & Library | 1 (3.5%) | 28 (96.6%) |
| Arts, Media & Entertainment | 0 (0.0%) | 0 (0.0%) |
| Health Diagnosing & Treating | 1 (9.1%) | 10 (90.9%) |
| Health Technologists | 0 (0.0%) | 0 (0.0%) |
| Total (Category) | 9 (17.0%) | 44 (83.0%) |
| Total (Overall) | 101 (52.1%) | 93 (47.9%) |
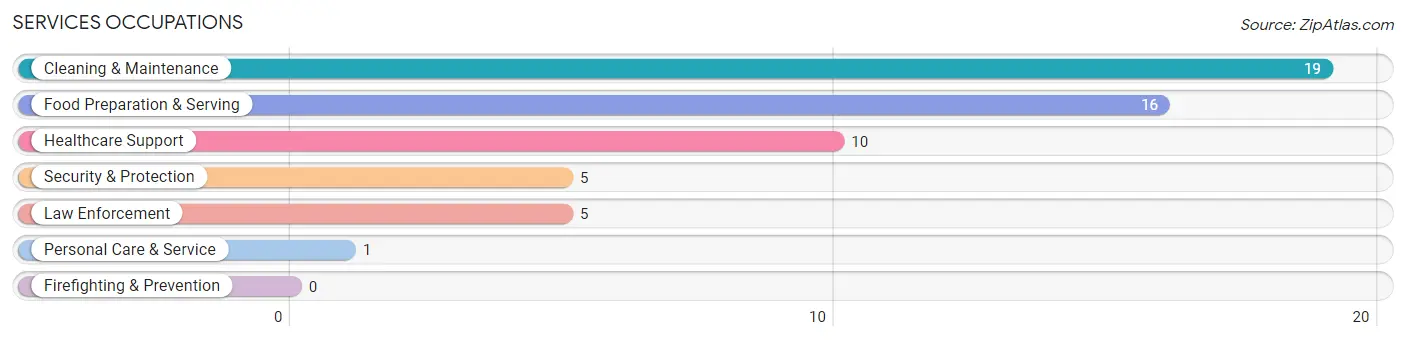
Services Occupations
The most common Services occupations in Raymondville are Cleaning & Maintenance (19 | 9.8%), Food Preparation & Serving (16 | 8.3%), Healthcare Support (10 | 5.1%), Security & Protection (5 | 2.6%), and Law Enforcement (5 | 2.6%).
Services Occupations by Sex
Within the Services occupations in Raymondville, the most male-oriented occupations are Security & Protection (100.0%), Law Enforcement (100.0%), and Cleaning & Maintenance (84.2%), while the most female-oriented occupations are Healthcare Support (100.0%), Food Preparation & Serving (100.0%), and Personal Care & Service (100.0%).
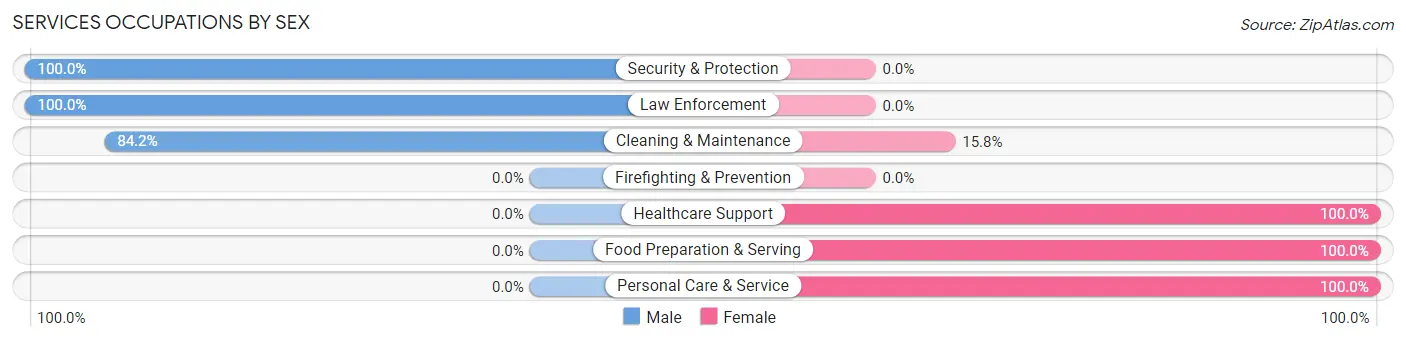
| Occupation | Male | Female |
| Healthcare Support | 0 (0.0%) | 10 (100.0%) |
| Security & Protection | 5 (100.0%) | 0 (0.0%) |
| Firefighting & Prevention | 0 (0.0%) | 0 (0.0%) |
| Law Enforcement | 5 (100.0%) | 0 (0.0%) |
| Food Preparation & Serving | 0 (0.0%) | 16 (100.0%) |
| Cleaning & Maintenance | 16 (84.2%) | 3 (15.8%) |
| Personal Care & Service | 0 (0.0%) | 1 (100.0%) |
| Total (Category) | 21 (41.2%) | 30 (58.8%) |
| Total (Overall) | 101 (52.1%) | 93 (47.9%) |
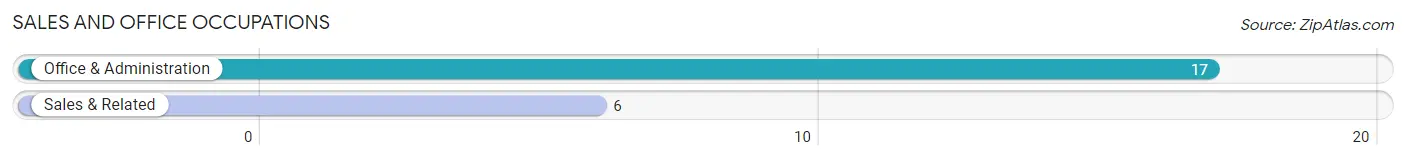
Sales and Office Occupations
The most common Sales and Office occupations in Raymondville are Office & Administration (17 | 8.8%), and Sales & Related (6 | 3.1%).
Sales and Office Occupations by Sex
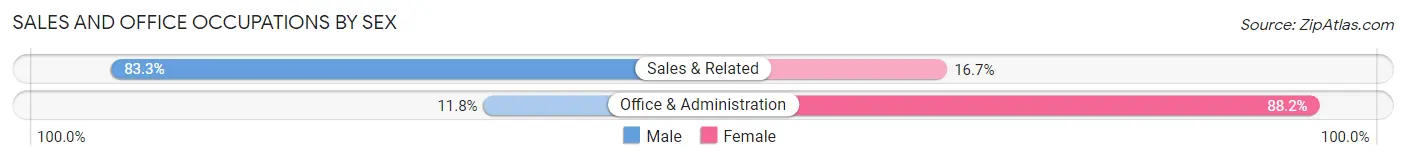
| Occupation | Male | Female |
| Sales & Related | 5 (83.3%) | 1 (16.7%) |
| Office & Administration | 2 (11.8%) | 15 (88.2%) |
| Total (Category) | 7 (30.4%) | 16 (69.6%) |
| Total (Overall) | 101 (52.1%) | 93 (47.9%) |
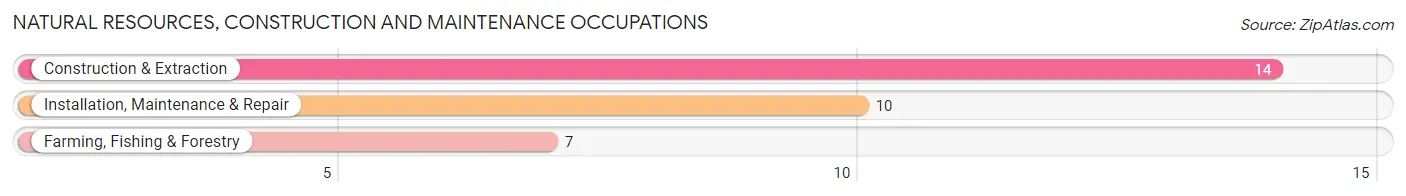
Natural Resources, Construction and Maintenance Occupations
The most common Natural Resources, Construction and Maintenance occupations in Raymondville are Construction & Extraction (14 | 7.2%), Installation, Maintenance & Repair (10 | 5.1%), and Farming, Fishing & Forestry (7 | 3.6%).
Natural Resources, Construction and Maintenance Occupations by Sex
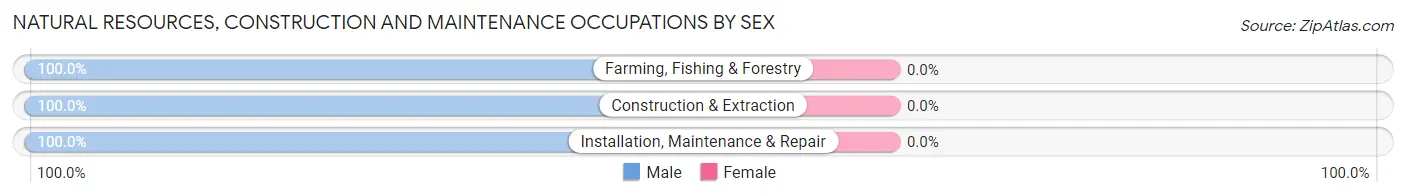
| Occupation | Male | Female |
| Farming, Fishing & Forestry | 7 (100.0%) | 0 (0.0%) |
| Construction & Extraction | 14 (100.0%) | 0 (0.0%) |
| Installation, Maintenance & Repair | 10 (100.0%) | 0 (0.0%) |
| Total (Category) | 31 (100.0%) | 0 (0.0%) |
| Total (Overall) | 101 (52.1%) | 93 (47.9%) |
Production, Transportation and Moving Occupations
The most common Production, Transportation and Moving occupations in Raymondville are Production (27 | 13.9%), Transportation (7 | 3.6%), and Material Moving (2 | 1.0%).
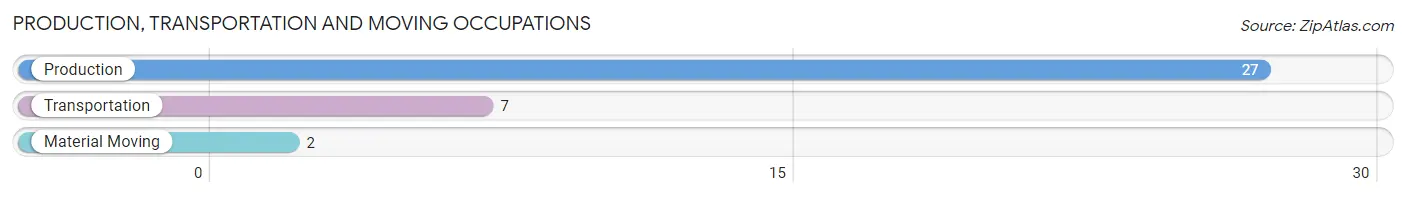
Production, Transportation and Moving Occupations by Sex
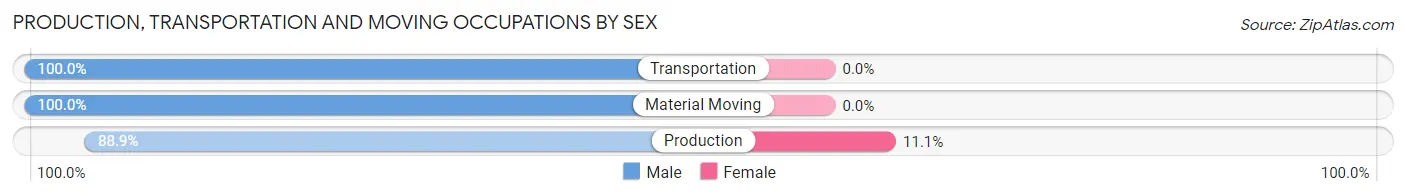
| Occupation | Male | Female |
| Production | 24 (88.9%) | 3 (11.1%) |
| Transportation | 7 (100.0%) | 0 (0.0%) |
| Material Moving | 2 (100.0%) | 0 (0.0%) |
| Total (Category) | 33 (91.7%) | 3 (8.3%) |
| Total (Overall) | 101 (52.1%) | 93 (47.9%) |
Employment Industries by Sex in Raymondville
Employment Industries in Raymondville
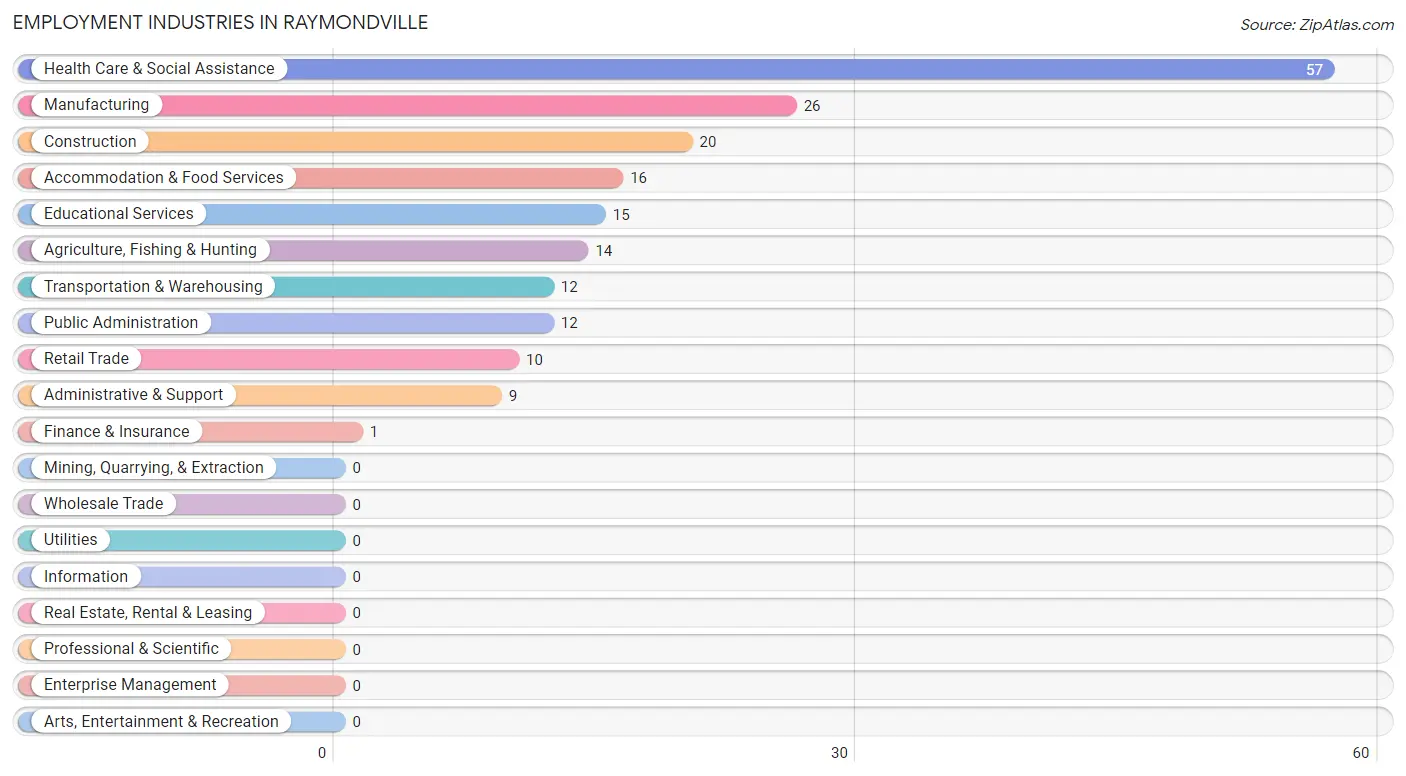
The major employment industries in Raymondville include Health Care & Social Assistance (57 | 29.4%), Manufacturing (26 | 13.4%), Construction (20 | 10.3%), Accommodation & Food Services (16 | 8.3%), and Educational Services (15 | 7.7%).
Employment Industries by Sex in Raymondville
The Raymondville industries that see more men than women are Agriculture, Fishing & Hunting (100.0%), Construction (100.0%), and Administrative & Support (100.0%), whereas the industries that tend to have a higher number of women are Finance & Insurance (100.0%), Accommodation & Food Services (100.0%), and Health Care & Social Assistance (91.2%).
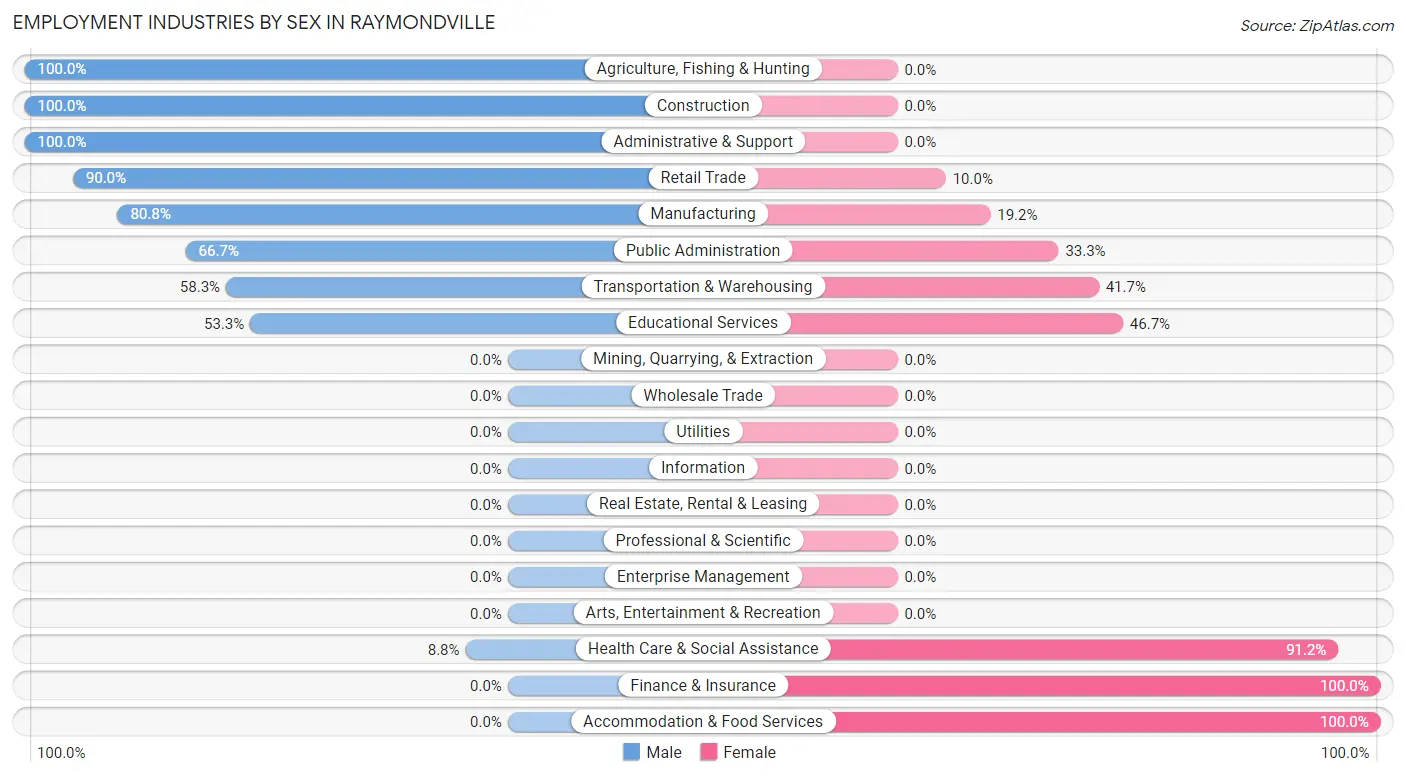
| Industry | Male | Female |
| Agriculture, Fishing & Hunting | 14 (100.0%) | 0 (0.0%) |
| Mining, Quarrying, & Extraction | 0 (0.0%) | 0 (0.0%) |
| Construction | 20 (100.0%) | 0 (0.0%) |
| Manufacturing | 21 (80.8%) | 5 (19.2%) |
| Wholesale Trade | 0 (0.0%) | 0 (0.0%) |
| Retail Trade | 9 (90.0%) | 1 (10.0%) |
| Transportation & Warehousing | 7 (58.3%) | 5 (41.7%) |
| Utilities | 0 (0.0%) | 0 (0.0%) |
| Information | 0 (0.0%) | 0 (0.0%) |
| Finance & Insurance | 0 (0.0%) | 1 (100.0%) |
| Real Estate, Rental & Leasing | 0 (0.0%) | 0 (0.0%) |
| Professional & Scientific | 0 (0.0%) | 0 (0.0%) |
| Enterprise Management | 0 (0.0%) | 0 (0.0%) |
| Administrative & Support | 9 (100.0%) | 0 (0.0%) |
| Educational Services | 8 (53.3%) | 7 (46.7%) |
| Health Care & Social Assistance | 5 (8.8%) | 52 (91.2%) |
| Arts, Entertainment & Recreation | 0 (0.0%) | 0 (0.0%) |
| Accommodation & Food Services | 0 (0.0%) | 16 (100.0%) |
| Public Administration | 8 (66.7%) | 4 (33.3%) |
| Total | 101 (52.1%) | 93 (47.9%) |
Education in Raymondville
School Enrollment in Raymondville
The most common levels of schooling among the 117 students in Raymondville are elementary school (43 | 36.7%), high school (27 | 23.1%), and middle school (24 | 20.5%).
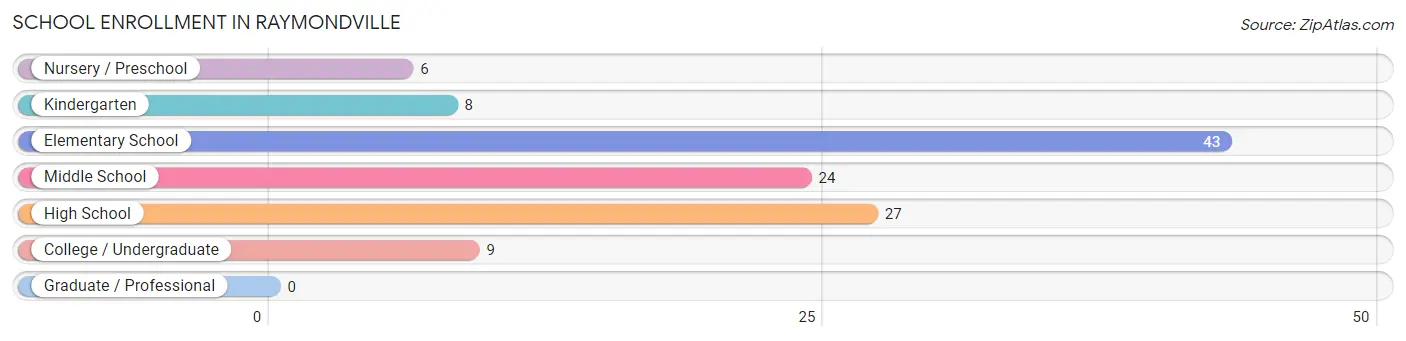
| School Level | # Students | % Students |
| Nursery / Preschool | 6 | 5.1% |
| Kindergarten | 8 | 6.8% |
| Elementary School | 43 | 36.7% |
| Middle School | 24 | 20.5% |
| High School | 27 | 23.1% |
| College / Undergraduate | 9 | 7.7% |
| Graduate / Professional | 0 | 0.0% |
| Total | 117 | 100.0% |
School Enrollment by Age by Funding Source in Raymondville
Out of a total of 117 students who are enrolled in schools in Raymondville, 4 (3.4%) attend a private institution, while the remaining 113 (96.6%) are enrolled in public schools. The age group of 35 years and over has the highest likelihood of being enrolled in private schools, with 4 (100.0% in the age bracket) enrolled. Conversely, the age group of 3 to 4 year olds has the lowest likelihood of being enrolled in a private school, with 3 (100.0% in the age bracket) attending a public institution.
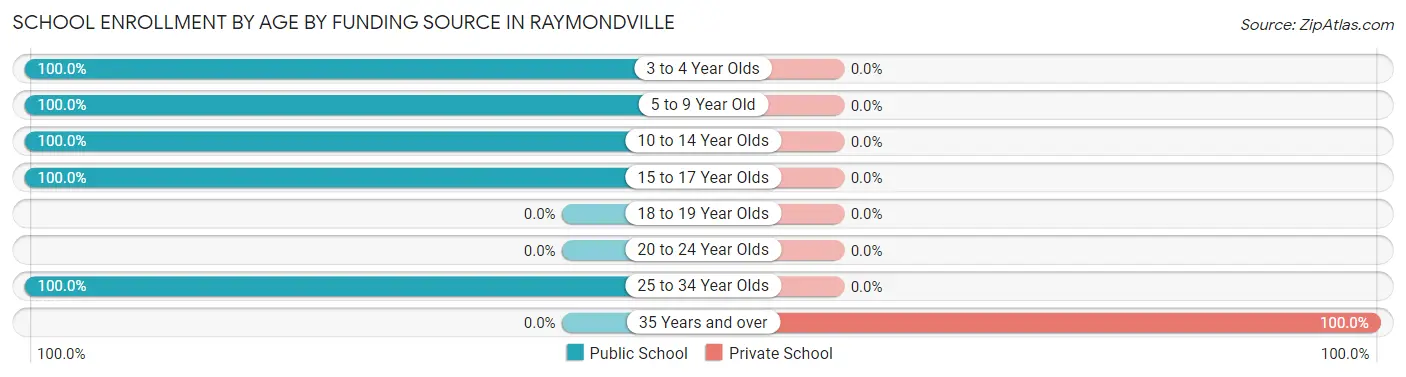
| Age Bracket | Public School | Private School |
| 3 to 4 Year Olds | 3 (100.0%) | 0 (0.0%) |
| 5 to 9 Year Old | 54 (100.0%) | 0 (0.0%) |
| 10 to 14 Year Olds | 34 (100.0%) | 0 (0.0%) |
| 15 to 17 Year Olds | 17 (100.0%) | 0 (0.0%) |
| 18 to 19 Year Olds | 0 (0.0%) | 0 (0.0%) |
| 20 to 24 Year Olds | 0 (0.0%) | 0 (0.0%) |
| 25 to 34 Year Olds | 5 (100.0%) | 0 (0.0%) |
| 35 Years and over | 0 (0.0%) | 4 (100.0%) |
| Total | 113 (96.6%) | 4 (3.4%) |
Educational Attainment by Field of Study in Raymondville
Business (21 | 63.6%), social sciences (4 | 12.1%), arts & humanities (4 | 12.1%), science & technology (3 | 9.1%), and education (1 | 3.0%) are the most common fields of study among 33 individuals in Raymondville who have obtained a bachelor's degree or higher.
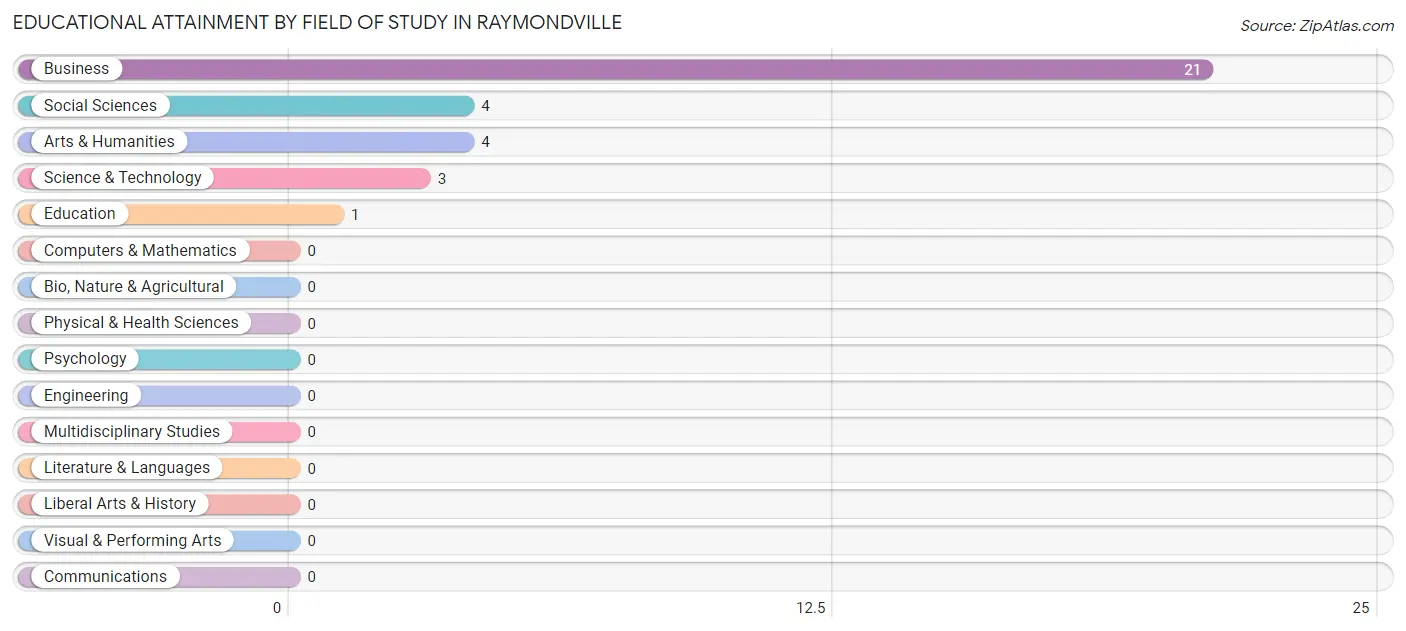
| Field of Study | # Graduates | % Graduates |
| Computers & Mathematics | 0 | 0.0% |
| Bio, Nature & Agricultural | 0 | 0.0% |
| Physical & Health Sciences | 0 | 0.0% |
| Psychology | 0 | 0.0% |
| Social Sciences | 4 | 12.1% |
| Engineering | 0 | 0.0% |
| Multidisciplinary Studies | 0 | 0.0% |
| Science & Technology | 3 | 9.1% |
| Business | 21 | 63.6% |
| Education | 1 | 3.0% |
| Literature & Languages | 0 | 0.0% |
| Liberal Arts & History | 0 | 0.0% |
| Visual & Performing Arts | 0 | 0.0% |
| Communications | 0 | 0.0% |
| Arts & Humanities | 4 | 12.1% |
| Total | 33 | 100.0% |
Transportation & Commute in Raymondville
Vehicle Availability by Sex in Raymondville
The most prevalent vehicle ownership categories in Raymondville are males with 2 vehicles (45, accounting for 47.4%) and females with 2 vehicles (45, making up 48.4%).
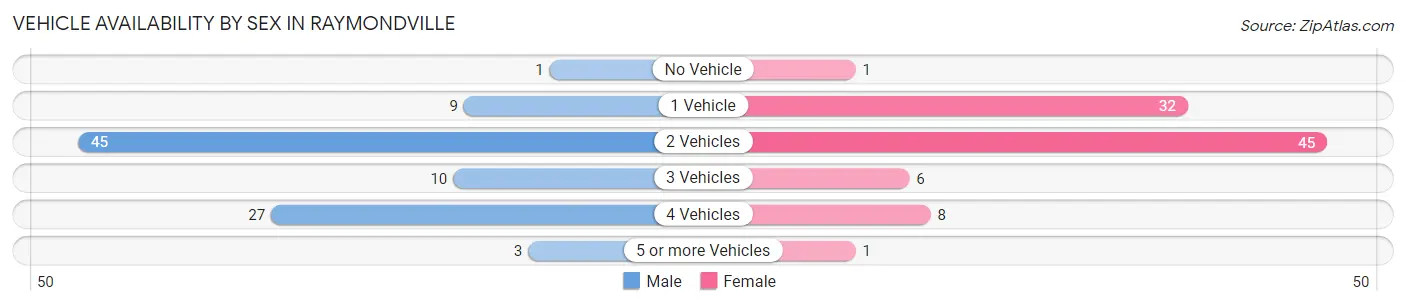
| Vehicles Available | Male | Female |
| No Vehicle | 1 (1.1%) | 1 (1.1%) |
| 1 Vehicle | 9 (9.5%) | 32 (34.4%) |
| 2 Vehicles | 45 (47.4%) | 45 (48.4%) |
| 3 Vehicles | 10 (10.5%) | 6 (6.5%) |
| 4 Vehicles | 27 (28.4%) | 8 (8.6%) |
| 5 or more Vehicles | 3 (3.2%) | 1 (1.1%) |
| Total | 95 (100.0%) | 93 (100.0%) |
Commute Time in Raymondville
The most frequently occuring commute durations in Raymondville are 15 to 19 minutes (61 commuters, 33.3%), 10 to 14 minutes (36 commuters, 19.7%), and 30 to 34 minutes (29 commuters, 15.9%).
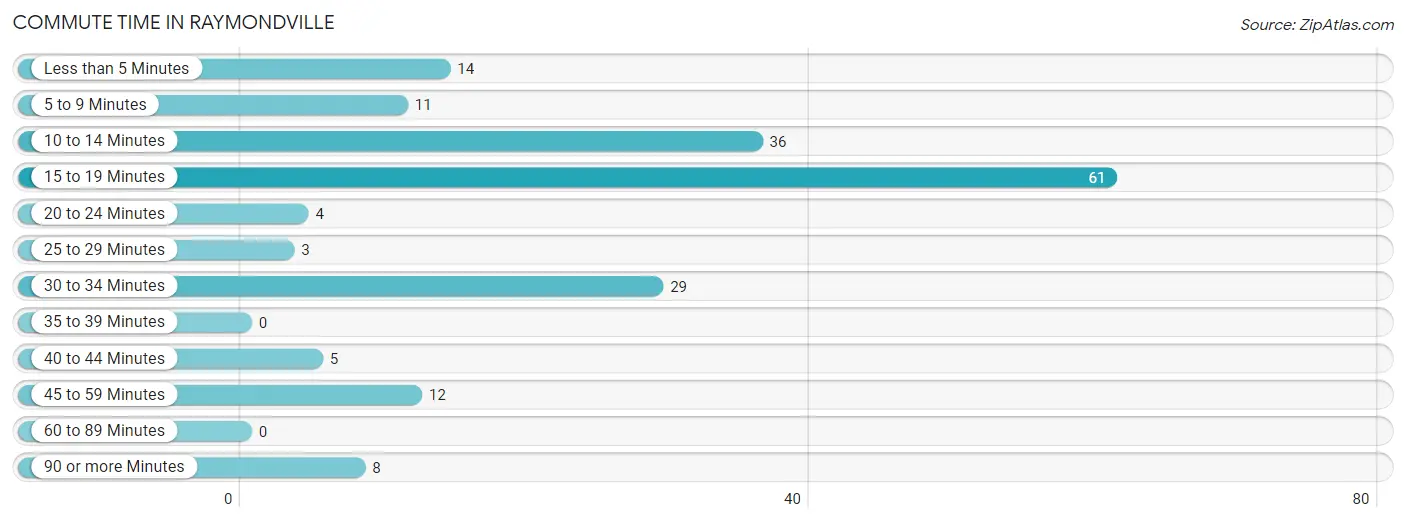
| Commute Time | # Commuters | % Commuters |
| Less than 5 Minutes | 14 | 7.6% |
| 5 to 9 Minutes | 11 | 6.0% |
| 10 to 14 Minutes | 36 | 19.7% |
| 15 to 19 Minutes | 61 | 33.3% |
| 20 to 24 Minutes | 4 | 2.2% |
| 25 to 29 Minutes | 3 | 1.6% |
| 30 to 34 Minutes | 29 | 15.9% |
| 35 to 39 Minutes | 0 | 0.0% |
| 40 to 44 Minutes | 5 | 2.7% |
| 45 to 59 Minutes | 12 | 6.6% |
| 60 to 89 Minutes | 0 | 0.0% |
| 90 or more Minutes | 8 | 4.4% |
Commute Time by Sex in Raymondville
The most common commute times in Raymondville are 30 to 34 minutes (29 commuters, 30.5%) for males and 10 to 14 minutes (35 commuters, 39.8%) for females.
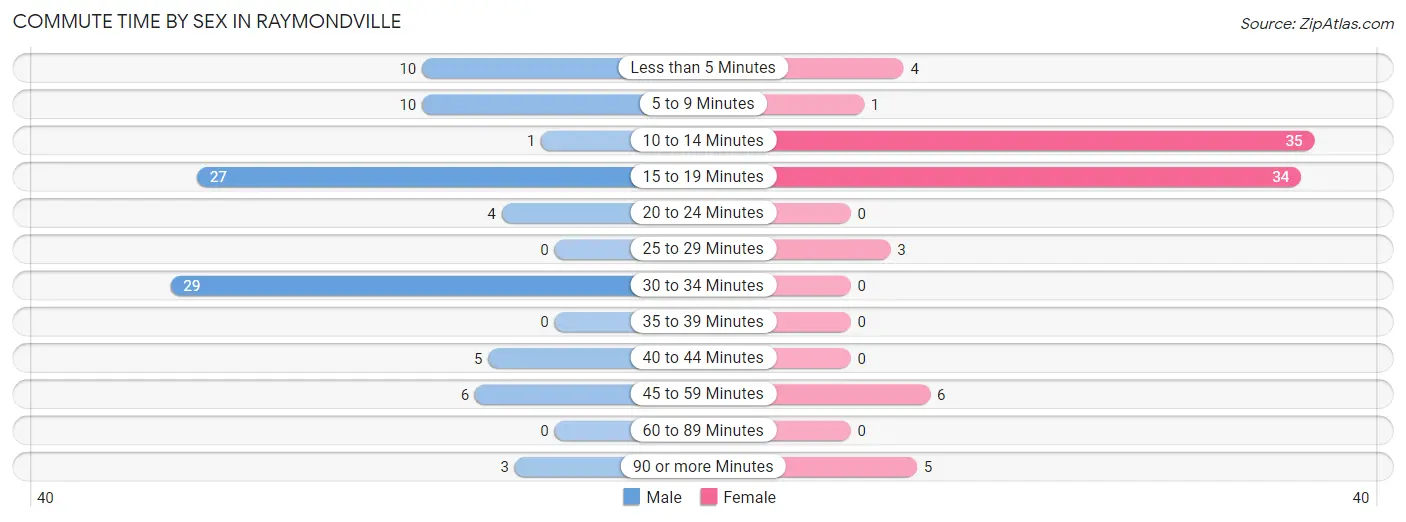
| Commute Time | Male | Female |
| Less than 5 Minutes | 10 (10.5%) | 4 (4.5%) |
| 5 to 9 Minutes | 10 (10.5%) | 1 (1.1%) |
| 10 to 14 Minutes | 1 (1.1%) | 35 (39.8%) |
| 15 to 19 Minutes | 27 (28.4%) | 34 (38.6%) |
| 20 to 24 Minutes | 4 (4.2%) | 0 (0.0%) |
| 25 to 29 Minutes | 0 (0.0%) | 3 (3.4%) |
| 30 to 34 Minutes | 29 (30.5%) | 0 (0.0%) |
| 35 to 39 Minutes | 0 (0.0%) | 0 (0.0%) |
| 40 to 44 Minutes | 5 (5.3%) | 0 (0.0%) |
| 45 to 59 Minutes | 6 (6.3%) | 6 (6.8%) |
| 60 to 89 Minutes | 0 (0.0%) | 0 (0.0%) |
| 90 or more Minutes | 3 (3.2%) | 5 (5.7%) |
Time of Departure to Work by Sex in Raymondville
The most frequent times of departure to work in Raymondville are 6:00 AM to 6:29 AM (21, 22.1%) for males and 5:30 AM to 5:59 AM (26, 29.5%) for females.
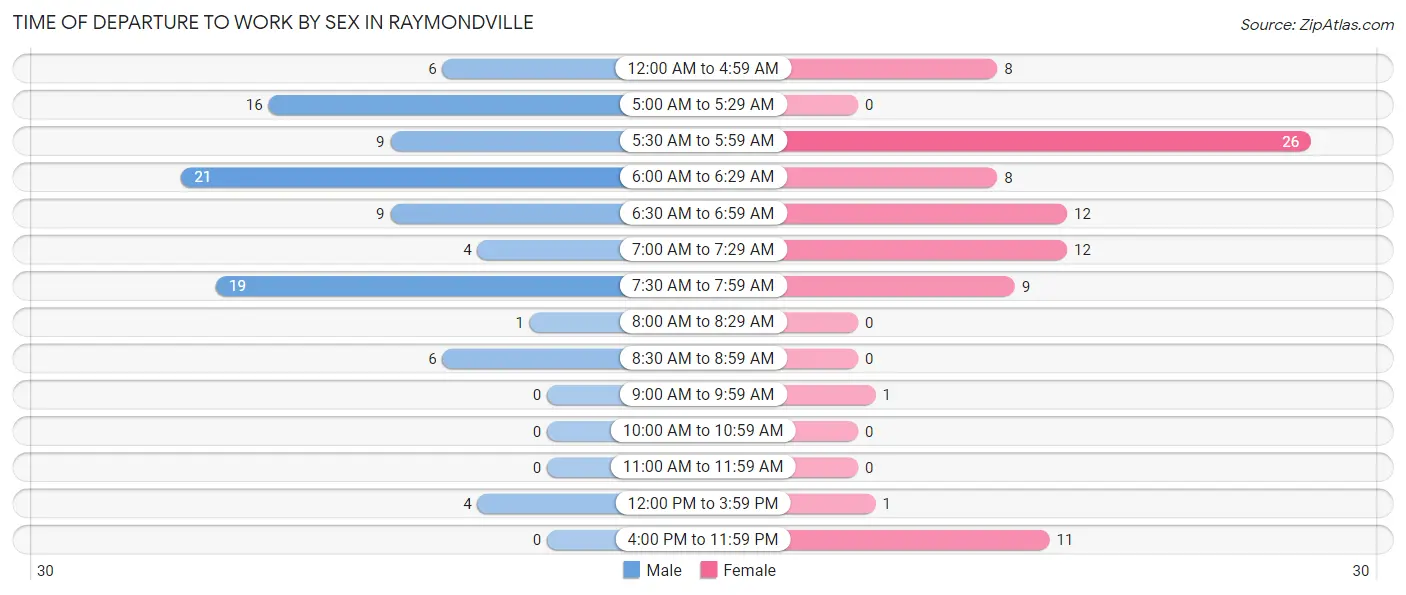
| Time of Departure | Male | Female |
| 12:00 AM to 4:59 AM | 6 (6.3%) | 8 (9.1%) |
| 5:00 AM to 5:29 AM | 16 (16.8%) | 0 (0.0%) |
| 5:30 AM to 5:59 AM | 9 (9.5%) | 26 (29.5%) |
| 6:00 AM to 6:29 AM | 21 (22.1%) | 8 (9.1%) |
| 6:30 AM to 6:59 AM | 9 (9.5%) | 12 (13.6%) |
| 7:00 AM to 7:29 AM | 4 (4.2%) | 12 (13.6%) |
| 7:30 AM to 7:59 AM | 19 (20.0%) | 9 (10.2%) |
| 8:00 AM to 8:29 AM | 1 (1.1%) | 0 (0.0%) |
| 8:30 AM to 8:59 AM | 6 (6.3%) | 0 (0.0%) |
| 9:00 AM to 9:59 AM | 0 (0.0%) | 1 (1.1%) |
| 10:00 AM to 10:59 AM | 0 (0.0%) | 0 (0.0%) |
| 11:00 AM to 11:59 AM | 0 (0.0%) | 0 (0.0%) |
| 12:00 PM to 3:59 PM | 4 (4.2%) | 1 (1.1%) |
| 4:00 PM to 11:59 PM | 0 (0.0%) | 11 (12.5%) |
| Total | 95 (100.0%) | 88 (100.0%) |
Housing Occupancy in Raymondville
Occupancy by Ownership in Raymondville
Of the total 188 dwellings in Raymondville, owner-occupied units account for 126 (67.0%), while renter-occupied units make up 62 (33.0%).
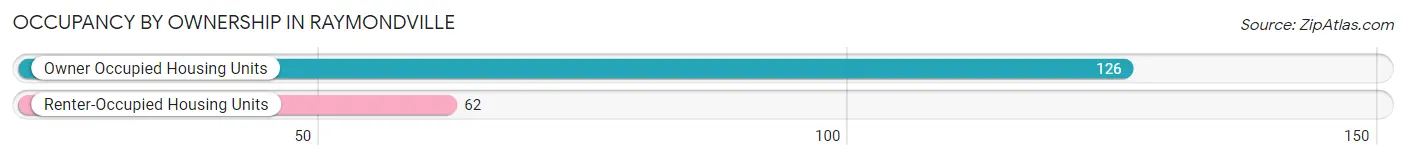
| Occupancy | # Housing Units | % Housing Units |
| Owner Occupied Housing Units | 126 | 67.0% |
| Renter-Occupied Housing Units | 62 | 33.0% |
| Total Occupied Housing Units | 188 | 100.0% |
Occupancy by Household Size in Raymondville
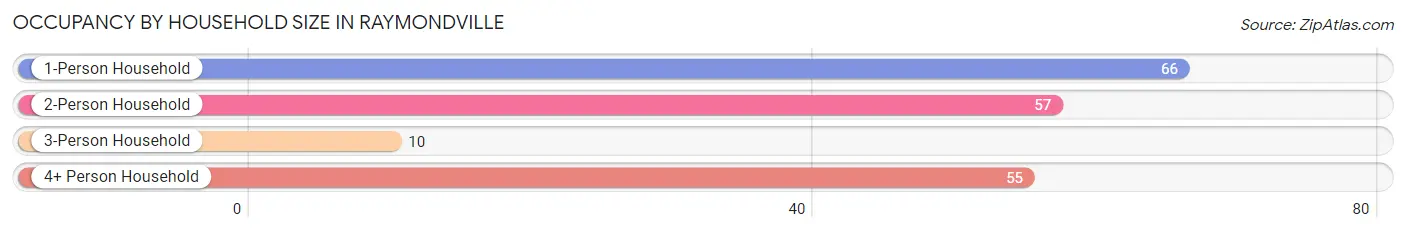
| Household Size | # Housing Units | % Housing Units |
| 1-Person Household | 66 | 35.1% |
| 2-Person Household | 57 | 30.3% |
| 3-Person Household | 10 | 5.3% |
| 4+ Person Household | 55 | 29.3% |
| Total Housing Units | 188 | 100.0% |
Occupancy by Ownership by Household Size in Raymondville
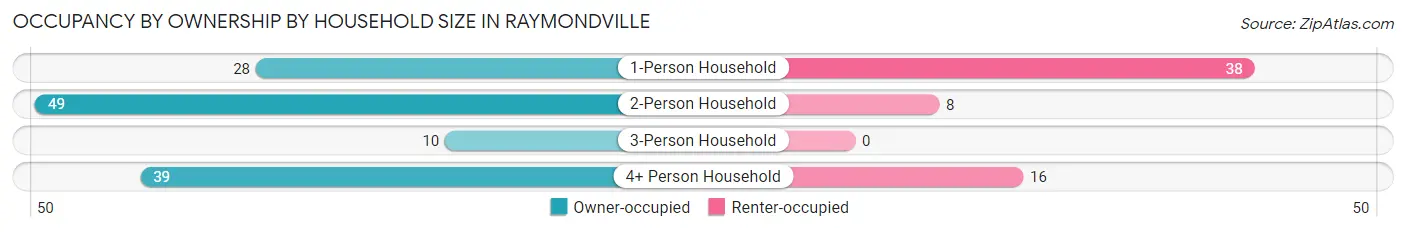
| Household Size | Owner-occupied | Renter-occupied |
| 1-Person Household | 28 (42.4%) | 38 (57.6%) |
| 2-Person Household | 49 (86.0%) | 8 (14.0%) |
| 3-Person Household | 10 (100.0%) | 0 (0.0%) |
| 4+ Person Household | 39 (70.9%) | 16 (29.1%) |
| Total Housing Units | 126 (67.0%) | 62 (33.0%) |
Occupancy by Educational Attainment in Raymondville
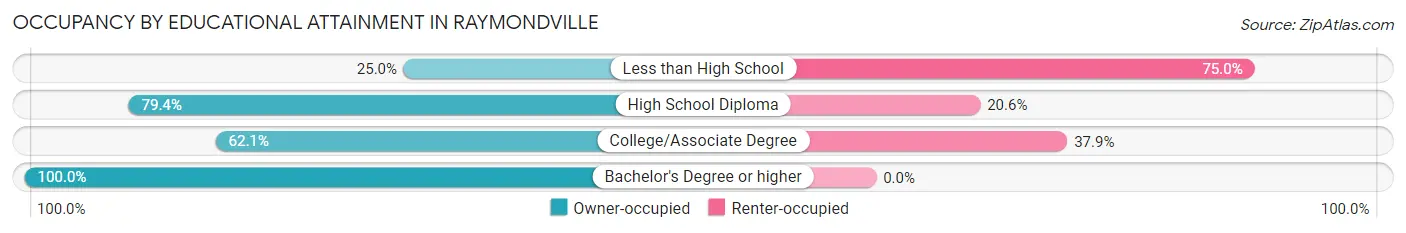
| Household Size | Owner-occupied | Renter-occupied |
| Less than High School | 8 (25.0%) | 24 (75.0%) |
| High School Diploma | 50 (79.4%) | 13 (20.6%) |
| College/Associate Degree | 41 (62.1%) | 25 (37.9%) |
| Bachelor's Degree or higher | 27 (100.0%) | 0 (0.0%) |
Occupancy by Age of Householder in Raymondville
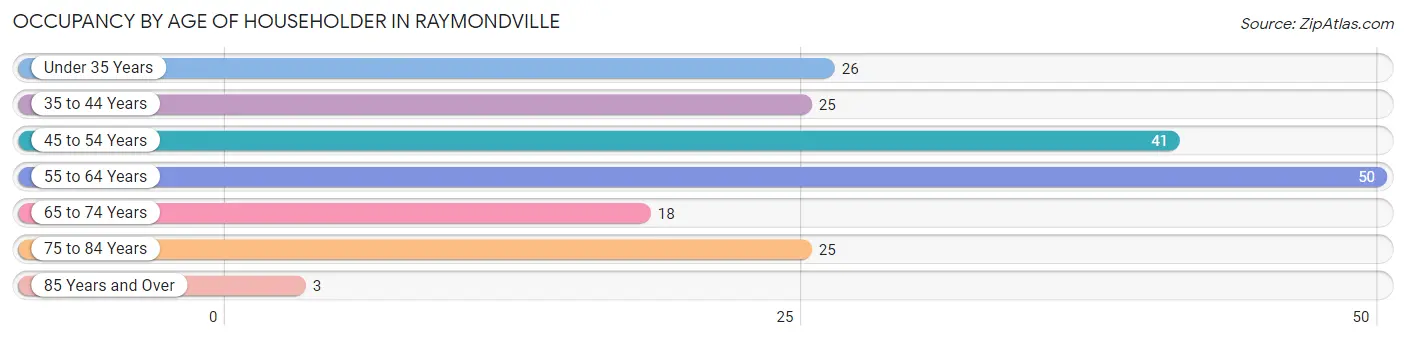
| Age Bracket | # Households | % Households |
| Under 35 Years | 26 | 13.8% |
| 35 to 44 Years | 25 | 13.3% |
| 45 to 54 Years | 41 | 21.8% |
| 55 to 64 Years | 50 | 26.6% |
| 65 to 74 Years | 18 | 9.6% |
| 75 to 84 Years | 25 | 13.3% |
| 85 Years and Over | 3 | 1.6% |
| Total | 188 | 100.0% |
Housing Finances in Raymondville
Median Income by Occupancy in Raymondville
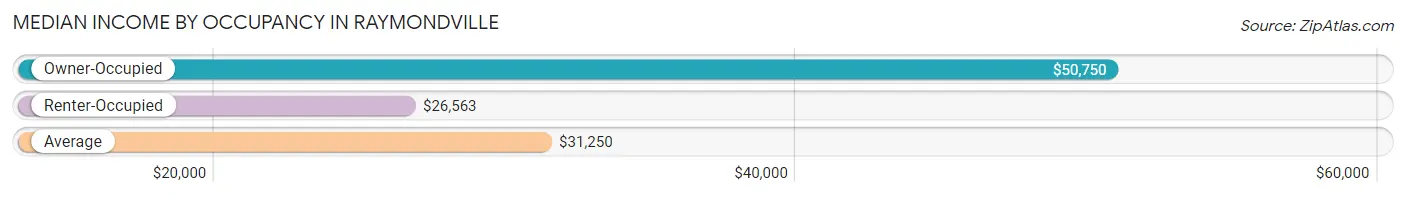
| Occupancy Type | # Households | Median Income |
| Owner-Occupied | 126 (67.0%) | $50,750 |
| Renter-Occupied | 62 (33.0%) | $26,563 |
| Average | 188 (100.0%) | $31,250 |
Occupancy by Householder Income Bracket in Raymondville
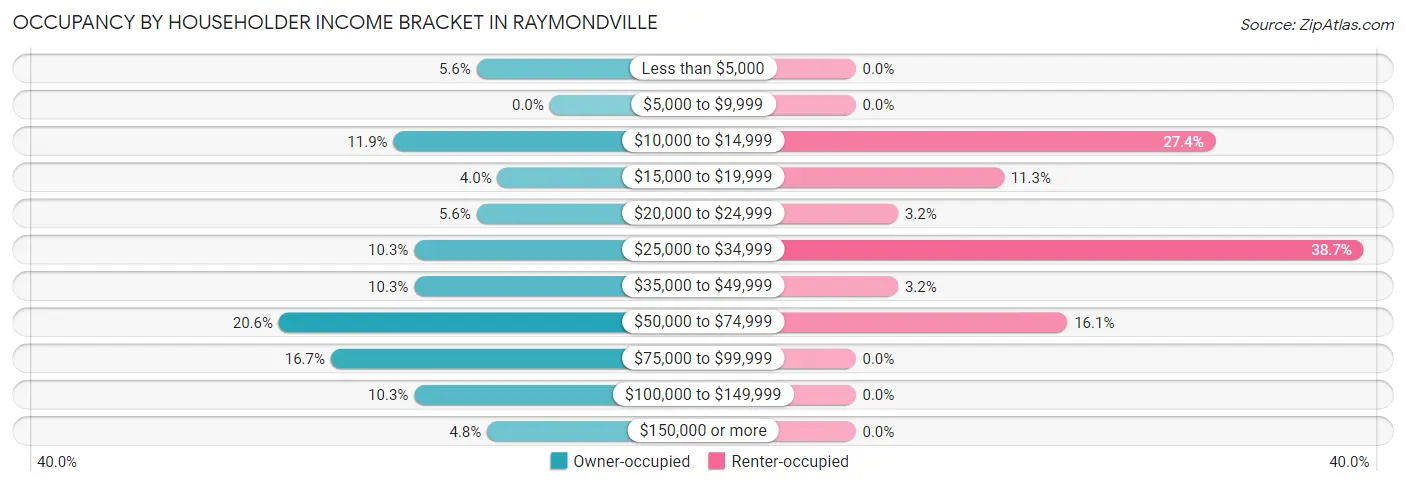
| Income Bracket | Owner-occupied | Renter-occupied |
| Less than $5,000 | 7 (5.6%) | 0 (0.0%) |
| $5,000 to $9,999 | 0 (0.0%) | 0 (0.0%) |
| $10,000 to $14,999 | 15 (11.9%) | 17 (27.4%) |
| $15,000 to $19,999 | 5 (4.0%) | 7 (11.3%) |
| $20,000 to $24,999 | 7 (5.6%) | 2 (3.2%) |
| $25,000 to $34,999 | 13 (10.3%) | 24 (38.7%) |
| $35,000 to $49,999 | 13 (10.3%) | 2 (3.2%) |
| $50,000 to $74,999 | 26 (20.6%) | 10 (16.1%) |
| $75,000 to $99,999 | 21 (16.7%) | 0 (0.0%) |
| $100,000 to $149,999 | 13 (10.3%) | 0 (0.0%) |
| $150,000 or more | 6 (4.8%) | 0 (0.0%) |
| Total | 126 (100.0%) | 62 (100.0%) |
Monthly Housing Cost Tiers in Raymondville
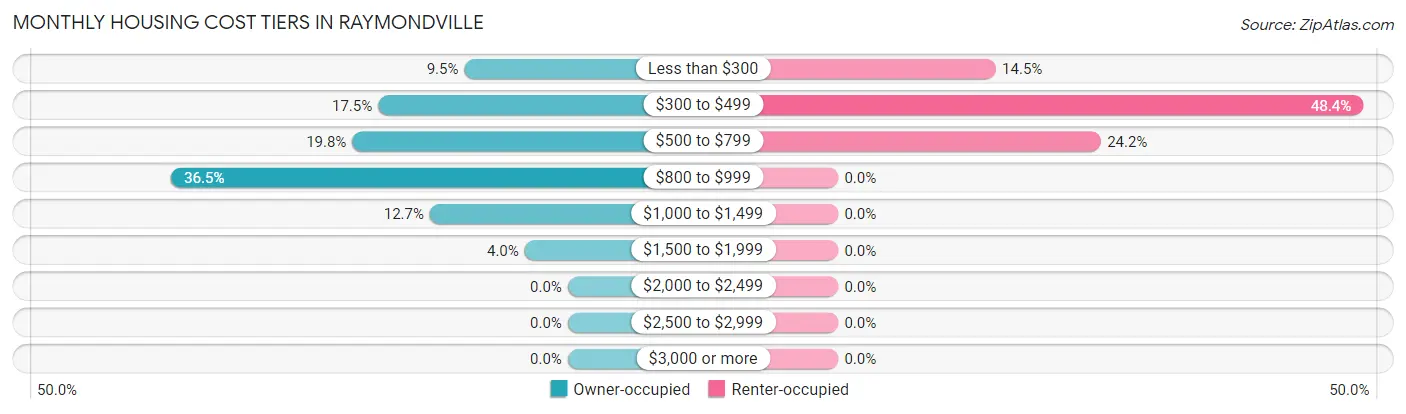
| Monthly Cost | Owner-occupied | Renter-occupied |
| Less than $300 | 12 (9.5%) | 9 (14.5%) |
| $300 to $499 | 22 (17.5%) | 30 (48.4%) |
| $500 to $799 | 25 (19.8%) | 15 (24.2%) |
| $800 to $999 | 46 (36.5%) | 0 (0.0%) |
| $1,000 to $1,499 | 16 (12.7%) | 0 (0.0%) |
| $1,500 to $1,999 | 5 (4.0%) | 0 (0.0%) |
| $2,000 to $2,499 | 0 (0.0%) | 0 (0.0%) |
| $2,500 to $2,999 | 0 (0.0%) | 0 (0.0%) |
| $3,000 or more | 0 (0.0%) | 0 (0.0%) |
| Total | 126 (100.0%) | 62 (100.0%) |
Physical Housing Characteristics in Raymondville
Housing Structures in Raymondville
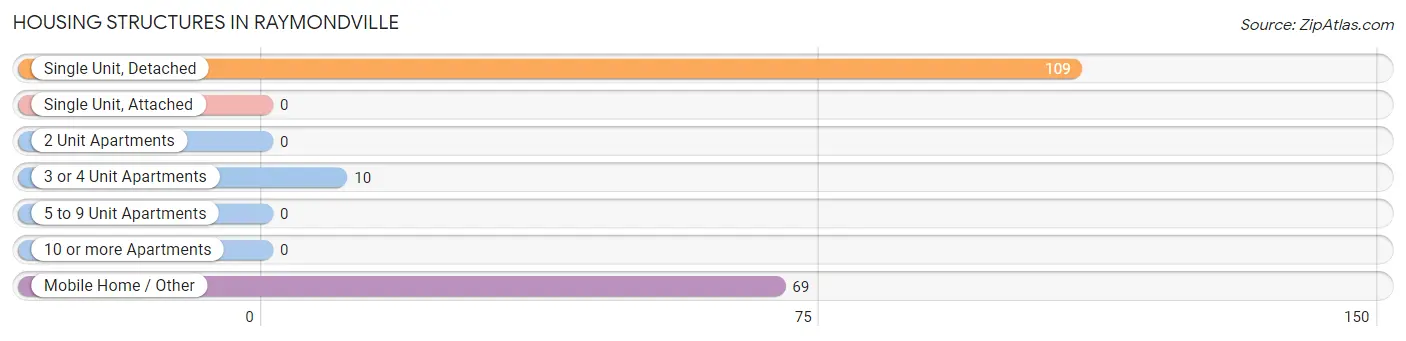
| Structure Type | # Housing Units | % Housing Units |
| Single Unit, Detached | 109 | 58.0% |
| Single Unit, Attached | 0 | 0.0% |
| 2 Unit Apartments | 0 | 0.0% |
| 3 or 4 Unit Apartments | 10 | 5.3% |
| 5 to 9 Unit Apartments | 0 | 0.0% |
| 10 or more Apartments | 0 | 0.0% |
| Mobile Home / Other | 69 | 36.7% |
| Total | 188 | 100.0% |
Housing Structures by Occupancy in Raymondville
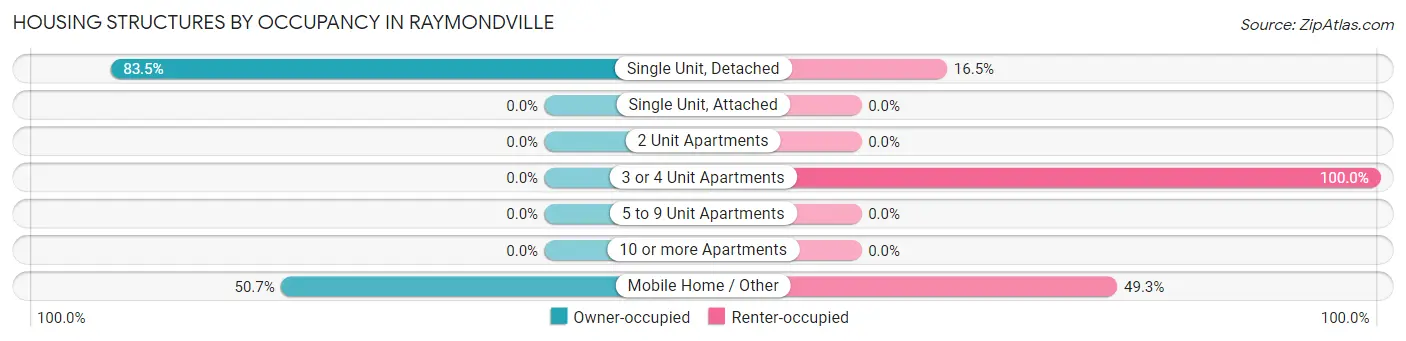
| Structure Type | Owner-occupied | Renter-occupied |
| Single Unit, Detached | 91 (83.5%) | 18 (16.5%) |
| Single Unit, Attached | 0 (0.0%) | 0 (0.0%) |
| 2 Unit Apartments | 0 (0.0%) | 0 (0.0%) |
| 3 or 4 Unit Apartments | 0 (0.0%) | 10 (100.0%) |
| 5 to 9 Unit Apartments | 0 (0.0%) | 0 (0.0%) |
| 10 or more Apartments | 0 (0.0%) | 0 (0.0%) |
| Mobile Home / Other | 35 (50.7%) | 34 (49.3%) |
| Total | 126 (67.0%) | 62 (33.0%) |
Housing Structures by Number of Rooms in Raymondville
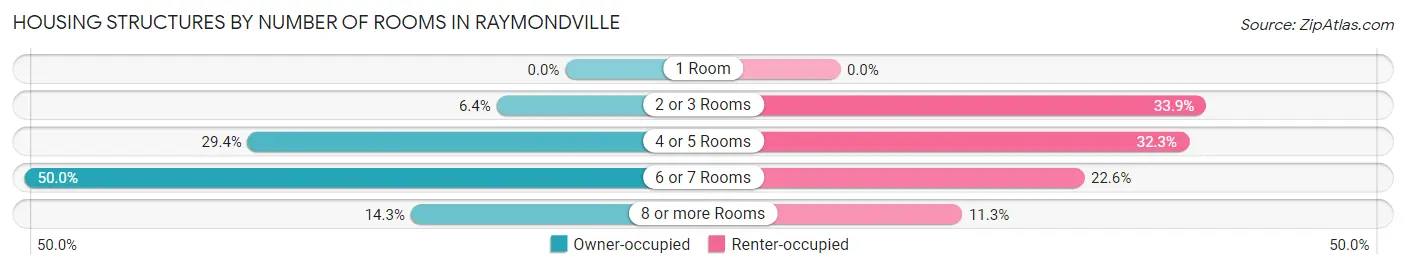
| Number of Rooms | Owner-occupied | Renter-occupied |
| 1 Room | 0 (0.0%) | 0 (0.0%) |
| 2 or 3 Rooms | 8 (6.4%) | 21 (33.9%) |
| 4 or 5 Rooms | 37 (29.4%) | 20 (32.3%) |
| 6 or 7 Rooms | 63 (50.0%) | 14 (22.6%) |
| 8 or more Rooms | 18 (14.3%) | 7 (11.3%) |
| Total | 126 (100.0%) | 62 (100.0%) |
Housing Structure by Heating Type in Raymondville
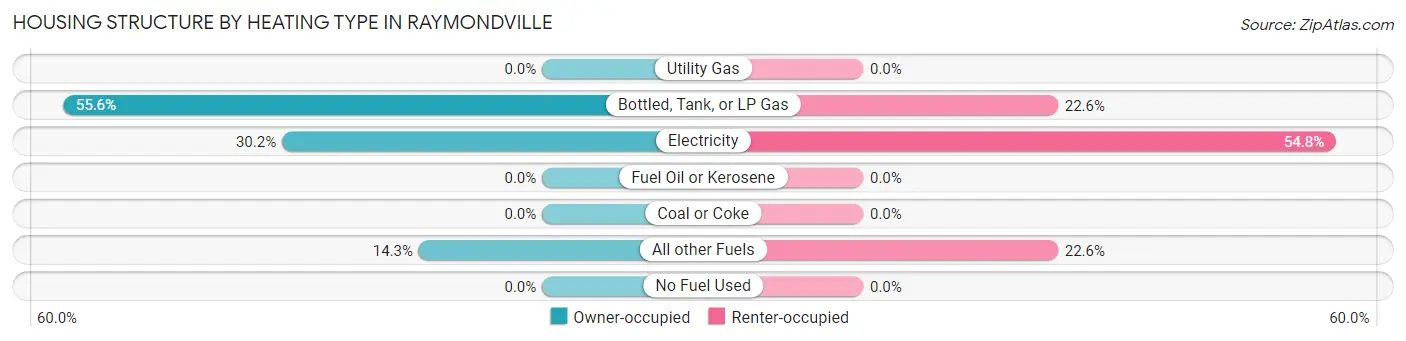
| Heating Type | Owner-occupied | Renter-occupied |
| Utility Gas | 0 (0.0%) | 0 (0.0%) |
| Bottled, Tank, or LP Gas | 70 (55.6%) | 14 (22.6%) |
| Electricity | 38 (30.2%) | 34 (54.8%) |
| Fuel Oil or Kerosene | 0 (0.0%) | 0 (0.0%) |
| Coal or Coke | 0 (0.0%) | 0 (0.0%) |
| All other Fuels | 18 (14.3%) | 14 (22.6%) |
| No Fuel Used | 0 (0.0%) | 0 (0.0%) |
| Total | 126 (100.0%) | 62 (100.0%) |
Household Vehicle Usage in Raymondville
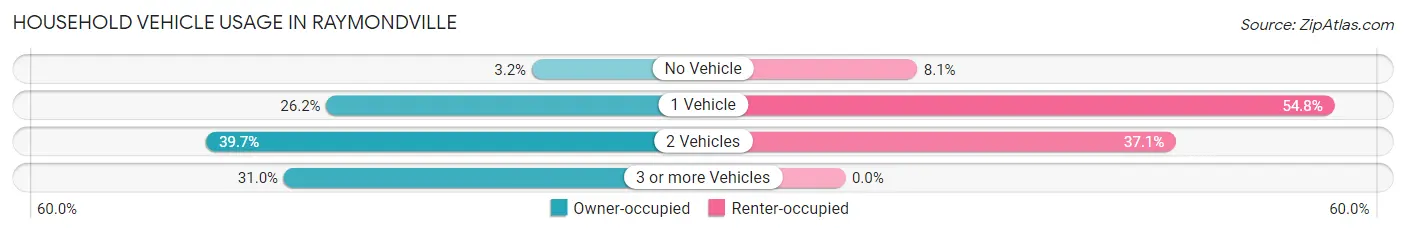
| Vehicles per Household | Owner-occupied | Renter-occupied |
| No Vehicle | 4 (3.2%) | 5 (8.1%) |
| 1 Vehicle | 33 (26.2%) | 34 (54.8%) |
| 2 Vehicles | 50 (39.7%) | 23 (37.1%) |
| 3 or more Vehicles | 39 (30.9%) | 0 (0.0%) |
| Total | 126 (100.0%) | 62 (100.0%) |
Real Estate & Mortgages in Raymondville
Real Estate and Mortgage Overview in Raymondville
| Characteristic | Without Mortgage | With Mortgage |
| Housing Units | 51 | 75 |
| Median Property Value | $68,300 | $72,100 |
| Median Household Income | $38,750 | $6 |
| Monthly Housing Costs | $455 | $0 |
| Real Estate Taxes | $425 | $9 |
Property Value by Mortgage Status in Raymondville
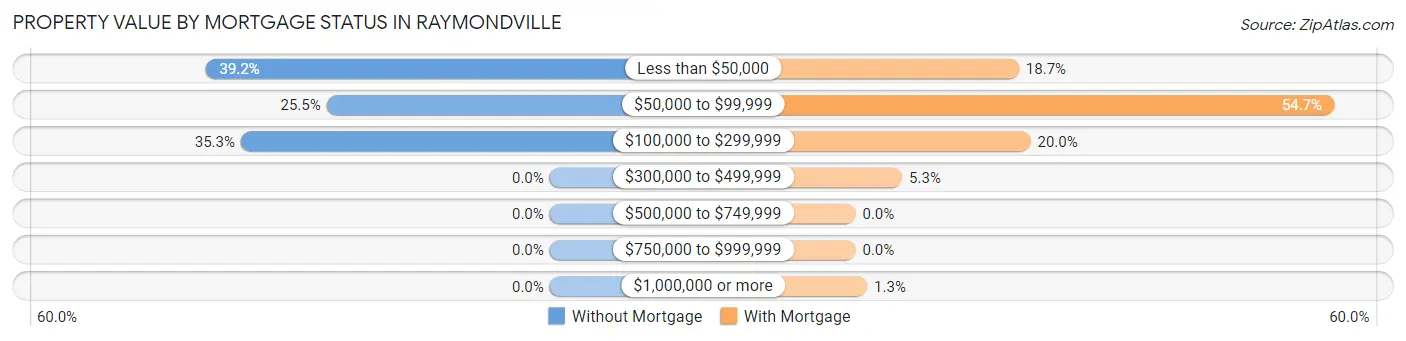
| Property Value | Without Mortgage | With Mortgage |
| Less than $50,000 | 20 (39.2%) | 14 (18.7%) |
| $50,000 to $99,999 | 13 (25.5%) | 41 (54.7%) |
| $100,000 to $299,999 | 18 (35.3%) | 15 (20.0%) |
| $300,000 to $499,999 | 0 (0.0%) | 4 (5.3%) |
| $500,000 to $749,999 | 0 (0.0%) | 0 (0.0%) |
| $750,000 to $999,999 | 0 (0.0%) | 0 (0.0%) |
| $1,000,000 or more | 0 (0.0%) | 1 (1.3%) |
| Total | 51 (100.0%) | 75 (100.0%) |
Household Income by Mortgage Status in Raymondville
| Household Income | Without Mortgage | With Mortgage |
| Less than $10,000 | 7 (13.7%) | 0 (0.0%) |
| $10,000 to $24,999 | 13 (25.5%) | 0 (0.0%) |
| $25,000 to $34,999 | 5 (9.8%) | 14 (18.7%) |
| $35,000 to $49,999 | 3 (5.9%) | 8 (10.7%) |
| $50,000 to $74,999 | 15 (29.4%) | 10 (13.3%) |
| $75,000 to $99,999 | 6 (11.8%) | 11 (14.7%) |
| $100,000 to $149,999 | 2 (3.9%) | 15 (20.0%) |
| $150,000 or more | 0 (0.0%) | 11 (14.7%) |
| Total | 51 (100.0%) | 75 (100.0%) |
Property Value to Household Income Ratio in Raymondville
| Value-to-Income Ratio | Without Mortgage | With Mortgage |
| Less than 2.0x | 25 (49.0%) | 64,250 (85,666.7%) |
| 2.0x to 2.9x | 5 (9.8%) | 54 (72.0%) |
| 3.0x to 3.9x | 3 (5.9%) | 17 (22.7%) |
| 4.0x or more | 11 (21.6%) | 2 (2.7%) |
| Total | 51 (100.0%) | 75 (100.0%) |
Real Estate Taxes by Mortgage Status in Raymondville
| Property Taxes | Without Mortgage | With Mortgage |
| Less than $800 | 42 (82.4%) | 0 (0.0%) |
| $800 to $1,499 | 6 (11.8%) | 51 (68.0%) |
| $800 to $1,499 | 0 (0.0%) | 11 (14.7%) |
| Total | 51 (100.0%) | 75 (100.0%) |
Health & Disability in Raymondville
Health Insurance Coverage by Age in Raymondville
| Age Bracket | With Coverage | Without Coverage |
| Under 6 Years | 29 (72.5%) | 11 (27.5%) |
| 6 to 18 Years | 134 (100.0%) | 0 (0.0%) |
| 19 to 25 Years | 37 (57.8%) | 27 (42.2%) |
| 26 to 34 Years | 21 (72.4%) | 8 (27.6%) |
| 35 to 44 Years | 34 (73.9%) | 12 (26.1%) |
| 45 to 54 Years | 40 (63.5%) | 23 (36.5%) |
| 55 to 64 Years | 71 (82.6%) | 15 (17.4%) |
| 65 to 74 Years | 33 (100.0%) | 0 (0.0%) |
| 75 Years and older | 33 (100.0%) | 0 (0.0%) |
| Total | 432 (81.8%) | 96 (18.2%) |
Health Insurance Coverage by Citizenship Status in Raymondville
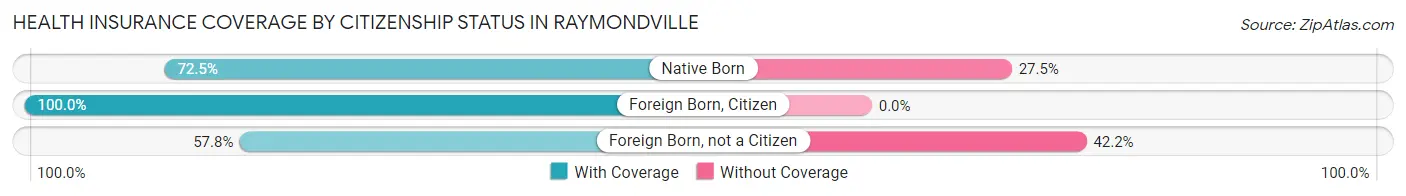
| Citizenship Status | With Coverage | Without Coverage |
| Native Born | 29 (72.5%) | 11 (27.5%) |
| Foreign Born, Citizen | 134 (100.0%) | 0 (0.0%) |
| Foreign Born, not a Citizen | 37 (57.8%) | 27 (42.2%) |
Health Insurance Coverage by Household Income in Raymondville
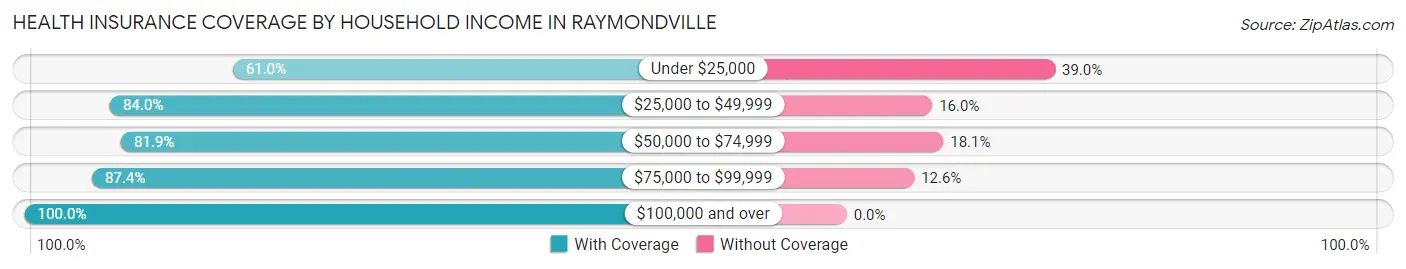
| Household Income | With Coverage | Without Coverage |
| Under $25,000 | 50 (61.0%) | 32 (39.0%) |
| $25,000 to $49,999 | 105 (84.0%) | 20 (16.0%) |
| $50,000 to $74,999 | 145 (81.9%) | 32 (18.1%) |
| $75,000 to $99,999 | 83 (87.4%) | 12 (12.6%) |
| $100,000 and over | 49 (100.0%) | 0 (0.0%) |
Public vs Private Health Insurance Coverage by Age in Raymondville
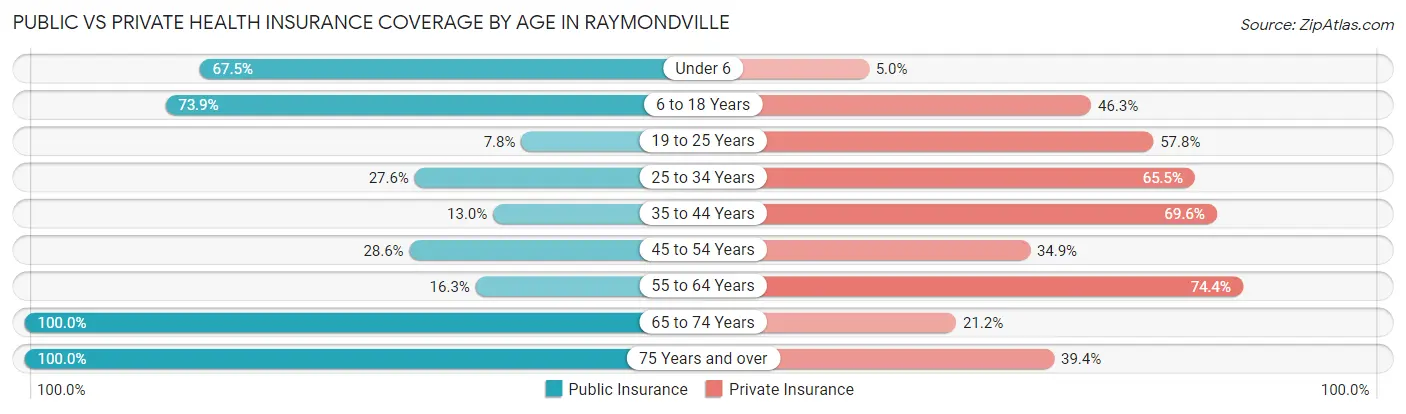
| Age Bracket | Public Insurance | Private Insurance |
| Under 6 | 27 (67.5%) | 2 (5.0%) |
| 6 to 18 Years | 99 (73.9%) | 62 (46.3%) |
| 19 to 25 Years | 5 (7.8%) | 37 (57.8%) |
| 25 to 34 Years | 8 (27.6%) | 19 (65.5%) |
| 35 to 44 Years | 6 (13.0%) | 32 (69.6%) |
| 45 to 54 Years | 18 (28.6%) | 22 (34.9%) |
| 55 to 64 Years | 14 (16.3%) | 64 (74.4%) |
| 65 to 74 Years | 33 (100.0%) | 7 (21.2%) |
| 75 Years and over | 33 (100.0%) | 13 (39.4%) |
| Total | 243 (46.0%) | 258 (48.9%) |
Disability Status by Sex by Age in Raymondville
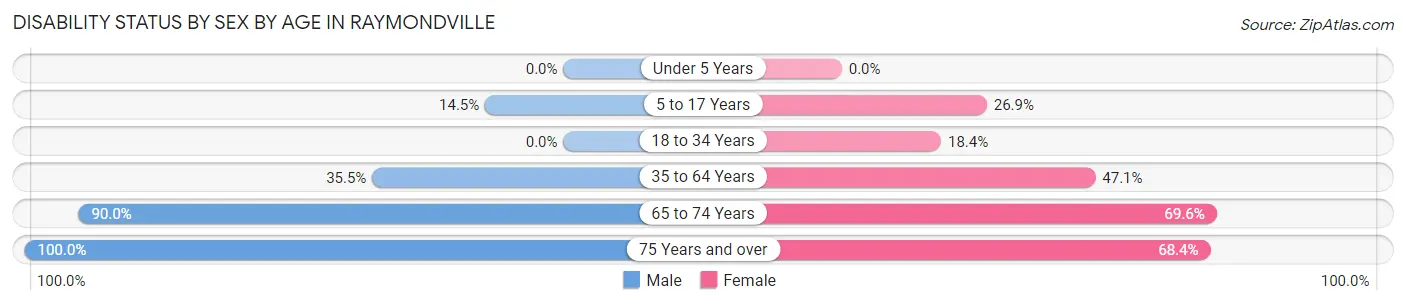
| Age Bracket | Male | Female |
| Under 5 Years | 0 (0.0%) | 0 (0.0%) |
| 5 to 17 Years | 9 (14.5%) | 21 (26.9%) |
| 18 to 34 Years | 0 (0.0%) | 7 (18.4%) |
| 35 to 64 Years | 33 (35.5%) | 48 (47.1%) |
| 65 to 74 Years | 9 (90.0%) | 16 (69.6%) |
| 75 Years and over | 14 (100.0%) | 13 (68.4%) |
Disability Class by Sex by Age in Raymondville
Disability Class: Hearing Difficulty
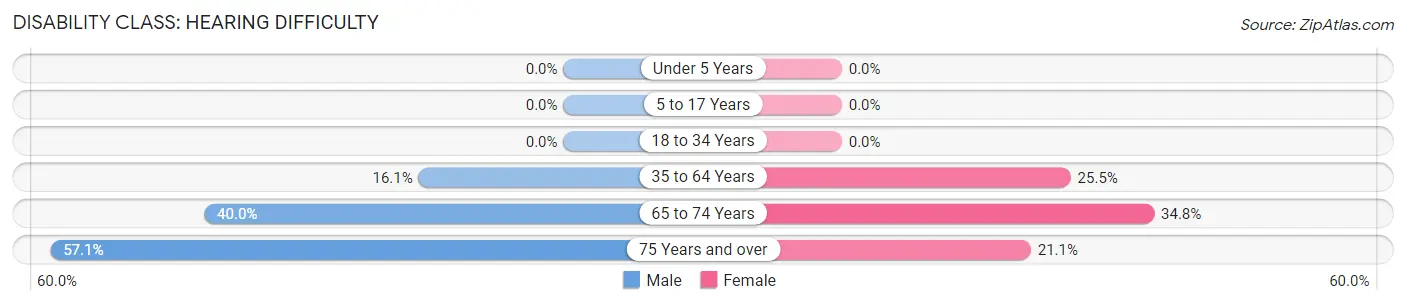
| Age Bracket | Male | Female |
| Under 5 Years | 0 (0.0%) | 0 (0.0%) |
| 5 to 17 Years | 0 (0.0%) | 0 (0.0%) |
| 18 to 34 Years | 0 (0.0%) | 0 (0.0%) |
| 35 to 64 Years | 15 (16.1%) | 26 (25.5%) |
| 65 to 74 Years | 4 (40.0%) | 8 (34.8%) |
| 75 Years and over | 8 (57.1%) | 4 (21.0%) |
Disability Class: Vision Difficulty
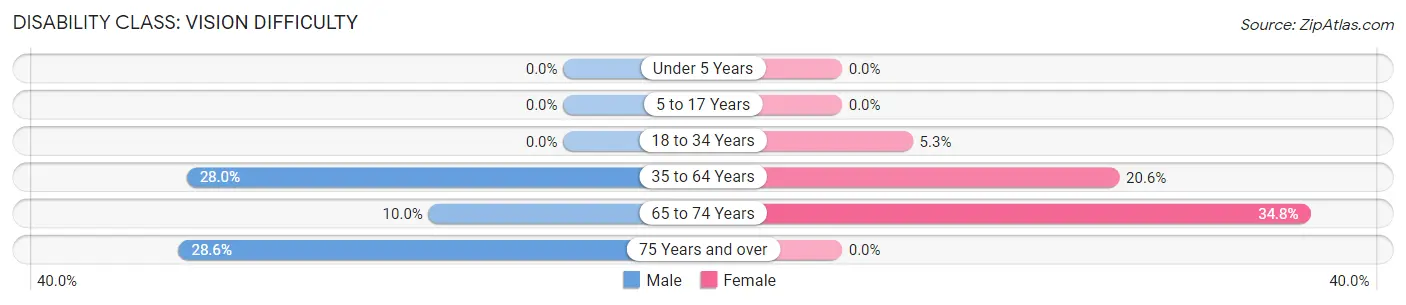
| Age Bracket | Male | Female |
| Under 5 Years | 0 (0.0%) | 0 (0.0%) |
| 5 to 17 Years | 0 (0.0%) | 0 (0.0%) |
| 18 to 34 Years | 0 (0.0%) | 2 (5.3%) |
| 35 to 64 Years | 26 (28.0%) | 21 (20.6%) |
| 65 to 74 Years | 1 (10.0%) | 8 (34.8%) |
| 75 Years and over | 4 (28.6%) | 0 (0.0%) |
Disability Class: Cognitive Difficulty
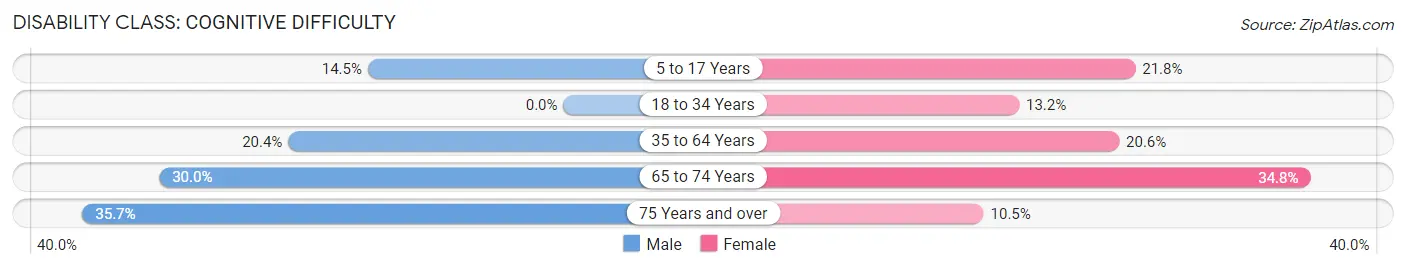
| Age Bracket | Male | Female |
| 5 to 17 Years | 9 (14.5%) | 17 (21.8%) |
| 18 to 34 Years | 0 (0.0%) | 5 (13.2%) |
| 35 to 64 Years | 19 (20.4%) | 21 (20.6%) |
| 65 to 74 Years | 3 (30.0%) | 8 (34.8%) |
| 75 Years and over | 5 (35.7%) | 2 (10.5%) |
Disability Class: Ambulatory Difficulty
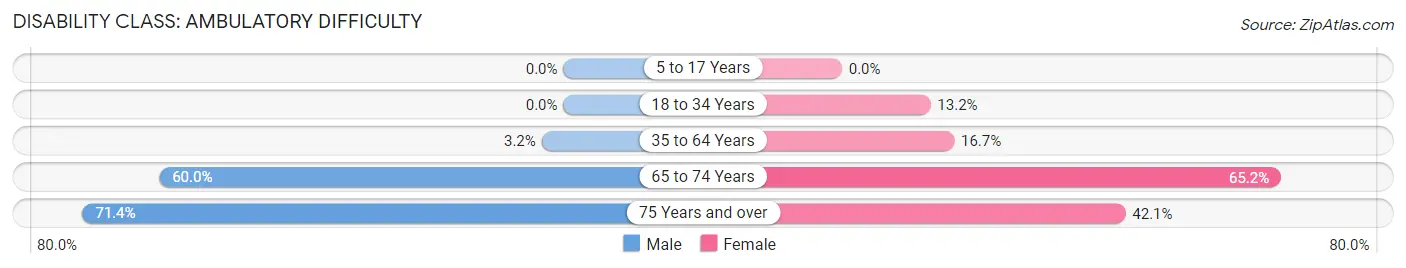
| Age Bracket | Male | Female |
| 5 to 17 Years | 0 (0.0%) | 0 (0.0%) |
| 18 to 34 Years | 0 (0.0%) | 5 (13.2%) |
| 35 to 64 Years | 3 (3.2%) | 17 (16.7%) |
| 65 to 74 Years | 6 (60.0%) | 15 (65.2%) |
| 75 Years and over | 10 (71.4%) | 8 (42.1%) |
Disability Class: Self-Care Difficulty
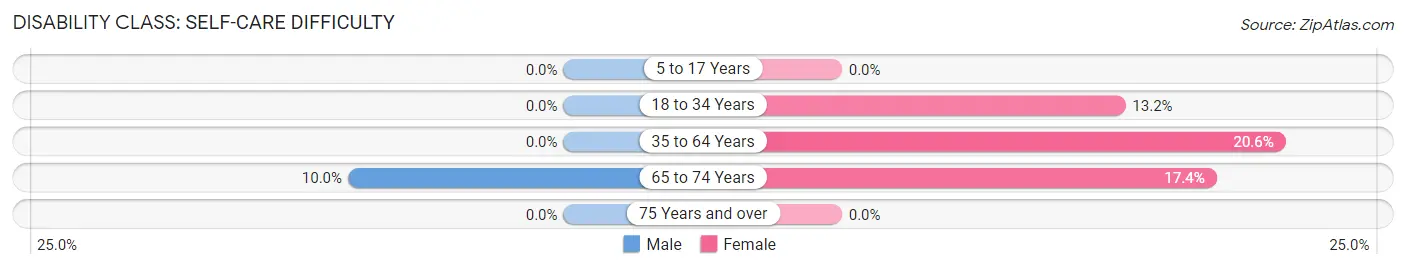
| Age Bracket | Male | Female |
| 5 to 17 Years | 0 (0.0%) | 0 (0.0%) |
| 18 to 34 Years | 0 (0.0%) | 5 (13.2%) |
| 35 to 64 Years | 0 (0.0%) | 21 (20.6%) |
| 65 to 74 Years | 1 (10.0%) | 4 (17.4%) |
| 75 Years and over | 0 (0.0%) | 0 (0.0%) |
Technology Access in Raymondville
Computing Device Access in Raymondville
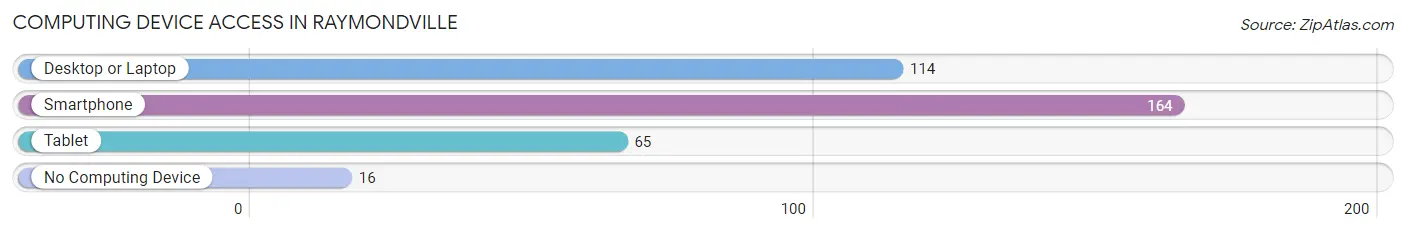
| Device Type | # Households | % Households |
| Desktop or Laptop | 114 | 60.6% |
| Smartphone | 164 | 87.2% |
| Tablet | 65 | 34.6% |
| No Computing Device | 16 | 8.5% |
| Total | 188 | 100.0% |
Internet Access in Raymondville
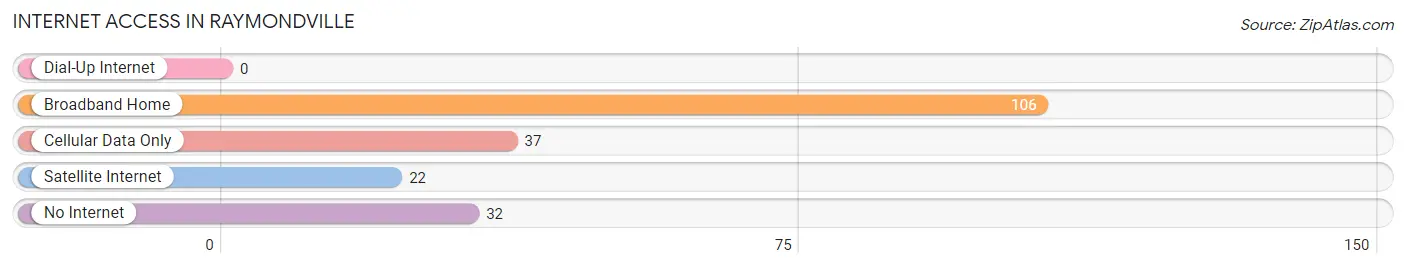
| Internet Type | # Households | % Households |
| Dial-Up Internet | 0 | 0.0% |
| Broadband Home | 106 | 56.4% |
| Cellular Data Only | 37 | 19.7% |
| Satellite Internet | 22 | 11.7% |
| No Internet | 32 | 17.0% |
| Total | 188 | 100.0% |
Raymondville Summary
Raymondville is a small town located in the southeastern corner of Missouri, in the United States. It is situated in the Ozark Mountains, and is part of the Ozark Plateau. The town is located in Texas County, and is the county seat. The population of Raymondville was estimated to be 1,072 in 2019.
History
Raymondville was founded in 1871 by William Raymond, a local farmer. The town was originally known as Raymond's Mill, and was named after the mill that Raymond had built on the banks of the Big Piney River. The town was incorporated in 1876, and the name was changed to Raymondville.
In the late 19th century, Raymondville was a thriving agricultural community. The town was home to several mills, including a grist mill, a saw mill, and a cotton gin. The town also had a blacksmith shop, a general store, and a post office.
In the early 20th century, Raymondville began to decline. The mills closed, and the population began to dwindle. The town was nearly abandoned by the 1950s.
In the late 20th century, Raymondville began to experience a resurgence. The town was revitalized by the construction of a new school, a new library, and a new post office. The town also began to attract new businesses, including a grocery store, a hardware store, and a restaurant.
Geography
Raymondville is located in the southeastern corner of Missouri, in the Ozark Mountains. The town is situated in Texas County, and is the county seat. The town is located at the intersection of Missouri State Highways 17 and 32.
The town is situated on the banks of the Big Piney River. The river is a tributary of the Gasconade River, which flows into the Mississippi River. The town is surrounded by rolling hills and forests.
Economy
The economy of Raymondville is largely based on agriculture. The town is home to several farms, which produce a variety of crops, including corn, soybeans, wheat, and hay. The town is also home to several small businesses, including a grocery store, a hardware store, and a restaurant.
Demographics
The population of Raymondville was estimated to be 1,072 in 2019. The town is predominantly white, with a small African American population. The median household income is $35,000, and the median home value is $90,000. The town has a poverty rate of 17.3%.
Conclusion
Raymondville is a small town located in the southeastern corner of Missouri, in the United States. It is situated in the Ozark Mountains, and is part of the Ozark Plateau. The town was founded in 1871 by William Raymond, and was originally known as Raymond's Mill. The town experienced a decline in the early 20th century, but has since experienced a resurgence. The economy of Raymondville is largely based on agriculture, and the town is home to several small businesses. The population of Raymondville was estimated to be 1,072 in 2019.
Common Questions
What is Per Capita Income in Raymondville?
Per Capita income in Raymondville is $22,880.
What is the Median Family Income in Raymondville?
Median Family Income in Raymondville is $55,625.
What is the Median Household income in Raymondville?
Median Household Income in Raymondville is $31,250.
What is Income or Wage Gap in Raymondville?
Income or Wage Gap in Raymondville is 30.7%.
Women in Raymondville earn 69.3 cents for every dollar earned by a man.
What is Inequality or Gini Index in Raymondville?
Inequality or Gini Index in Raymondville is 0.57.
What is the Total Population of Raymondville?
Total Population of Raymondville is 528.
What is the Total Male Population of Raymondville?
Total Male Population of Raymondville is 259.
What is the Total Female Population of Raymondville?
Total Female Population of Raymondville is 269.
What is the Ratio of Males per 100 Females in Raymondville?
There are 96.28 Males per 100 Females in Raymondville.
What is the Ratio of Females per 100 Males in Raymondville?
There are 103.86 Females per 100 Males in Raymondville.
What is the Median Population Age in Raymondville?
Median Population Age in Raymondville is 34.3 Years.
What is the Average Family Size in Raymondville
Average Family Size in Raymondville is 3.9 People.
What is the Average Household Size in Raymondville
Average Household Size in Raymondville is 2.8 People.
How Large is the Labor Force in Raymondville?
There are 212 People in the Labor Forcein in Raymondville.
What is the Percentage of People in the Labor Force in Raymondville?
58.4% of People are in the Labor Force in Raymondville.
What is the Unemployment Rate in Raymondville?
Unemployment Rate in Raymondville is 8.5%.