Plattsburg, MO Map & Demographics
Plattsburg Map
Plattsburg Overview
$32,197
PER CAPITA INCOME
$87,870
AVG FAMILY INCOME
$59,844
AVG HOUSEHOLD INCOME
55.8%
WAGE / INCOME GAP [ % ]
44.2¢/ $1
WAGE / INCOME GAP [ $ ]
0.42
INEQUALITY / GINI INDEX
2,284
TOTAL POPULATION
1,212
MALE POPULATION
1,072
FEMALE POPULATION
113.06
MALES / 100 FEMALES
88.45
FEMALES / 100 MALES
48.9
MEDIAN AGE
3.1
AVG FAMILY SIZE
2.2
AVG HOUSEHOLD SIZE
1,114
LABOR FORCE [ PEOPLE ]
58.8%
PERCENT IN LABOR FORCE
4.8%
UNEMPLOYMENT RATE
Plattsburg Zip Codes
Plattsburg Area Codes
Income in Plattsburg
Income Overview in Plattsburg
Per Capita Income in Plattsburg is $32,197, while median incomes of families and households are $87,870 and $59,844 respectively.
| Characteristic | Number | Measure |
| Per Capita Income | 2,284 | $32,197 |
| Median Family Income | 524 | $87,870 |
| Mean Family Income | 524 | $93,157 |
| Median Household Income | 994 | $59,844 |
| Mean Household Income | 994 | $69,101 |
| Income Deficit | 524 | $0 |
| Wage / Income Gap (%) | 2,284 | 55.80% |
| Wage / Income Gap ($) | 2,284 | 44.20¢ per $1 |
| Gini / Inequality Index | 2,284 | 0.42 |
Earnings by Sex in Plattsburg
Average Earnings in Plattsburg are $35,720, $50,153 for men and $22,169 for women, a difference of 55.8%.
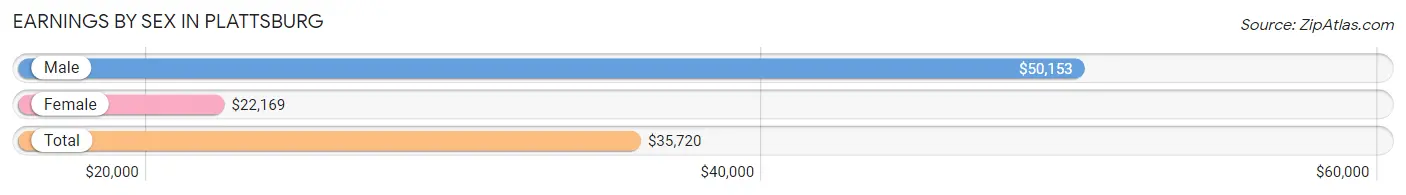
| Sex | Number | Average Earnings |
| Male | 674 (58.7%) | $50,153 |
| Female | 475 (41.3%) | $22,169 |
| Total | 1,149 (100.0%) | $35,720 |
Earnings by Sex by Income Bracket in Plattsburg
The most common earnings brackets in Plattsburg are $75,000 to $99,999 for men (113 | 16.8%) and $10,000 to $12,499 for women (61 | 12.8%).
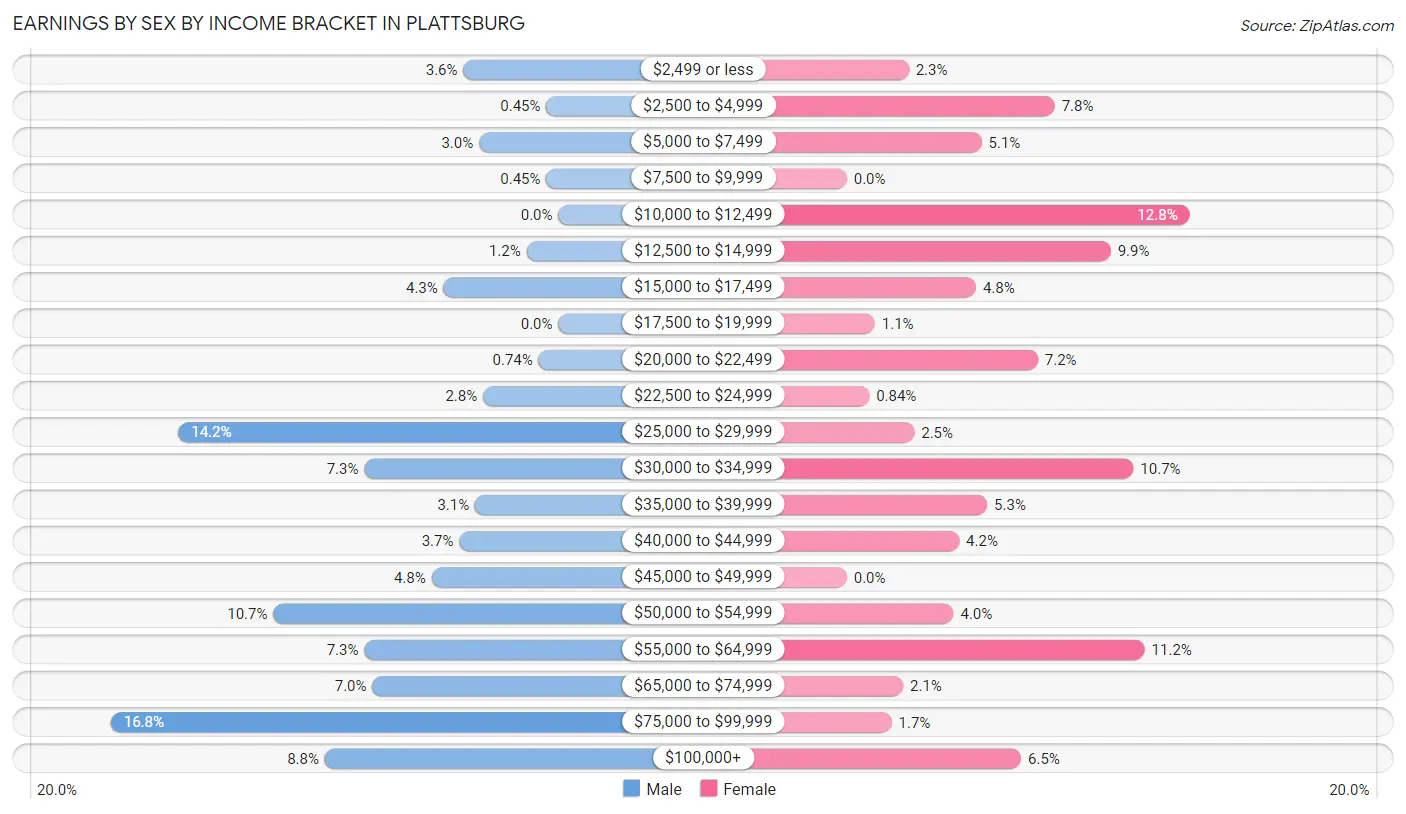
| Income | Male | Female |
| $2,499 or less | 24 (3.6%) | 11 (2.3%) |
| $2,500 to $4,999 | 3 (0.4%) | 37 (7.8%) |
| $5,000 to $7,499 | 20 (3.0%) | 24 (5.1%) |
| $7,500 to $9,999 | 3 (0.4%) | 0 (0.0%) |
| $10,000 to $12,499 | 0 (0.0%) | 61 (12.8%) |
| $12,500 to $14,999 | 8 (1.2%) | 47 (9.9%) |
| $15,000 to $17,499 | 29 (4.3%) | 23 (4.8%) |
| $17,500 to $19,999 | 0 (0.0%) | 5 (1.1%) |
| $20,000 to $22,499 | 5 (0.7%) | 34 (7.2%) |
| $22,500 to $24,999 | 19 (2.8%) | 4 (0.8%) |
| $25,000 to $29,999 | 96 (14.2%) | 12 (2.5%) |
| $30,000 to $34,999 | 49 (7.3%) | 51 (10.7%) |
| $35,000 to $39,999 | 21 (3.1%) | 25 (5.3%) |
| $40,000 to $44,999 | 25 (3.7%) | 20 (4.2%) |
| $45,000 to $49,999 | 32 (4.8%) | 0 (0.0%) |
| $50,000 to $54,999 | 72 (10.7%) | 19 (4.0%) |
| $55,000 to $64,999 | 49 (7.3%) | 53 (11.2%) |
| $65,000 to $74,999 | 47 (7.0%) | 10 (2.1%) |
| $75,000 to $99,999 | 113 (16.8%) | 8 (1.7%) |
| $100,000+ | 59 (8.7%) | 31 (6.5%) |
| Total | 674 (100.0%) | 475 (100.0%) |
Earnings by Sex by Educational Attainment in Plattsburg
Average earnings in Plattsburg are $51,410 for men and $30,784 for women, a difference of 40.1%. Men with an educational attainment of graduate degree enjoy the highest average annual earnings of $88,359, while those with less than high school education earn the least with $28,750. Women with an educational attainment of graduate degree earn the most with the average annual earnings of $58,529, while those with college or associate's degree education have the smallest earnings of $14,449.
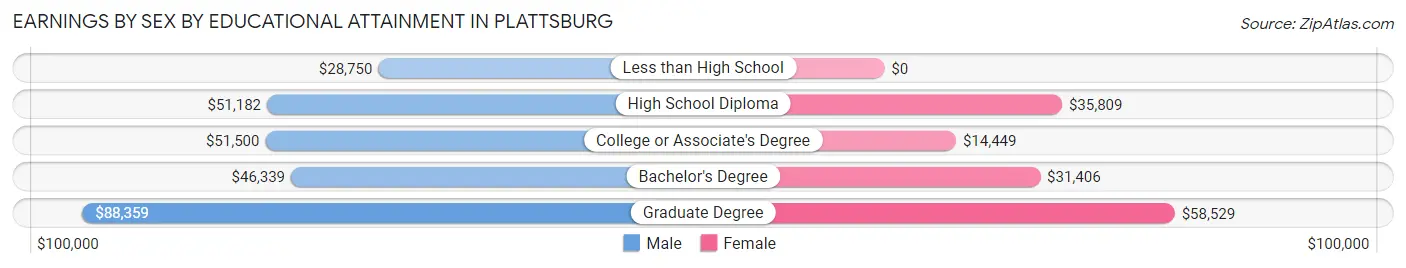
| Educational Attainment | Male Income | Female Income |
| Less than High School | $28,750 | $0 |
| High School Diploma | $51,182 | $35,809 |
| College or Associate's Degree | $51,500 | $14,449 |
| Bachelor's Degree | $46,339 | $31,406 |
| Graduate Degree | $88,359 | $58,529 |
| Total | $51,410 | $30,784 |
Family Income in Plattsburg
Family Income Brackets in Plattsburg
According to the Plattsburg family income data, there are 164 families falling into the $100,000 to $149,999 income range, which is the most common income bracket and makes up 31.3% of all families. Conversely, the $10,000 to $14,999 income bracket is the least frequent group with only 12 families (2.3%) belonging to this category.
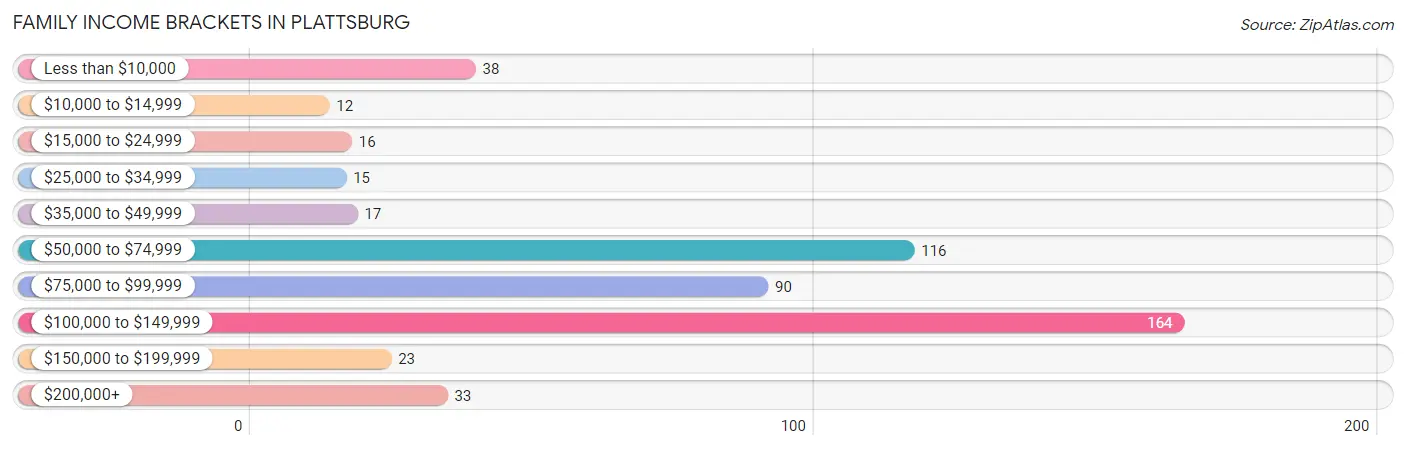
| Income Bracket | # Families | % Families |
| Less than $10,000 | 38 | 7.3% |
| $10,000 to $14,999 | 12 | 2.3% |
| $15,000 to $24,999 | 16 | 3.1% |
| $25,000 to $34,999 | 15 | 2.9% |
| $35,000 to $49,999 | 17 | 3.2% |
| $50,000 to $74,999 | 116 | 22.1% |
| $75,000 to $99,999 | 90 | 17.2% |
| $100,000 to $149,999 | 164 | 31.3% |
| $150,000 to $199,999 | 23 | 4.4% |
| $200,000+ | 33 | 6.3% |
Family Income by Famaliy Size in Plattsburg
4-person families (68 | 13.0%) account for the highest median family income in Plattsburg with $125,238 per family, while 3-person families (77 | 14.7%) have the highest median income of $38,657 per family member.
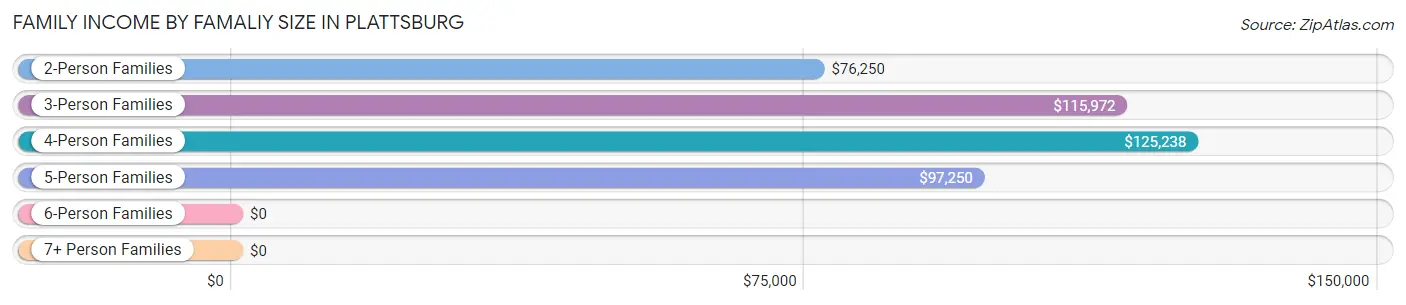
| Income Bracket | # Families | Median Income |
| 2-Person Families | 301 (57.4%) | $76,250 |
| 3-Person Families | 77 (14.7%) | $115,972 |
| 4-Person Families | 68 (13.0%) | $125,238 |
| 5-Person Families | 65 (12.4%) | $97,250 |
| 6-Person Families | 4 (0.8%) | $0 |
| 7+ Person Families | 9 (1.7%) | $0 |
| Total | 524 (100.0%) | $87,870 |
Family Income by Number of Earners in Plattsburg
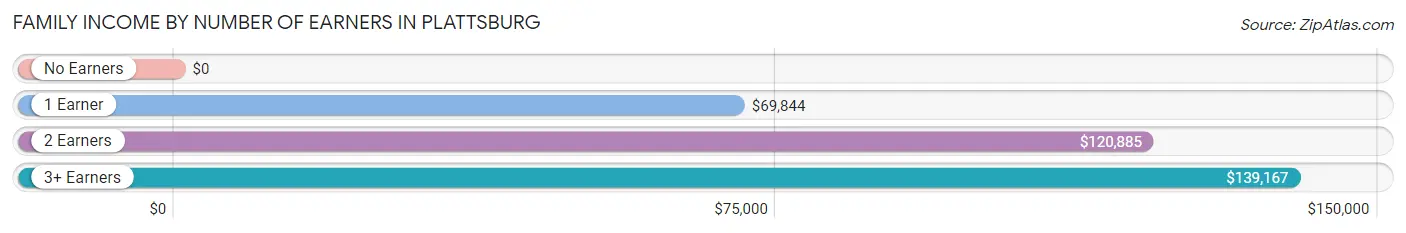
| Number of Earners | # Families | Median Income |
| No Earners | 60 (11.5%) | $0 |
| 1 Earner | 205 (39.1%) | $69,844 |
| 2 Earners | 213 (40.6%) | $120,885 |
| 3+ Earners | 46 (8.8%) | $139,167 |
| Total | 524 (100.0%) | $87,870 |
Household Income in Plattsburg
Household Income Brackets in Plattsburg
With 189 households falling in the category, the $50,000 to $74,999 income range is the most frequent in Plattsburg, accounting for 19.0% of all households. In contrast, only 23 households (2.3%) fall into the $150,000 to $199,999 income bracket, making it the least populous group.
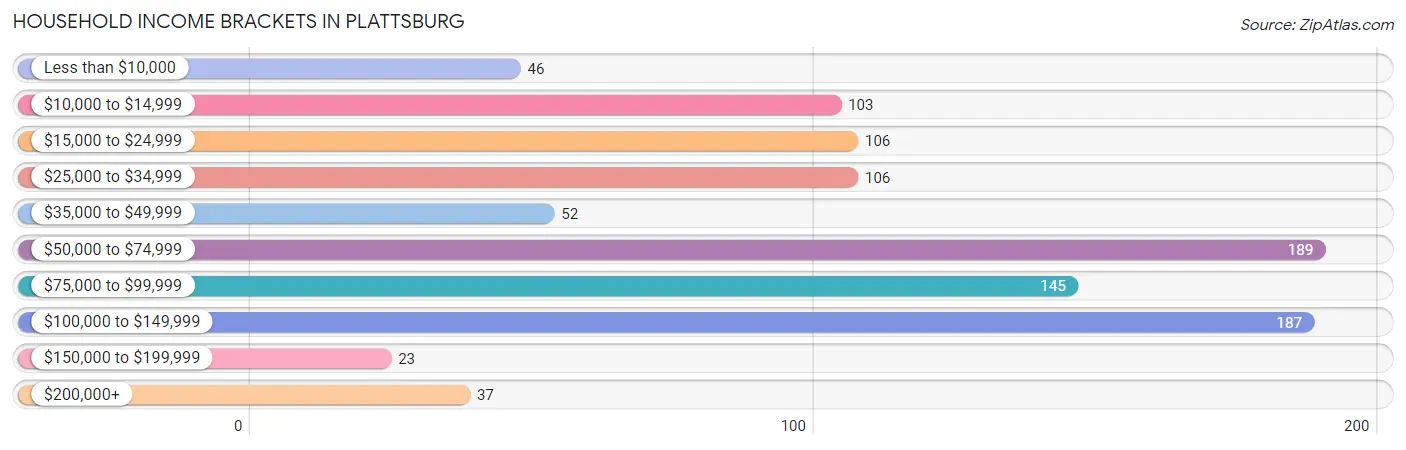
| Income Bracket | # Households | % Households |
| Less than $10,000 | 46 | 4.6% |
| $10,000 to $14,999 | 103 | 10.4% |
| $15,000 to $24,999 | 106 | 10.7% |
| $25,000 to $34,999 | 106 | 10.7% |
| $35,000 to $49,999 | 52 | 5.2% |
| $50,000 to $74,999 | 189 | 19.0% |
| $75,000 to $99,999 | 145 | 14.6% |
| $100,000 to $149,999 | 187 | 18.8% |
| $150,000 to $199,999 | 23 | 2.3% |
| $200,000+ | 37 | 3.7% |
Household Income by Householder Age in Plattsburg
The median household income in Plattsburg is $59,844, with the highest median household income of $77,500 found in the 25 to 44 years age bracket for the primary householder. A total of 160 households (16.1%) fall into this category. Meanwhile, the 45 to 64 years age bracket for the primary householder has the lowest median household income of $39,219, with 491 households (49.4%) in this group.
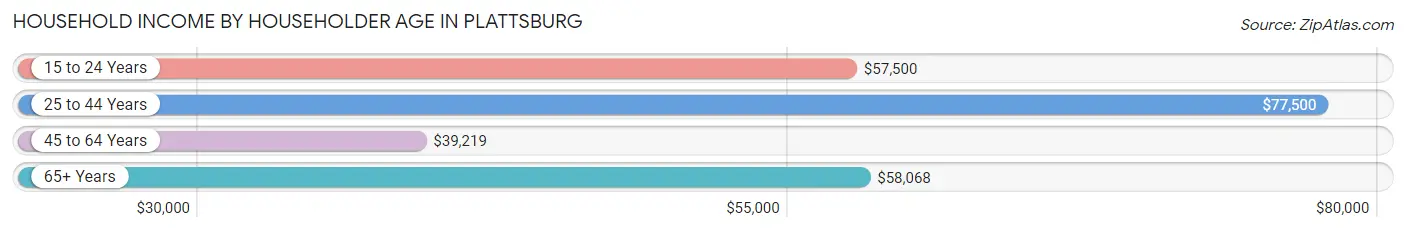
| Income Bracket | # Households | Median Income |
| 15 to 24 Years | 22 (2.2%) | $57,500 |
| 25 to 44 Years | 160 (16.1%) | $77,500 |
| 45 to 64 Years | 491 (49.4%) | $39,219 |
| 65+ Years | 321 (32.3%) | $58,068 |
| Total | 994 (100.0%) | $59,844 |
Poverty in Plattsburg
Income Below Poverty by Sex and Age in Plattsburg
With 7.3% poverty level for males and 18.9% for females among the residents of Plattsburg, 55 to 64 year old males and 18 to 24 year old females are the most vulnerable to poverty, with 36 males (15.7%) and 46 females (56.1%) in their respective age groups living below the poverty level.
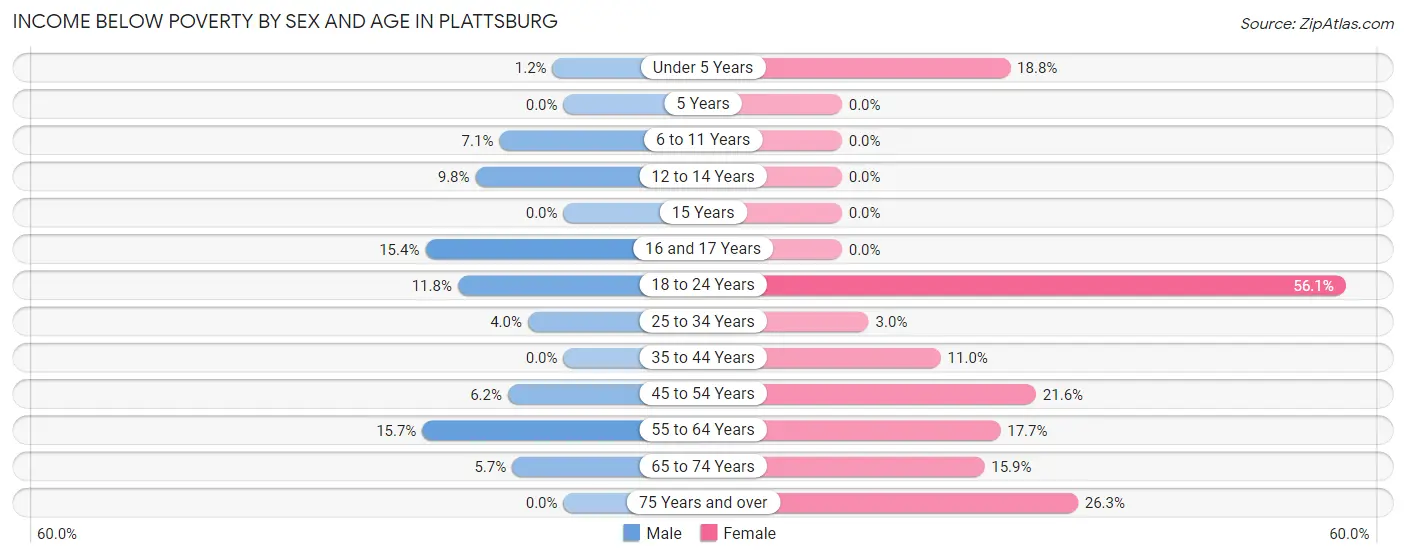
| Age Bracket | Male | Female |
| Under 5 Years | 1 (1.2%) | 9 (18.8%) |
| 5 Years | 0 (0.0%) | 0 (0.0%) |
| 6 to 11 Years | 5 (7.1%) | 0 (0.0%) |
| 12 to 14 Years | 5 (9.8%) | 0 (0.0%) |
| 15 Years | 0 (0.0%) | 0 (0.0%) |
| 16 and 17 Years | 4 (15.4%) | 0 (0.0%) |
| 18 to 24 Years | 10 (11.8%) | 46 (56.1%) |
| 25 to 34 Years | 4 (4.0%) | 2 (3.0%) |
| 35 to 44 Years | 0 (0.0%) | 12 (11.0%) |
| 45 to 54 Years | 12 (6.2%) | 40 (21.6%) |
| 55 to 64 Years | 36 (15.7%) | 30 (17.6%) |
| 65 to 74 Years | 8 (5.7%) | 20 (15.9%) |
| 75 Years and over | 0 (0.0%) | 41 (26.3%) |
| Total | 85 (7.3%) | 200 (18.9%) |
Income Above Poverty by Sex and Age in Plattsburg
According to the poverty statistics in Plattsburg, males aged 5 years and females aged 5 years are the age groups that are most secure financially, with 100.0% of males and 100.0% of females in these age groups living above the poverty line.
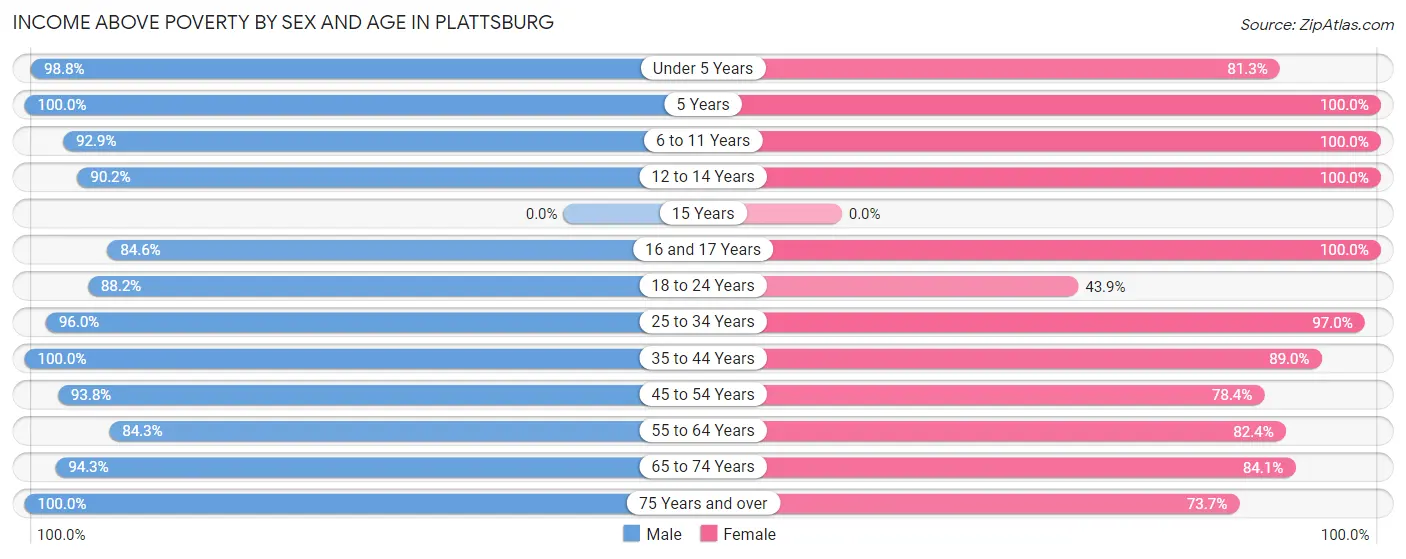
| Age Bracket | Male | Female |
| Under 5 Years | 81 (98.8%) | 39 (81.2%) |
| 5 Years | 39 (100.0%) | 11 (100.0%) |
| 6 to 11 Years | 65 (92.9%) | 75 (100.0%) |
| 12 to 14 Years | 46 (90.2%) | 13 (100.0%) |
| 15 Years | 0 (0.0%) | 0 (0.0%) |
| 16 and 17 Years | 22 (84.6%) | 19 (100.0%) |
| 18 to 24 Years | 75 (88.2%) | 36 (43.9%) |
| 25 to 34 Years | 97 (96.0%) | 65 (97.0%) |
| 35 to 44 Years | 109 (100.0%) | 97 (89.0%) |
| 45 to 54 Years | 182 (93.8%) | 145 (78.4%) |
| 55 to 64 Years | 193 (84.3%) | 140 (82.4%) |
| 65 to 74 Years | 132 (94.3%) | 106 (84.1%) |
| 75 Years and over | 44 (100.0%) | 115 (73.7%) |
| Total | 1,085 (92.7%) | 861 (81.1%) |
Income Below Poverty Among Married-Couple Families in Plattsburg
The poverty statistics for married-couple families in Plattsburg show that 5.6% or 22 of the total 390 families live below the poverty line. Families with no children have the highest poverty rate of 7.1%, comprising of 16 families. On the other hand, families with 3 or 4 children have the lowest poverty rate of 0.0%, which includes 0 families.
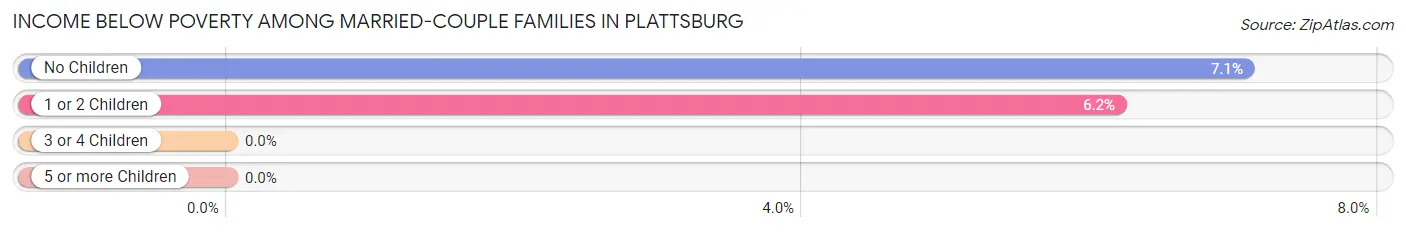
| Children | Above Poverty | Below Poverty |
| No Children | 210 (92.9%) | 16 (7.1%) |
| 1 or 2 Children | 91 (93.8%) | 6 (6.2%) |
| 3 or 4 Children | 67 (100.0%) | 0 (0.0%) |
| 5 or more Children | 0 (0.0%) | 0 (0.0%) |
| Total | 368 (94.4%) | 22 (5.6%) |
Income Below Poverty Among Single-Parent Households in Plattsburg
According to the poverty data in Plattsburg, 28.6% or 10 single-father households and 27.3% or 27 single-mother households are living below the poverty line. Among single-father households, those with no children have the highest poverty rate, with 6 households (37.5%) experiencing poverty. Likewise, among single-mother households, those with 1 or 2 children have the highest poverty rate, with 2 households (28.6%) falling below the poverty line.
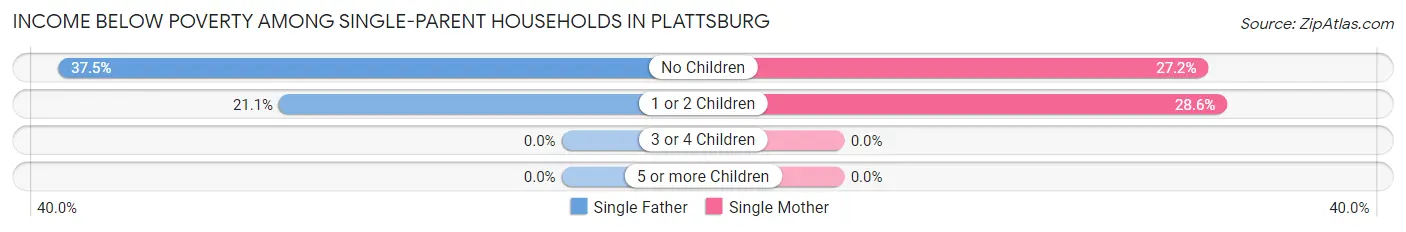
| Children | Single Father | Single Mother |
| No Children | 6 (37.5%) | 25 (27.2%) |
| 1 or 2 Children | 4 (21.0%) | 2 (28.6%) |
| 3 or 4 Children | 0 (0.0%) | 0 (0.0%) |
| 5 or more Children | 0 (0.0%) | 0 (0.0%) |
| Total | 10 (28.6%) | 27 (27.3%) |
Income Below Poverty Among Married-Couple vs Single-Parent Households in Plattsburg
The poverty data for Plattsburg shows that 22 of the married-couple family households (5.6%) and 37 of the single-parent households (27.6%) are living below the poverty level. Within the married-couple family households, those with no children have the highest poverty rate, with 16 households (7.1%) falling below the poverty line. Among the single-parent households, those with no children have the highest poverty rate, with 31 household (28.7%) living below poverty.
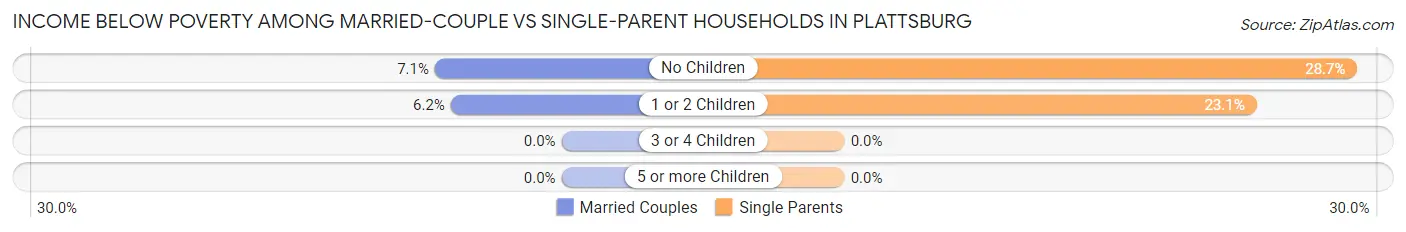
| Children | Married-Couple Families | Single-Parent Households |
| No Children | 16 (7.1%) | 31 (28.7%) |
| 1 or 2 Children | 6 (6.2%) | 6 (23.1%) |
| 3 or 4 Children | 0 (0.0%) | 0 (0.0%) |
| 5 or more Children | 0 (0.0%) | 0 (0.0%) |
| Total | 22 (5.6%) | 37 (27.6%) |
Race in Plattsburg
The most populous races in Plattsburg are White / Caucasian (1,971 | 86.3%), Two or more Races (151 | 6.6%), and Black / African American (116 | 5.1%).
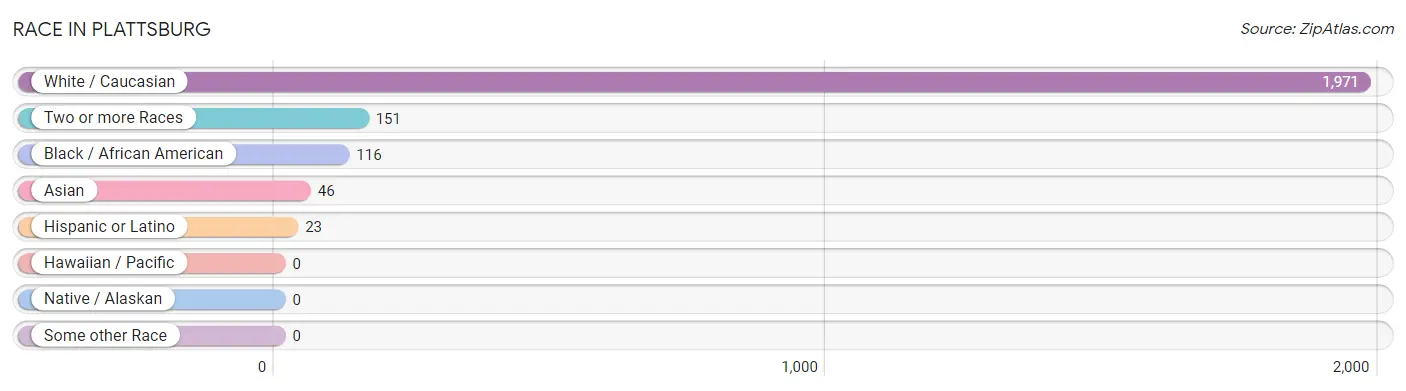
| Race | # Population | % Population |
| Asian | 46 | 2.0% |
| Black / African American | 116 | 5.1% |
| Hawaiian / Pacific | 0 | 0.0% |
| Hispanic or Latino | 23 | 1.0% |
| Native / Alaskan | 0 | 0.0% |
| White / Caucasian | 1,971 | 86.3% |
| Two or more Races | 151 | 6.6% |
| Some other Race | 0 | 0.0% |
| Total | 2,284 | 100.0% |
Ancestry in Plattsburg
The most populous ancestries reported in Plattsburg are German (490 | 21.4%), Irish (478 | 20.9%), English (339 | 14.8%), American (137 | 6.0%), and Welsh (87 | 3.8%), together accounting for 67.0% of all Plattsburg residents.
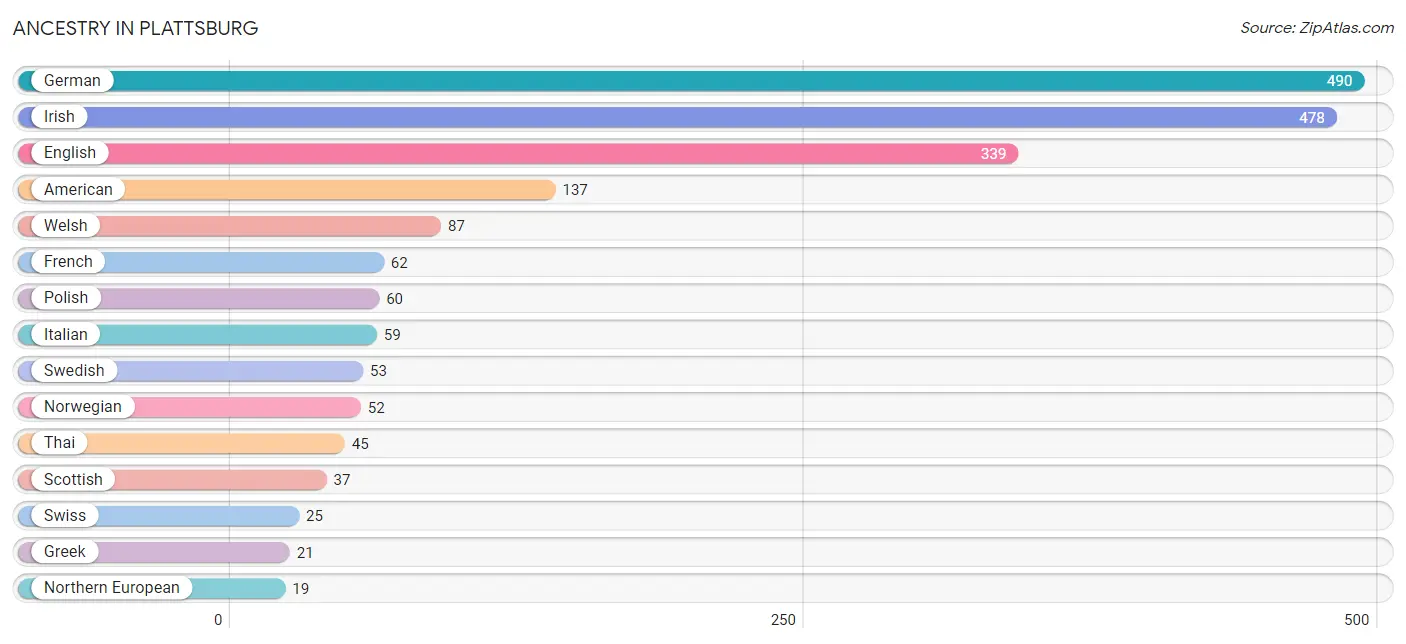
| Ancestry | # Population | % Population |
| American | 137 | 6.0% |
| Blackfeet | 6 | 0.3% |
| British | 4 | 0.2% |
| Cherokee | 8 | 0.4% |
| Cheyenne | 2 | 0.1% |
| Chickasaw | 3 | 0.1% |
| Creek | 3 | 0.1% |
| Cuban | 7 | 0.3% |
| Czech | 8 | 0.4% |
| Czechoslovakian | 7 | 0.3% |
| Danish | 17 | 0.7% |
| Dutch | 10 | 0.4% |
| English | 339 | 14.8% |
| European | 5 | 0.2% |
| French | 62 | 2.7% |
| German | 490 | 21.4% |
| Greek | 21 | 0.9% |
| Irish | 478 | 20.9% |
| Italian | 59 | 2.6% |
| Mexican | 16 | 0.7% |
| Northern European | 19 | 0.8% |
| Norwegian | 52 | 2.3% |
| Pennsylvania German | 4 | 0.2% |
| Polish | 60 | 2.6% |
| Romanian | 10 | 0.4% |
| Scotch-Irish | 11 | 0.5% |
| Scottish | 37 | 1.6% |
| Sri Lankan | 1 | 0.0% |
| Swedish | 53 | 2.3% |
| Swiss | 25 | 1.1% |
| Thai | 45 | 2.0% |
| Welsh | 87 | 3.8% | View All 32 Rows |
Immigrants in Plattsburg
The most numerous immigrant groups reported in Plattsburg came from Asia (23 | 1.0%), India (22 | 1.0%), South Central Asia (22 | 1.0%), Caribbean (7 | 0.3%), and Cuba (7 | 0.3%), together accounting for 3.5% of all Plattsburg residents.
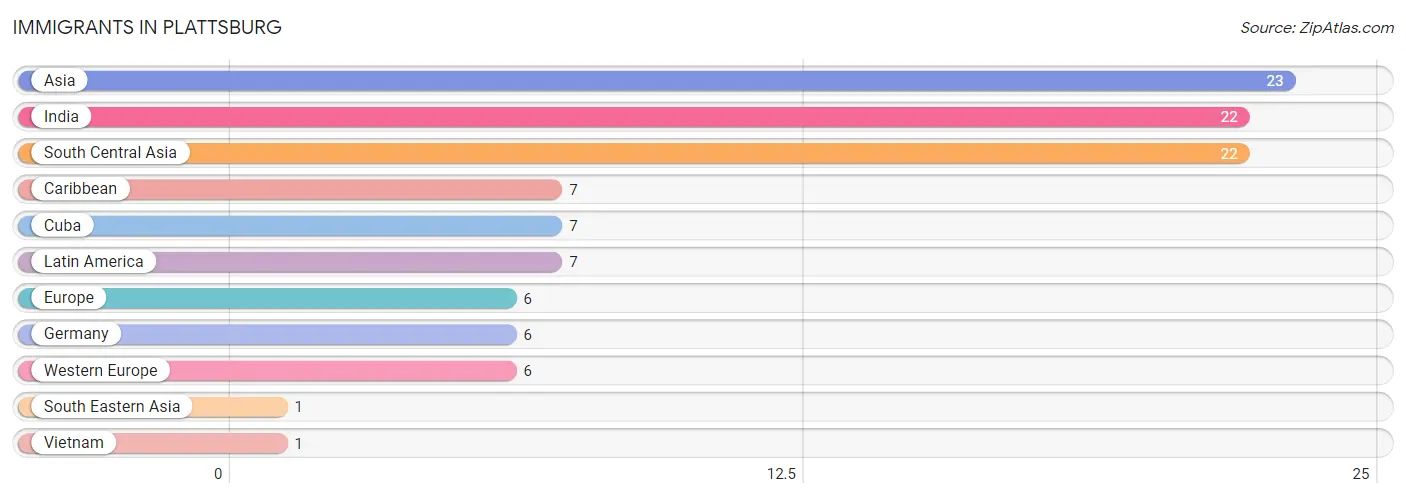
| Immigration Origin | # Population | % Population |
| Asia | 23 | 1.0% |
| Caribbean | 7 | 0.3% |
| Cuba | 7 | 0.3% |
| Europe | 6 | 0.3% |
| Germany | 6 | 0.3% |
| India | 22 | 1.0% |
| Latin America | 7 | 0.3% |
| South Central Asia | 22 | 1.0% |
| South Eastern Asia | 1 | 0.0% |
| Vietnam | 1 | 0.0% |
| Western Europe | 6 | 0.3% | View All 11 Rows |
Sex and Age in Plattsburg
Sex and Age in Plattsburg
The most populous age groups in Plattsburg are 60 to 64 Years (164 | 13.5%) for men and 55 to 59 Years (109 | 10.2%) for women.
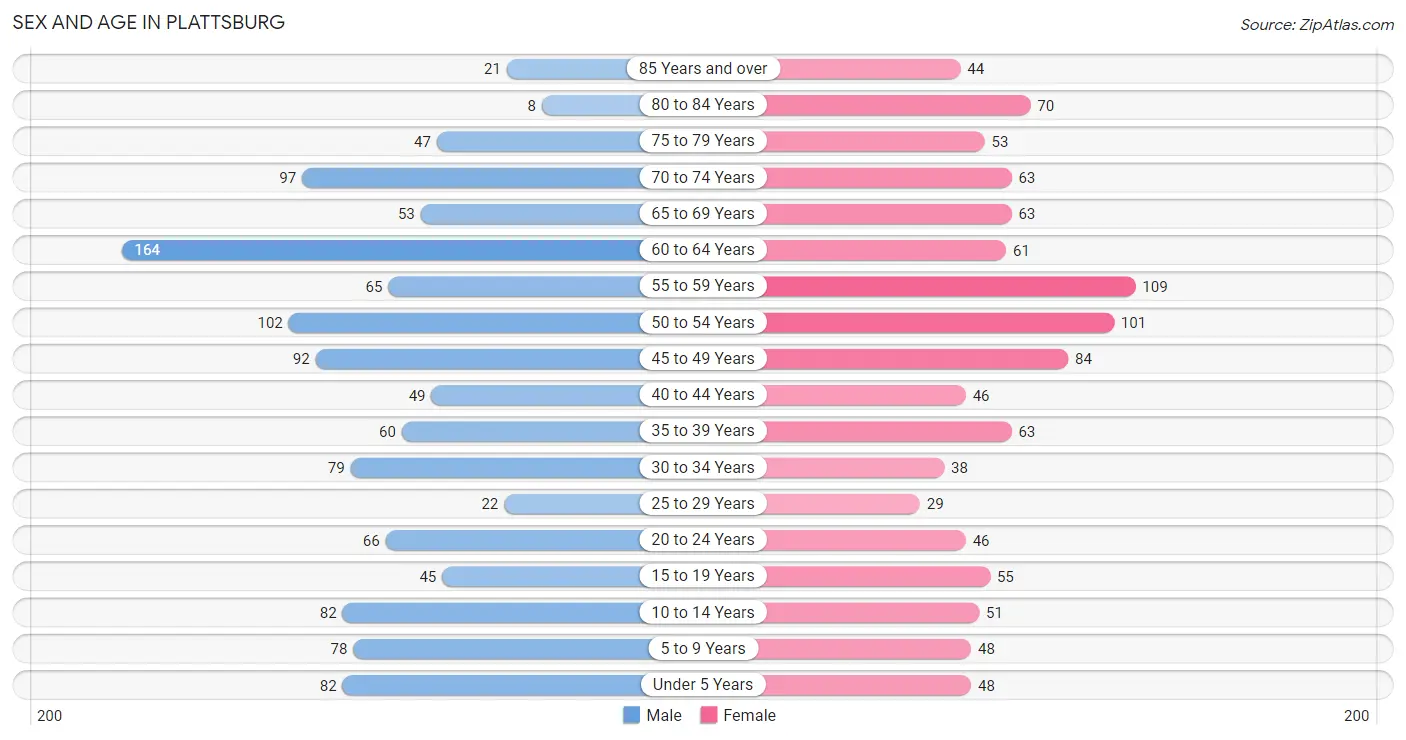
| Age Bracket | Male | Female |
| Under 5 Years | 82 (6.8%) | 48 (4.5%) |
| 5 to 9 Years | 78 (6.4%) | 48 (4.5%) |
| 10 to 14 Years | 82 (6.8%) | 51 (4.8%) |
| 15 to 19 Years | 45 (3.7%) | 55 (5.1%) |
| 20 to 24 Years | 66 (5.4%) | 46 (4.3%) |
| 25 to 29 Years | 22 (1.8%) | 29 (2.7%) |
| 30 to 34 Years | 79 (6.5%) | 38 (3.5%) |
| 35 to 39 Years | 60 (5.0%) | 63 (5.9%) |
| 40 to 44 Years | 49 (4.0%) | 46 (4.3%) |
| 45 to 49 Years | 92 (7.6%) | 84 (7.8%) |
| 50 to 54 Years | 102 (8.4%) | 101 (9.4%) |
| 55 to 59 Years | 65 (5.4%) | 109 (10.2%) |
| 60 to 64 Years | 164 (13.5%) | 61 (5.7%) |
| 65 to 69 Years | 53 (4.4%) | 63 (5.9%) |
| 70 to 74 Years | 97 (8.0%) | 63 (5.9%) |
| 75 to 79 Years | 47 (3.9%) | 53 (4.9%) |
| 80 to 84 Years | 8 (0.7%) | 70 (6.5%) |
| 85 Years and over | 21 (1.7%) | 44 (4.1%) |
| Total | 1,212 (100.0%) | 1,072 (100.0%) |
Families and Households in Plattsburg
Median Family Size in Plattsburg
The median family size in Plattsburg is 3.13 persons per family, with married-couple families (390 | 74.4%) accounting for the largest median family size of 3.33 persons per family. On the other hand, single female/mother families (99 | 18.9%) represent the smallest median family size with 2.41 persons per family.
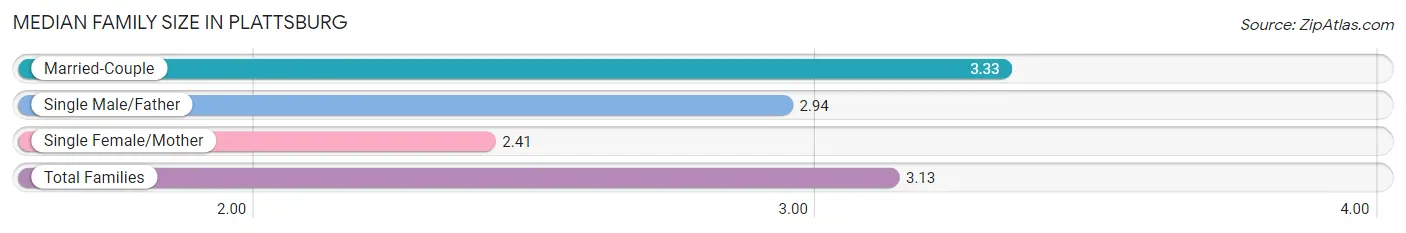
| Family Type | # Families | Family Size |
| Married-Couple | 390 (74.4%) | 3.33 |
| Single Male/Father | 35 (6.7%) | 2.94 |
| Single Female/Mother | 99 (18.9%) | 2.41 |
| Total Families | 524 (100.0%) | 3.13 |
Median Household Size in Plattsburg
The median household size in Plattsburg is 2.24 persons per household, with single male/father households (35 | 3.5%) accounting for the largest median household size of 4.54 persons per household. non-family households (470 | 47.3%) represent the smallest median household size with 1.11 persons per household.
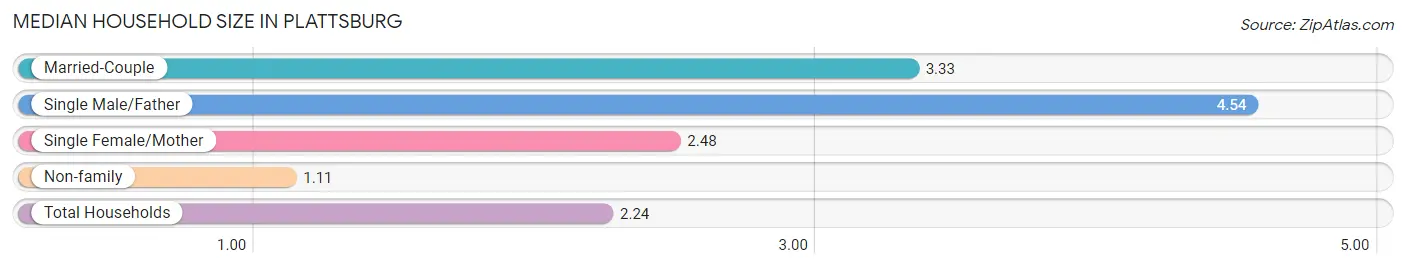
| Household Type | # Households | Household Size |
| Married-Couple | 390 (39.2%) | 3.33 |
| Single Male/Father | 35 (3.5%) | 4.54 |
| Single Female/Mother | 99 (10.0%) | 2.48 |
| Non-family | 470 (47.3%) | 1.11 |
| Total Households | 994 (100.0%) | 2.24 |
Household Size by Marriage Status in Plattsburg
Out of a total of 994 households in Plattsburg, 524 (52.7%) are family households, while 470 (47.3%) are nonfamily households. The most numerous type of family households are 2-person households, comprising 286, and the most common type of nonfamily households are 1-person households, comprising 442.
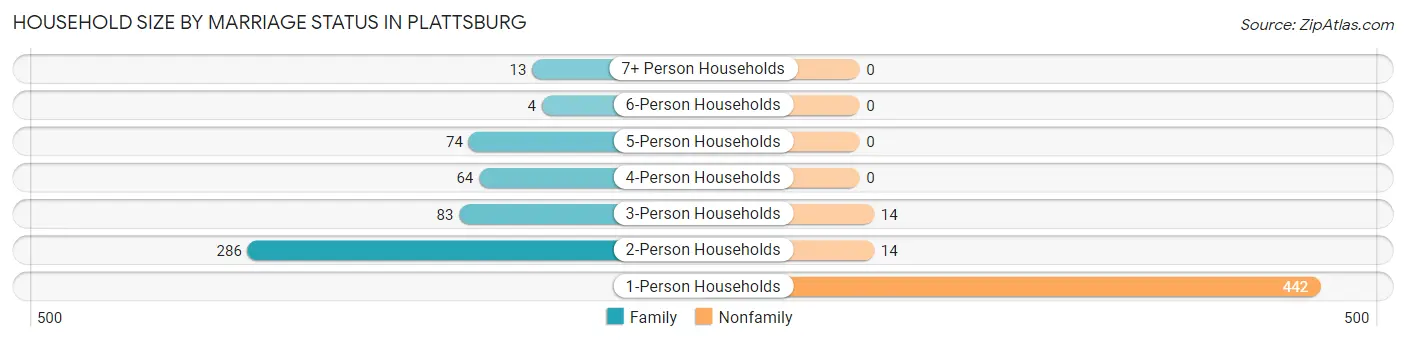
| Household Size | Family Households | Nonfamily Households |
| 1-Person Households | - | 442 (44.5%) |
| 2-Person Households | 286 (28.8%) | 14 (1.4%) |
| 3-Person Households | 83 (8.4%) | 14 (1.4%) |
| 4-Person Households | 64 (6.4%) | 0 (0.0%) |
| 5-Person Households | 74 (7.4%) | 0 (0.0%) |
| 6-Person Households | 4 (0.4%) | 0 (0.0%) |
| 7+ Person Households | 13 (1.3%) | 0 (0.0%) |
| Total | 524 (52.7%) | 470 (47.3%) |
Female Fertility in Plattsburg
Fertility by Age in Plattsburg
Average fertility rate in Plattsburg is 64.0 births per 1,000 women. Women in the age bracket of 20 to 34 years have the highest fertility rate with 168.0 births per 1,000 women. Women in the age bracket of 20 to 34 years acount for 76.0% of all women with births.
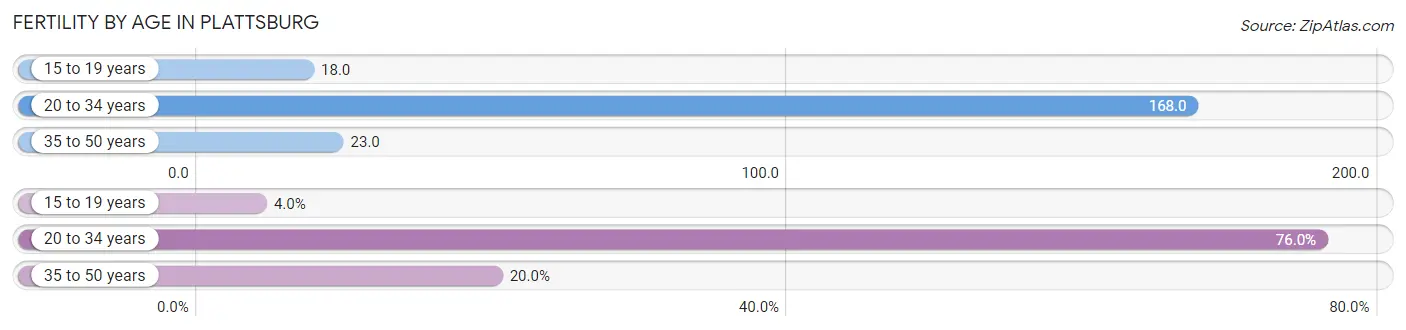
| Age Bracket | Women with Births | Births / 1,000 Women |
| 15 to 19 years | 1 (4.0%) | 18.0 |
| 20 to 34 years | 19 (76.0%) | 168.0 |
| 35 to 50 years | 5 (20.0%) | 23.0 |
| Total | 25 (100.0%) | 64.0 |
Fertility by Age by Marriage Status in Plattsburg
72.0% of women with births (25) in Plattsburg are married. The highest percentage of unmarried women with births falls into 15 to 19 years age bracket with 100.0% of them unmarried at the time of birth, while the lowest percentage of unmarried women with births belong to 35 to 50 years age bracket with 0.0% of them unmarried.
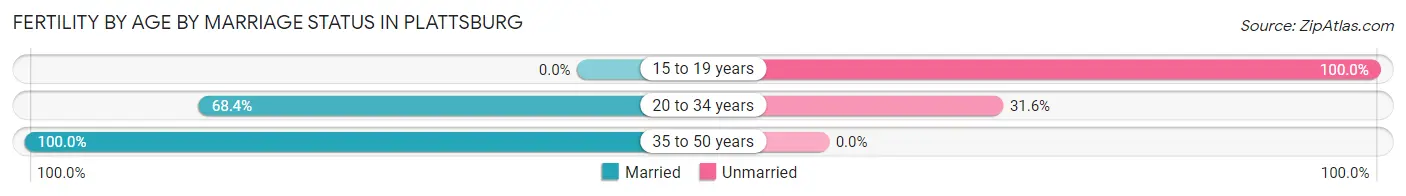
| Age Bracket | Married | Unmarried |
| 15 to 19 years | 0 (0.0%) | 1 (100.0%) |
| 20 to 34 years | 13 (68.4%) | 6 (31.6%) |
| 35 to 50 years | 5 (100.0%) | 0 (0.0%) |
| Total | 18 (72.0%) | 7 (28.0%) |
Fertility by Education in Plattsburg
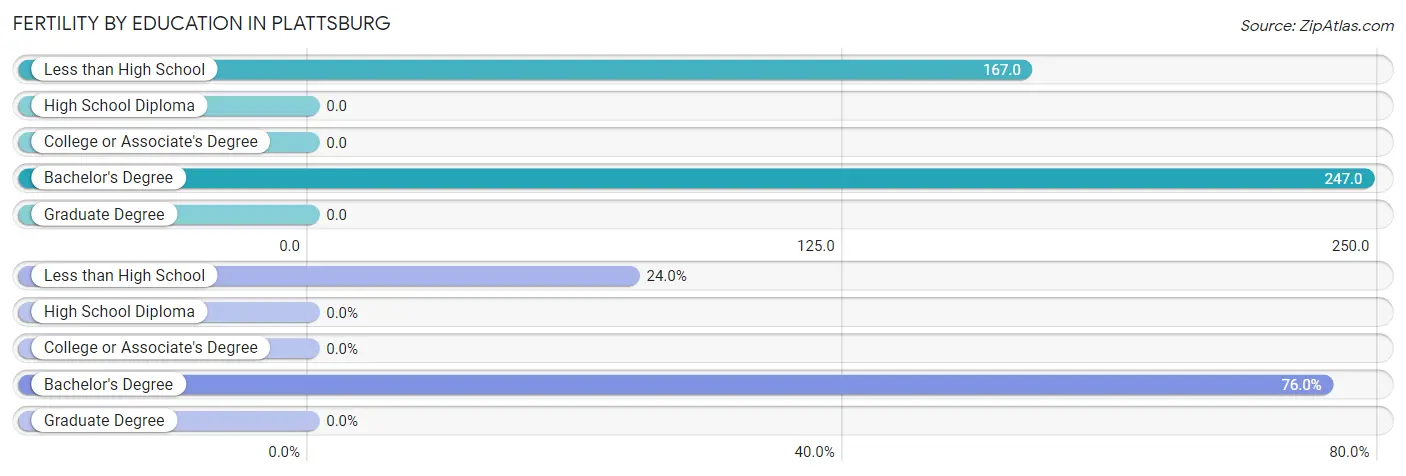
| Educational Attainment | Women with Births | Births / 1,000 Women |
| Less than High School | 6 (24.0%) | 167.0 |
| High School Diploma | 0 (0.0%) | 0.0 |
| College or Associate's Degree | 0 (0.0%) | 0.0 |
| Bachelor's Degree | 19 (76.0%) | 247.0 |
| Graduate Degree | 0 (0.0%) | 0.0 |
| Total | 25 (100.0%) | 64.0 |
Fertility by Education by Marriage Status in Plattsburg
28.0% of women with births in Plattsburg are unmarried. Women with the educational attainment of less than high school are most likely to be married with 83.3% of them married at childbirth, while women with the educational attainment of bachelor's degree are least likely to be married with 31.6% of them unmarried at childbirth.
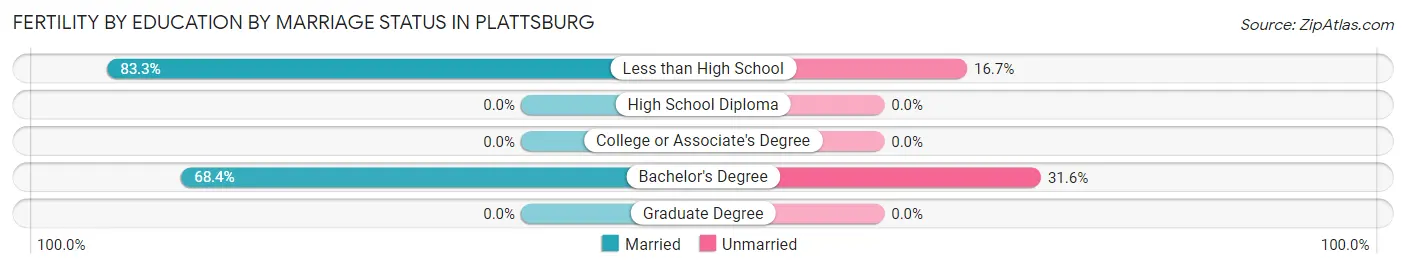
| Educational Attainment | Married | Unmarried |
| Less than High School | 5 (83.3%) | 1 (16.7%) |
| High School Diploma | 0 (0.0%) | 0 (0.0%) |
| College or Associate's Degree | 0 (0.0%) | 0 (0.0%) |
| Bachelor's Degree | 13 (68.4%) | 6 (31.6%) |
| Graduate Degree | 0 (0.0%) | 0 (0.0%) |
| Total | 18 (72.0%) | 7 (28.0%) |
Employment Characteristics in Plattsburg
Employment by Class of Employer in Plattsburg
Among the 1,040 employed individuals in Plattsburg, private company employees (809 | 77.8%), local government employees (74 | 7.1%), and self-employed (not incorporated) (47 | 4.5%) make up the most common classes of employment.
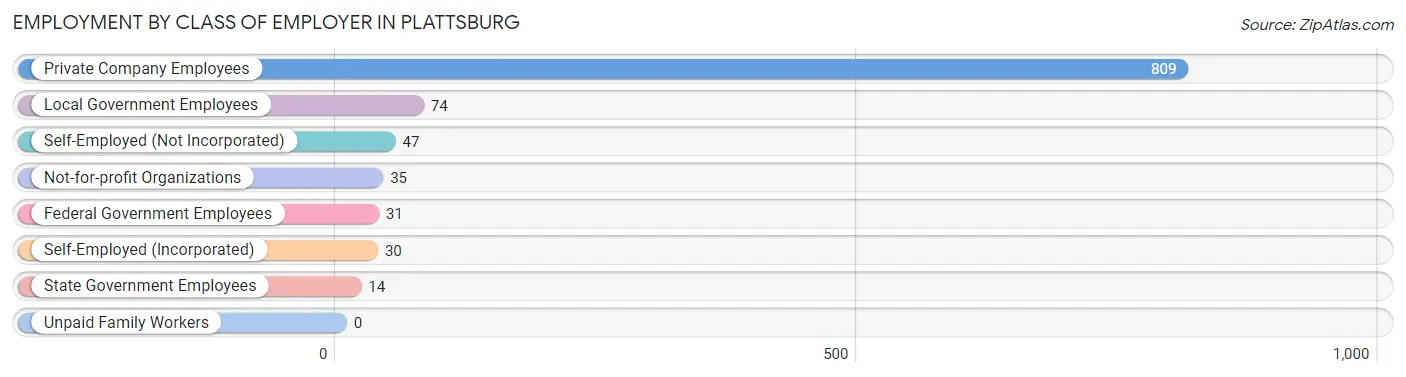
| Employer Class | # Employees | % Employees |
| Private Company Employees | 809 | 77.8% |
| Self-Employed (Incorporated) | 30 | 2.9% |
| Self-Employed (Not Incorporated) | 47 | 4.5% |
| Not-for-profit Organizations | 35 | 3.4% |
| Local Government Employees | 74 | 7.1% |
| State Government Employees | 14 | 1.3% |
| Federal Government Employees | 31 | 3.0% |
| Unpaid Family Workers | 0 | 0.0% |
| Total | 1,040 | 100.0% |
Employment Status by Age in Plattsburg
According to the labor force statistics for Plattsburg, out of the total population over 16 years of age (1,895), 58.8% or 1,114 individuals are in the labor force, with 4.8% or 53 of them unemployed. The age group with the highest labor force participation rate is 30 to 34 years, with 95.7% or 112 individuals in the labor force. Within the labor force, the 16 to 19 years age range has the highest percentage of unemployed individuals, with 22.4% or 13 of them being unemployed.
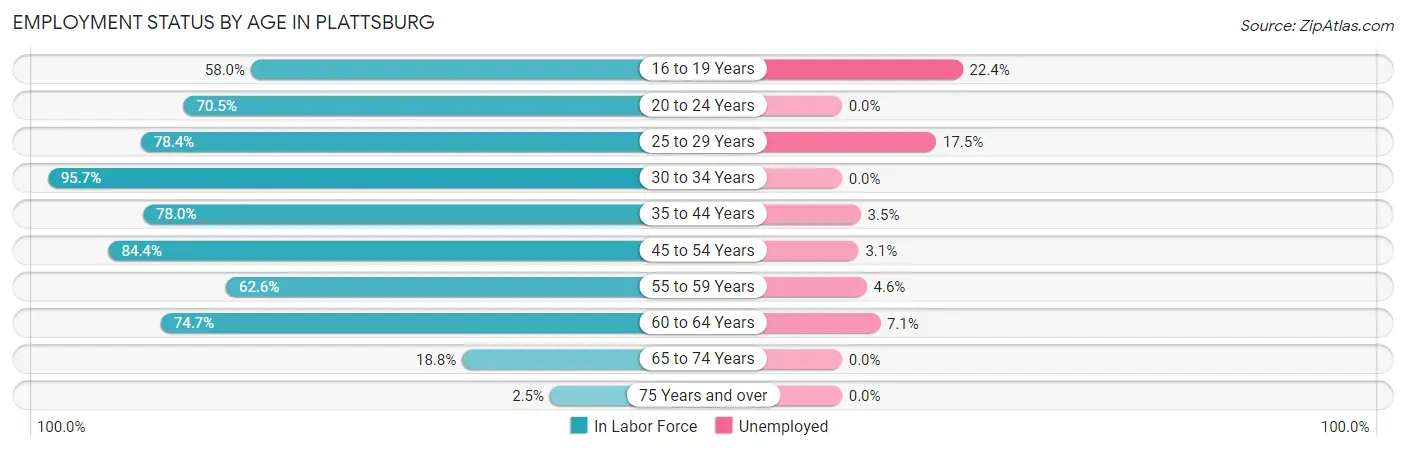
| Age Bracket | In Labor Force | Unemployed |
| 16 to 19 Years | 58 (58.0%) | 13 (22.4%) |
| 20 to 24 Years | 79 (70.5%) | 0 (0.0%) |
| 25 to 29 Years | 40 (78.4%) | 7 (17.5%) |
| 30 to 34 Years | 112 (95.7%) | 0 (0.0%) |
| 35 to 44 Years | 170 (78.0%) | 6 (3.5%) |
| 45 to 54 Years | 320 (84.4%) | 10 (3.1%) |
| 55 to 59 Years | 109 (62.6%) | 5 (4.6%) |
| 60 to 64 Years | 168 (74.7%) | 12 (7.1%) |
| 65 to 74 Years | 52 (18.8%) | 0 (0.0%) |
| 75 Years and over | 6 (2.5%) | 0 (0.0%) |
| Total | 1,114 (58.8%) | 53 (4.8%) |
Employment Status by Educational Attainment in Plattsburg
According to labor force statistics for Plattsburg, 79.0% of individuals (920) out of the total population between 25 and 64 years of age (1,164) are in the labor force, with 4.4% or 40 of them being unemployed. The group with the highest labor force participation rate are those with the educational attainment of high school diploma, with 83.4% or 341 individuals in the labor force. Within the labor force, individuals with less than high school education have the highest percentage of unemployment, with 40.0% or 6 of them being unemployed.
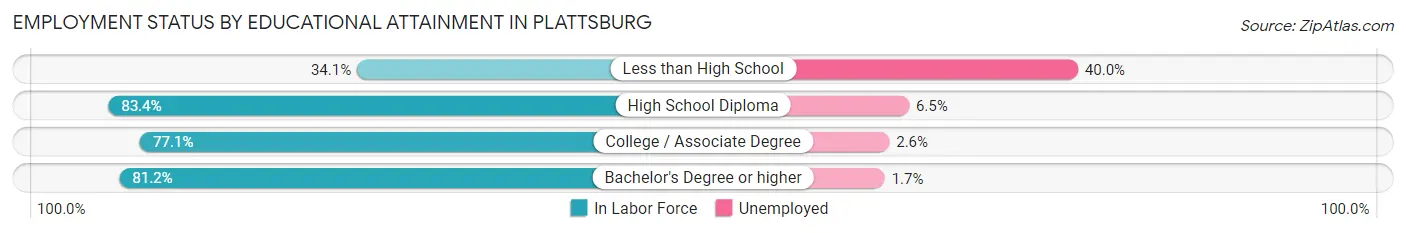
| Educational Attainment | In Labor Force | Unemployed |
| Less than High School | 15 (34.1%) | 18 (40.0%) |
| High School Diploma | 341 (83.4%) | 27 (6.5%) |
| College / Associate Degree | 269 (77.1%) | 9 (2.6%) |
| Bachelor's Degree or higher | 294 (81.2%) | 6 (1.7%) |
| Total | 920 (79.0%) | 51 (4.4%) |
Employment Occupations by Sex in Plattsburg
Management, Business, Science and Arts Occupations
The most common Management, Business, Science and Arts occupations in Plattsburg are Community & Social Service (97 | 9.1%), Management (95 | 8.9%), Education Instruction & Library (55 | 5.2%), Computers, Engineering & Science (37 | 3.5%), and Health Diagnosing & Treating (33 | 3.1%).
Management, Business, Science and Arts Occupations by Sex
Within the Management, Business, Science and Arts occupations in Plattsburg, the most male-oriented occupations are Computers, Engineering & Science (100.0%), Computers & Mathematics (100.0%), and Architecture & Engineering (100.0%), while the most female-oriented occupations are Health Diagnosing & Treating (100.0%), Health Technologists (100.0%), and Education Instruction & Library (65.4%).
| Occupation | Male | Female |
| Management | 67 (70.5%) | 28 (29.5%) |
| Business & Financial | 4 (36.4%) | 7 (63.6%) |
| Computers, Engineering & Science | 37 (100.0%) | 0 (0.0%) |
| Computers & Mathematics | 11 (100.0%) | 0 (0.0%) |
| Architecture & Engineering | 9 (100.0%) | 0 (0.0%) |
| Life, Physical & Social Science | 17 (100.0%) | 0 (0.0%) |
| Community & Social Service | 54 (55.7%) | 43 (44.3%) |
| Education, Arts & Media | 10 (58.8%) | 7 (41.2%) |
| Legal Services & Support | 6 (100.0%) | 0 (0.0%) |
| Education Instruction & Library | 19 (34.5%) | 36 (65.4%) |
| Arts, Media & Entertainment | 19 (100.0%) | 0 (0.0%) |
| Health Diagnosing & Treating | 0 (0.0%) | 33 (100.0%) |
| Health Technologists | 0 (0.0%) | 17 (100.0%) |
| Total (Category) | 162 (59.3%) | 111 (40.7%) |
| Total (Overall) | 620 (58.4%) | 441 (41.6%) |
Services Occupations
The most common Services occupations in Plattsburg are Food Preparation & Serving (81 | 7.6%), Cleaning & Maintenance (31 | 2.9%), Security & Protection (15 | 1.4%), Law Enforcement (15 | 1.4%), and Healthcare Support (3 | 0.3%).
Services Occupations by Sex
Within the Services occupations in Plattsburg, the most male-oriented occupations are Security & Protection (100.0%), Law Enforcement (100.0%), and Cleaning & Maintenance (100.0%), while the most female-oriented occupations are Healthcare Support (100.0%), and Food Preparation & Serving (79.0%).
| Occupation | Male | Female |
| Healthcare Support | 0 (0.0%) | 3 (100.0%) |
| Security & Protection | 15 (100.0%) | 0 (0.0%) |
| Firefighting & Prevention | 0 (0.0%) | 0 (0.0%) |
| Law Enforcement | 15 (100.0%) | 0 (0.0%) |
| Food Preparation & Serving | 17 (21.0%) | 64 (79.0%) |
| Cleaning & Maintenance | 31 (100.0%) | 0 (0.0%) |
| Personal Care & Service | 0 (0.0%) | 0 (0.0%) |
| Total (Category) | 63 (48.5%) | 67 (51.5%) |
| Total (Overall) | 620 (58.4%) | 441 (41.6%) |
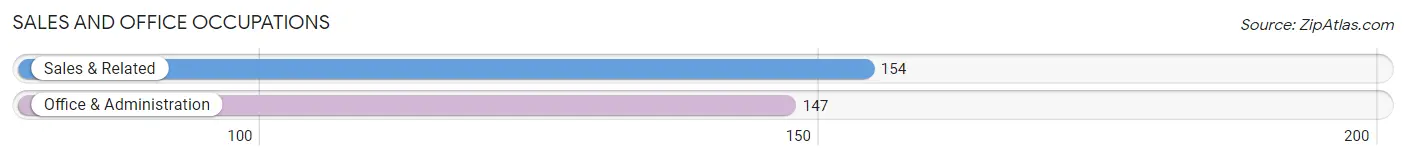
Sales and Office Occupations
The most common Sales and Office occupations in Plattsburg are Sales & Related (154 | 14.5%), and Office & Administration (147 | 13.9%).
Sales and Office Occupations by Sex
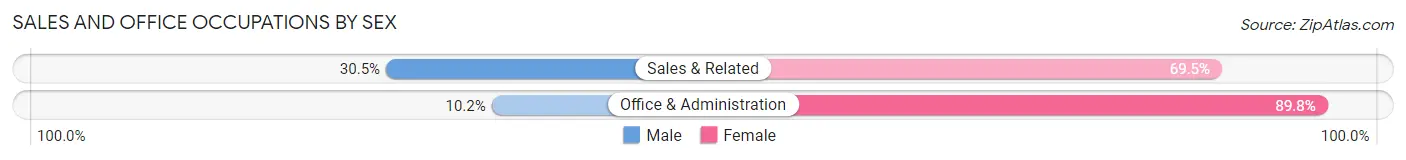
| Occupation | Male | Female |
| Sales & Related | 47 (30.5%) | 107 (69.5%) |
| Office & Administration | 15 (10.2%) | 132 (89.8%) |
| Total (Category) | 62 (20.6%) | 239 (79.4%) |
| Total (Overall) | 620 (58.4%) | 441 (41.6%) |
Natural Resources, Construction and Maintenance Occupations
The most common Natural Resources, Construction and Maintenance occupations in Plattsburg are Construction & Extraction (82 | 7.7%), Farming, Fishing & Forestry (62 | 5.8%), and Installation, Maintenance & Repair (46 | 4.3%).
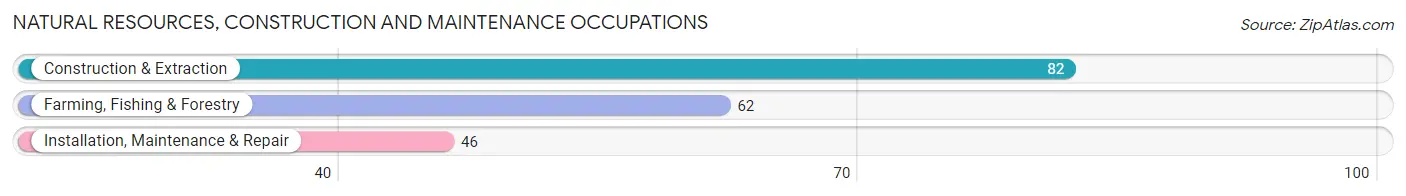
Natural Resources, Construction and Maintenance Occupations by Sex
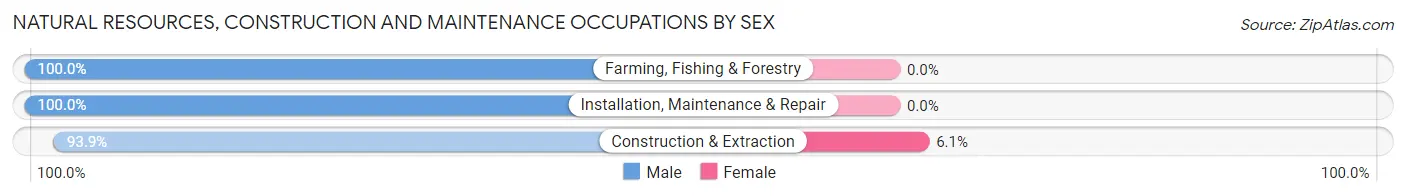
| Occupation | Male | Female |
| Farming, Fishing & Forestry | 62 (100.0%) | 0 (0.0%) |
| Construction & Extraction | 77 (93.9%) | 5 (6.1%) |
| Installation, Maintenance & Repair | 46 (100.0%) | 0 (0.0%) |
| Total (Category) | 185 (97.4%) | 5 (2.6%) |
| Total (Overall) | 620 (58.4%) | 441 (41.6%) |
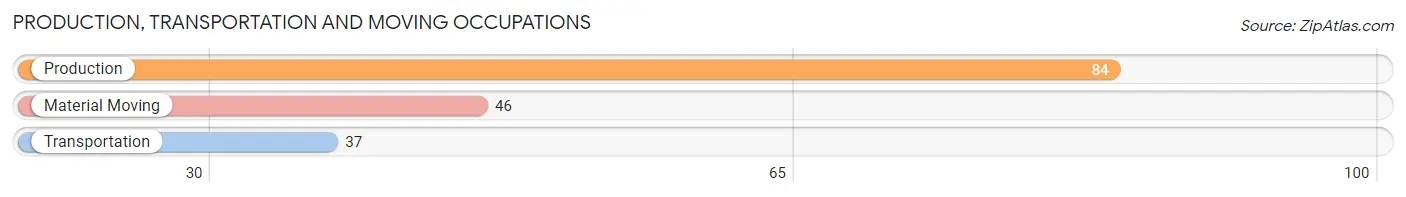
Production, Transportation and Moving Occupations
The most common Production, Transportation and Moving occupations in Plattsburg are Production (84 | 7.9%), Material Moving (46 | 4.3%), and Transportation (37 | 3.5%).
Production, Transportation and Moving Occupations by Sex
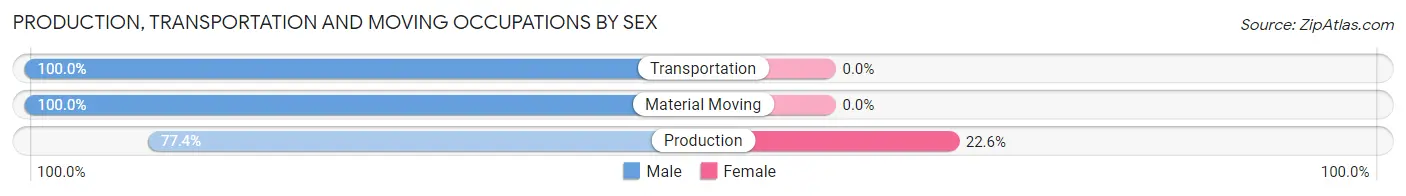
| Occupation | Male | Female |
| Production | 65 (77.4%) | 19 (22.6%) |
| Transportation | 37 (100.0%) | 0 (0.0%) |
| Material Moving | 46 (100.0%) | 0 (0.0%) |
| Total (Category) | 148 (88.6%) | 19 (11.4%) |
| Total (Overall) | 620 (58.4%) | 441 (41.6%) |
Employment Industries by Sex in Plattsburg
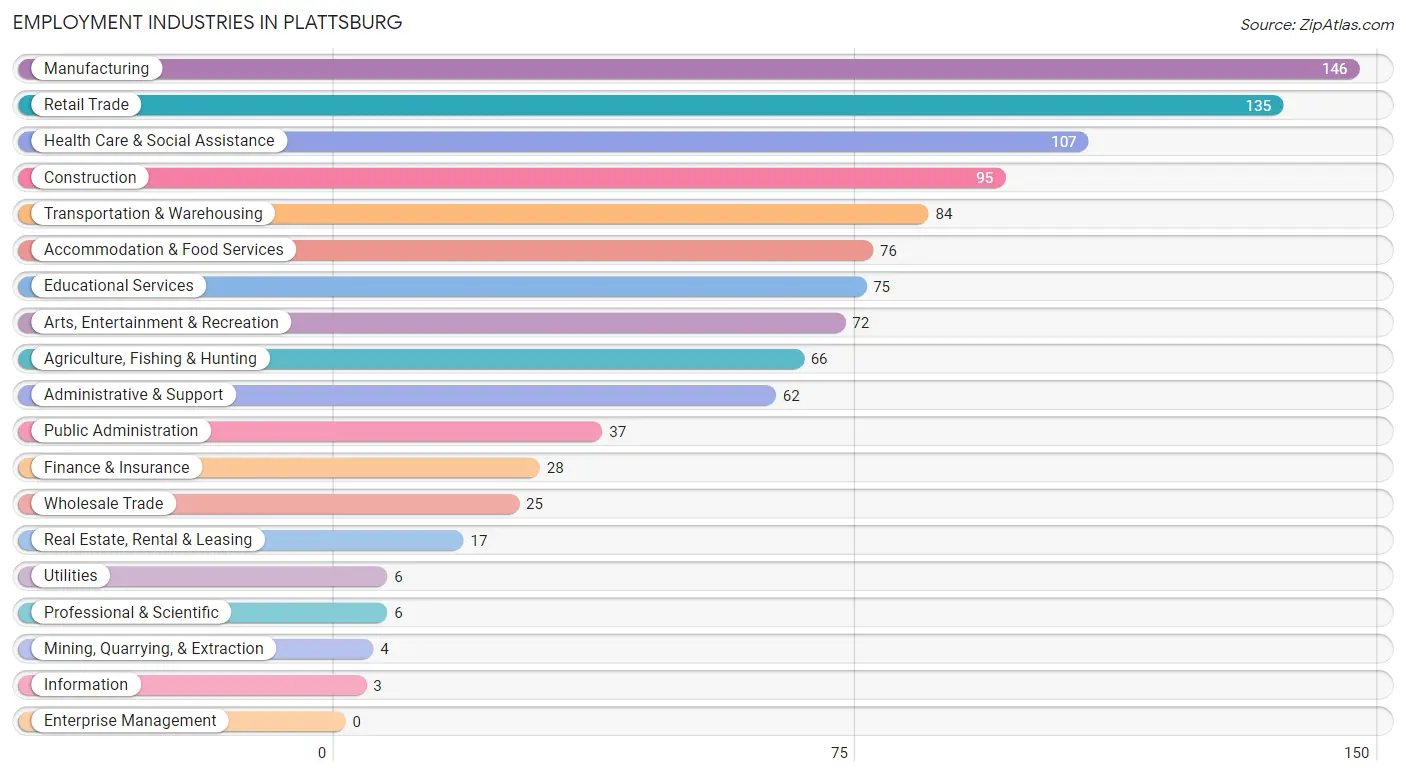
Employment Industries in Plattsburg
The major employment industries in Plattsburg include Manufacturing (146 | 13.8%), Retail Trade (135 | 12.7%), Health Care & Social Assistance (107 | 10.1%), Construction (95 | 8.9%), and Transportation & Warehousing (84 | 7.9%).
Employment Industries by Sex in Plattsburg
The Plattsburg industries that see more men than women are Agriculture, Fishing & Hunting (100.0%), Mining, Quarrying, & Extraction (100.0%), and Wholesale Trade (100.0%), whereas the industries that tend to have a higher number of women are Professional & Scientific (100.0%), Accommodation & Food Services (96.1%), and Real Estate, Rental & Leasing (82.4%).
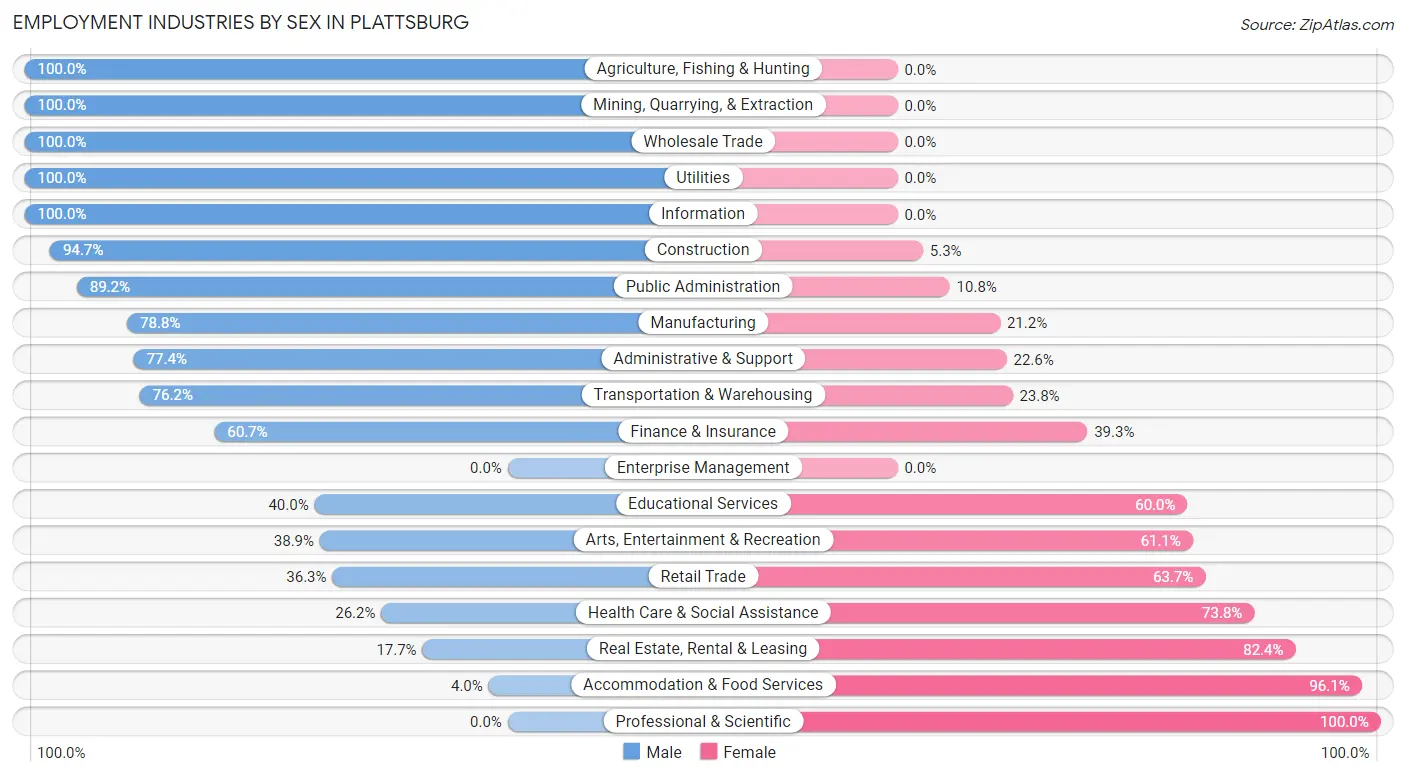
| Industry | Male | Female |
| Agriculture, Fishing & Hunting | 66 (100.0%) | 0 (0.0%) |
| Mining, Quarrying, & Extraction | 4 (100.0%) | 0 (0.0%) |
| Construction | 90 (94.7%) | 5 (5.3%) |
| Manufacturing | 115 (78.8%) | 31 (21.2%) |
| Wholesale Trade | 25 (100.0%) | 0 (0.0%) |
| Retail Trade | 49 (36.3%) | 86 (63.7%) |
| Transportation & Warehousing | 64 (76.2%) | 20 (23.8%) |
| Utilities | 6 (100.0%) | 0 (0.0%) |
| Information | 3 (100.0%) | 0 (0.0%) |
| Finance & Insurance | 17 (60.7%) | 11 (39.3%) |
| Real Estate, Rental & Leasing | 3 (17.6%) | 14 (82.4%) |
| Professional & Scientific | 0 (0.0%) | 6 (100.0%) |
| Enterprise Management | 0 (0.0%) | 0 (0.0%) |
| Administrative & Support | 48 (77.4%) | 14 (22.6%) |
| Educational Services | 30 (40.0%) | 45 (60.0%) |
| Health Care & Social Assistance | 28 (26.2%) | 79 (73.8%) |
| Arts, Entertainment & Recreation | 28 (38.9%) | 44 (61.1%) |
| Accommodation & Food Services | 3 (4.0%) | 73 (96.1%) |
| Public Administration | 33 (89.2%) | 4 (10.8%) |
| Total | 620 (58.4%) | 441 (41.6%) |
Education in Plattsburg
School Enrollment in Plattsburg
The most common levels of schooling among the 408 students in Plattsburg are middle school (90 | 22.1%), college / undergraduate (85 | 20.8%), and elementary school (75 | 18.4%).
| School Level | # Students | % Students |
| Nursery / Preschool | 44 | 10.8% |
| Kindergarten | 49 | 12.0% |
| Elementary School | 75 | 18.4% |
| Middle School | 90 | 22.1% |
| High School | 55 | 13.5% |
| College / Undergraduate | 85 | 20.8% |
| Graduate / Professional | 10 | 2.5% |
| Total | 408 | 100.0% |
School Enrollment by Age by Funding Source in Plattsburg
Out of a total of 408 students who are enrolled in schools in Plattsburg, 66 (16.2%) attend a private institution, while the remaining 342 (83.8%) are enrolled in public schools. The age group of 3 to 4 year olds has the highest likelihood of being enrolled in private schools, with 21 (77.8% in the age bracket) enrolled. Conversely, the age group of 20 to 24 year olds has the lowest likelihood of being enrolled in a private school, with 49 (100.0% in the age bracket) attending a public institution.
| Age Bracket | Public School | Private School |
| 3 to 4 Year Olds | 6 (22.2%) | 21 (77.8%) |
| 5 to 9 Year Old | 116 (95.9%) | 5 (4.1%) |
| 10 to 14 Year Olds | 118 (96.7%) | 4 (3.3%) |
| 15 to 17 Year Olds | 17 (51.5%) | 16 (48.5%) |
| 18 to 19 Year Olds | 14 (41.2%) | 20 (58.8%) |
| 20 to 24 Year Olds | 49 (100.0%) | 0 (0.0%) |
| 25 to 34 Year Olds | 17 (100.0%) | 0 (0.0%) |
| 35 Years and over | 5 (100.0%) | 0 (0.0%) |
| Total | 342 (83.8%) | 66 (16.2%) |
Educational Attainment by Field of Study in Plattsburg
Education (116 | 24.1%), business (75 | 15.6%), arts & humanities (66 | 13.7%), science & technology (44 | 9.1%), and engineering (34 | 7.1%) are the most common fields of study among 481 individuals in Plattsburg who have obtained a bachelor's degree or higher.
| Field of Study | # Graduates | % Graduates |
| Computers & Mathematics | 29 | 6.0% |
| Bio, Nature & Agricultural | 27 | 5.6% |
| Physical & Health Sciences | 19 | 4.0% |
| Psychology | 3 | 0.6% |
| Social Sciences | 20 | 4.2% |
| Engineering | 34 | 7.1% |
| Multidisciplinary Studies | 0 | 0.0% |
| Science & Technology | 44 | 9.1% |
| Business | 75 | 15.6% |
| Education | 116 | 24.1% |
| Literature & Languages | 4 | 0.8% |
| Liberal Arts & History | 30 | 6.2% |
| Visual & Performing Arts | 0 | 0.0% |
| Communications | 14 | 2.9% |
| Arts & Humanities | 66 | 13.7% |
| Total | 481 | 100.0% |
Transportation & Commute in Plattsburg
Vehicle Availability by Sex in Plattsburg
The most prevalent vehicle ownership categories in Plattsburg are males with 2 vehicles (270, accounting for 43.9%) and females with 2 vehicles (207, making up 63.7%).
| Vehicles Available | Male | Female |
| No Vehicle | 46 (7.5%) | 8 (1.9%) |
| 1 Vehicle | 114 (18.5%) | 38 (9.0%) |
| 2 Vehicles | 270 (43.9%) | 207 (48.8%) |
| 3 Vehicles | 114 (18.5%) | 128 (30.2%) |
| 4 Vehicles | 16 (2.6%) | 12 (2.8%) |
| 5 or more Vehicles | 55 (8.9%) | 31 (7.3%) |
| Total | 615 (100.0%) | 424 (100.0%) |
Commute Time in Plattsburg
The most frequently occuring commute durations in Plattsburg are 5 to 9 minutes (224 commuters, 22.6%), 45 to 59 minutes (183 commuters, 18.4%), and 35 to 39 minutes (136 commuters, 13.7%).
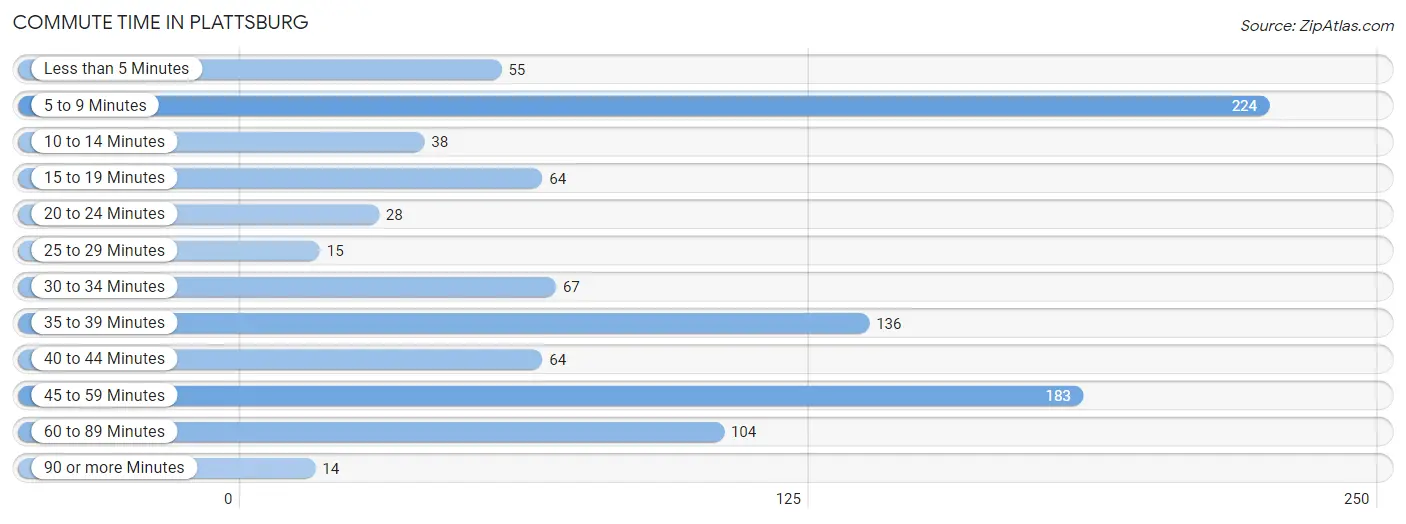
| Commute Time | # Commuters | % Commuters |
| Less than 5 Minutes | 55 | 5.5% |
| 5 to 9 Minutes | 224 | 22.6% |
| 10 to 14 Minutes | 38 | 3.8% |
| 15 to 19 Minutes | 64 | 6.5% |
| 20 to 24 Minutes | 28 | 2.8% |
| 25 to 29 Minutes | 15 | 1.5% |
| 30 to 34 Minutes | 67 | 6.8% |
| 35 to 39 Minutes | 136 | 13.7% |
| 40 to 44 Minutes | 64 | 6.5% |
| 45 to 59 Minutes | 183 | 18.4% |
| 60 to 89 Minutes | 104 | 10.5% |
| 90 or more Minutes | 14 | 1.4% |
Commute Time by Sex in Plattsburg
The most common commute times in Plattsburg are 5 to 9 minutes (145 commuters, 24.7%) for males and 5 to 9 minutes (79 commuters, 19.5%) for females.
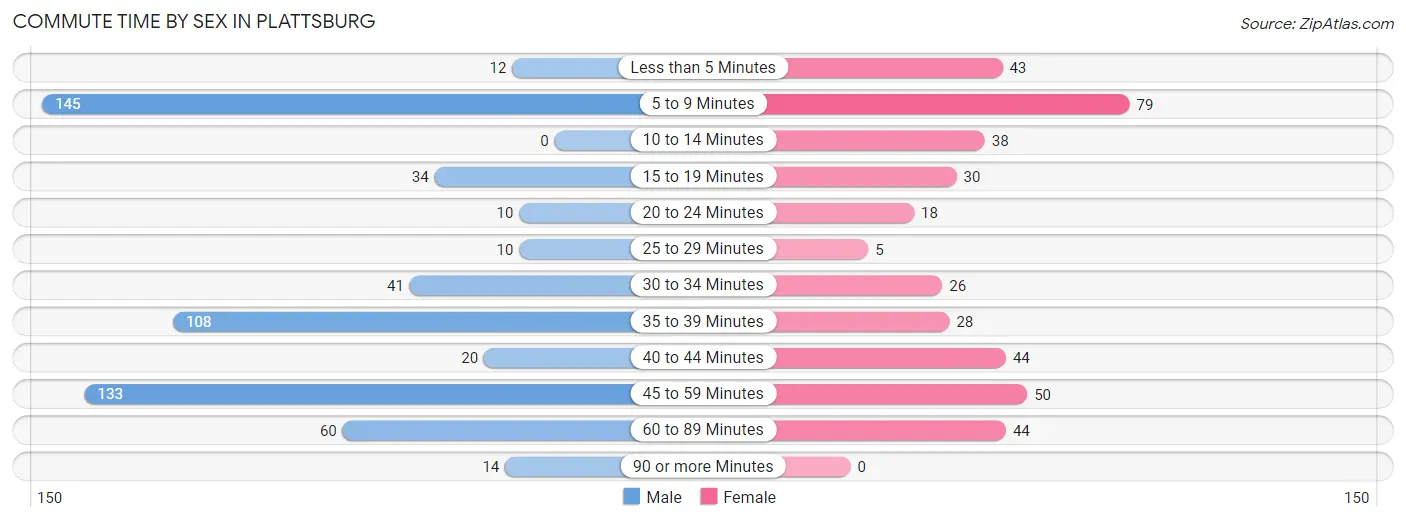
| Commute Time | Male | Female |
| Less than 5 Minutes | 12 (2.0%) | 43 (10.6%) |
| 5 to 9 Minutes | 145 (24.7%) | 79 (19.5%) |
| 10 to 14 Minutes | 0 (0.0%) | 38 (9.4%) |
| 15 to 19 Minutes | 34 (5.8%) | 30 (7.4%) |
| 20 to 24 Minutes | 10 (1.7%) | 18 (4.4%) |
| 25 to 29 Minutes | 10 (1.7%) | 5 (1.2%) |
| 30 to 34 Minutes | 41 (7.0%) | 26 (6.4%) |
| 35 to 39 Minutes | 108 (18.4%) | 28 (6.9%) |
| 40 to 44 Minutes | 20 (3.4%) | 44 (10.9%) |
| 45 to 59 Minutes | 133 (22.7%) | 50 (12.3%) |
| 60 to 89 Minutes | 60 (10.2%) | 44 (10.9%) |
| 90 or more Minutes | 14 (2.4%) | 0 (0.0%) |
Time of Departure to Work by Sex in Plattsburg
The most frequent times of departure to work in Plattsburg are 5:00 AM to 5:29 AM (131, 22.3%) for males and 7:30 AM to 7:59 AM (54, 13.3%) for females.
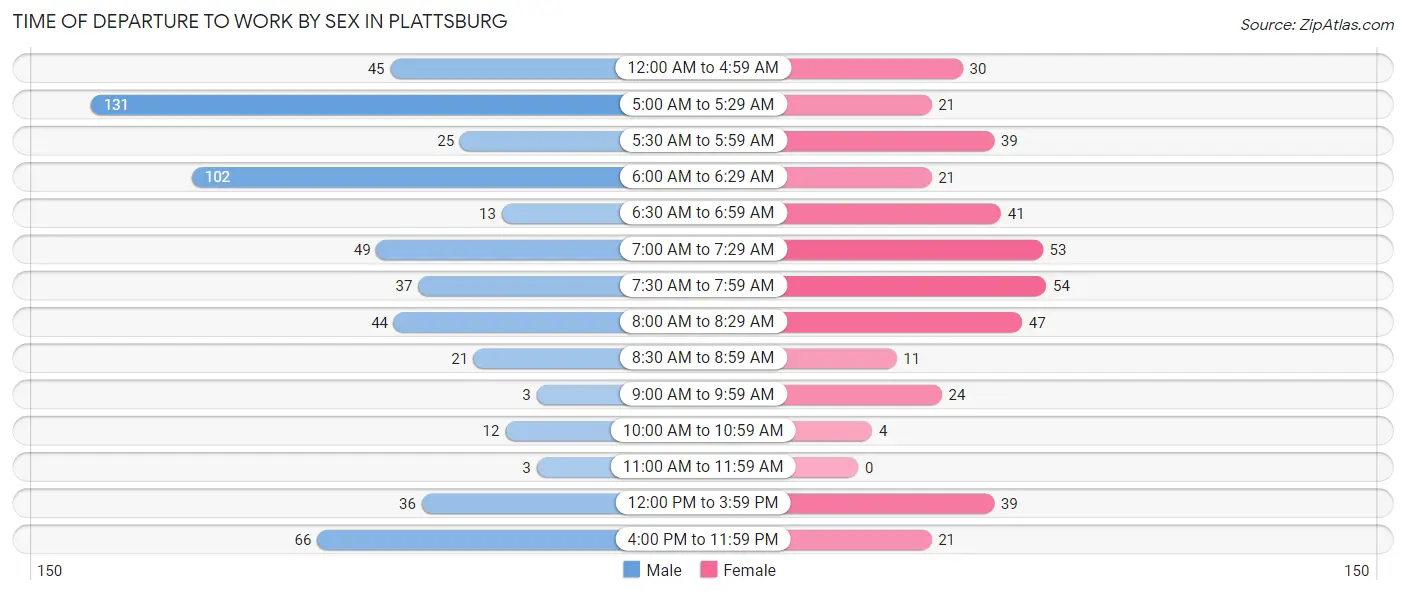
| Time of Departure | Male | Female |
| 12:00 AM to 4:59 AM | 45 (7.7%) | 30 (7.4%) |
| 5:00 AM to 5:29 AM | 131 (22.3%) | 21 (5.2%) |
| 5:30 AM to 5:59 AM | 25 (4.3%) | 39 (9.6%) |
| 6:00 AM to 6:29 AM | 102 (17.4%) | 21 (5.2%) |
| 6:30 AM to 6:59 AM | 13 (2.2%) | 41 (10.1%) |
| 7:00 AM to 7:29 AM | 49 (8.4%) | 53 (13.1%) |
| 7:30 AM to 7:59 AM | 37 (6.3%) | 54 (13.3%) |
| 8:00 AM to 8:29 AM | 44 (7.5%) | 47 (11.6%) |
| 8:30 AM to 8:59 AM | 21 (3.6%) | 11 (2.7%) |
| 9:00 AM to 9:59 AM | 3 (0.5%) | 24 (5.9%) |
| 10:00 AM to 10:59 AM | 12 (2.0%) | 4 (1.0%) |
| 11:00 AM to 11:59 AM | 3 (0.5%) | 0 (0.0%) |
| 12:00 PM to 3:59 PM | 36 (6.1%) | 39 (9.6%) |
| 4:00 PM to 11:59 PM | 66 (11.2%) | 21 (5.2%) |
| Total | 587 (100.0%) | 405 (100.0%) |
Housing Occupancy in Plattsburg
Occupancy by Ownership in Plattsburg
Of the total 994 dwellings in Plattsburg, owner-occupied units account for 658 (66.2%), while renter-occupied units make up 336 (33.8%).
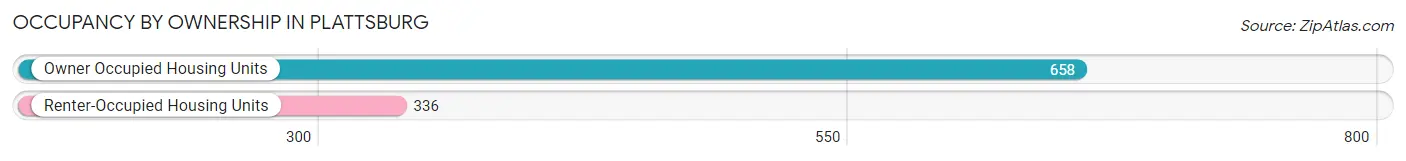
| Occupancy | # Housing Units | % Housing Units |
| Owner Occupied Housing Units | 658 | 66.2% |
| Renter-Occupied Housing Units | 336 | 33.8% |
| Total Occupied Housing Units | 994 | 100.0% |
Occupancy by Household Size in Plattsburg
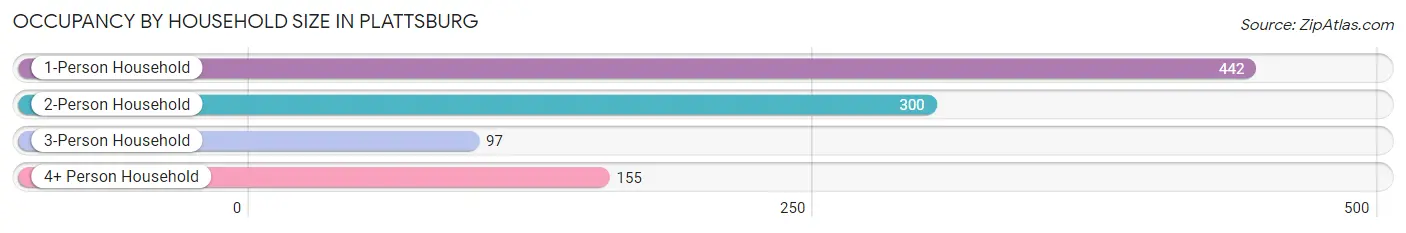
| Household Size | # Housing Units | % Housing Units |
| 1-Person Household | 442 | 44.5% |
| 2-Person Household | 300 | 30.2% |
| 3-Person Household | 97 | 9.8% |
| 4+ Person Household | 155 | 15.6% |
| Total Housing Units | 994 | 100.0% |
Occupancy by Ownership by Household Size in Plattsburg
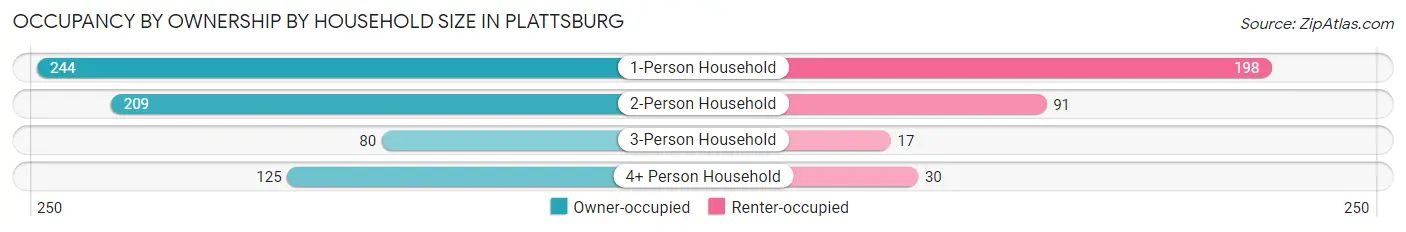
| Household Size | Owner-occupied | Renter-occupied |
| 1-Person Household | 244 (55.2%) | 198 (44.8%) |
| 2-Person Household | 209 (69.7%) | 91 (30.3%) |
| 3-Person Household | 80 (82.5%) | 17 (17.5%) |
| 4+ Person Household | 125 (80.6%) | 30 (19.4%) |
| Total Housing Units | 658 (66.2%) | 336 (33.8%) |
Occupancy by Educational Attainment in Plattsburg
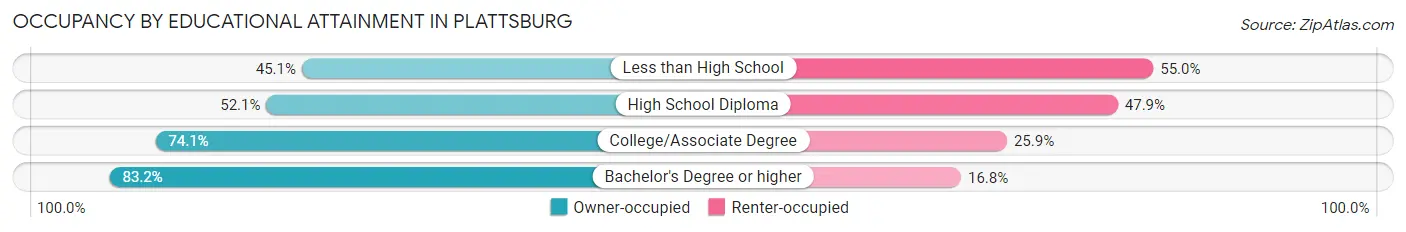
| Household Size | Owner-occupied | Renter-occupied |
| Less than High School | 41 (45.1%) | 50 (54.9%) |
| High School Diploma | 188 (52.1%) | 173 (47.9%) |
| College/Associate Degree | 177 (74.1%) | 62 (25.9%) |
| Bachelor's Degree or higher | 252 (83.2%) | 51 (16.8%) |
Occupancy by Age of Householder in Plattsburg
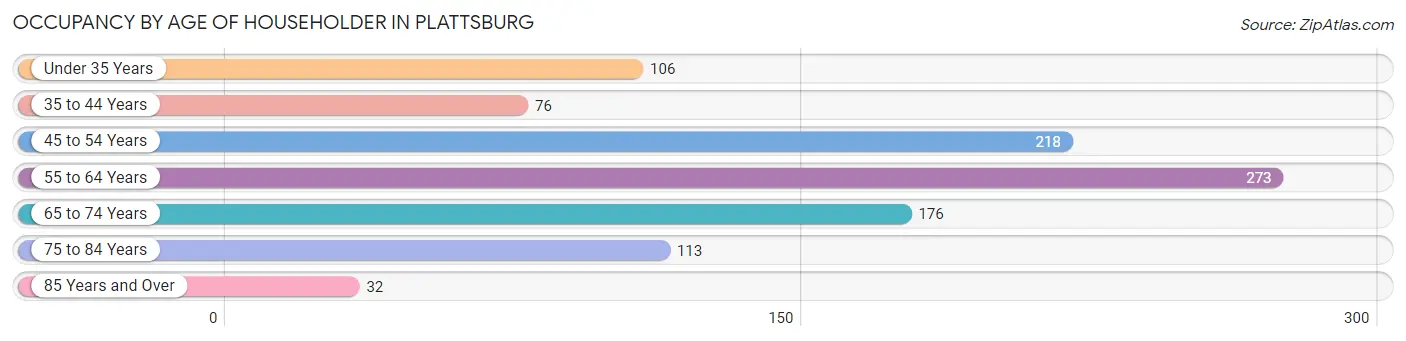
| Age Bracket | # Households | % Households |
| Under 35 Years | 106 | 10.7% |
| 35 to 44 Years | 76 | 7.6% |
| 45 to 54 Years | 218 | 21.9% |
| 55 to 64 Years | 273 | 27.5% |
| 65 to 74 Years | 176 | 17.7% |
| 75 to 84 Years | 113 | 11.4% |
| 85 Years and Over | 32 | 3.2% |
| Total | 994 | 100.0% |
Housing Finances in Plattsburg
Median Income by Occupancy in Plattsburg
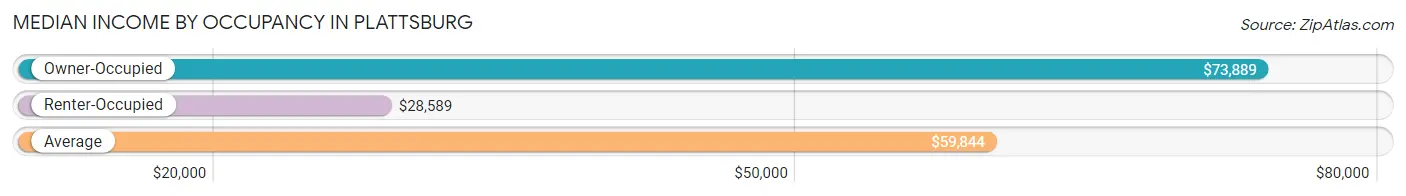
| Occupancy Type | # Households | Median Income |
| Owner-Occupied | 658 (66.2%) | $73,889 |
| Renter-Occupied | 336 (33.8%) | $28,589 |
| Average | 994 (100.0%) | $59,844 |
Occupancy by Householder Income Bracket in Plattsburg
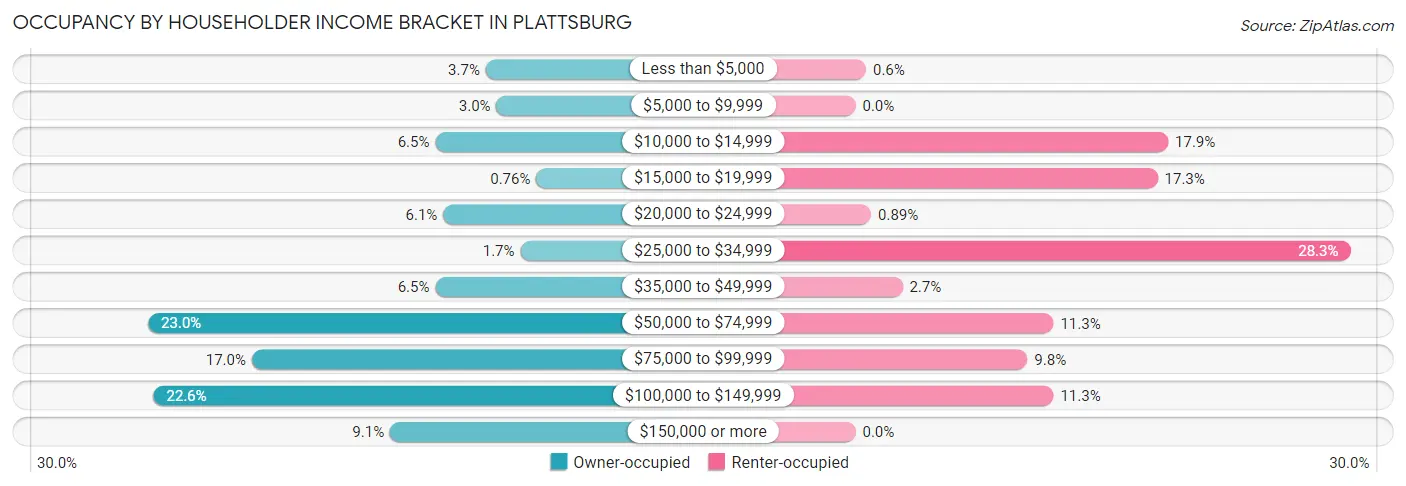
| Income Bracket | Owner-occupied | Renter-occupied |
| Less than $5,000 | 24 (3.6%) | 2 (0.6%) |
| $5,000 to $9,999 | 20 (3.0%) | 0 (0.0%) |
| $10,000 to $14,999 | 43 (6.5%) | 60 (17.9%) |
| $15,000 to $19,999 | 5 (0.8%) | 58 (17.3%) |
| $20,000 to $24,999 | 40 (6.1%) | 3 (0.9%) |
| $25,000 to $34,999 | 11 (1.7%) | 95 (28.3%) |
| $35,000 to $49,999 | 43 (6.5%) | 9 (2.7%) |
| $50,000 to $74,999 | 151 (23.0%) | 38 (11.3%) |
| $75,000 to $99,999 | 112 (17.0%) | 33 (9.8%) |
| $100,000 to $149,999 | 149 (22.6%) | 38 (11.3%) |
| $150,000 or more | 60 (9.1%) | 0 (0.0%) |
| Total | 658 (100.0%) | 336 (100.0%) |
Monthly Housing Cost Tiers in Plattsburg
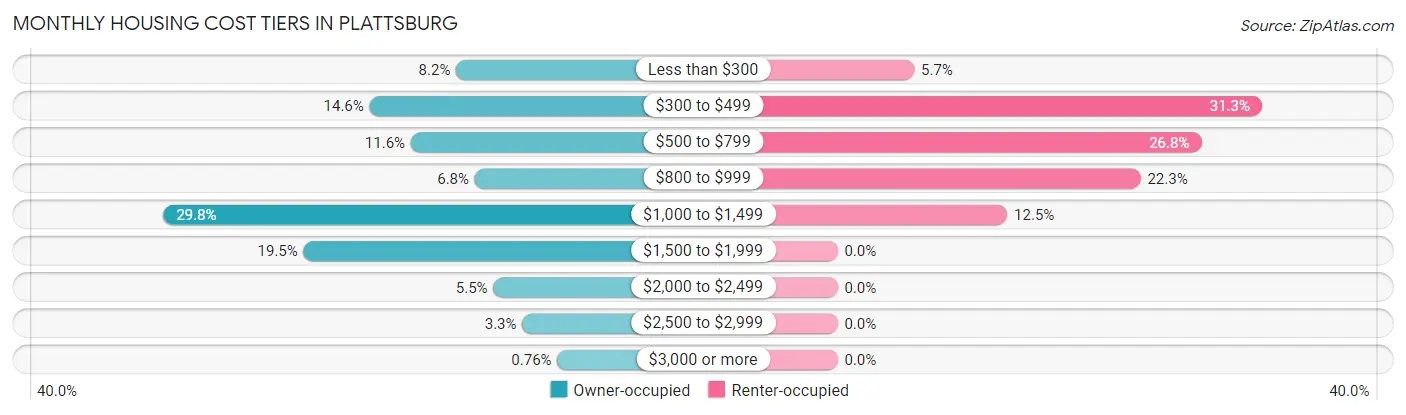
| Monthly Cost | Owner-occupied | Renter-occupied |
| Less than $300 | 54 (8.2%) | 19 (5.7%) |
| $300 to $499 | 96 (14.6%) | 105 (31.2%) |
| $500 to $799 | 76 (11.6%) | 90 (26.8%) |
| $800 to $999 | 45 (6.8%) | 75 (22.3%) |
| $1,000 to $1,499 | 196 (29.8%) | 42 (12.5%) |
| $1,500 to $1,999 | 128 (19.5%) | 0 (0.0%) |
| $2,000 to $2,499 | 36 (5.5%) | 0 (0.0%) |
| $2,500 to $2,999 | 22 (3.3%) | 0 (0.0%) |
| $3,000 or more | 5 (0.8%) | 0 (0.0%) |
| Total | 658 (100.0%) | 336 (100.0%) |
Physical Housing Characteristics in Plattsburg
Housing Structures in Plattsburg
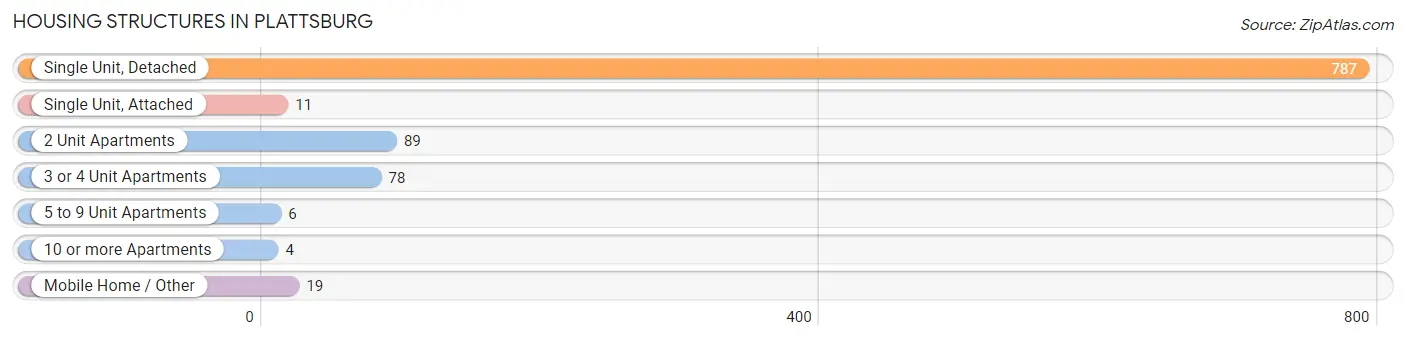
| Structure Type | # Housing Units | % Housing Units |
| Single Unit, Detached | 787 | 79.2% |
| Single Unit, Attached | 11 | 1.1% |
| 2 Unit Apartments | 89 | 8.9% |
| 3 or 4 Unit Apartments | 78 | 7.9% |
| 5 to 9 Unit Apartments | 6 | 0.6% |
| 10 or more Apartments | 4 | 0.4% |
| Mobile Home / Other | 19 | 1.9% |
| Total | 994 | 100.0% |
Housing Structures by Occupancy in Plattsburg
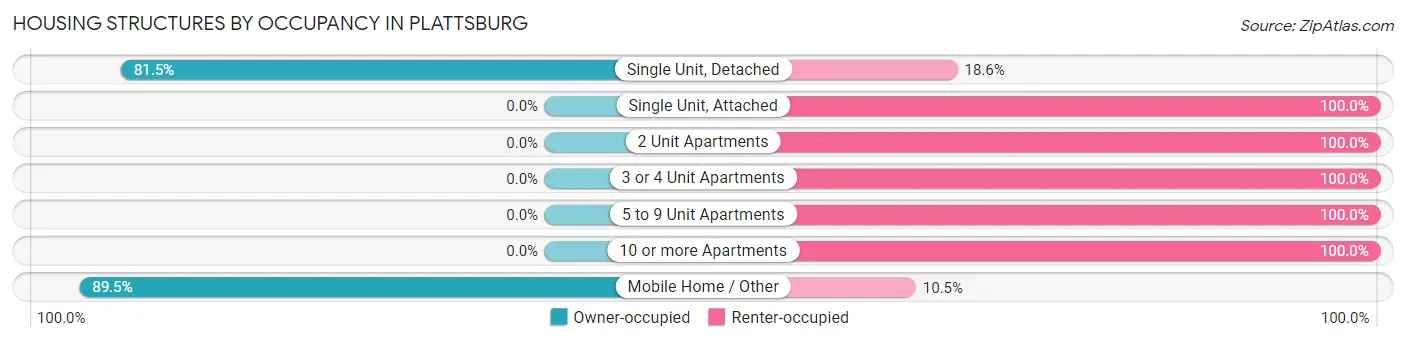
| Structure Type | Owner-occupied | Renter-occupied |
| Single Unit, Detached | 641 (81.5%) | 146 (18.5%) |
| Single Unit, Attached | 0 (0.0%) | 11 (100.0%) |
| 2 Unit Apartments | 0 (0.0%) | 89 (100.0%) |
| 3 or 4 Unit Apartments | 0 (0.0%) | 78 (100.0%) |
| 5 to 9 Unit Apartments | 0 (0.0%) | 6 (100.0%) |
| 10 or more Apartments | 0 (0.0%) | 4 (100.0%) |
| Mobile Home / Other | 17 (89.5%) | 2 (10.5%) |
| Total | 658 (66.2%) | 336 (33.8%) |
Housing Structures by Number of Rooms in Plattsburg
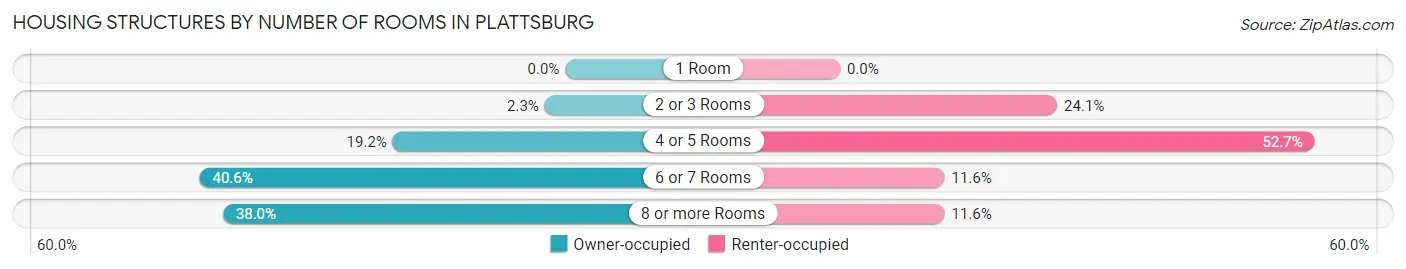
| Number of Rooms | Owner-occupied | Renter-occupied |
| 1 Room | 0 (0.0%) | 0 (0.0%) |
| 2 or 3 Rooms | 15 (2.3%) | 81 (24.1%) |
| 4 or 5 Rooms | 126 (19.2%) | 177 (52.7%) |
| 6 or 7 Rooms | 267 (40.6%) | 39 (11.6%) |
| 8 or more Rooms | 250 (38.0%) | 39 (11.6%) |
| Total | 658 (100.0%) | 336 (100.0%) |
Housing Structure by Heating Type in Plattsburg
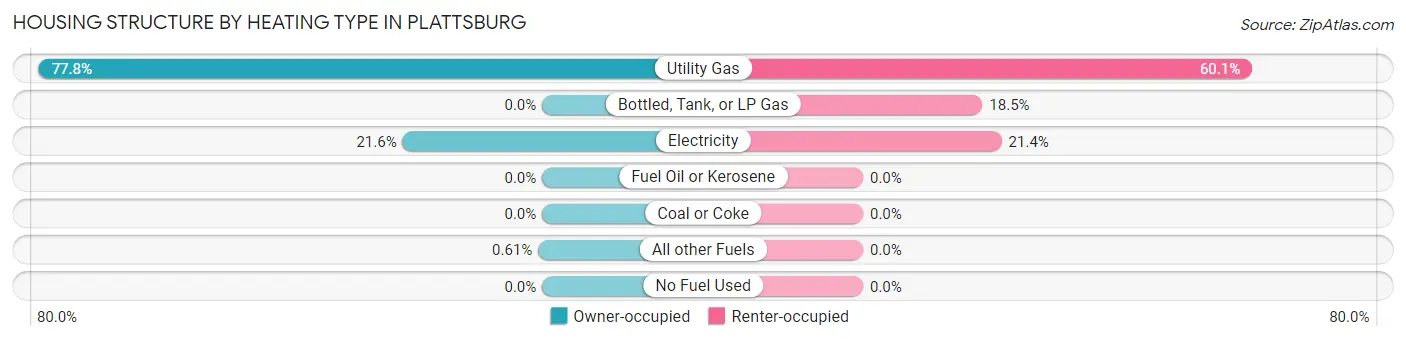
| Heating Type | Owner-occupied | Renter-occupied |
| Utility Gas | 512 (77.8%) | 202 (60.1%) |
| Bottled, Tank, or LP Gas | 0 (0.0%) | 62 (18.4%) |
| Electricity | 142 (21.6%) | 72 (21.4%) |
| Fuel Oil or Kerosene | 0 (0.0%) | 0 (0.0%) |
| Coal or Coke | 0 (0.0%) | 0 (0.0%) |
| All other Fuels | 4 (0.6%) | 0 (0.0%) |
| No Fuel Used | 0 (0.0%) | 0 (0.0%) |
| Total | 658 (100.0%) | 336 (100.0%) |
Household Vehicle Usage in Plattsburg
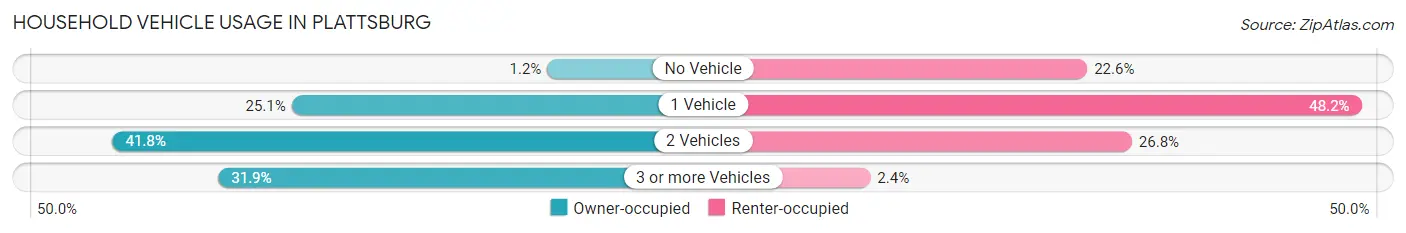
| Vehicles per Household | Owner-occupied | Renter-occupied |
| No Vehicle | 8 (1.2%) | 76 (22.6%) |
| 1 Vehicle | 165 (25.1%) | 162 (48.2%) |
| 2 Vehicles | 275 (41.8%) | 90 (26.8%) |
| 3 or more Vehicles | 210 (31.9%) | 8 (2.4%) |
| Total | 658 (100.0%) | 336 (100.0%) |
Real Estate & Mortgages in Plattsburg
Real Estate and Mortgage Overview in Plattsburg
| Characteristic | Without Mortgage | With Mortgage |
| Housing Units | 238 | 420 |
| Median Property Value | $113,600 | $191,300 |
| Median Household Income | $54,306 | $43 |
| Monthly Housing Costs | $432 | $5 |
| Real Estate Taxes | $1,190 | $2 |
Property Value by Mortgage Status in Plattsburg
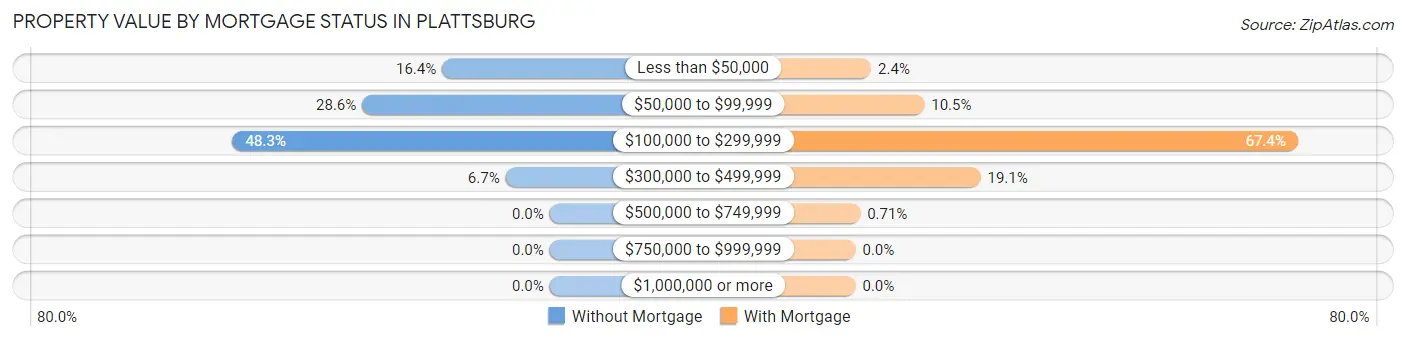
| Property Value | Without Mortgage | With Mortgage |
| Less than $50,000 | 39 (16.4%) | 10 (2.4%) |
| $50,000 to $99,999 | 68 (28.6%) | 44 (10.5%) |
| $100,000 to $299,999 | 115 (48.3%) | 283 (67.4%) |
| $300,000 to $499,999 | 16 (6.7%) | 80 (19.1%) |
| $500,000 to $749,999 | 0 (0.0%) | 3 (0.7%) |
| $750,000 to $999,999 | 0 (0.0%) | 0 (0.0%) |
| $1,000,000 or more | 0 (0.0%) | 0 (0.0%) |
| Total | 238 (100.0%) | 420 (100.0%) |
Household Income by Mortgage Status in Plattsburg
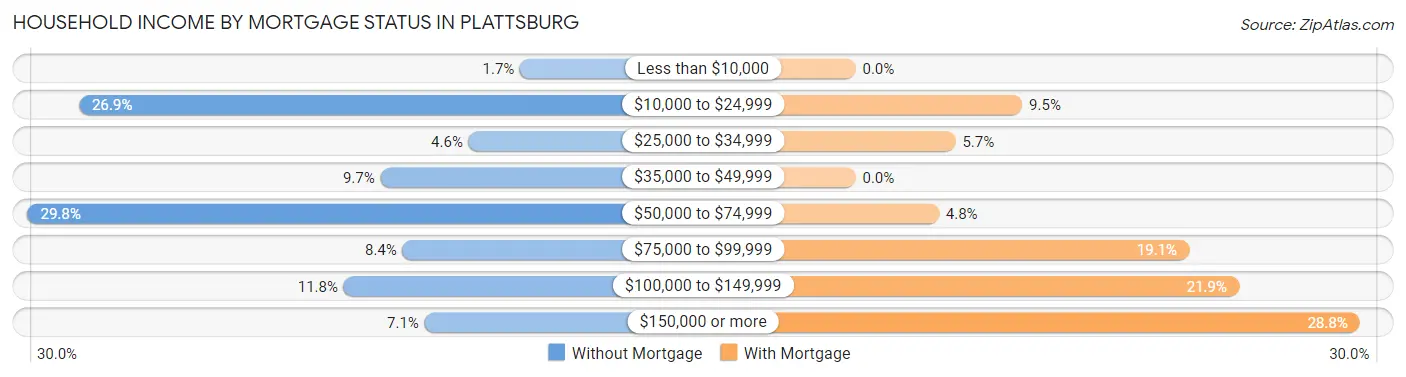
| Household Income | Without Mortgage | With Mortgage |
| Less than $10,000 | 4 (1.7%) | 0 (0.0%) |
| $10,000 to $24,999 | 64 (26.9%) | 40 (9.5%) |
| $25,000 to $34,999 | 11 (4.6%) | 24 (5.7%) |
| $35,000 to $49,999 | 23 (9.7%) | 0 (0.0%) |
| $50,000 to $74,999 | 71 (29.8%) | 20 (4.8%) |
| $75,000 to $99,999 | 20 (8.4%) | 80 (19.1%) |
| $100,000 to $149,999 | 28 (11.8%) | 92 (21.9%) |
| $150,000 or more | 17 (7.1%) | 121 (28.8%) |
| Total | 238 (100.0%) | 420 (100.0%) |
Property Value to Household Income Ratio in Plattsburg
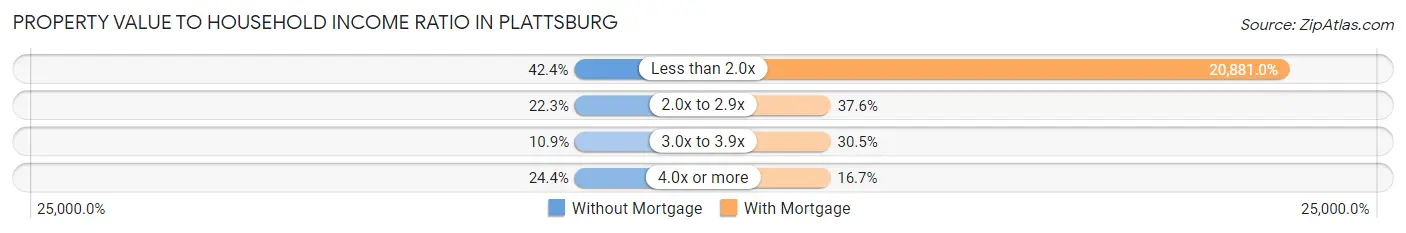
| Value-to-Income Ratio | Without Mortgage | With Mortgage |
| Less than 2.0x | 101 (42.4%) | 87,700 (20,881.0%) |
| 2.0x to 2.9x | 53 (22.3%) | 158 (37.6%) |
| 3.0x to 3.9x | 26 (10.9%) | 128 (30.5%) |
| 4.0x or more | 58 (24.4%) | 70 (16.7%) |
| Total | 238 (100.0%) | 420 (100.0%) |
Real Estate Taxes by Mortgage Status in Plattsburg
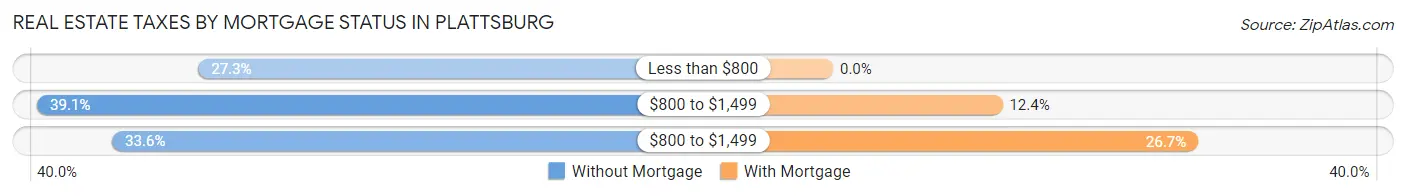
| Property Taxes | Without Mortgage | With Mortgage |
| Less than $800 | 65 (27.3%) | 0 (0.0%) |
| $800 to $1,499 | 93 (39.1%) | 52 (12.4%) |
| $800 to $1,499 | 80 (33.6%) | 112 (26.7%) |
| Total | 238 (100.0%) | 420 (100.0%) |
Health & Disability in Plattsburg
Health Insurance Coverage by Age in Plattsburg
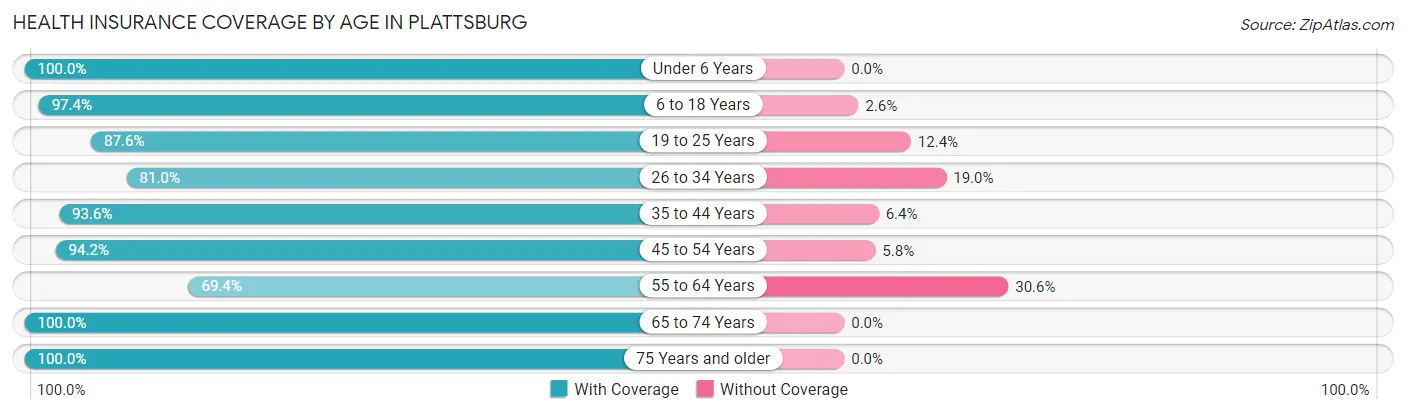
| Age Bracket | With Coverage | Without Coverage |
| Under 6 Years | 180 (100.0%) | 0 (0.0%) |
| 6 to 18 Years | 258 (97.4%) | 7 (2.6%) |
| 19 to 25 Years | 141 (87.6%) | 20 (12.4%) |
| 26 to 34 Years | 132 (81.0%) | 31 (19.0%) |
| 35 to 44 Years | 204 (93.6%) | 14 (6.4%) |
| 45 to 54 Years | 357 (94.2%) | 22 (5.8%) |
| 55 to 64 Years | 277 (69.4%) | 122 (30.6%) |
| 65 to 74 Years | 266 (100.0%) | 0 (0.0%) |
| 75 Years and older | 200 (100.0%) | 0 (0.0%) |
| Total | 2,015 (90.3%) | 216 (9.7%) |
Health Insurance Coverage by Citizenship Status in Plattsburg
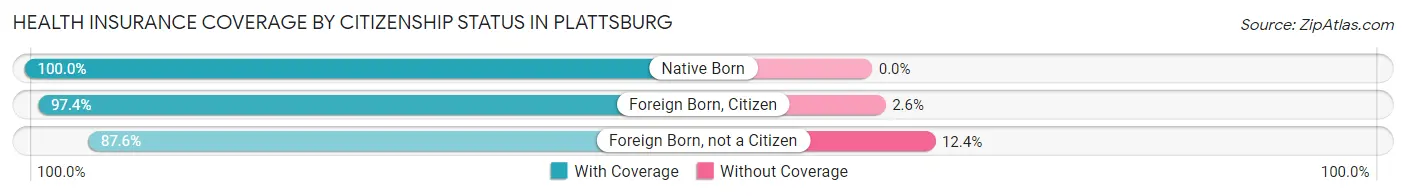
| Citizenship Status | With Coverage | Without Coverage |
| Native Born | 180 (100.0%) | 0 (0.0%) |
| Foreign Born, Citizen | 258 (97.4%) | 7 (2.6%) |
| Foreign Born, not a Citizen | 141 (87.6%) | 20 (12.4%) |
Health Insurance Coverage by Household Income in Plattsburg
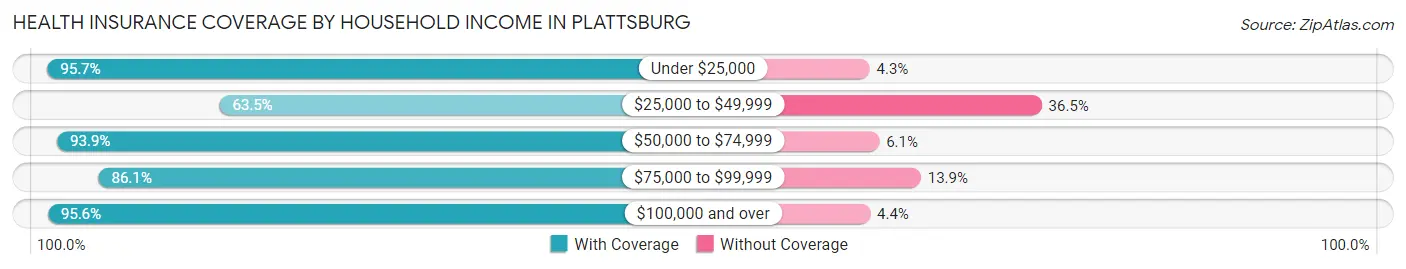
| Household Income | With Coverage | Without Coverage |
| Under $25,000 | 314 (95.7%) | 14 (4.3%) |
| $25,000 to $49,999 | 153 (63.5%) | 88 (36.5%) |
| $50,000 to $74,999 | 448 (93.9%) | 29 (6.1%) |
| $75,000 to $99,999 | 286 (86.1%) | 46 (13.9%) |
| $100,000 and over | 812 (95.6%) | 37 (4.4%) |
Public vs Private Health Insurance Coverage by Age in Plattsburg
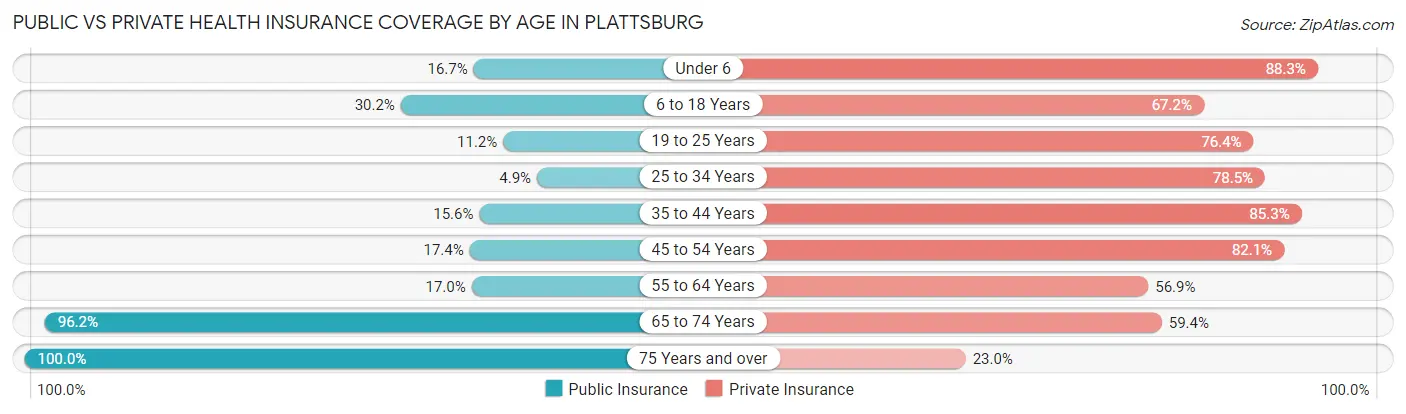
| Age Bracket | Public Insurance | Private Insurance |
| Under 6 | 30 (16.7%) | 159 (88.3%) |
| 6 to 18 Years | 80 (30.2%) | 178 (67.2%) |
| 19 to 25 Years | 18 (11.2%) | 123 (76.4%) |
| 25 to 34 Years | 8 (4.9%) | 128 (78.5%) |
| 35 to 44 Years | 34 (15.6%) | 186 (85.3%) |
| 45 to 54 Years | 66 (17.4%) | 311 (82.1%) |
| 55 to 64 Years | 68 (17.0%) | 227 (56.9%) |
| 65 to 74 Years | 256 (96.2%) | 158 (59.4%) |
| 75 Years and over | 200 (100.0%) | 46 (23.0%) |
| Total | 760 (34.1%) | 1,516 (67.9%) |
Disability Status by Sex by Age in Plattsburg
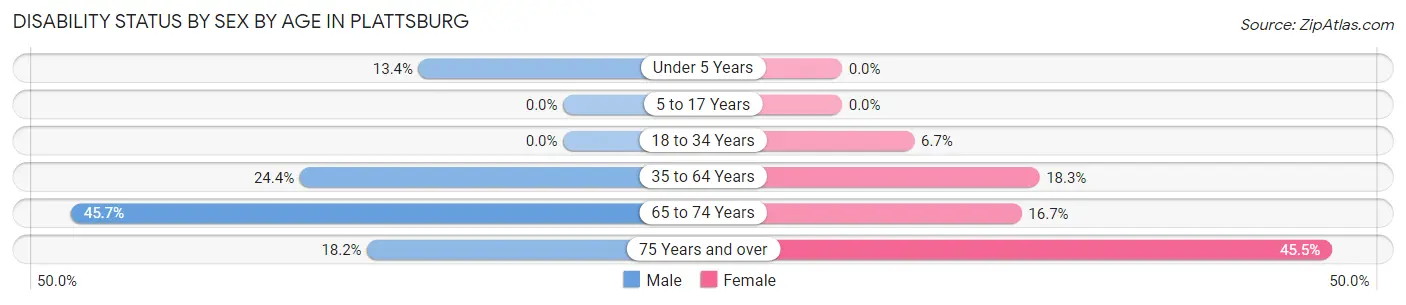
| Age Bracket | Male | Female |
| Under 5 Years | 11 (13.4%) | 0 (0.0%) |
| 5 to 17 Years | 0 (0.0%) | 0 (0.0%) |
| 18 to 34 Years | 0 (0.0%) | 10 (6.7%) |
| 35 to 64 Years | 130 (24.4%) | 85 (18.3%) |
| 65 to 74 Years | 64 (45.7%) | 21 (16.7%) |
| 75 Years and over | 8 (18.2%) | 71 (45.5%) |
Disability Class by Sex by Age in Plattsburg
Disability Class: Hearing Difficulty
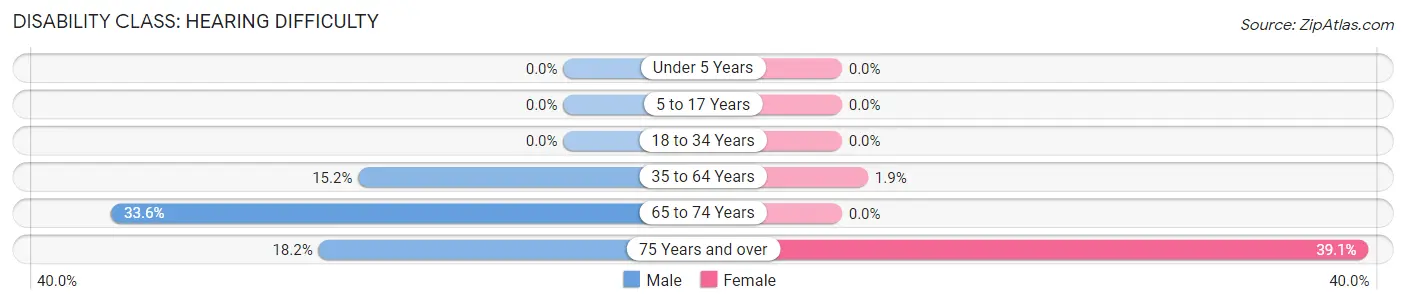
| Age Bracket | Male | Female |
| Under 5 Years | 0 (0.0%) | 0 (0.0%) |
| 5 to 17 Years | 0 (0.0%) | 0 (0.0%) |
| 18 to 34 Years | 0 (0.0%) | 0 (0.0%) |
| 35 to 64 Years | 81 (15.2%) | 9 (1.9%) |
| 65 to 74 Years | 47 (33.6%) | 0 (0.0%) |
| 75 Years and over | 8 (18.2%) | 61 (39.1%) |
Disability Class: Vision Difficulty
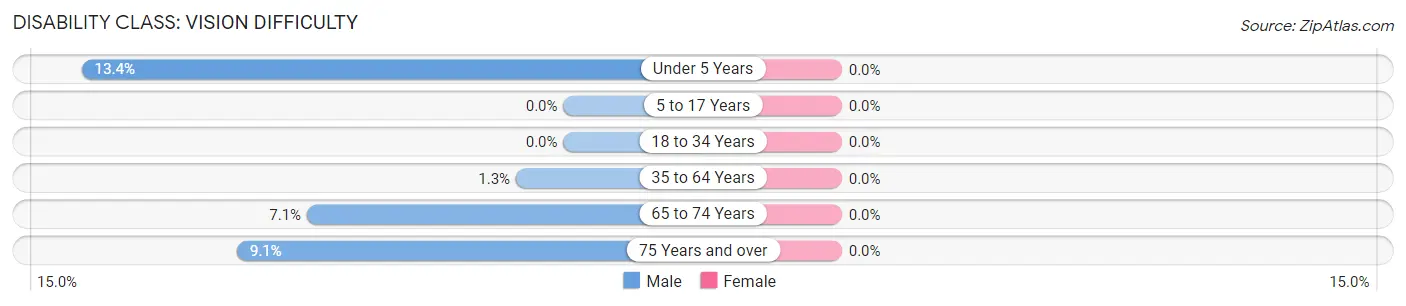
| Age Bracket | Male | Female |
| Under 5 Years | 11 (13.4%) | 0 (0.0%) |
| 5 to 17 Years | 0 (0.0%) | 0 (0.0%) |
| 18 to 34 Years | 0 (0.0%) | 0 (0.0%) |
| 35 to 64 Years | 7 (1.3%) | 0 (0.0%) |
| 65 to 74 Years | 10 (7.1%) | 0 (0.0%) |
| 75 Years and over | 4 (9.1%) | 0 (0.0%) |
Disability Class: Cognitive Difficulty
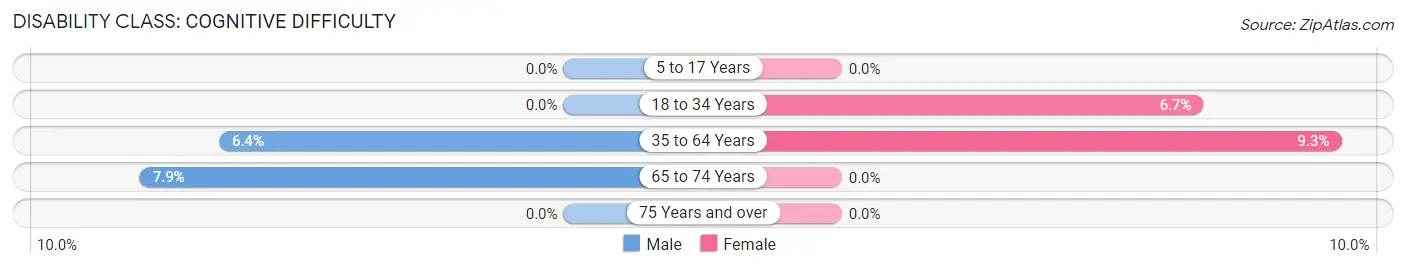
| Age Bracket | Male | Female |
| 5 to 17 Years | 0 (0.0%) | 0 (0.0%) |
| 18 to 34 Years | 0 (0.0%) | 10 (6.7%) |
| 35 to 64 Years | 34 (6.4%) | 43 (9.3%) |
| 65 to 74 Years | 11 (7.9%) | 0 (0.0%) |
| 75 Years and over | 0 (0.0%) | 0 (0.0%) |
Disability Class: Ambulatory Difficulty
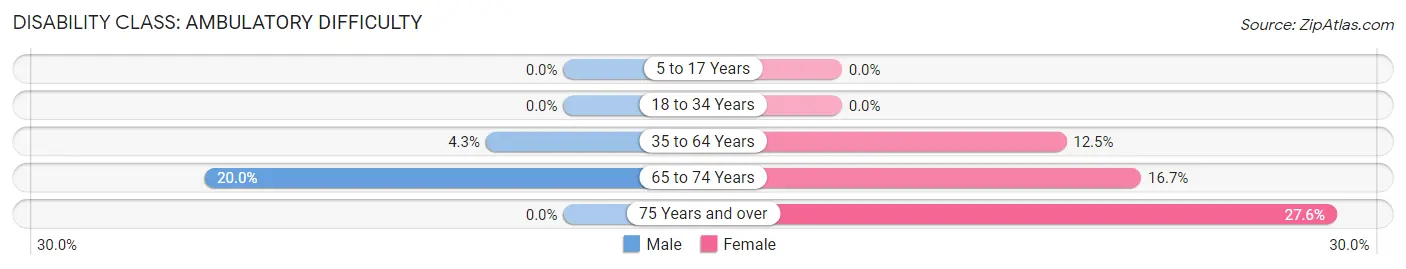
| Age Bracket | Male | Female |
| 5 to 17 Years | 0 (0.0%) | 0 (0.0%) |
| 18 to 34 Years | 0 (0.0%) | 0 (0.0%) |
| 35 to 64 Years | 23 (4.3%) | 58 (12.5%) |
| 65 to 74 Years | 28 (20.0%) | 21 (16.7%) |
| 75 Years and over | 0 (0.0%) | 43 (27.6%) |
Disability Class: Self-Care Difficulty
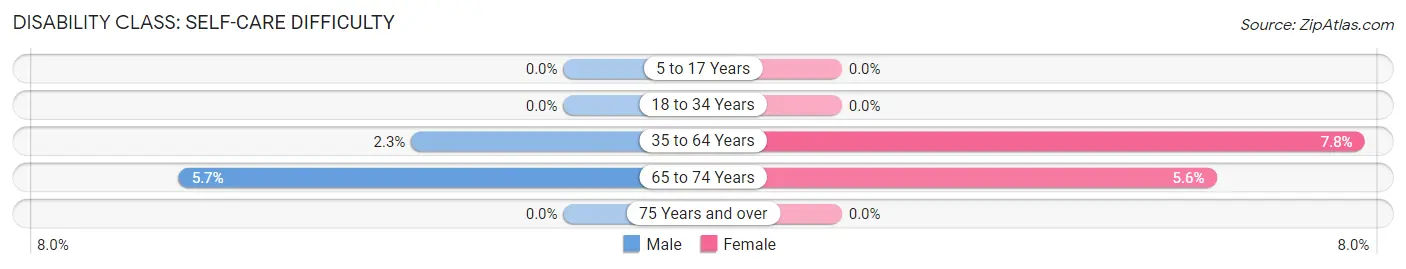
| Age Bracket | Male | Female |
| 5 to 17 Years | 0 (0.0%) | 0 (0.0%) |
| 18 to 34 Years | 0 (0.0%) | 0 (0.0%) |
| 35 to 64 Years | 12 (2.3%) | 36 (7.8%) |
| 65 to 74 Years | 8 (5.7%) | 7 (5.6%) |
| 75 Years and over | 0 (0.0%) | 0 (0.0%) |
Technology Access in Plattsburg
Computing Device Access in Plattsburg
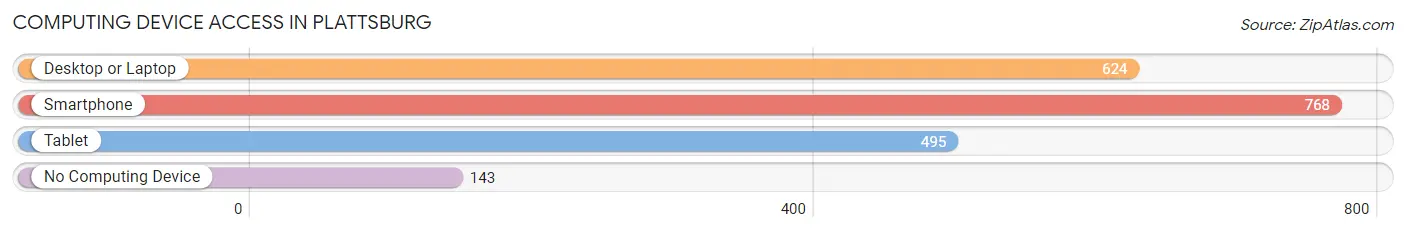
| Device Type | # Households | % Households |
| Desktop or Laptop | 624 | 62.8% |
| Smartphone | 768 | 77.3% |
| Tablet | 495 | 49.8% |
| No Computing Device | 143 | 14.4% |
| Total | 994 | 100.0% |
Internet Access in Plattsburg
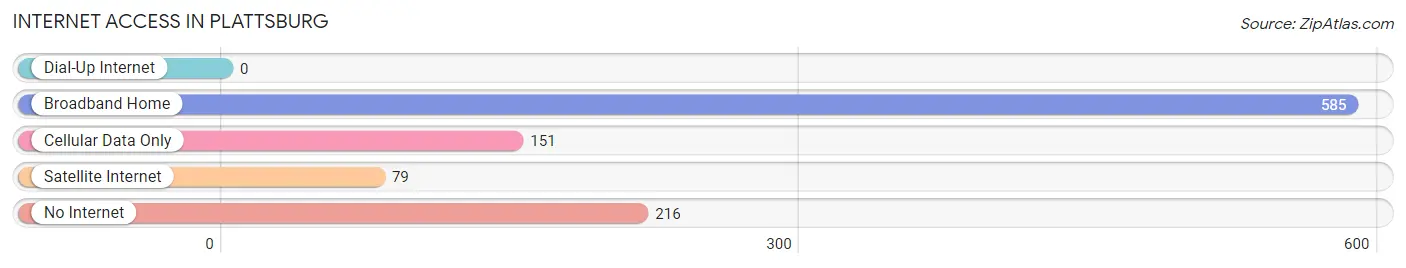
| Internet Type | # Households | % Households |
| Dial-Up Internet | 0 | 0.0% |
| Broadband Home | 585 | 58.9% |
| Cellular Data Only | 151 | 15.2% |
| Satellite Internet | 79 | 8.0% |
| No Internet | 216 | 21.7% |
| Total | 994 | 100.0% |
Plattsburg Summary
Plattsburg, Missouri is a small city located in Clinton County, in the northwest corner of the state. It is situated on the banks of the Platte River, and is the county seat of Clinton County. The city has a population of approximately 2,500 people, and is part of the Kansas City metropolitan area.
History
Plattsburg was founded in 1837 by a group of settlers from Kentucky and Tennessee. The city was named after the nearby Platte River, which was named after the French explorer Pierre Gaultier de Varennes, Sieur de La Verendrye. The city was incorporated in 1841, and was the first county seat of Clinton County.
In the late 19th century, Plattsburg was a thriving agricultural center, with a variety of crops being grown in the area. The city was also home to several manufacturing businesses, including a flour mill, a sawmill, and a brickyard.
In the early 20th century, Plattsburg experienced a period of growth and prosperity. The city was home to several banks, a movie theater, and a variety of other businesses. The city also had a thriving music scene, with several bands playing in the area.
Geography
Plattsburg is located in the northwest corner of Missouri, in Clinton County. The city is situated on the banks of the Platte River, and is approximately 40 miles north of Kansas City. The city has a total area of 2.2 square miles, all of which is land.
The climate in Plattsburg is characterized by hot, humid summers and cold, wet winters. The average annual temperature is around 54 degrees Fahrenheit, and the average annual precipitation is around 40 inches.
Economy
The economy of Plattsburg is largely based on agriculture and manufacturing. The city is home to several farms, which produce a variety of crops, including corn, soybeans, wheat, and hay. The city is also home to several manufacturing businesses, including a flour mill, a sawmill, and a brickyard.
The city is also home to several retail businesses, including a grocery store, a hardware store, and a variety of other shops. The city is also home to several restaurants, bars, and other entertainment venues.
Demographics
As of the 2010 census, the population of Plattsburg was 2,500. The racial makeup of the city was 97.2% White, 0.8% African American, 0.4% Native American, 0.2% Asian, and 1.4% from other races. The median household income was $37,500, and the median family income was $45,000.
The city is home to several churches, including the First Baptist Church, the First United Methodist Church, and the Church of the Nazarene. The city is also home to several schools, including Plattsburg High School, Plattsburg Elementary School, and Plattsburg Middle School.
Conclusion
Plattsburg, Missouri is a small city located in Clinton County, in the northwest corner of the state. It is situated on the banks of the Platte River, and is the county seat of Clinton County. The city has a population of approximately 2,500 people, and is part of the Kansas City metropolitan area. The economy of Plattsburg is largely based on agriculture and manufacturing, and the city is home to several churches, schools, and other businesses. The racial makeup of the city is 97.2% White, 0.8% African American, 0.4% Native American, 0.2% Asian, and 1.4% from other races. The median household income was $37,500, and the median family income was $45,000.
Common Questions
What is Per Capita Income in Plattsburg?
Per Capita income in Plattsburg is $32,197.
What is the Median Family Income in Plattsburg?
Median Family Income in Plattsburg is $87,870.
What is the Median Household income in Plattsburg?
Median Household Income in Plattsburg is $59,844.
What is Income or Wage Gap in Plattsburg?
Income or Wage Gap in Plattsburg is 55.8%.
Women in Plattsburg earn 44.2 cents for every dollar earned by a man.
What is Inequality or Gini Index in Plattsburg?
Inequality or Gini Index in Plattsburg is 0.42.
What is the Total Population of Plattsburg?
Total Population of Plattsburg is 2,284.
What is the Total Male Population of Plattsburg?
Total Male Population of Plattsburg is 1,212.
What is the Total Female Population of Plattsburg?
Total Female Population of Plattsburg is 1,072.
What is the Ratio of Males per 100 Females in Plattsburg?
There are 113.06 Males per 100 Females in Plattsburg.
What is the Ratio of Females per 100 Males in Plattsburg?
There are 88.45 Females per 100 Males in Plattsburg.
What is the Median Population Age in Plattsburg?
Median Population Age in Plattsburg is 48.9 Years.
What is the Average Family Size in Plattsburg
Average Family Size in Plattsburg is 3.1 People.
What is the Average Household Size in Plattsburg
Average Household Size in Plattsburg is 2.2 People.
How Large is the Labor Force in Plattsburg?
There are 1,114 People in the Labor Forcein in Plattsburg.
What is the Percentage of People in the Labor Force in Plattsburg?
58.8% of People are in the Labor Force in Plattsburg.
What is the Unemployment Rate in Plattsburg?
Unemployment Rate in Plattsburg is 4.8%.