Pineville, MO Map & Demographics
Pineville Map
Pineville Overview
$23,929
PER CAPITA INCOME
$61,406
AVG FAMILY INCOME
$34,018
AVG HOUSEHOLD INCOME
39.5%
WAGE / INCOME GAP [ % ]
60.5¢/ $1
WAGE / INCOME GAP [ $ ]
0.48
INEQUALITY / GINI INDEX
895
TOTAL POPULATION
453
MALE POPULATION
442
FEMALE POPULATION
102.49
MALES / 100 FEMALES
97.57
FEMALES / 100 MALES
41.8
MEDIAN AGE
3.0
AVG FAMILY SIZE
2.4
AVG HOUSEHOLD SIZE
399
LABOR FORCE [ PEOPLE ]
56.3%
PERCENT IN LABOR FORCE
6.0%
UNEMPLOYMENT RATE
Pineville Zip Codes
Pineville Area Codes
Income in Pineville
Income Overview in Pineville
Per Capita Income in Pineville is $23,929, while median incomes of families and households are $61,406 and $34,018 respectively.
| Characteristic | Number | Measure |
| Per Capita Income | 895 | $23,929 |
| Median Family Income | 231 | $61,406 |
| Mean Family Income | 231 | $73,224 |
| Median Household Income | 358 | $34,018 |
| Mean Household Income | 358 | $56,397 |
| Income Deficit | 231 | $0 |
| Wage / Income Gap (%) | 895 | 39.46% |
| Wage / Income Gap ($) | 895 | 60.54¢ per $1 |
| Gini / Inequality Index | 895 | 0.48 |
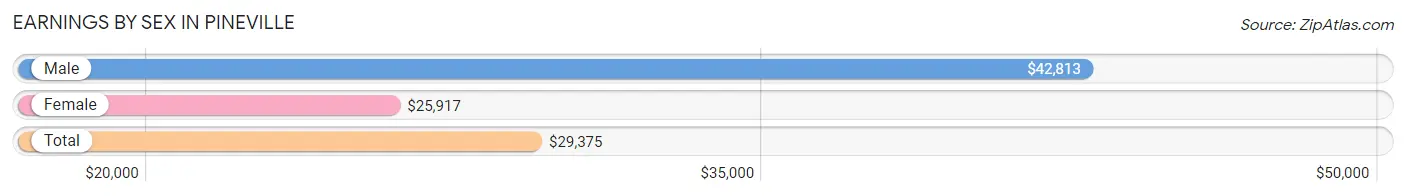
Earnings by Sex in Pineville
Average Earnings in Pineville are $29,375, $42,813 for men and $25,917 for women, a difference of 39.5%.
| Sex | Number | Average Earnings |
| Male | 186 (44.2%) | $42,813 |
| Female | 235 (55.8%) | $25,917 |
| Total | 421 (100.0%) | $29,375 |
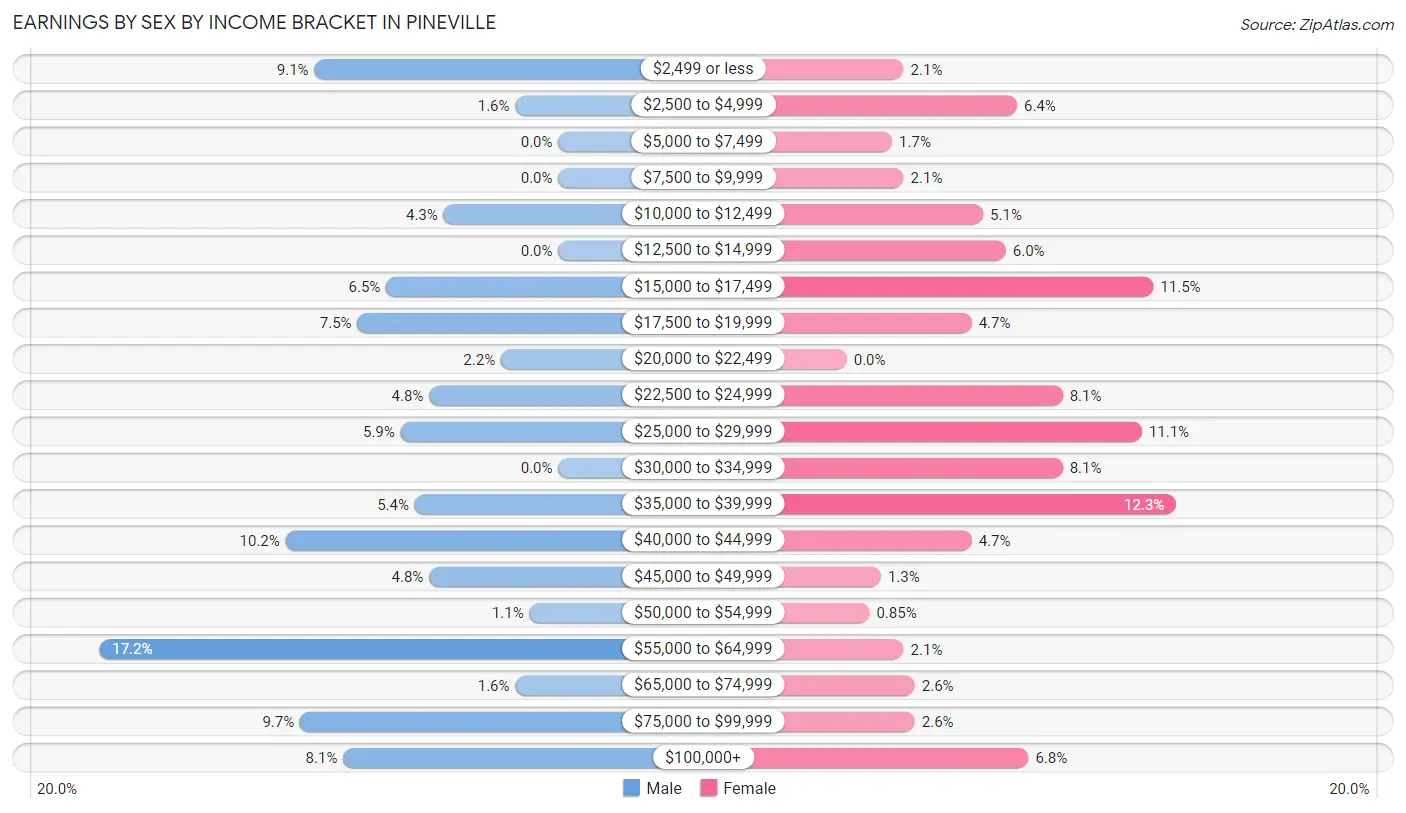
Earnings by Sex by Income Bracket in Pineville
The most common earnings brackets in Pineville are $55,000 to $64,999 for men (32 | 17.2%) and $35,000 to $39,999 for women (29 | 12.3%).
| Income | Male | Female |
| $2,499 or less | 17 (9.1%) | 5 (2.1%) |
| $2,500 to $4,999 | 3 (1.6%) | 15 (6.4%) |
| $5,000 to $7,499 | 0 (0.0%) | 4 (1.7%) |
| $7,500 to $9,999 | 0 (0.0%) | 5 (2.1%) |
| $10,000 to $12,499 | 8 (4.3%) | 12 (5.1%) |
| $12,500 to $14,999 | 0 (0.0%) | 14 (6.0%) |
| $15,000 to $17,499 | 12 (6.5%) | 27 (11.5%) |
| $17,500 to $19,999 | 14 (7.5%) | 11 (4.7%) |
| $20,000 to $22,499 | 4 (2.1%) | 0 (0.0%) |
| $22,500 to $24,999 | 9 (4.8%) | 19 (8.1%) |
| $25,000 to $29,999 | 11 (5.9%) | 26 (11.1%) |
| $30,000 to $34,999 | 0 (0.0%) | 19 (8.1%) |
| $35,000 to $39,999 | 10 (5.4%) | 29 (12.3%) |
| $40,000 to $44,999 | 19 (10.2%) | 11 (4.7%) |
| $45,000 to $49,999 | 9 (4.8%) | 3 (1.3%) |
| $50,000 to $54,999 | 2 (1.1%) | 2 (0.9%) |
| $55,000 to $64,999 | 32 (17.2%) | 5 (2.1%) |
| $65,000 to $74,999 | 3 (1.6%) | 6 (2.5%) |
| $75,000 to $99,999 | 18 (9.7%) | 6 (2.5%) |
| $100,000+ | 15 (8.1%) | 16 (6.8%) |
| Total | 186 (100.0%) | 235 (100.0%) |
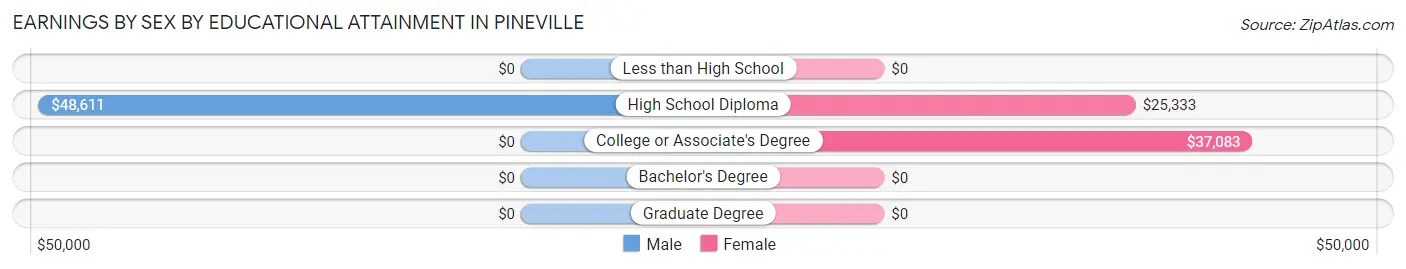
Earnings by Sex by Educational Attainment in Pineville
Average earnings in Pineville are $44,141 for men and $30,000 for women, a difference of 32.0%. Men with an educational attainment of high school diploma enjoy the highest average annual earnings of $48,611, while those with high school diploma education earn the least with $48,611. Women with an educational attainment of college or associate's degree earn the most with the average annual earnings of $37,083, while those with high school diploma education have the smallest earnings of $25,333.
| Educational Attainment | Male Income | Female Income |
| Less than High School | - | - |
| High School Diploma | $48,611 | $25,333 |
| College or Associate's Degree | - | - |
| Bachelor's Degree | - | - |
| Graduate Degree | - | - |
| Total | $44,141 | $30,000 |
Family Income in Pineville
Family Income Brackets in Pineville
According to the Pineville family income data, there are 43 families falling into the $15,000 to $24,999 income range, which is the most common income bracket and makes up 18.6% of all families. Conversely, the less than $10,000 income bracket is the least frequent group with only 2 families (0.9%) belonging to this category.
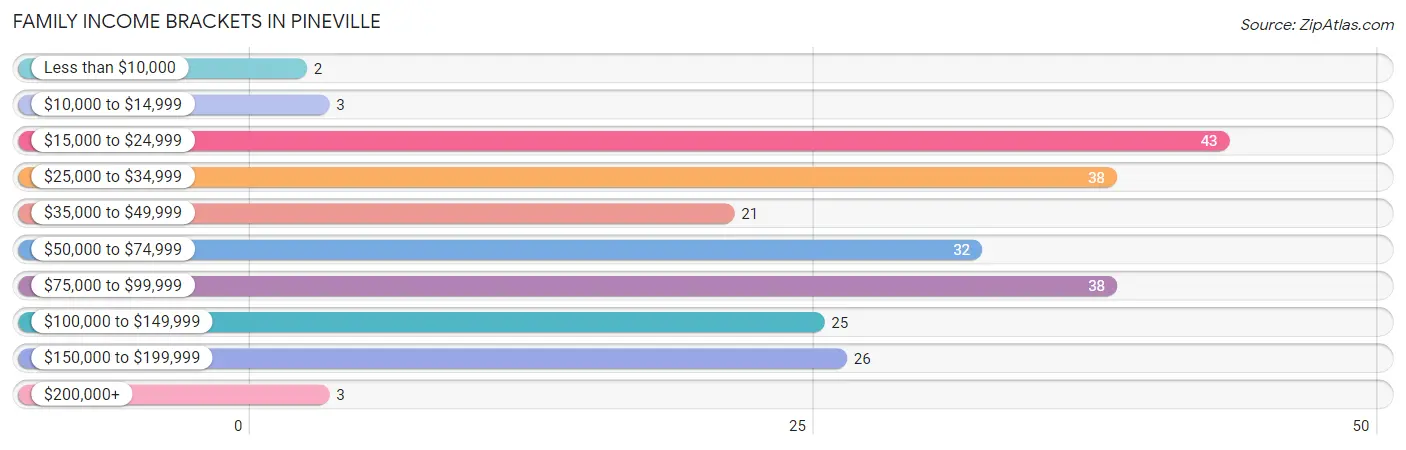
| Income Bracket | # Families | % Families |
| Less than $10,000 | 2 | 0.9% |
| $10,000 to $14,999 | 3 | 1.3% |
| $15,000 to $24,999 | 43 | 18.6% |
| $25,000 to $34,999 | 38 | 16.5% |
| $35,000 to $49,999 | 21 | 9.1% |
| $50,000 to $74,999 | 32 | 13.9% |
| $75,000 to $99,999 | 38 | 16.5% |
| $100,000 to $149,999 | 25 | 10.8% |
| $150,000 to $199,999 | 26 | 11.3% |
| $200,000+ | 3 | 1.3% |
Family Income by Famaliy Size in Pineville
6-person families (15 | 6.5%) account for the highest median family income in Pineville with $87,083 per family, while 2-person families (108 | 46.8%) have the highest median income of $19,464 per family member.
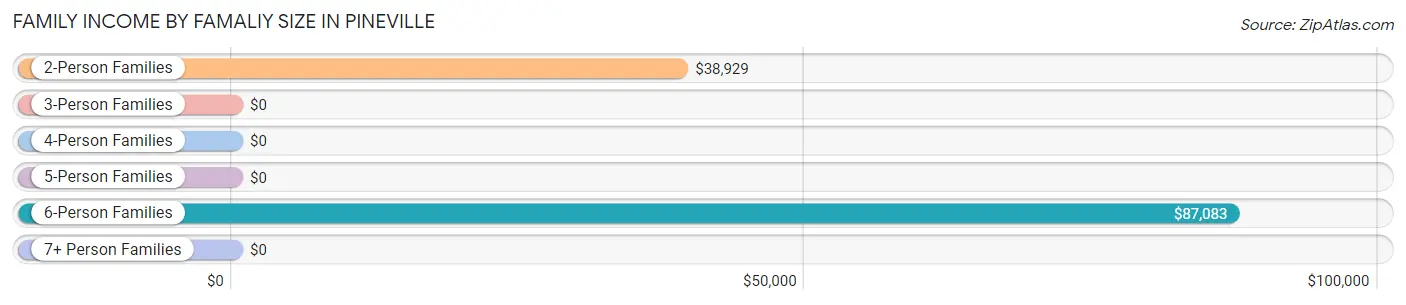
| Income Bracket | # Families | Median Income |
| 2-Person Families | 108 (46.8%) | $38,929 |
| 3-Person Families | 49 (21.2%) | $0 |
| 4-Person Families | 53 (22.9%) | $0 |
| 5-Person Families | 6 (2.6%) | $0 |
| 6-Person Families | 15 (6.5%) | $87,083 |
| 7+ Person Families | 0 (0.0%) | $0 |
| Total | 231 (100.0%) | $61,406 |
Family Income by Number of Earners in Pineville
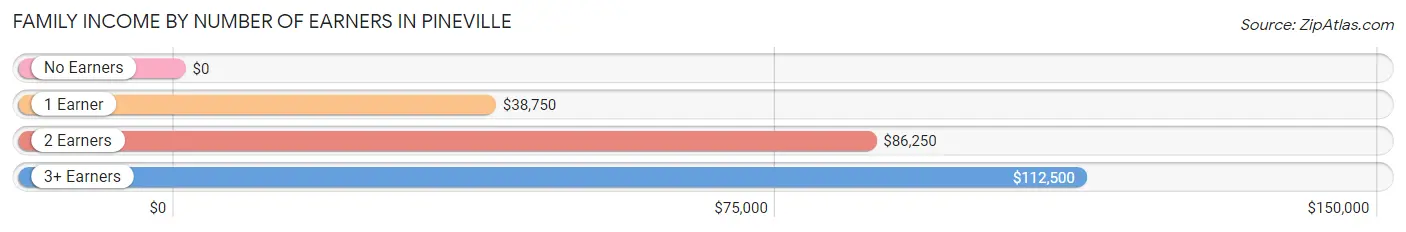
| Number of Earners | # Families | Median Income |
| No Earners | 53 (22.9%) | $0 |
| 1 Earner | 45 (19.5%) | $38,750 |
| 2 Earners | 105 (45.5%) | $86,250 |
| 3+ Earners | 28 (12.1%) | $112,500 |
| Total | 231 (100.0%) | $61,406 |
Household Income in Pineville
Household Income Brackets in Pineville
With 75 households falling in the category, the $15,000 to $24,999 income range is the most frequent in Pineville, accounting for 20.9% of all households. In contrast, only 3 households (0.8%) fall into the $200,000+ income bracket, making it the least populous group.
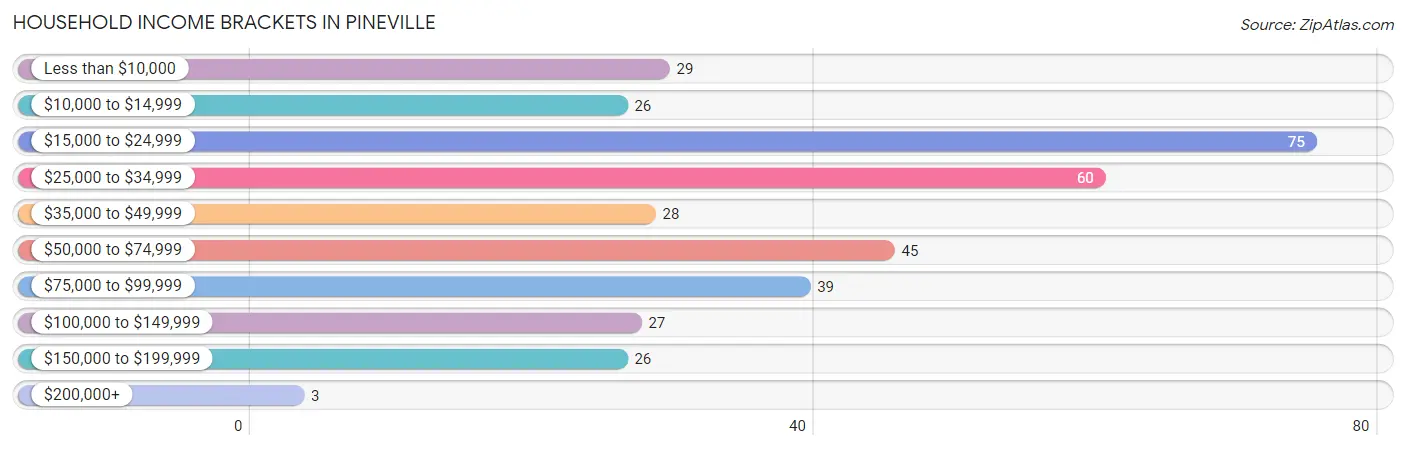
| Income Bracket | # Households | % Households |
| Less than $10,000 | 29 | 8.1% |
| $10,000 to $14,999 | 26 | 7.3% |
| $15,000 to $24,999 | 75 | 20.9% |
| $25,000 to $34,999 | 60 | 16.8% |
| $35,000 to $49,999 | 28 | 7.8% |
| $50,000 to $74,999 | 45 | 12.6% |
| $75,000 to $99,999 | 39 | 10.9% |
| $100,000 to $149,999 | 27 | 7.5% |
| $150,000 to $199,999 | 26 | 7.3% |
| $200,000+ | 3 | 0.8% |
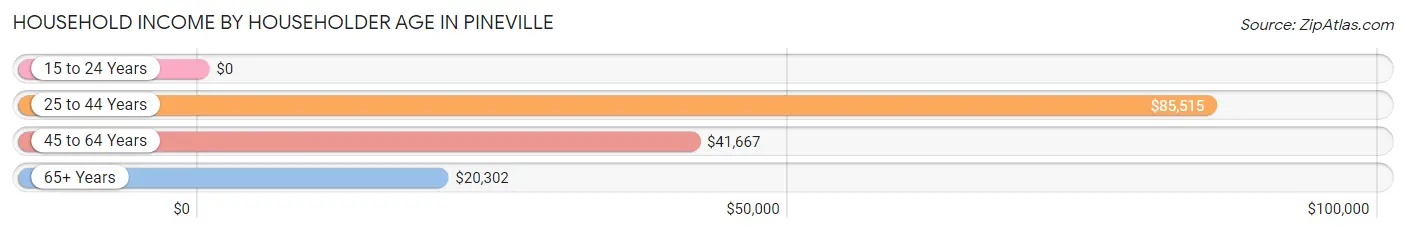
Household Income by Householder Age in Pineville
The median household income in Pineville is $34,018, with the highest median household income of $85,515 found in the 25 to 44 years age bracket for the primary householder. A total of 87 households (24.3%) fall into this category.
| Income Bracket | # Households | Median Income |
| 15 to 24 Years | 0 (0.0%) | $0 |
| 25 to 44 Years | 87 (24.3%) | $85,515 |
| 45 to 64 Years | 138 (38.6%) | $41,667 |
| 65+ Years | 133 (37.1%) | $20,302 |
| Total | 358 (100.0%) | $34,018 |
Poverty in Pineville
Income Below Poverty by Sex and Age in Pineville
With 16.9% poverty level for males and 11.1% for females among the residents of Pineville, 16 and 17 year old males and 65 to 74 year old females are the most vulnerable to poverty, with 11 males (73.3%) and 22 females (27.9%) in their respective age groups living below the poverty level.
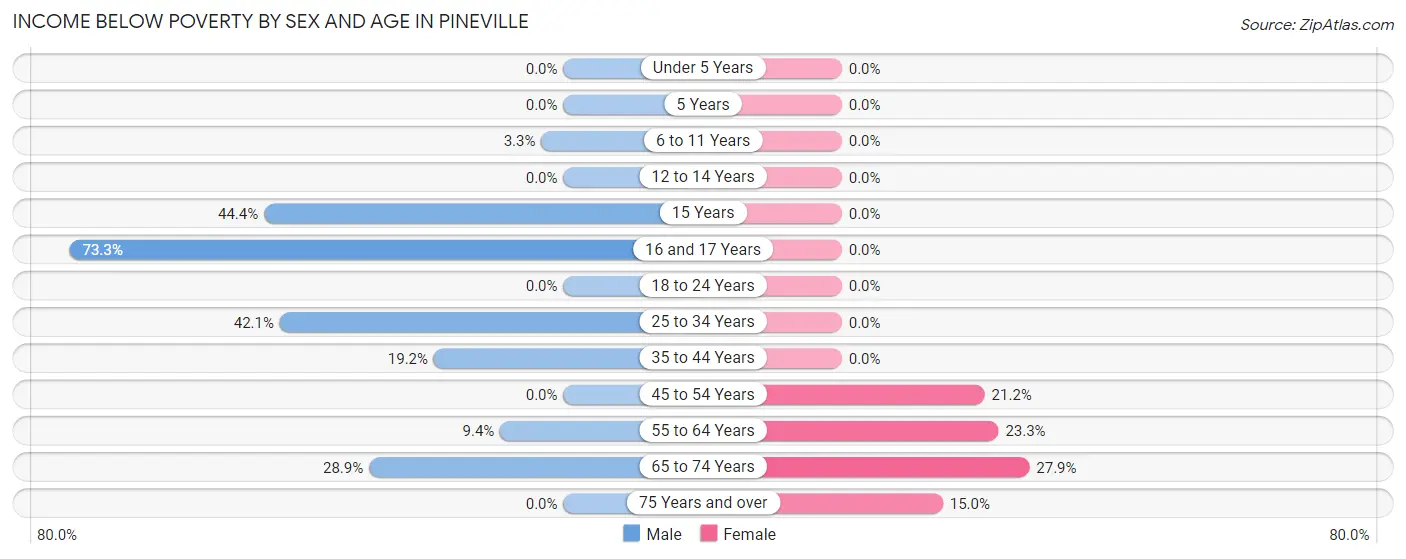
| Age Bracket | Male | Female |
| Under 5 Years | 0 (0.0%) | 0 (0.0%) |
| 5 Years | 0 (0.0%) | 0 (0.0%) |
| 6 to 11 Years | 2 (3.3%) | 0 (0.0%) |
| 12 to 14 Years | 0 (0.0%) | 0 (0.0%) |
| 15 Years | 12 (44.4%) | 0 (0.0%) |
| 16 and 17 Years | 11 (73.3%) | 0 (0.0%) |
| 18 to 24 Years | 0 (0.0%) | 0 (0.0%) |
| 25 to 34 Years | 16 (42.1%) | 0 (0.0%) |
| 35 to 44 Years | 10 (19.2%) | 0 (0.0%) |
| 45 to 54 Years | 0 (0.0%) | 14 (21.2%) |
| 55 to 64 Years | 6 (9.4%) | 10 (23.3%) |
| 65 to 74 Years | 15 (28.8%) | 22 (27.9%) |
| 75 Years and over | 0 (0.0%) | 3 (15.0%) |
| Total | 72 (16.9%) | 49 (11.1%) |
Income Above Poverty by Sex and Age in Pineville
According to the poverty statistics in Pineville, males aged under 5 years and females aged under 5 years are the age groups that are most secure financially, with 100.0% of males and 100.0% of females in these age groups living above the poverty line.
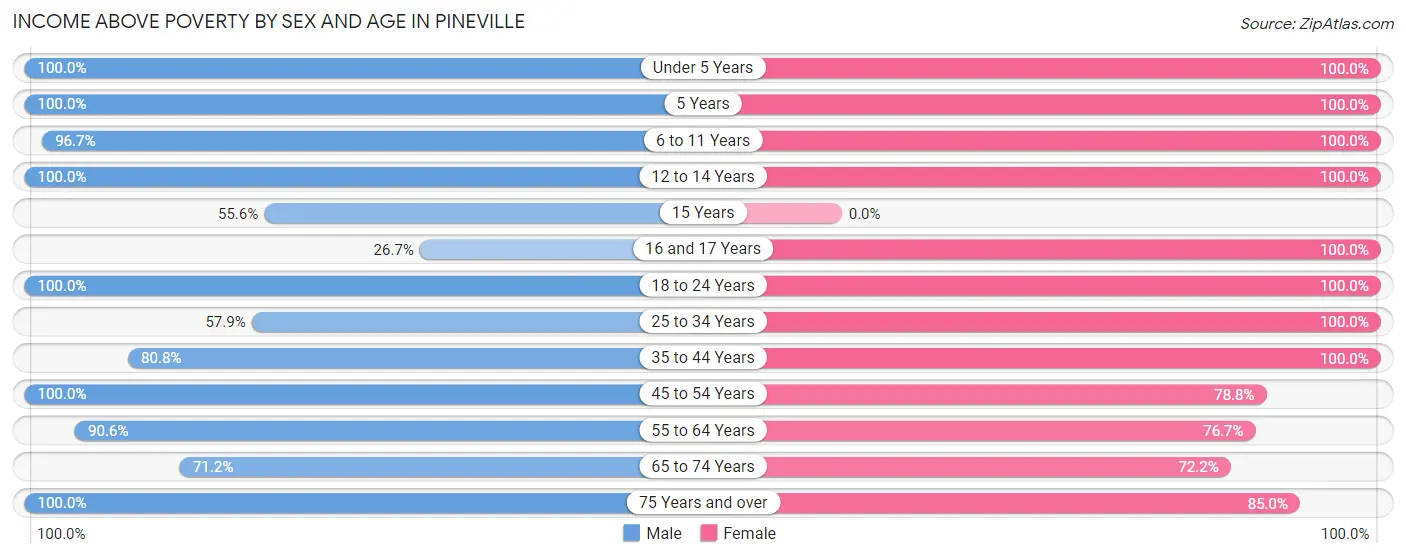
| Age Bracket | Male | Female |
| Under 5 Years | 2 (100.0%) | 30 (100.0%) |
| 5 Years | 4 (100.0%) | 9 (100.0%) |
| 6 to 11 Years | 59 (96.7%) | 12 (100.0%) |
| 12 to 14 Years | 16 (100.0%) | 25 (100.0%) |
| 15 Years | 15 (55.6%) | 0 (0.0%) |
| 16 and 17 Years | 4 (26.7%) | 3 (100.0%) |
| 18 to 24 Years | 8 (100.0%) | 51 (100.0%) |
| 25 to 34 Years | 22 (57.9%) | 51 (100.0%) |
| 35 to 44 Years | 42 (80.8%) | 53 (100.0%) |
| 45 to 54 Years | 66 (100.0%) | 52 (78.8%) |
| 55 to 64 Years | 58 (90.6%) | 33 (76.7%) |
| 65 to 74 Years | 37 (71.2%) | 57 (72.2%) |
| 75 Years and over | 21 (100.0%) | 17 (85.0%) |
| Total | 354 (83.1%) | 393 (88.9%) |
Income Below Poverty Among Married-Couple Families in Pineville
The poverty statistics for married-couple families in Pineville show that 1.6% or 3 of the total 185 families live below the poverty line. Families with no children have the highest poverty rate of 2.9%, comprising of 3 families. On the other hand, families with 1 or 2 children have the lowest poverty rate of 0.0%, which includes 0 families.
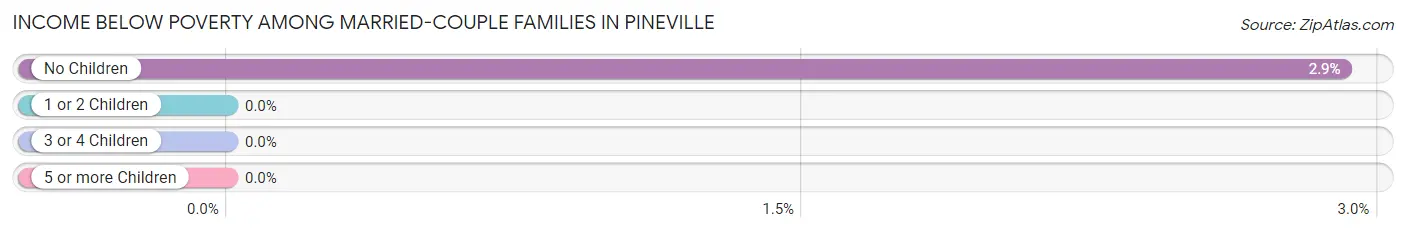
| Children | Above Poverty | Below Poverty |
| No Children | 100 (97.1%) | 3 (2.9%) |
| 1 or 2 Children | 68 (100.0%) | 0 (0.0%) |
| 3 or 4 Children | 14 (100.0%) | 0 (0.0%) |
| 5 or more Children | 0 (0.0%) | 0 (0.0%) |
| Total | 182 (98.4%) | 3 (1.6%) |
Income Below Poverty Among Single-Parent Households in Pineville
According to the poverty data in Pineville, 42.1% or 8 single-father households and 22.2% or 6 single-mother households are living below the poverty line. Among single-father households, those with 3 or 4 children have the highest poverty rate, with 6 households (100.0%) experiencing poverty. Likewise, among single-mother households, those with no children have the highest poverty rate, with 6 households (37.5%) falling below the poverty line.
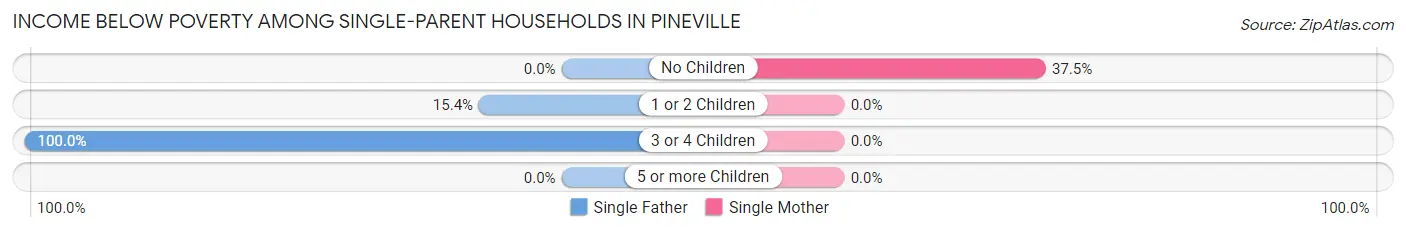
| Children | Single Father | Single Mother |
| No Children | 0 (0.0%) | 6 (37.5%) |
| 1 or 2 Children | 2 (15.4%) | 0 (0.0%) |
| 3 or 4 Children | 6 (100.0%) | 0 (0.0%) |
| 5 or more Children | 0 (0.0%) | 0 (0.0%) |
| Total | 8 (42.1%) | 6 (22.2%) |
Income Below Poverty Among Married-Couple vs Single-Parent Households in Pineville
The poverty data for Pineville shows that 3 of the married-couple family households (1.6%) and 14 of the single-parent households (30.4%) are living below the poverty level. Within the married-couple family households, those with no children have the highest poverty rate, with 3 households (2.9%) falling below the poverty line. Among the single-parent households, those with 3 or 4 children have the highest poverty rate, with 6 household (66.7%) living below poverty.
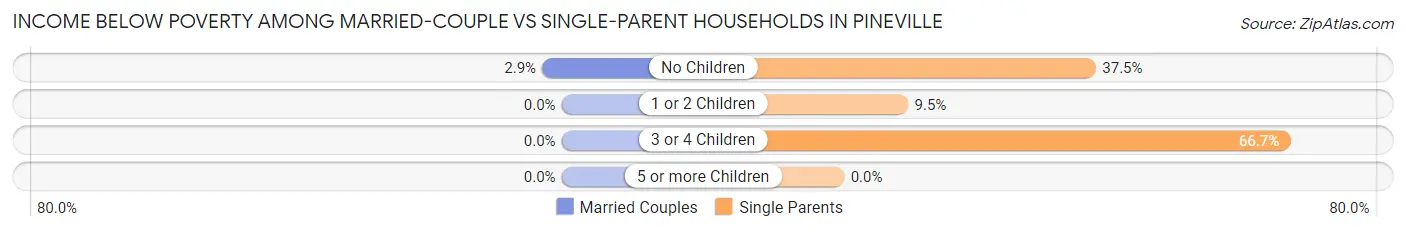
| Children | Married-Couple Families | Single-Parent Households |
| No Children | 3 (2.9%) | 6 (37.5%) |
| 1 or 2 Children | 0 (0.0%) | 2 (9.5%) |
| 3 or 4 Children | 0 (0.0%) | 6 (66.7%) |
| 5 or more Children | 0 (0.0%) | 0 (0.0%) |
| Total | 3 (1.6%) | 14 (30.4%) |
Race in Pineville
The most populous races in Pineville are White / Caucasian (825 | 92.2%), Two or more Races (34 | 3.8%), and Black / African American (15 | 1.7%).
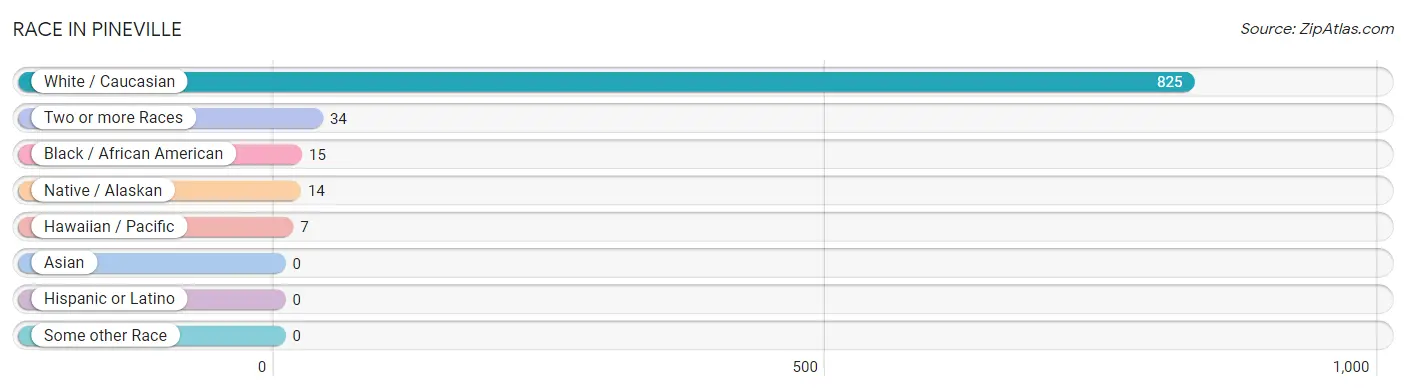
| Race | # Population | % Population |
| Asian | 0 | 0.0% |
| Black / African American | 15 | 1.7% |
| Hawaiian / Pacific | 7 | 0.8% |
| Hispanic or Latino | 0 | 0.0% |
| Native / Alaskan | 14 | 1.6% |
| White / Caucasian | 825 | 92.2% |
| Two or more Races | 34 | 3.8% |
| Some other Race | 0 | 0.0% |
| Total | 895 | 100.0% |
Ancestry in Pineville
The most populous ancestries reported in Pineville are German (166 | 18.5%), Irish (109 | 12.2%), American (104 | 11.6%), English (37 | 4.1%), and British (31 | 3.5%), together accounting for 49.9% of all Pineville residents.
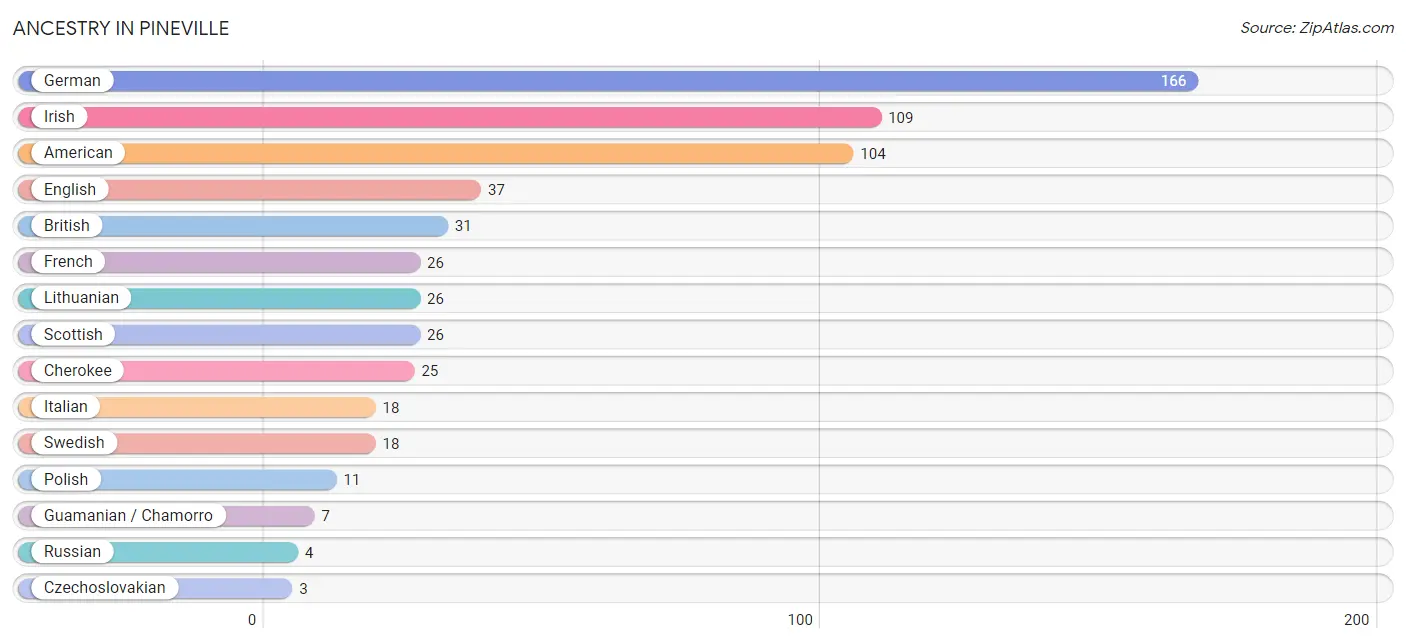
| Ancestry | # Population | % Population |
| American | 104 | 11.6% |
| Austrian | 2 | 0.2% |
| Belgian | 2 | 0.2% |
| British | 31 | 3.5% |
| Cherokee | 25 | 2.8% |
| Czechoslovakian | 3 | 0.3% |
| Eastern European | 3 | 0.3% |
| English | 37 | 4.1% |
| French | 26 | 2.9% |
| German | 166 | 18.5% |
| Guamanian / Chamorro | 7 | 0.8% |
| Irish | 109 | 12.2% |
| Italian | 18 | 2.0% |
| Lithuanian | 26 | 2.9% |
| Norwegian | 1 | 0.1% |
| Polish | 11 | 1.2% |
| Russian | 4 | 0.4% |
| Scottish | 26 | 2.9% |
| Swedish | 18 | 2.0% |
| Welsh | 3 | 0.3% | View All 20 Rows |
Immigrants in Pineville
The most numerous immigrant groups reported in Pineville came from , and Canada (2 | 0.2%), together accounting for 0.2% of all Pineville residents.

| Immigration Origin | # Population | % Population |
| Canada | 2 | 0.2% | View All 1 Rows |
Sex and Age in Pineville
Sex and Age in Pineville
The most populous age groups in Pineville are 5 to 9 Years (52 | 11.5%) for men and 70 to 74 Years (52 | 11.8%) for women.
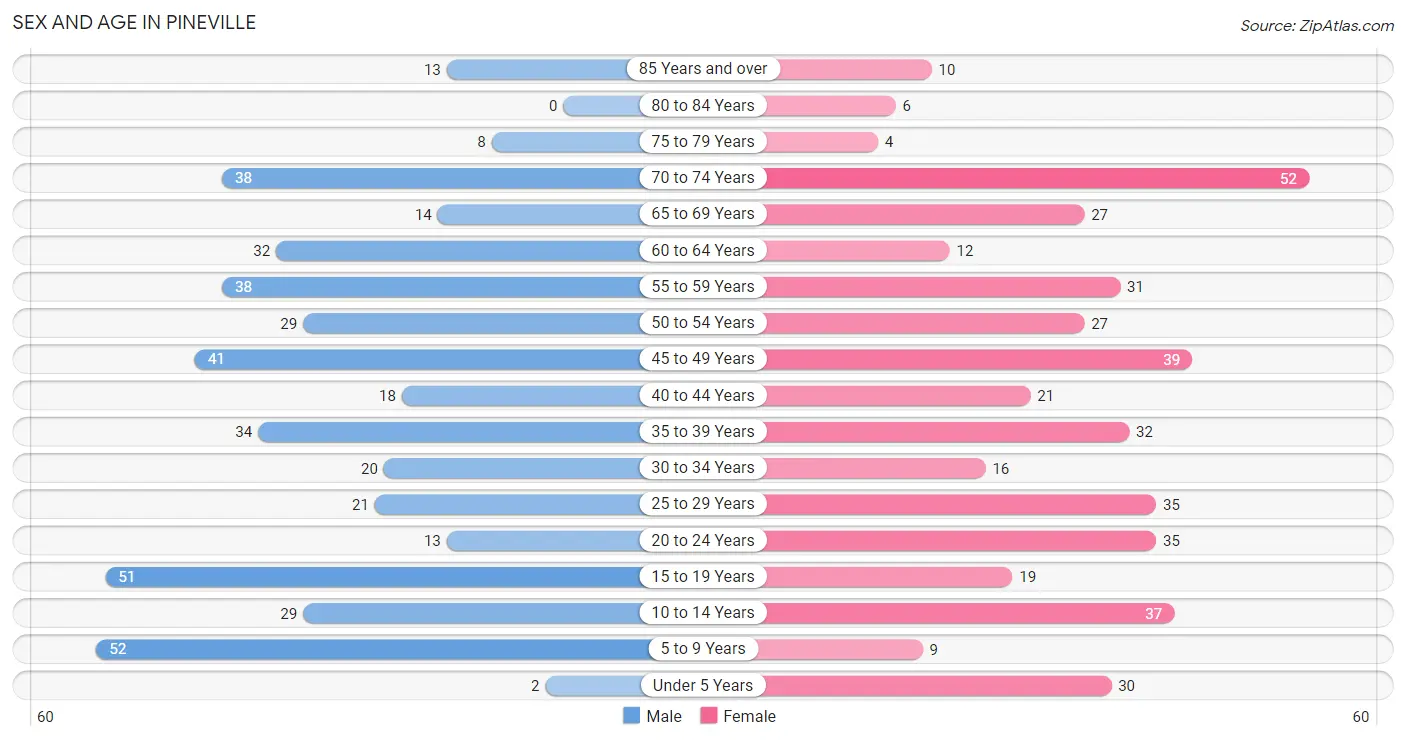
| Age Bracket | Male | Female |
| Under 5 Years | 2 (0.4%) | 30 (6.8%) |
| 5 to 9 Years | 52 (11.5%) | 9 (2.0%) |
| 10 to 14 Years | 29 (6.4%) | 37 (8.4%) |
| 15 to 19 Years | 51 (11.3%) | 19 (4.3%) |
| 20 to 24 Years | 13 (2.9%) | 35 (7.9%) |
| 25 to 29 Years | 21 (4.6%) | 35 (7.9%) |
| 30 to 34 Years | 20 (4.4%) | 16 (3.6%) |
| 35 to 39 Years | 34 (7.5%) | 32 (7.2%) |
| 40 to 44 Years | 18 (4.0%) | 21 (4.8%) |
| 45 to 49 Years | 41 (9.0%) | 39 (8.8%) |
| 50 to 54 Years | 29 (6.4%) | 27 (6.1%) |
| 55 to 59 Years | 38 (8.4%) | 31 (7.0%) |
| 60 to 64 Years | 32 (7.1%) | 12 (2.7%) |
| 65 to 69 Years | 14 (3.1%) | 27 (6.1%) |
| 70 to 74 Years | 38 (8.4%) | 52 (11.8%) |
| 75 to 79 Years | 8 (1.8%) | 4 (0.9%) |
| 80 to 84 Years | 0 (0.0%) | 6 (1.4%) |
| 85 Years and over | 13 (2.9%) | 10 (2.3%) |
| Total | 453 (100.0%) | 442 (100.0%) |
Families and Households in Pineville
Median Family Size in Pineville
The median family size in Pineville is 3.04 persons per family, with single female/mother families (27 | 11.7%) accounting for the largest median family size of 3.3 persons per family. On the other hand, married-couple families (185 | 80.1%) represent the smallest median family size with 3.00 persons per family.
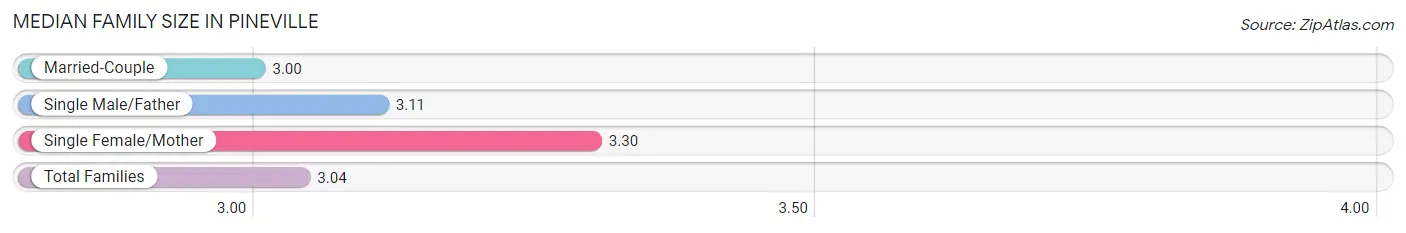
| Family Type | # Families | Family Size |
| Married-Couple | 185 (80.1%) | 3.00 |
| Single Male/Father | 19 (8.2%) | 3.11 |
| Single Female/Mother | 27 (11.7%) | 3.30 |
| Total Families | 231 (100.0%) | 3.04 |
Median Household Size in Pineville
The median household size in Pineville is 2.42 persons per household, with single male/father households (19 | 5.3%) accounting for the largest median household size of 3.37 persons per household. non-family households (127 | 35.5%) represent the smallest median household size with 1.24 persons per household.
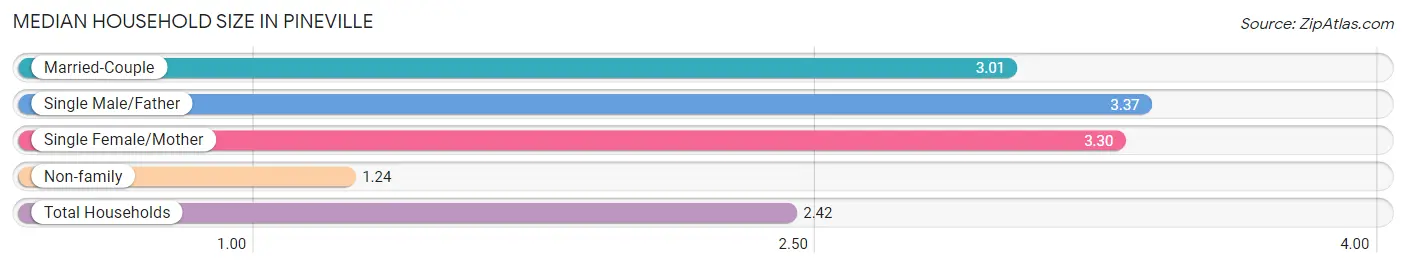
| Household Type | # Households | Household Size |
| Married-Couple | 185 (51.7%) | 3.01 |
| Single Male/Father | 19 (5.3%) | 3.37 |
| Single Female/Mother | 27 (7.5%) | 3.30 |
| Non-family | 127 (35.5%) | 1.24 |
| Total Households | 358 (100.0%) | 2.42 |
Household Size by Marriage Status in Pineville
Out of a total of 358 households in Pineville, 231 (64.5%) are family households, while 127 (35.5%) are nonfamily households. The most numerous type of family households are 2-person households, comprising 108, and the most common type of nonfamily households are 1-person households, comprising 102.
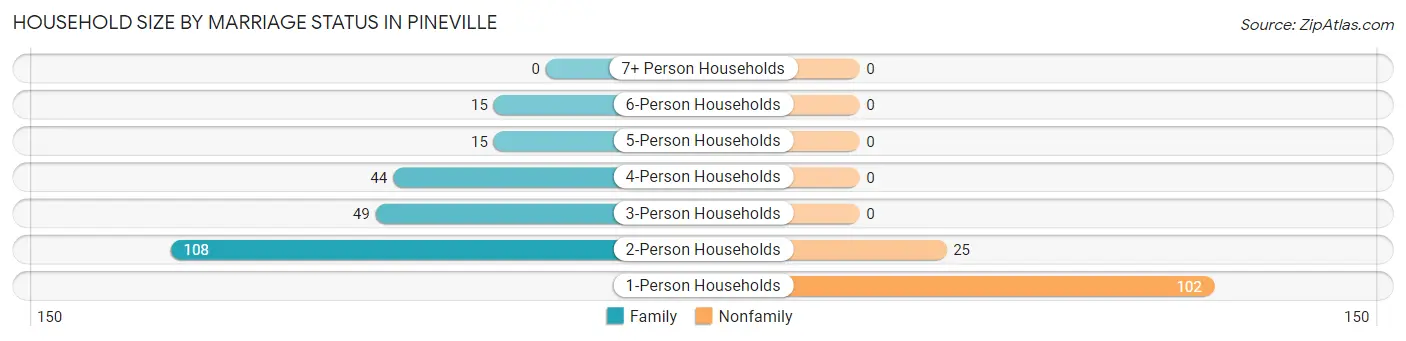
| Household Size | Family Households | Nonfamily Households |
| 1-Person Households | - | 102 (28.5%) |
| 2-Person Households | 108 (30.2%) | 25 (7.0%) |
| 3-Person Households | 49 (13.7%) | 0 (0.0%) |
| 4-Person Households | 44 (12.3%) | 0 (0.0%) |
| 5-Person Households | 15 (4.2%) | 0 (0.0%) |
| 6-Person Households | 15 (4.2%) | 0 (0.0%) |
| 7+ Person Households | 0 (0.0%) | 0 (0.0%) |
| Total | 231 (64.5%) | 127 (35.5%) |
Female Fertility in Pineville
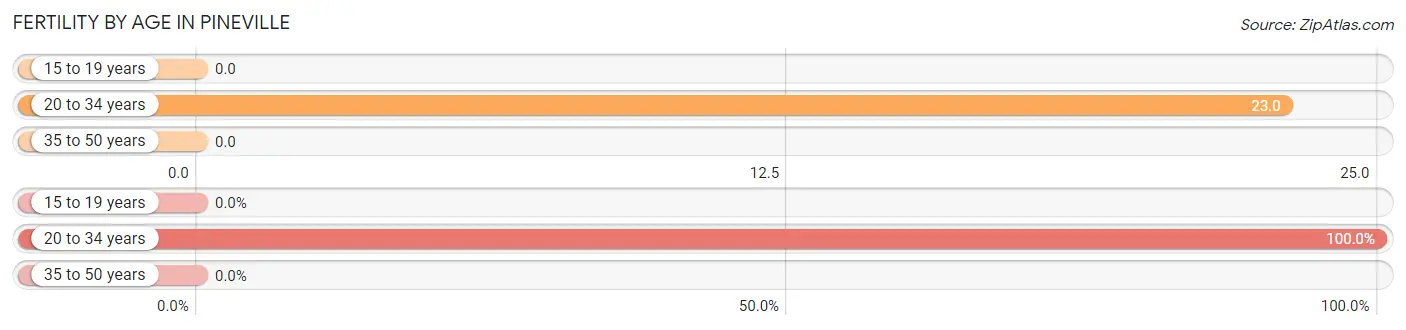
Fertility by Age in Pineville
Average fertility rate in Pineville is 10.0 births per 1,000 women. Women in the age bracket of 20 to 34 years have the highest fertility rate with 23.0 births per 1,000 women. Women in the age bracket of 20 to 34 years acount for 100.0% of all women with births.
| Age Bracket | Women with Births | Births / 1,000 Women |
| 15 to 19 years | 0 (0.0%) | 0.0 |
| 20 to 34 years | 2 (100.0%) | 23.0 |
| 35 to 50 years | 0 (0.0%) | 0.0 |
| Total | 2 (100.0%) | 10.0 |
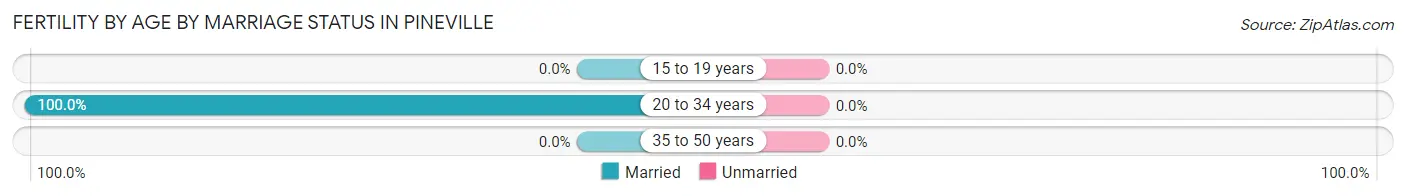
Fertility by Age by Marriage Status in Pineville
| Age Bracket | Married | Unmarried |
| 15 to 19 years | 0 (0.0%) | 0 (0.0%) |
| 20 to 34 years | 2 (100.0%) | 0 (0.0%) |
| 35 to 50 years | 0 (0.0%) | 0 (0.0%) |
| Total | 2 (100.0%) | 0 (0.0%) |
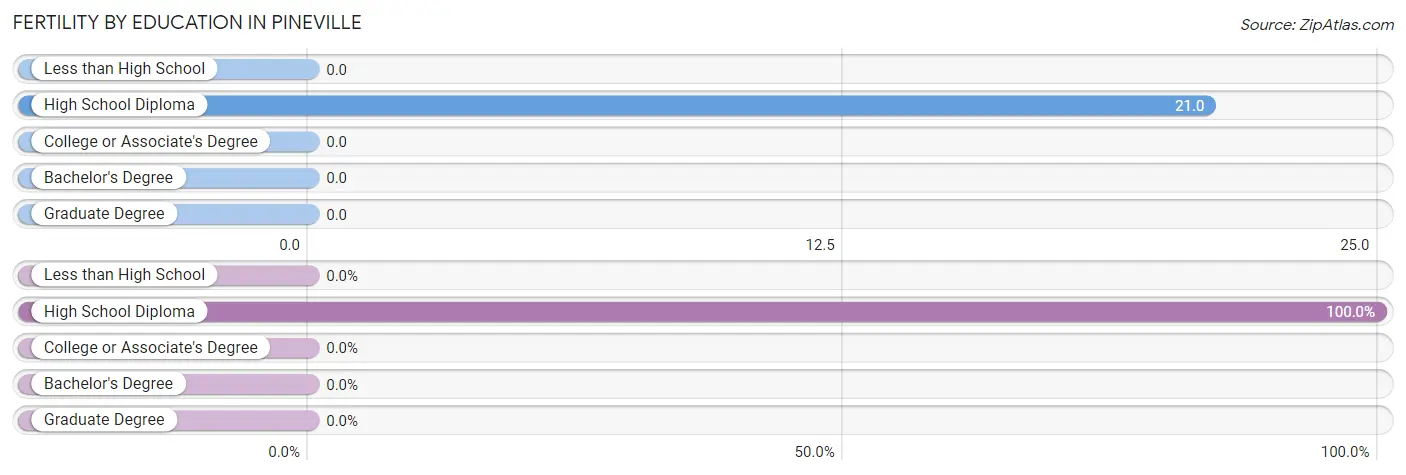
Fertility by Education in Pineville
| Educational Attainment | Women with Births | Births / 1,000 Women |
| Less than High School | 0 (0.0%) | 0.0 |
| High School Diploma | 2 (100.0%) | 21.0 |
| College or Associate's Degree | 0 (0.0%) | 0.0 |
| Bachelor's Degree | 0 (0.0%) | 0.0 |
| Graduate Degree | 0 (0.0%) | 0.0 |
| Total | 2 (100.0%) | 10.0 |
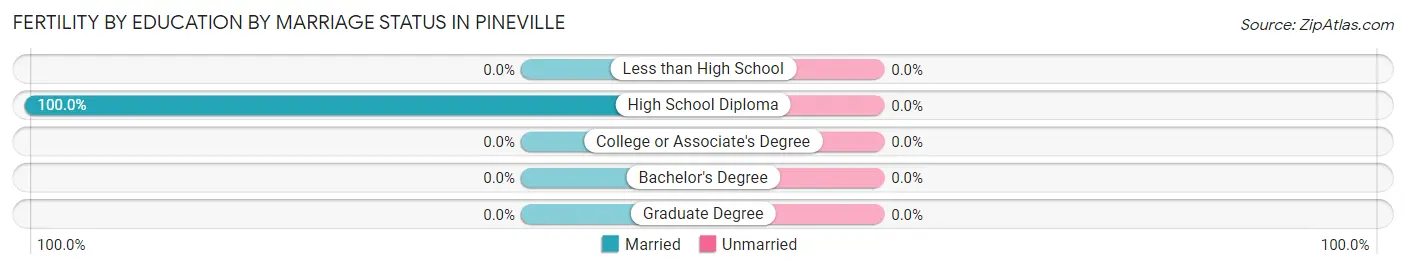
Fertility by Education by Marriage Status in Pineville
| Educational Attainment | Married | Unmarried |
| Less than High School | 0 (0.0%) | 0 (0.0%) |
| High School Diploma | 2 (100.0%) | 0 (0.0%) |
| College or Associate's Degree | 0 (0.0%) | 0 (0.0%) |
| Bachelor's Degree | 0 (0.0%) | 0 (0.0%) |
| Graduate Degree | 0 (0.0%) | 0 (0.0%) |
| Total | 2 (100.0%) | 0 (0.0%) |
Employment Characteristics in Pineville
Employment by Class of Employer in Pineville
Among the 371 employed individuals in Pineville, private company employees (228 | 61.5%), self-employed (not incorporated) (51 | 13.8%), and local government employees (37 | 10.0%) make up the most common classes of employment.
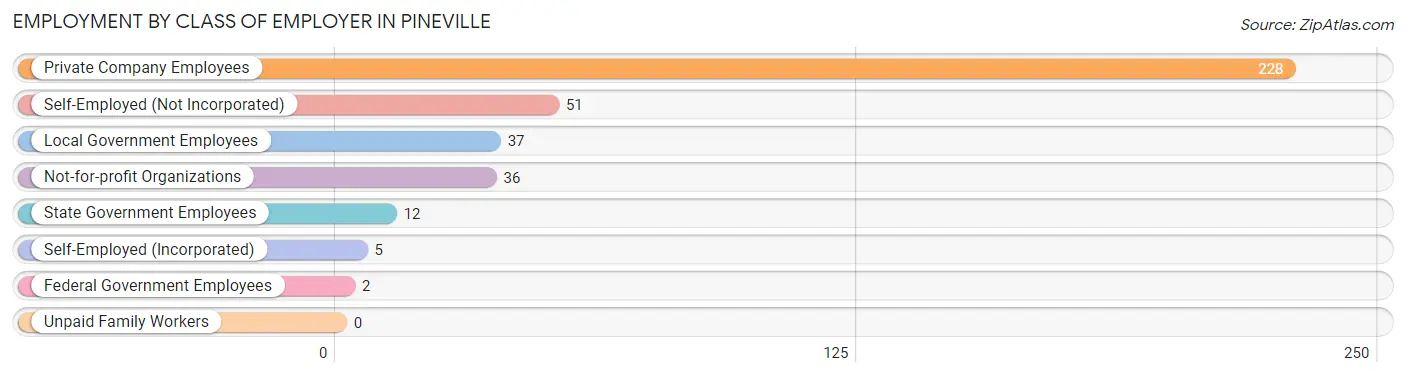
| Employer Class | # Employees | % Employees |
| Private Company Employees | 228 | 61.5% |
| Self-Employed (Incorporated) | 5 | 1.3% |
| Self-Employed (Not Incorporated) | 51 | 13.8% |
| Not-for-profit Organizations | 36 | 9.7% |
| Local Government Employees | 37 | 10.0% |
| State Government Employees | 12 | 3.2% |
| Federal Government Employees | 2 | 0.5% |
| Unpaid Family Workers | 0 | 0.0% |
| Total | 371 | 100.0% |
Employment Status by Age in Pineville
According to the labor force statistics for Pineville, out of the total population over 16 years of age (709), 56.3% or 399 individuals are in the labor force, with 6.0% or 24 of them unemployed. The age group with the highest labor force participation rate is 25 to 29 years, with 96.4% or 54 individuals in the labor force. Within the labor force, the 30 to 34 years age range has the highest percentage of unemployed individuals, with 45.2% or 14 of them being unemployed.
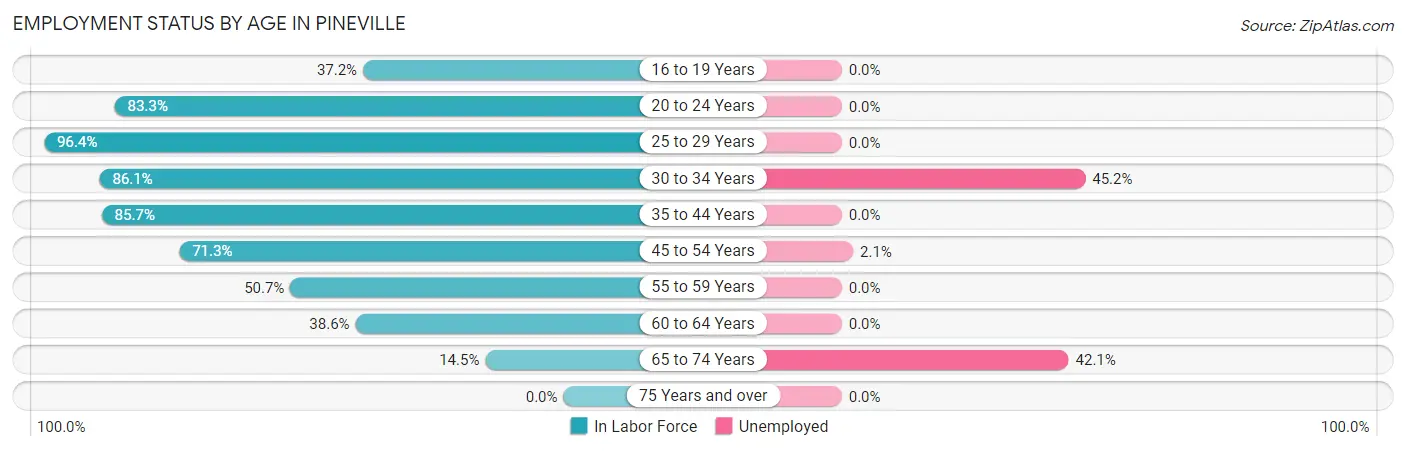
| Age Bracket | In Labor Force | Unemployed |
| 16 to 19 Years | 16 (37.2%) | 0 (0.0%) |
| 20 to 24 Years | 40 (83.3%) | 0 (0.0%) |
| 25 to 29 Years | 54 (96.4%) | 0 (0.0%) |
| 30 to 34 Years | 31 (86.1%) | 14 (45.2%) |
| 35 to 44 Years | 90 (85.7%) | 0 (0.0%) |
| 45 to 54 Years | 97 (71.3%) | 2 (2.1%) |
| 55 to 59 Years | 35 (50.7%) | 0 (0.0%) |
| 60 to 64 Years | 17 (38.6%) | 0 (0.0%) |
| 65 to 74 Years | 19 (14.5%) | 8 (42.1%) |
| 75 Years and over | 0 (0.0%) | 0 (0.0%) |
| Total | 399 (56.3%) | 24 (6.0%) |
Employment Status by Educational Attainment in Pineville
According to labor force statistics for Pineville, 72.6% of individuals (324) out of the total population between 25 and 64 years of age (446) are in the labor force, with 4.9% or 16 of them being unemployed. The group with the highest labor force participation rate are those with the educational attainment of bachelor's degree or higher, with 88.5% or 46 individuals in the labor force. Within the labor force, individuals with high school diploma education have the highest percentage of unemployment, with 8.6% or 16 of them being unemployed.
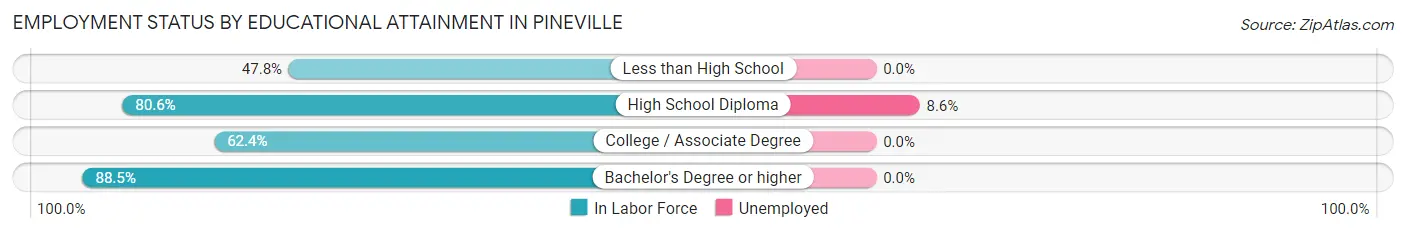
| Educational Attainment | In Labor Force | Unemployed |
| Less than High School | 33 (47.8%) | 0 (0.0%) |
| High School Diploma | 187 (80.6%) | 20 (8.6%) |
| College / Associate Degree | 58 (62.4%) | 0 (0.0%) |
| Bachelor's Degree or higher | 46 (88.5%) | 0 (0.0%) |
| Total | 324 (72.6%) | 22 (4.9%) |
Employment Occupations by Sex in Pineville
Management, Business, Science and Arts Occupations
The most common Management, Business, Science and Arts occupations in Pineville are Management (47 | 12.5%), Community & Social Service (22 | 5.9%), Education Instruction & Library (22 | 5.9%), Computers, Engineering & Science (13 | 3.5%), and Health Diagnosing & Treating (8 | 2.1%).
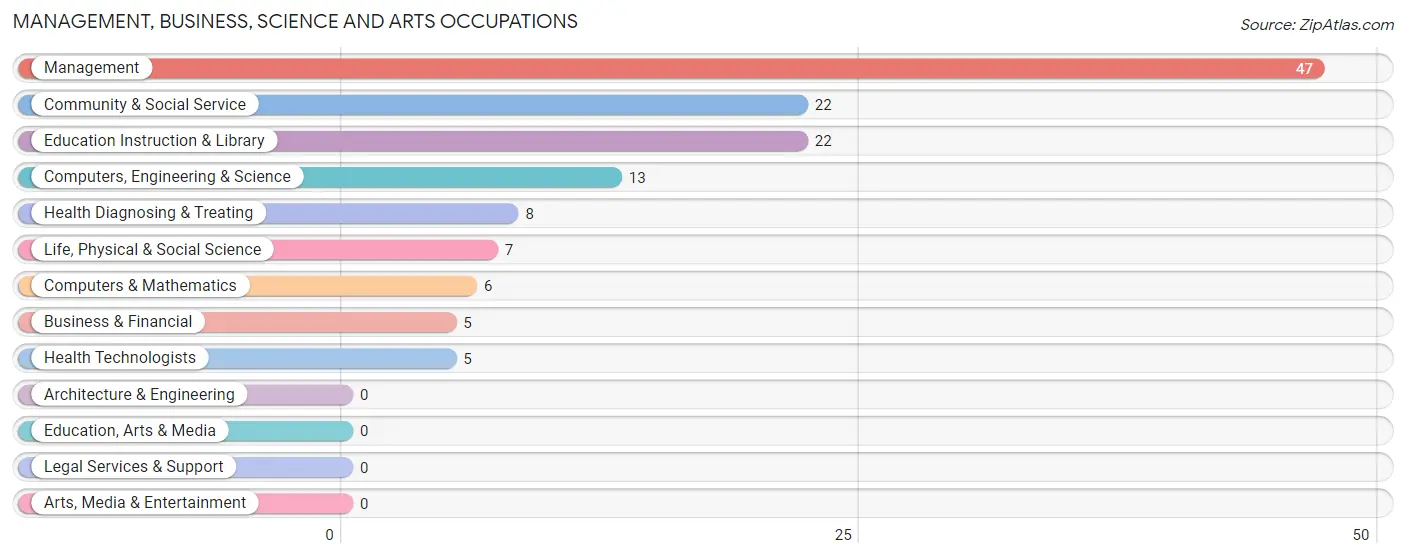
Management, Business, Science and Arts Occupations by Sex
Within the Management, Business, Science and Arts occupations in Pineville, the most male-oriented occupations are Life, Physical & Social Science (100.0%), Management (85.1%), and Computers, Engineering & Science (53.8%), while the most female-oriented occupations are Business & Financial (100.0%), Computers & Mathematics (100.0%), and Community & Social Service (100.0%).
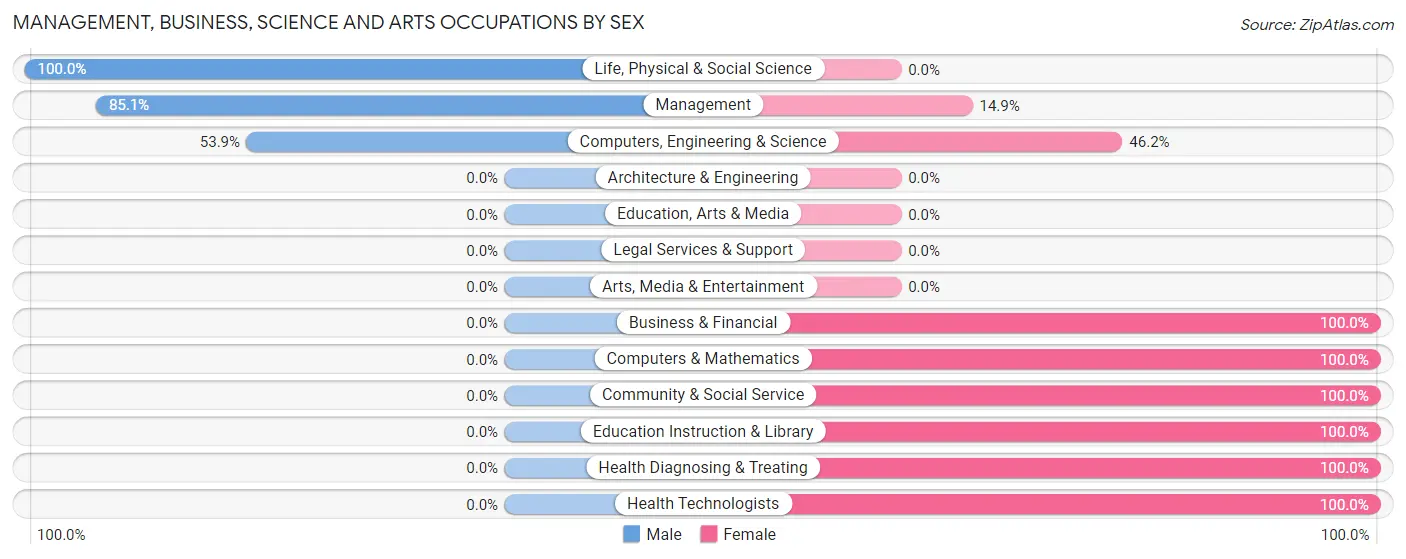
| Occupation | Male | Female |
| Management | 40 (85.1%) | 7 (14.9%) |
| Business & Financial | 0 (0.0%) | 5 (100.0%) |
| Computers, Engineering & Science | 7 (53.8%) | 6 (46.2%) |
| Computers & Mathematics | 0 (0.0%) | 6 (100.0%) |
| Architecture & Engineering | 0 (0.0%) | 0 (0.0%) |
| Life, Physical & Social Science | 7 (100.0%) | 0 (0.0%) |
| Community & Social Service | 0 (0.0%) | 22 (100.0%) |
| Education, Arts & Media | 0 (0.0%) | 0 (0.0%) |
| Legal Services & Support | 0 (0.0%) | 0 (0.0%) |
| Education Instruction & Library | 0 (0.0%) | 22 (100.0%) |
| Arts, Media & Entertainment | 0 (0.0%) | 0 (0.0%) |
| Health Diagnosing & Treating | 0 (0.0%) | 8 (100.0%) |
| Health Technologists | 0 (0.0%) | 5 (100.0%) |
| Total (Category) | 47 (49.5%) | 48 (50.5%) |
| Total (Overall) | 151 (40.3%) | 224 (59.7%) |
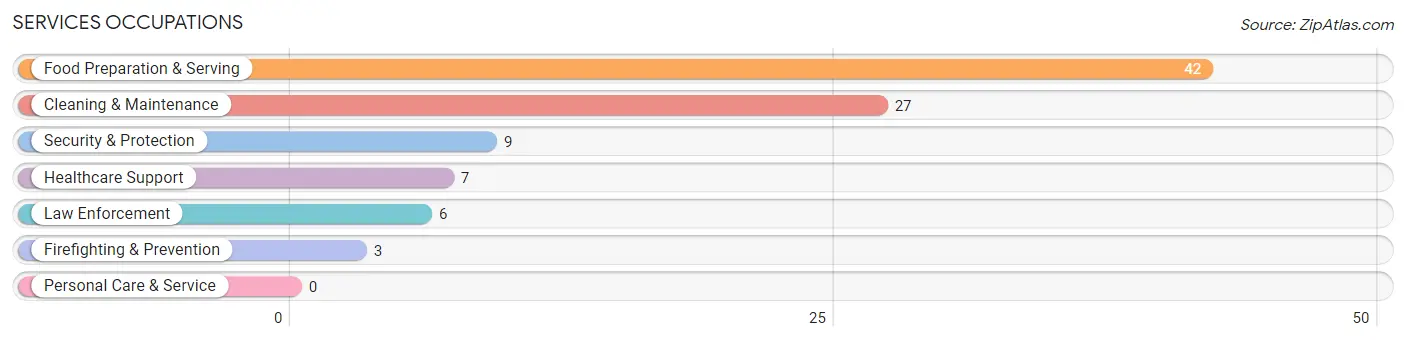
Services Occupations
The most common Services occupations in Pineville are Food Preparation & Serving (42 | 11.2%), Cleaning & Maintenance (27 | 7.2%), Security & Protection (9 | 2.4%), Healthcare Support (7 | 1.9%), and Law Enforcement (6 | 1.6%).
Services Occupations by Sex
Within the Services occupations in Pineville, the most male-oriented occupations are Firefighting & Prevention (100.0%), Cleaning & Maintenance (77.8%), and Security & Protection (66.7%), while the most female-oriented occupations are Healthcare Support (100.0%), Food Preparation & Serving (85.7%), and Law Enforcement (50.0%).
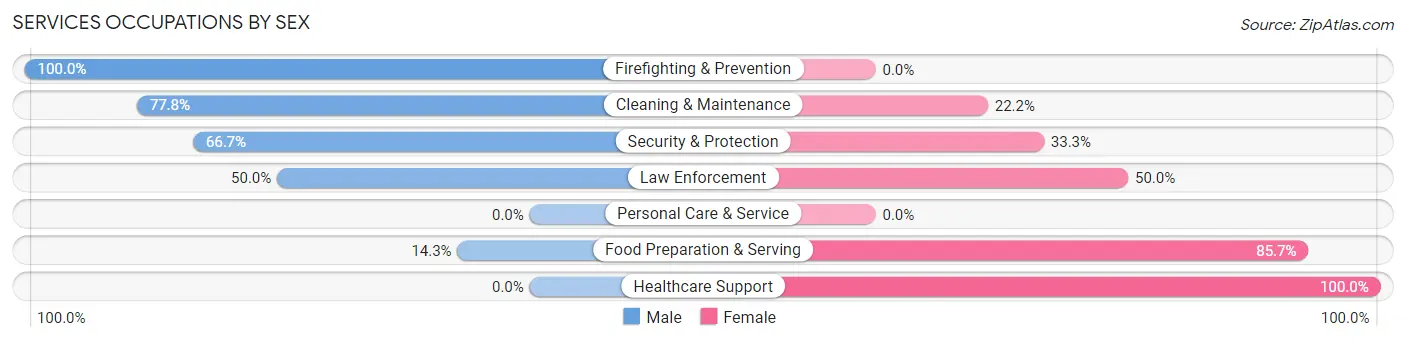
| Occupation | Male | Female |
| Healthcare Support | 0 (0.0%) | 7 (100.0%) |
| Security & Protection | 6 (66.7%) | 3 (33.3%) |
| Firefighting & Prevention | 3 (100.0%) | 0 (0.0%) |
| Law Enforcement | 3 (50.0%) | 3 (50.0%) |
| Food Preparation & Serving | 6 (14.3%) | 36 (85.7%) |
| Cleaning & Maintenance | 21 (77.8%) | 6 (22.2%) |
| Personal Care & Service | 0 (0.0%) | 0 (0.0%) |
| Total (Category) | 33 (38.8%) | 52 (61.2%) |
| Total (Overall) | 151 (40.3%) | 224 (59.7%) |
Sales and Office Occupations
The most common Sales and Office occupations in Pineville are Sales & Related (59 | 15.7%), and Office & Administration (55 | 14.7%).

Sales and Office Occupations by Sex

| Occupation | Male | Female |
| Sales & Related | 18 (30.5%) | 41 (69.5%) |
| Office & Administration | 0 (0.0%) | 55 (100.0%) |
| Total (Category) | 18 (15.8%) | 96 (84.2%) |
| Total (Overall) | 151 (40.3%) | 224 (59.7%) |
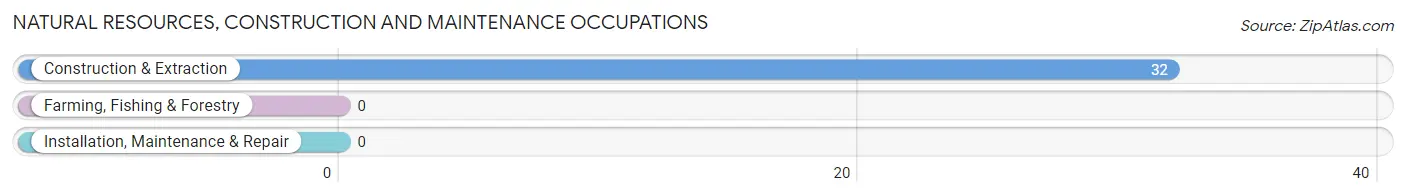
Natural Resources, Construction and Maintenance Occupations
The most common Natural Resources, Construction and Maintenance occupations in Pineville are , and Construction & Extraction (32 | 8.5%).
Natural Resources, Construction and Maintenance Occupations by Sex

| Occupation | Male | Female |
| Farming, Fishing & Forestry | 0 (0.0%) | 0 (0.0%) |
| Construction & Extraction | 21 (65.6%) | 11 (34.4%) |
| Installation, Maintenance & Repair | 0 (0.0%) | 0 (0.0%) |
| Total (Category) | 21 (65.6%) | 11 (34.4%) |
| Total (Overall) | 151 (40.3%) | 224 (59.7%) |
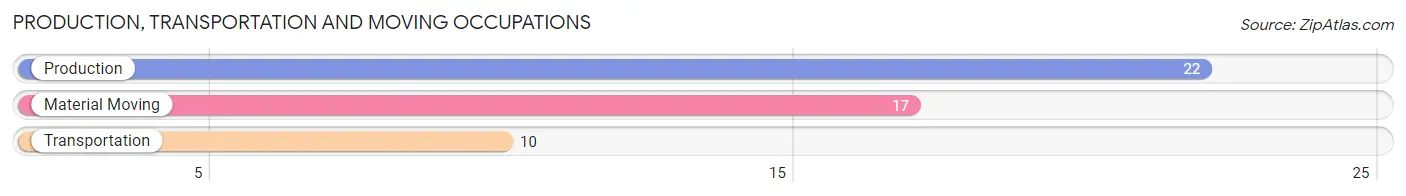
Production, Transportation and Moving Occupations
The most common Production, Transportation and Moving occupations in Pineville are Production (22 | 5.9%), Material Moving (17 | 4.5%), and Transportation (10 | 2.7%).
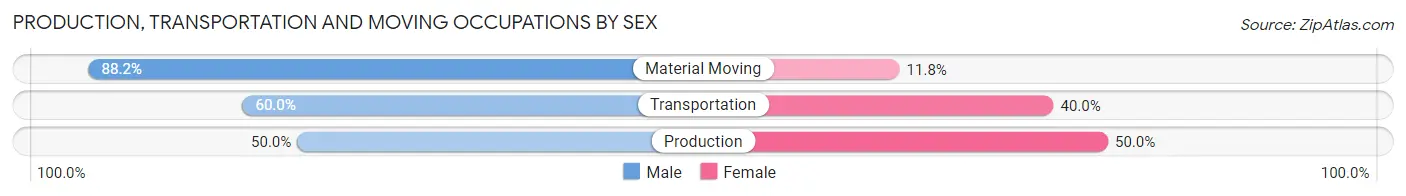
Production, Transportation and Moving Occupations by Sex
| Occupation | Male | Female |
| Production | 11 (50.0%) | 11 (50.0%) |
| Transportation | 6 (60.0%) | 4 (40.0%) |
| Material Moving | 15 (88.2%) | 2 (11.8%) |
| Total (Category) | 32 (65.3%) | 17 (34.7%) |
| Total (Overall) | 151 (40.3%) | 224 (59.7%) |
Employment Industries by Sex in Pineville
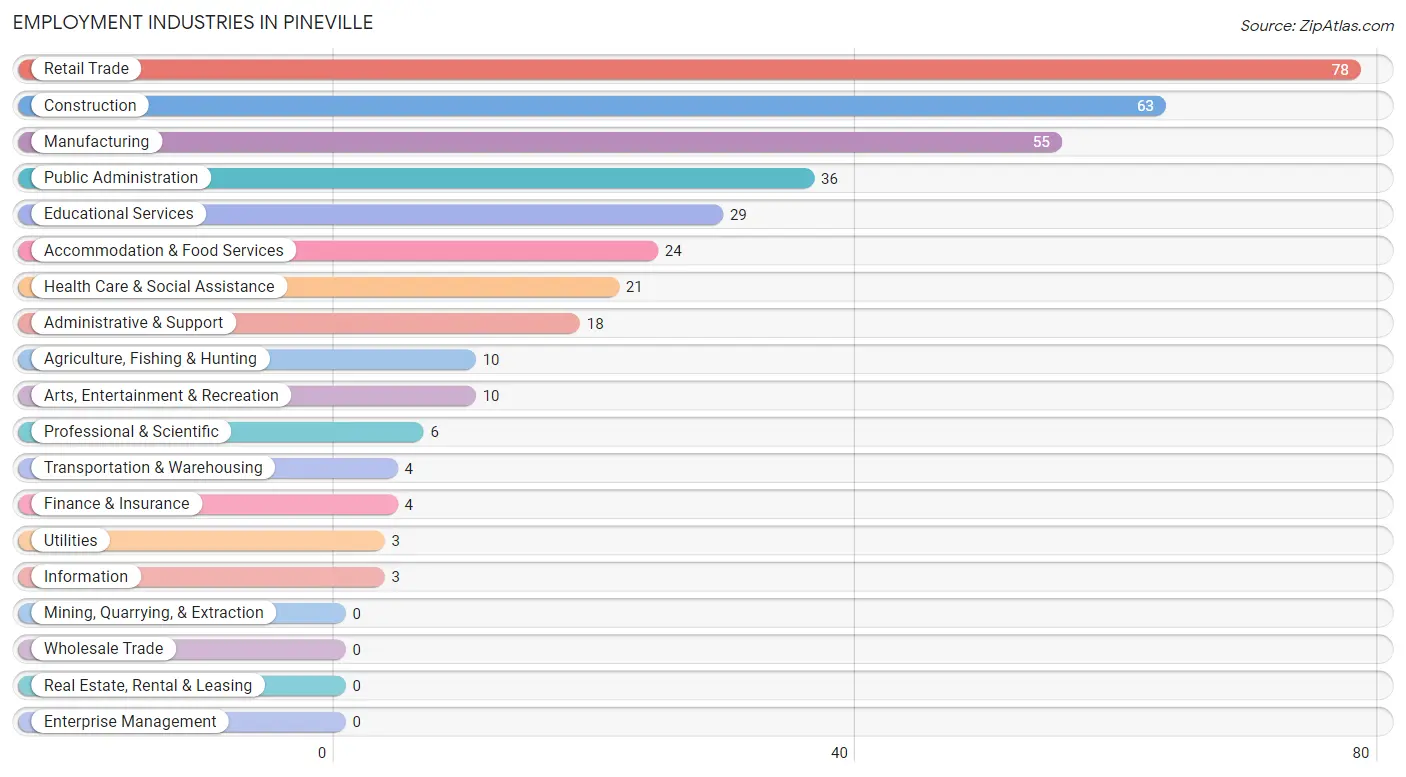
Employment Industries in Pineville
The major employment industries in Pineville include Retail Trade (78 | 20.8%), Construction (63 | 16.8%), Manufacturing (55 | 14.7%), Public Administration (36 | 9.6%), and Educational Services (29 | 7.7%).
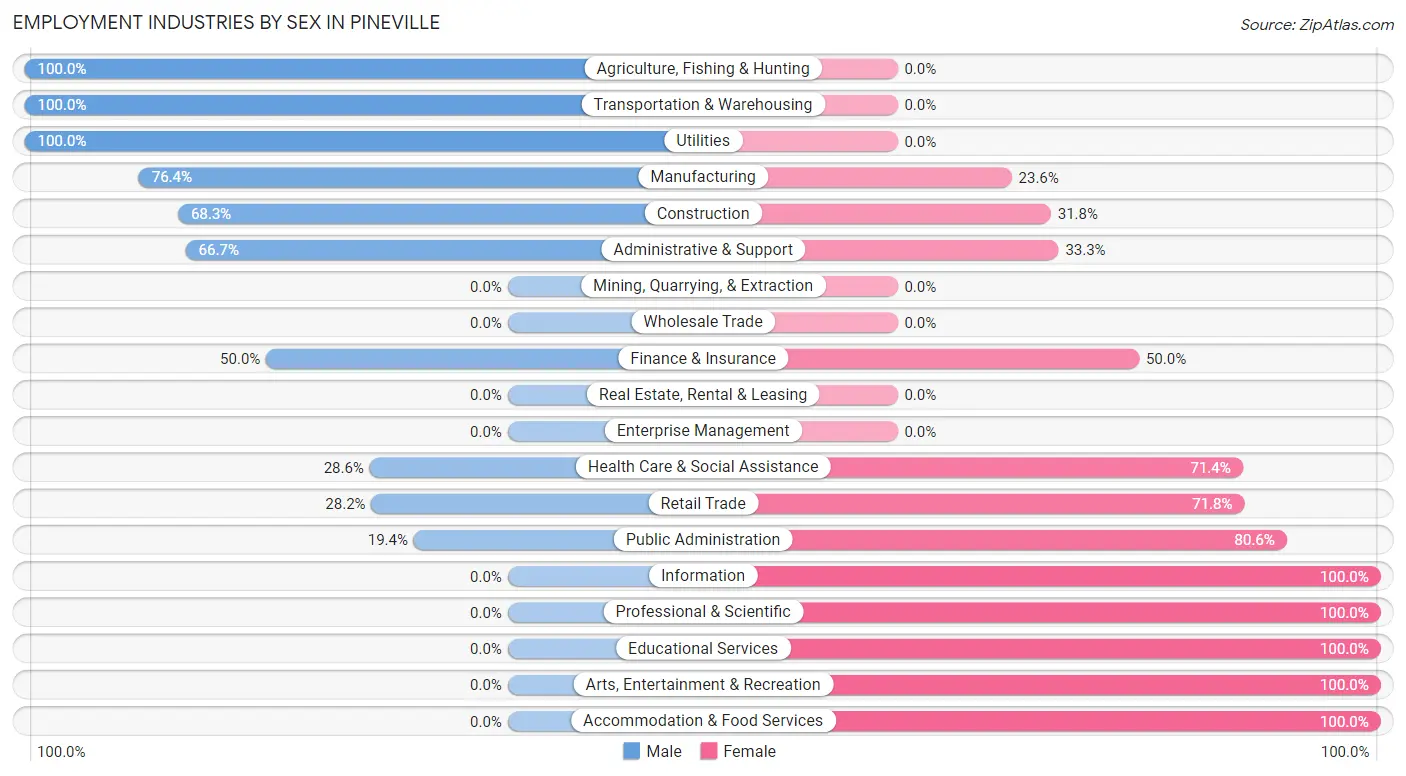
Employment Industries by Sex in Pineville
The Pineville industries that see more men than women are Agriculture, Fishing & Hunting (100.0%), Transportation & Warehousing (100.0%), and Utilities (100.0%), whereas the industries that tend to have a higher number of women are Information (100.0%), Professional & Scientific (100.0%), and Educational Services (100.0%).
| Industry | Male | Female |
| Agriculture, Fishing & Hunting | 10 (100.0%) | 0 (0.0%) |
| Mining, Quarrying, & Extraction | 0 (0.0%) | 0 (0.0%) |
| Construction | 43 (68.2%) | 20 (31.8%) |
| Manufacturing | 42 (76.4%) | 13 (23.6%) |
| Wholesale Trade | 0 (0.0%) | 0 (0.0%) |
| Retail Trade | 22 (28.2%) | 56 (71.8%) |
| Transportation & Warehousing | 4 (100.0%) | 0 (0.0%) |
| Utilities | 3 (100.0%) | 0 (0.0%) |
| Information | 0 (0.0%) | 3 (100.0%) |
| Finance & Insurance | 2 (50.0%) | 2 (50.0%) |
| Real Estate, Rental & Leasing | 0 (0.0%) | 0 (0.0%) |
| Professional & Scientific | 0 (0.0%) | 6 (100.0%) |
| Enterprise Management | 0 (0.0%) | 0 (0.0%) |
| Administrative & Support | 12 (66.7%) | 6 (33.3%) |
| Educational Services | 0 (0.0%) | 29 (100.0%) |
| Health Care & Social Assistance | 6 (28.6%) | 15 (71.4%) |
| Arts, Entertainment & Recreation | 0 (0.0%) | 10 (100.0%) |
| Accommodation & Food Services | 0 (0.0%) | 24 (100.0%) |
| Public Administration | 7 (19.4%) | 29 (80.6%) |
| Total | 151 (40.3%) | 224 (59.7%) |
Education in Pineville
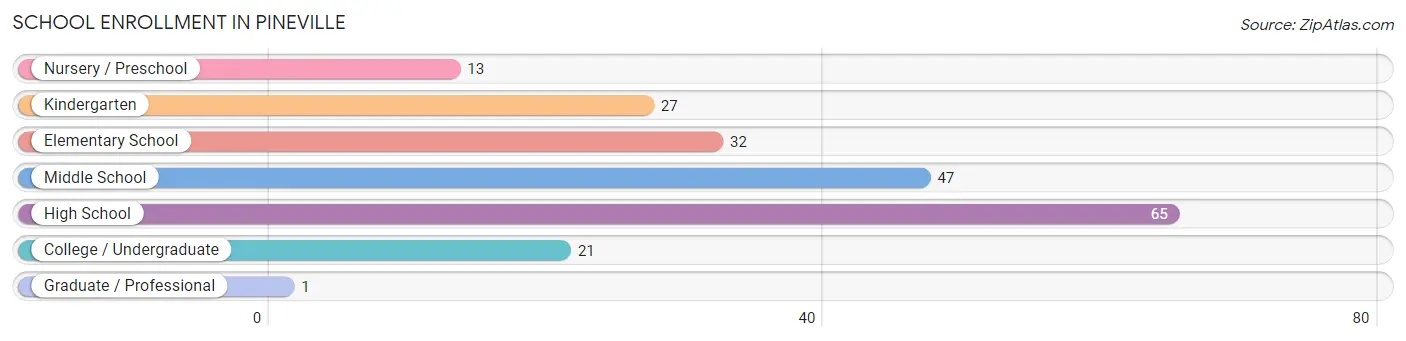
School Enrollment in Pineville
The most common levels of schooling among the 206 students in Pineville are high school (65 | 31.6%), middle school (47 | 22.8%), and elementary school (32 | 15.5%).
| School Level | # Students | % Students |
| Nursery / Preschool | 13 | 6.3% |
| Kindergarten | 27 | 13.1% |
| Elementary School | 32 | 15.5% |
| Middle School | 47 | 22.8% |
| High School | 65 | 31.6% |
| College / Undergraduate | 21 | 10.2% |
| Graduate / Professional | 1 | 0.5% |
| Total | 206 | 100.0% |
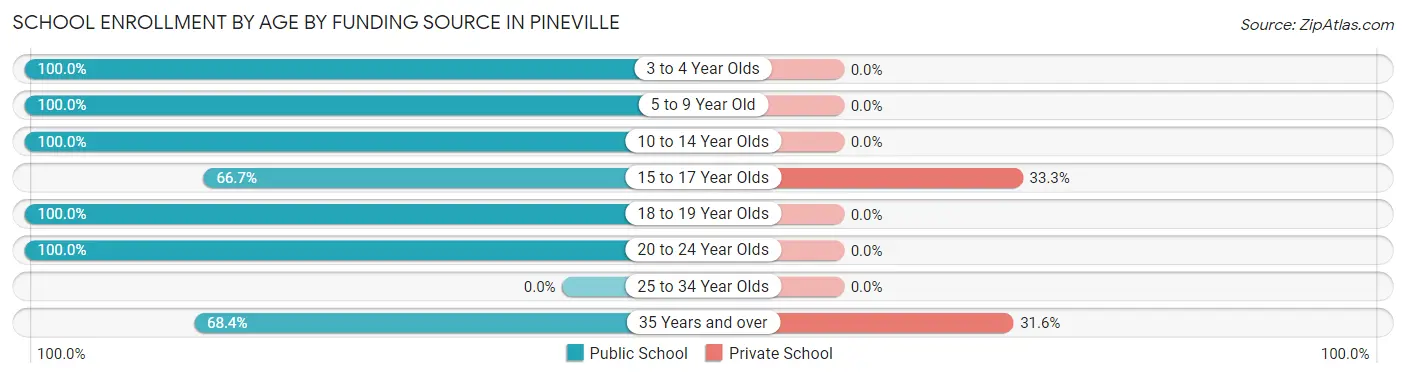
School Enrollment by Age by Funding Source in Pineville
Out of a total of 206 students who are enrolled in schools in Pineville, 21 (10.2%) attend a private institution, while the remaining 185 (89.8%) are enrolled in public schools. The age group of 15 to 17 year olds has the highest likelihood of being enrolled in private schools, with 15 (33.3% in the age bracket) enrolled. Conversely, the age group of 3 to 4 year olds has the lowest likelihood of being enrolled in a private school, with 10 (100.0% in the age bracket) attending a public institution.
| Age Bracket | Public School | Private School |
| 3 to 4 Year Olds | 10 (100.0%) | 0 (0.0%) |
| 5 to 9 Year Old | 60 (100.0%) | 0 (0.0%) |
| 10 to 14 Year Olds | 66 (100.0%) | 0 (0.0%) |
| 15 to 17 Year Olds | 30 (66.7%) | 15 (33.3%) |
| 18 to 19 Year Olds | 3 (100.0%) | 0 (0.0%) |
| 20 to 24 Year Olds | 3 (100.0%) | 0 (0.0%) |
| 25 to 34 Year Olds | 0 (0.0%) | 0 (0.0%) |
| 35 Years and over | 13 (68.4%) | 6 (31.6%) |
| Total | 185 (89.8%) | 21 (10.2%) |
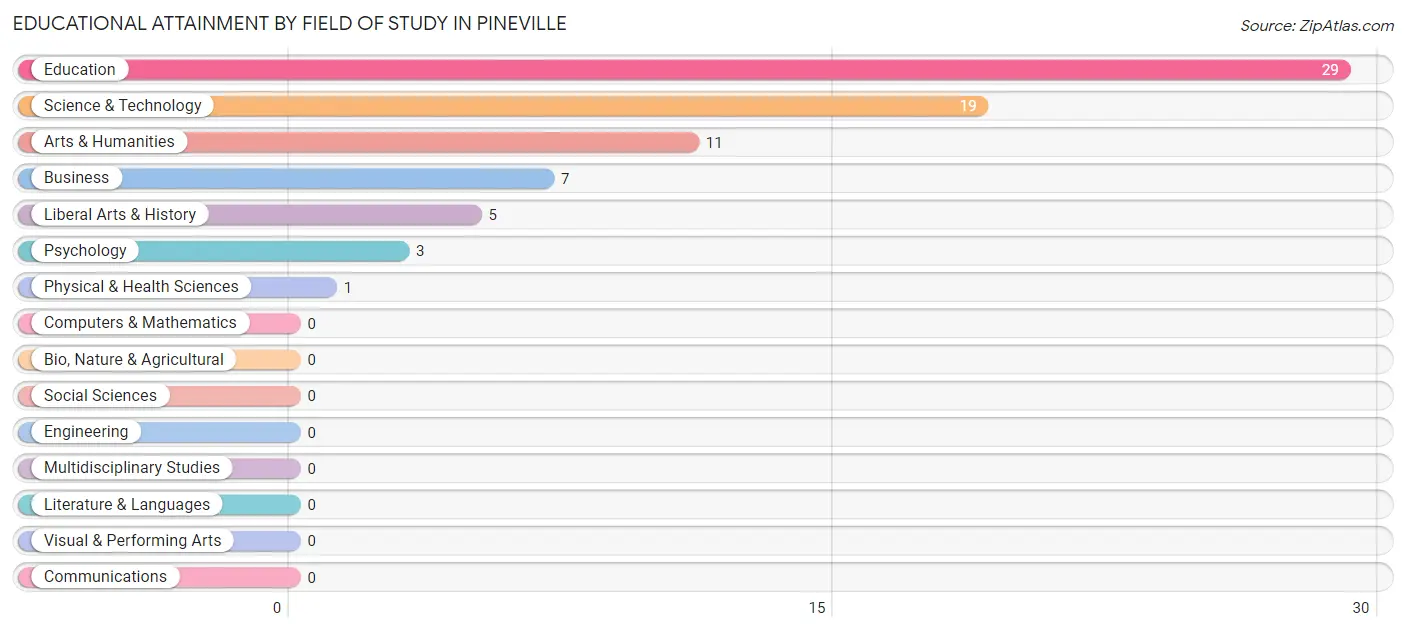
Educational Attainment by Field of Study in Pineville
Education (29 | 38.7%), science & technology (19 | 25.3%), arts & humanities (11 | 14.7%), business (7 | 9.3%), and liberal arts & history (5 | 6.7%) are the most common fields of study among 75 individuals in Pineville who have obtained a bachelor's degree or higher.
| Field of Study | # Graduates | % Graduates |
| Computers & Mathematics | 0 | 0.0% |
| Bio, Nature & Agricultural | 0 | 0.0% |
| Physical & Health Sciences | 1 | 1.3% |
| Psychology | 3 | 4.0% |
| Social Sciences | 0 | 0.0% |
| Engineering | 0 | 0.0% |
| Multidisciplinary Studies | 0 | 0.0% |
| Science & Technology | 19 | 25.3% |
| Business | 7 | 9.3% |
| Education | 29 | 38.7% |
| Literature & Languages | 0 | 0.0% |
| Liberal Arts & History | 5 | 6.7% |
| Visual & Performing Arts | 0 | 0.0% |
| Communications | 0 | 0.0% |
| Arts & Humanities | 11 | 14.7% |
| Total | 75 | 100.0% |
Transportation & Commute in Pineville
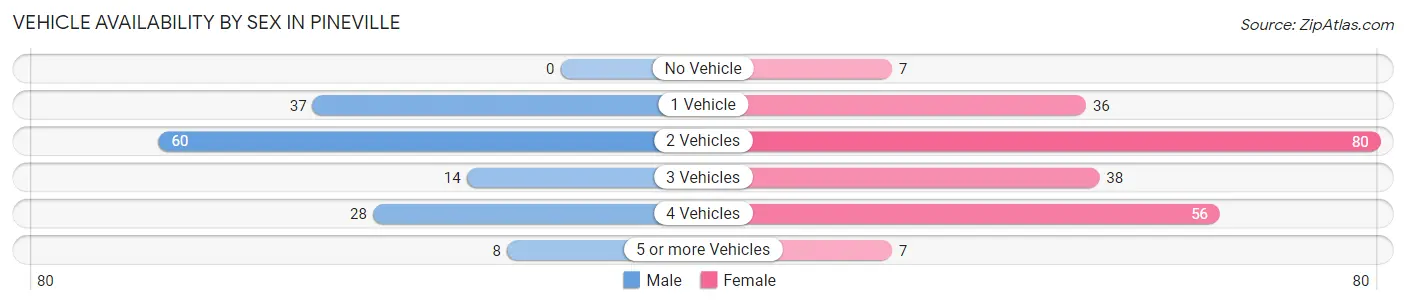
Vehicle Availability by Sex in Pineville
The most prevalent vehicle ownership categories in Pineville are males with 2 vehicles (60, accounting for 40.8%) and females with 2 vehicles (80, making up 26.8%).
| Vehicles Available | Male | Female |
| No Vehicle | 0 (0.0%) | 7 (3.1%) |
| 1 Vehicle | 37 (25.2%) | 36 (16.1%) |
| 2 Vehicles | 60 (40.8%) | 80 (35.7%) |
| 3 Vehicles | 14 (9.5%) | 38 (17.0%) |
| 4 Vehicles | 28 (19.1%) | 56 (25.0%) |
| 5 or more Vehicles | 8 (5.4%) | 7 (3.1%) |
| Total | 147 (100.0%) | 224 (100.0%) |
Commute Time in Pineville
The most frequently occuring commute durations in Pineville are 10 to 14 minutes (67 commuters, 18.8%), 20 to 24 minutes (63 commuters, 17.6%), and 5 to 9 minutes (56 commuters, 15.7%).
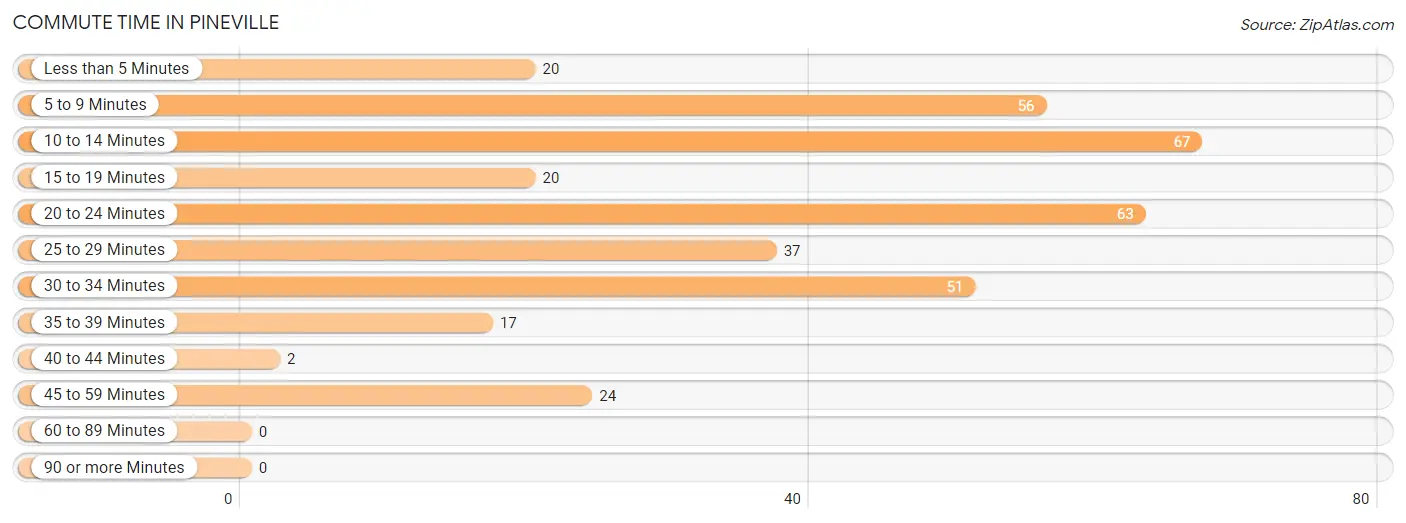
| Commute Time | # Commuters | % Commuters |
| Less than 5 Minutes | 20 | 5.6% |
| 5 to 9 Minutes | 56 | 15.7% |
| 10 to 14 Minutes | 67 | 18.8% |
| 15 to 19 Minutes | 20 | 5.6% |
| 20 to 24 Minutes | 63 | 17.6% |
| 25 to 29 Minutes | 37 | 10.4% |
| 30 to 34 Minutes | 51 | 14.3% |
| 35 to 39 Minutes | 17 | 4.8% |
| 40 to 44 Minutes | 2 | 0.6% |
| 45 to 59 Minutes | 24 | 6.7% |
| 60 to 89 Minutes | 0 | 0.0% |
| 90 or more Minutes | 0 | 0.0% |
Commute Time by Sex in Pineville
The most common commute times in Pineville are 25 to 29 minutes (34 commuters, 25.0%) for males and 5 to 9 minutes (47 commuters, 21.3%) for females.
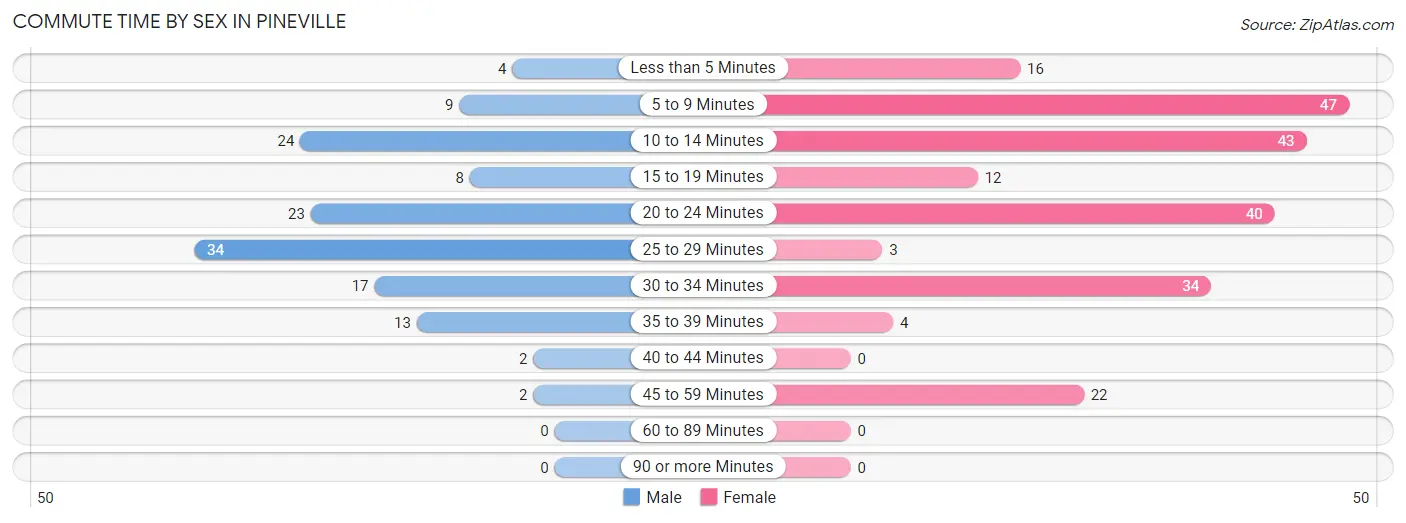
| Commute Time | Male | Female |
| Less than 5 Minutes | 4 (2.9%) | 16 (7.2%) |
| 5 to 9 Minutes | 9 (6.6%) | 47 (21.3%) |
| 10 to 14 Minutes | 24 (17.6%) | 43 (19.5%) |
| 15 to 19 Minutes | 8 (5.9%) | 12 (5.4%) |
| 20 to 24 Minutes | 23 (16.9%) | 40 (18.1%) |
| 25 to 29 Minutes | 34 (25.0%) | 3 (1.4%) |
| 30 to 34 Minutes | 17 (12.5%) | 34 (15.4%) |
| 35 to 39 Minutes | 13 (9.6%) | 4 (1.8%) |
| 40 to 44 Minutes | 2 (1.5%) | 0 (0.0%) |
| 45 to 59 Minutes | 2 (1.5%) | 22 (10.0%) |
| 60 to 89 Minutes | 0 (0.0%) | 0 (0.0%) |
| 90 or more Minutes | 0 (0.0%) | 0 (0.0%) |
Time of Departure to Work by Sex in Pineville
The most frequent times of departure to work in Pineville are 8:00 AM to 8:29 AM (25, 18.4%) for males and 7:30 AM to 7:59 AM (57, 25.8%) for females.
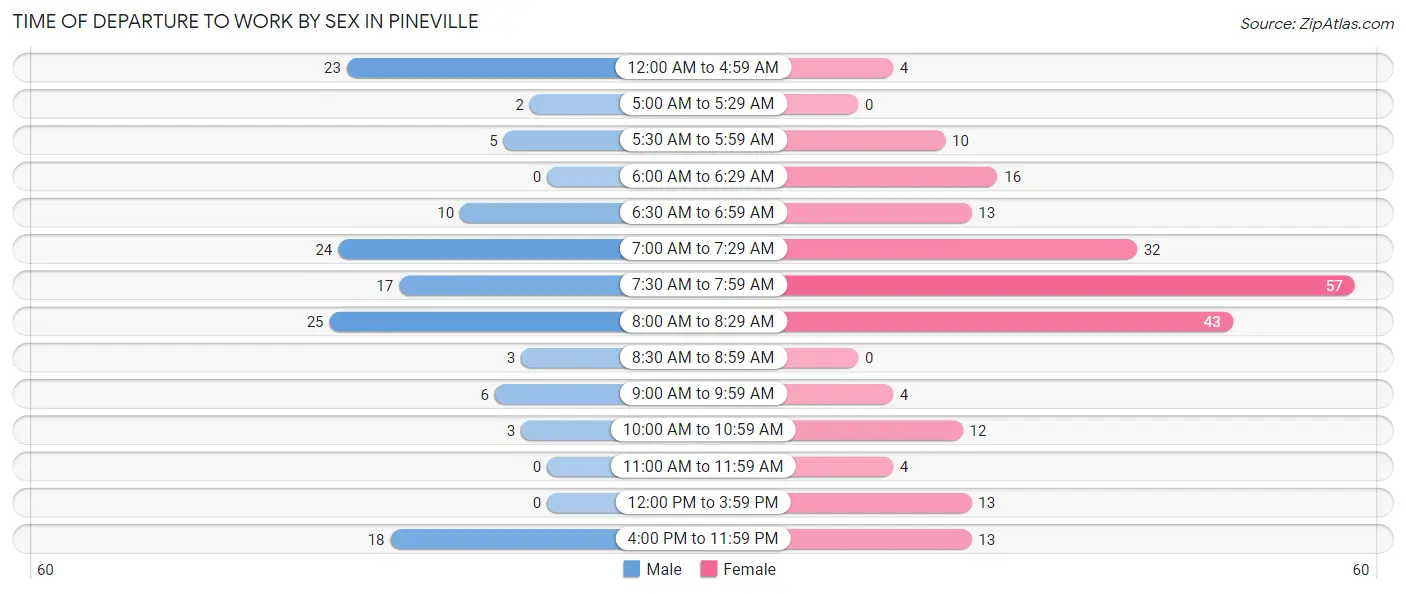
| Time of Departure | Male | Female |
| 12:00 AM to 4:59 AM | 23 (16.9%) | 4 (1.8%) |
| 5:00 AM to 5:29 AM | 2 (1.5%) | 0 (0.0%) |
| 5:30 AM to 5:59 AM | 5 (3.7%) | 10 (4.5%) |
| 6:00 AM to 6:29 AM | 0 (0.0%) | 16 (7.2%) |
| 6:30 AM to 6:59 AM | 10 (7.3%) | 13 (5.9%) |
| 7:00 AM to 7:29 AM | 24 (17.6%) | 32 (14.5%) |
| 7:30 AM to 7:59 AM | 17 (12.5%) | 57 (25.8%) |
| 8:00 AM to 8:29 AM | 25 (18.4%) | 43 (19.5%) |
| 8:30 AM to 8:59 AM | 3 (2.2%) | 0 (0.0%) |
| 9:00 AM to 9:59 AM | 6 (4.4%) | 4 (1.8%) |
| 10:00 AM to 10:59 AM | 3 (2.2%) | 12 (5.4%) |
| 11:00 AM to 11:59 AM | 0 (0.0%) | 4 (1.8%) |
| 12:00 PM to 3:59 PM | 0 (0.0%) | 13 (5.9%) |
| 4:00 PM to 11:59 PM | 18 (13.2%) | 13 (5.9%) |
| Total | 136 (100.0%) | 221 (100.0%) |
Housing Occupancy in Pineville
Occupancy by Ownership in Pineville
Of the total 358 dwellings in Pineville, owner-occupied units account for 165 (46.1%), while renter-occupied units make up 193 (53.9%).
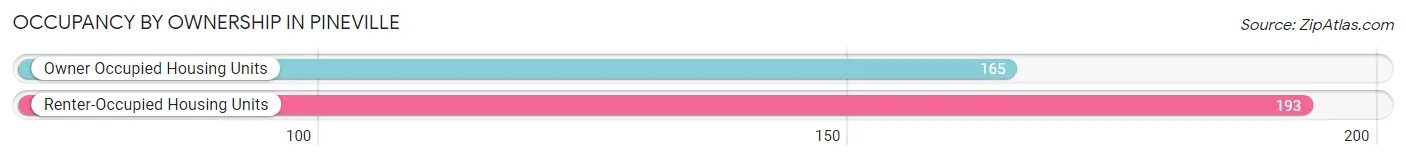
| Occupancy | # Housing Units | % Housing Units |
| Owner Occupied Housing Units | 165 | 46.1% |
| Renter-Occupied Housing Units | 193 | 53.9% |
| Total Occupied Housing Units | 358 | 100.0% |
Occupancy by Household Size in Pineville
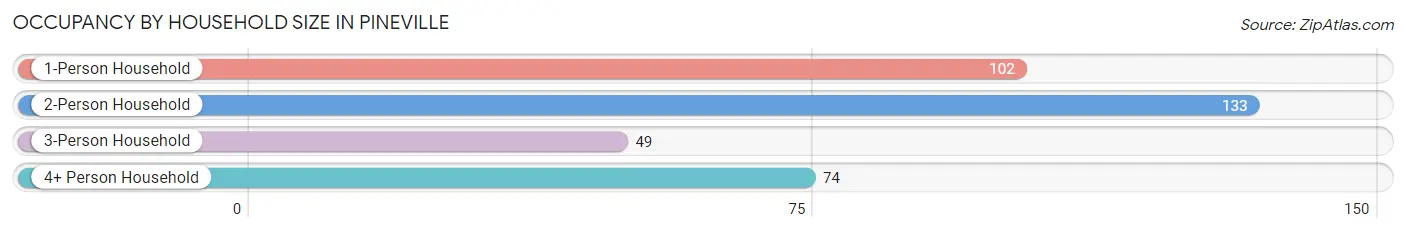
| Household Size | # Housing Units | % Housing Units |
| 1-Person Household | 102 | 28.5% |
| 2-Person Household | 133 | 37.1% |
| 3-Person Household | 49 | 13.7% |
| 4+ Person Household | 74 | 20.7% |
| Total Housing Units | 358 | 100.0% |
Occupancy by Ownership by Household Size in Pineville
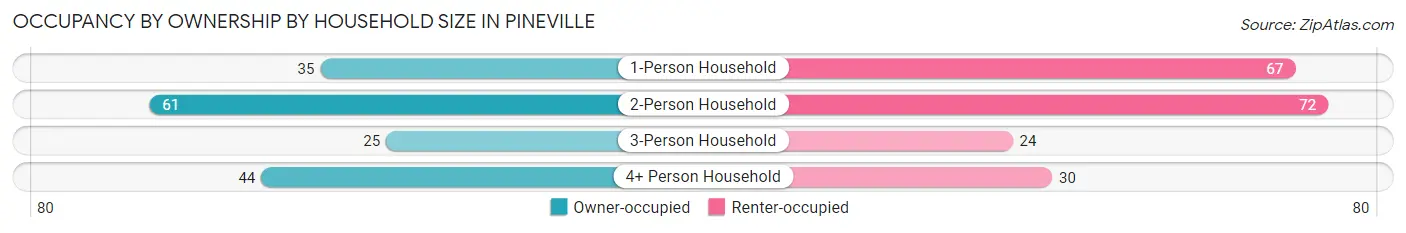
| Household Size | Owner-occupied | Renter-occupied |
| 1-Person Household | 35 (34.3%) | 67 (65.7%) |
| 2-Person Household | 61 (45.9%) | 72 (54.1%) |
| 3-Person Household | 25 (51.0%) | 24 (49.0%) |
| 4+ Person Household | 44 (59.5%) | 30 (40.5%) |
| Total Housing Units | 165 (46.1%) | 193 (53.9%) |
Occupancy by Educational Attainment in Pineville
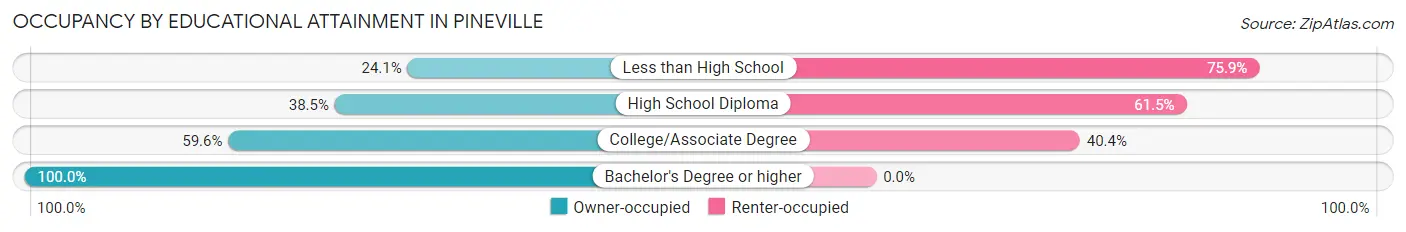
| Household Size | Owner-occupied | Renter-occupied |
| Less than High School | 13 (24.1%) | 41 (75.9%) |
| High School Diploma | 82 (38.5%) | 131 (61.5%) |
| College/Associate Degree | 31 (59.6%) | 21 (40.4%) |
| Bachelor's Degree or higher | 39 (100.0%) | 0 (0.0%) |
Occupancy by Age of Householder in Pineville
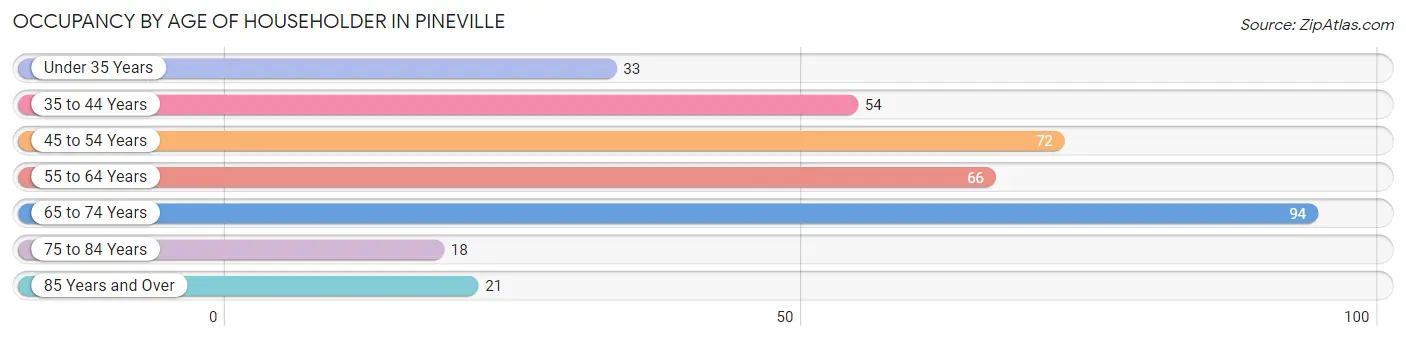
| Age Bracket | # Households | % Households |
| Under 35 Years | 33 | 9.2% |
| 35 to 44 Years | 54 | 15.1% |
| 45 to 54 Years | 72 | 20.1% |
| 55 to 64 Years | 66 | 18.4% |
| 65 to 74 Years | 94 | 26.3% |
| 75 to 84 Years | 18 | 5.0% |
| 85 Years and Over | 21 | 5.9% |
| Total | 358 | 100.0% |
Housing Finances in Pineville
Median Income by Occupancy in Pineville
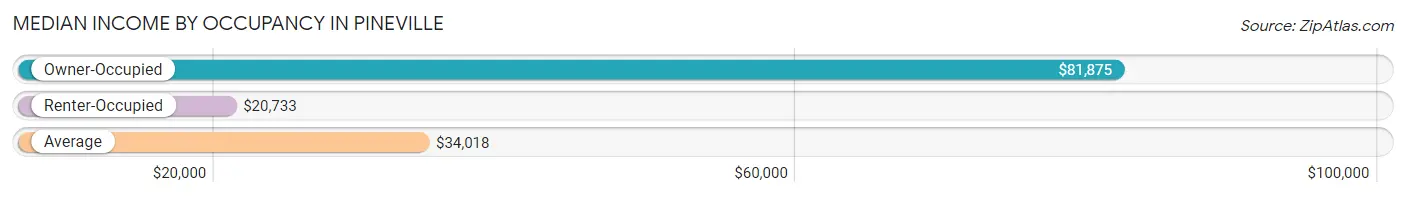
| Occupancy Type | # Households | Median Income |
| Owner-Occupied | 165 (46.1%) | $81,875 |
| Renter-Occupied | 193 (53.9%) | $20,733 |
| Average | 358 (100.0%) | $34,018 |
Occupancy by Householder Income Bracket in Pineville
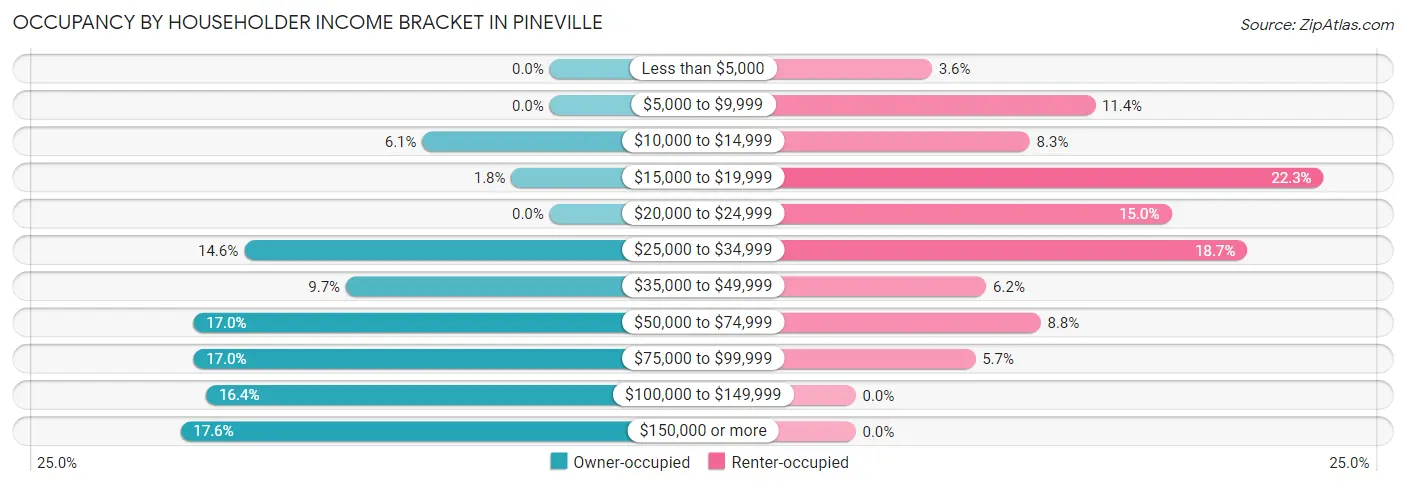
| Income Bracket | Owner-occupied | Renter-occupied |
| Less than $5,000 | 0 (0.0%) | 7 (3.6%) |
| $5,000 to $9,999 | 0 (0.0%) | 22 (11.4%) |
| $10,000 to $14,999 | 10 (6.1%) | 16 (8.3%) |
| $15,000 to $19,999 | 3 (1.8%) | 43 (22.3%) |
| $20,000 to $24,999 | 0 (0.0%) | 29 (15.0%) |
| $25,000 to $34,999 | 24 (14.5%) | 36 (18.6%) |
| $35,000 to $49,999 | 16 (9.7%) | 12 (6.2%) |
| $50,000 to $74,999 | 28 (17.0%) | 17 (8.8%) |
| $75,000 to $99,999 | 28 (17.0%) | 11 (5.7%) |
| $100,000 to $149,999 | 27 (16.4%) | 0 (0.0%) |
| $150,000 or more | 29 (17.6%) | 0 (0.0%) |
| Total | 165 (100.0%) | 193 (100.0%) |
Monthly Housing Cost Tiers in Pineville
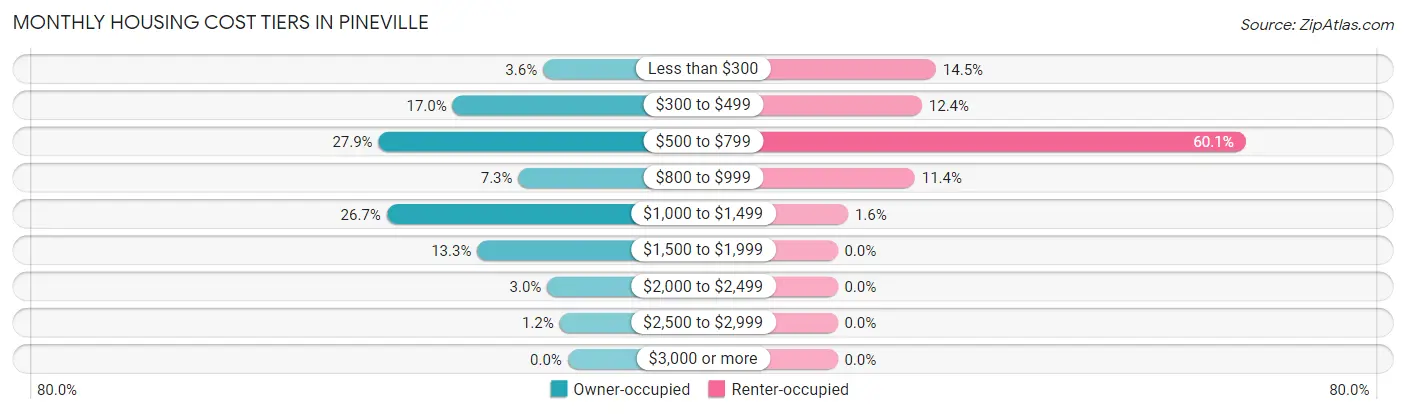
| Monthly Cost | Owner-occupied | Renter-occupied |
| Less than $300 | 6 (3.6%) | 28 (14.5%) |
| $300 to $499 | 28 (17.0%) | 24 (12.4%) |
| $500 to $799 | 46 (27.9%) | 116 (60.1%) |
| $800 to $999 | 12 (7.3%) | 22 (11.4%) |
| $1,000 to $1,499 | 44 (26.7%) | 3 (1.5%) |
| $1,500 to $1,999 | 22 (13.3%) | 0 (0.0%) |
| $2,000 to $2,499 | 5 (3.0%) | 0 (0.0%) |
| $2,500 to $2,999 | 2 (1.2%) | 0 (0.0%) |
| $3,000 or more | 0 (0.0%) | 0 (0.0%) |
| Total | 165 (100.0%) | 193 (100.0%) |
Physical Housing Characteristics in Pineville
Housing Structures in Pineville
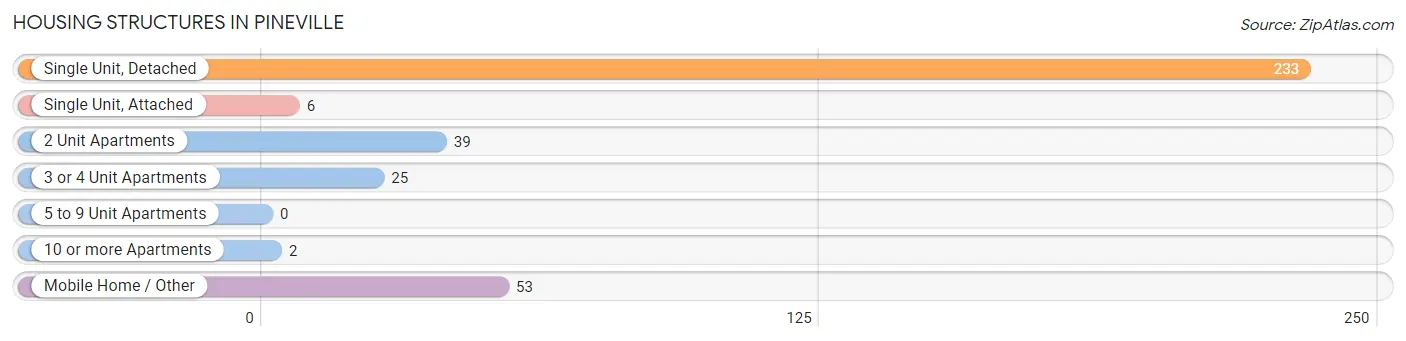
| Structure Type | # Housing Units | % Housing Units |
| Single Unit, Detached | 233 | 65.1% |
| Single Unit, Attached | 6 | 1.7% |
| 2 Unit Apartments | 39 | 10.9% |
| 3 or 4 Unit Apartments | 25 | 7.0% |
| 5 to 9 Unit Apartments | 0 | 0.0% |
| 10 or more Apartments | 2 | 0.6% |
| Mobile Home / Other | 53 | 14.8% |
| Total | 358 | 100.0% |
Housing Structures by Occupancy in Pineville
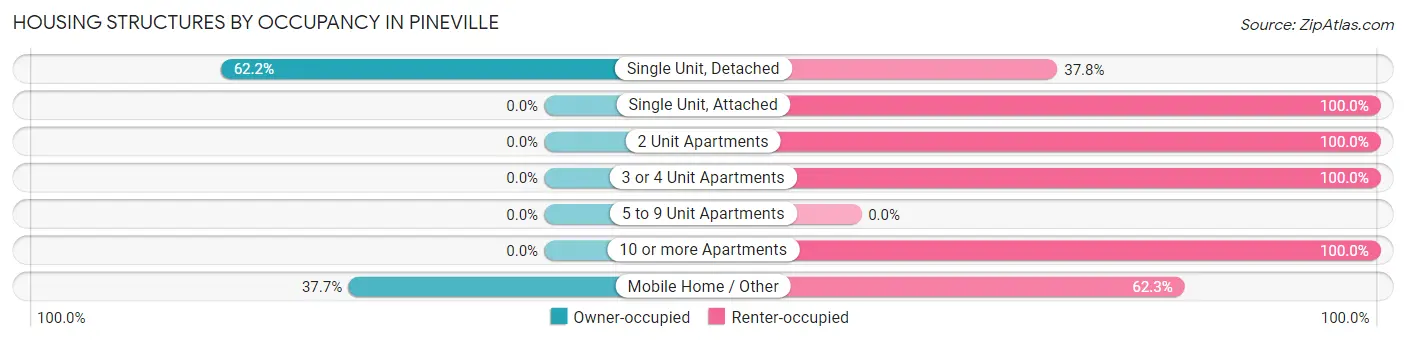
| Structure Type | Owner-occupied | Renter-occupied |
| Single Unit, Detached | 145 (62.2%) | 88 (37.8%) |
| Single Unit, Attached | 0 (0.0%) | 6 (100.0%) |
| 2 Unit Apartments | 0 (0.0%) | 39 (100.0%) |
| 3 or 4 Unit Apartments | 0 (0.0%) | 25 (100.0%) |
| 5 to 9 Unit Apartments | 0 (0.0%) | 0 (0.0%) |
| 10 or more Apartments | 0 (0.0%) | 2 (100.0%) |
| Mobile Home / Other | 20 (37.7%) | 33 (62.3%) |
| Total | 165 (46.1%) | 193 (53.9%) |
Housing Structures by Number of Rooms in Pineville
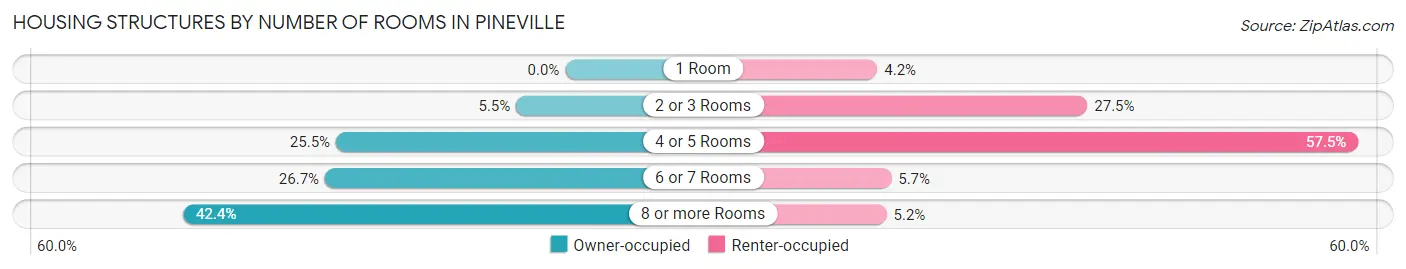
| Number of Rooms | Owner-occupied | Renter-occupied |
| 1 Room | 0 (0.0%) | 8 (4.2%) |
| 2 or 3 Rooms | 9 (5.4%) | 53 (27.5%) |
| 4 or 5 Rooms | 42 (25.5%) | 111 (57.5%) |
| 6 or 7 Rooms | 44 (26.7%) | 11 (5.7%) |
| 8 or more Rooms | 70 (42.4%) | 10 (5.2%) |
| Total | 165 (100.0%) | 193 (100.0%) |
Housing Structure by Heating Type in Pineville
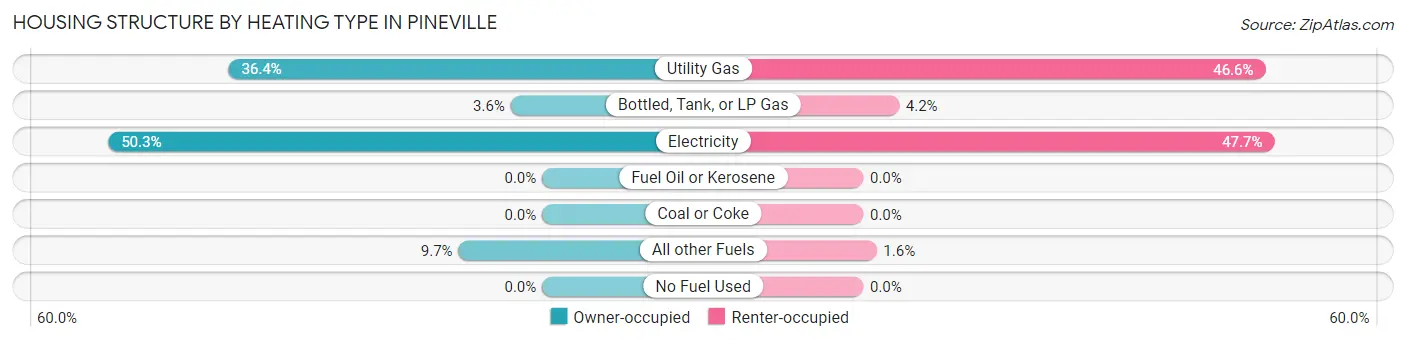
| Heating Type | Owner-occupied | Renter-occupied |
| Utility Gas | 60 (36.4%) | 90 (46.6%) |
| Bottled, Tank, or LP Gas | 6 (3.6%) | 8 (4.2%) |
| Electricity | 83 (50.3%) | 92 (47.7%) |
| Fuel Oil or Kerosene | 0 (0.0%) | 0 (0.0%) |
| Coal or Coke | 0 (0.0%) | 0 (0.0%) |
| All other Fuels | 16 (9.7%) | 3 (1.5%) |
| No Fuel Used | 0 (0.0%) | 0 (0.0%) |
| Total | 165 (100.0%) | 193 (100.0%) |
Household Vehicle Usage in Pineville
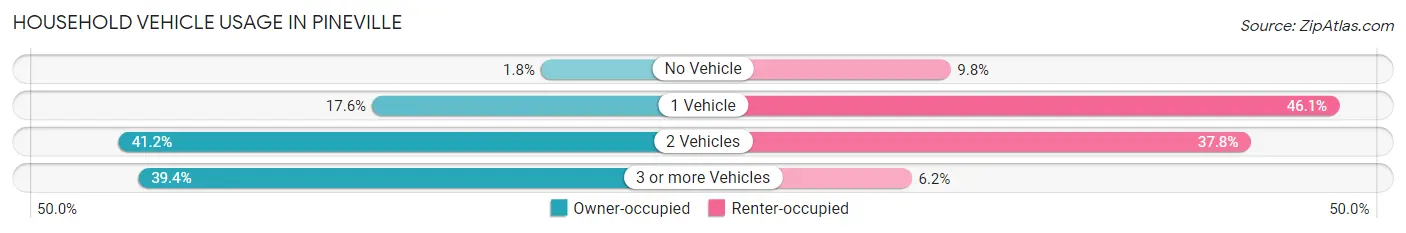
| Vehicles per Household | Owner-occupied | Renter-occupied |
| No Vehicle | 3 (1.8%) | 19 (9.8%) |
| 1 Vehicle | 29 (17.6%) | 89 (46.1%) |
| 2 Vehicles | 68 (41.2%) | 73 (37.8%) |
| 3 or more Vehicles | 65 (39.4%) | 12 (6.2%) |
| Total | 165 (100.0%) | 193 (100.0%) |
Real Estate & Mortgages in Pineville
Real Estate and Mortgage Overview in Pineville
| Characteristic | Without Mortgage | With Mortgage |
| Housing Units | 69 | 96 |
| Median Property Value | $117,200 | $167,300 |
| Median Household Income | $60,089 | $23 |
| Monthly Housing Costs | $502 | $0 |
| Real Estate Taxes | $550 | $0 |
Property Value by Mortgage Status in Pineville
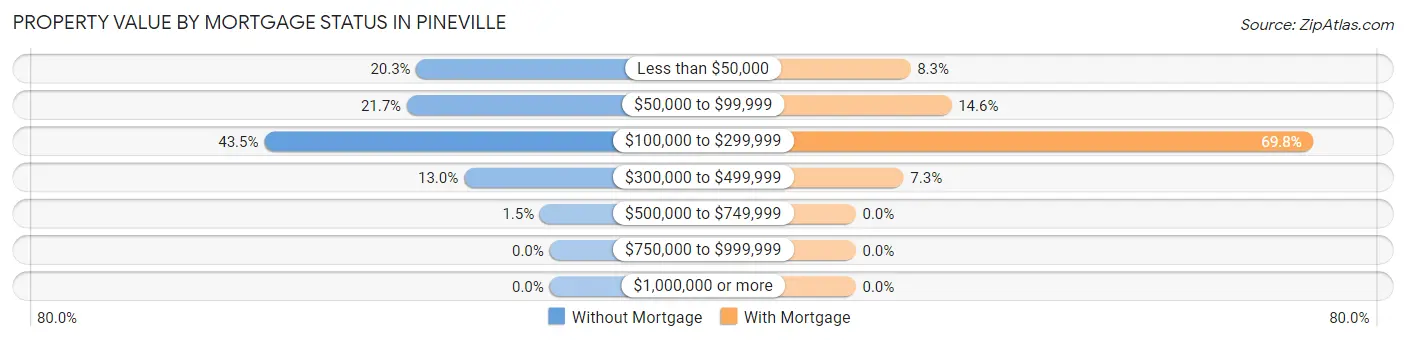
| Property Value | Without Mortgage | With Mortgage |
| Less than $50,000 | 14 (20.3%) | 8 (8.3%) |
| $50,000 to $99,999 | 15 (21.7%) | 14 (14.6%) |
| $100,000 to $299,999 | 30 (43.5%) | 67 (69.8%) |
| $300,000 to $499,999 | 9 (13.0%) | 7 (7.3%) |
| $500,000 to $749,999 | 1 (1.5%) | 0 (0.0%) |
| $750,000 to $999,999 | 0 (0.0%) | 0 (0.0%) |
| $1,000,000 or more | 0 (0.0%) | 0 (0.0%) |
| Total | 69 (100.0%) | 96 (100.0%) |
Household Income by Mortgage Status in Pineville
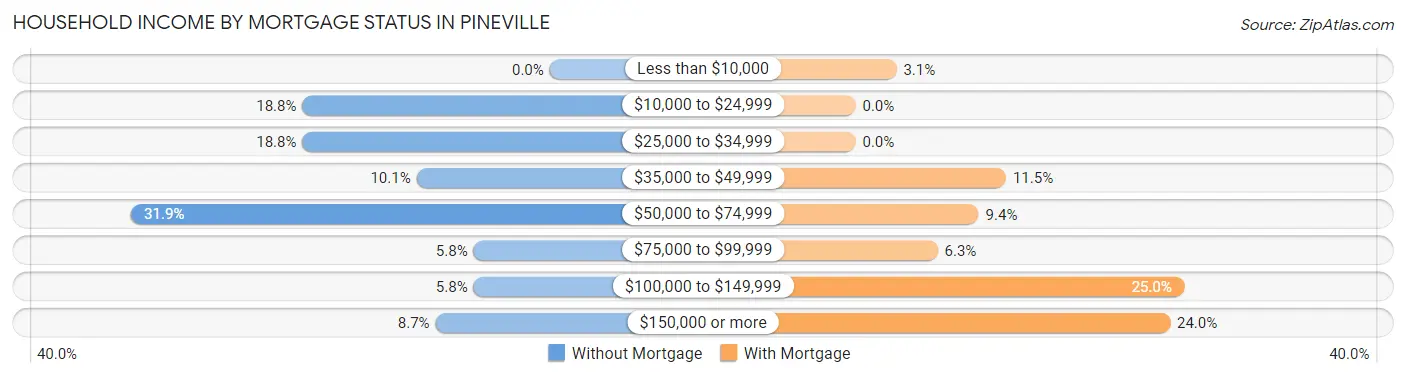
| Household Income | Without Mortgage | With Mortgage |
| Less than $10,000 | 0 (0.0%) | 3 (3.1%) |
| $10,000 to $24,999 | 13 (18.8%) | 0 (0.0%) |
| $25,000 to $34,999 | 13 (18.8%) | 0 (0.0%) |
| $35,000 to $49,999 | 7 (10.1%) | 11 (11.5%) |
| $50,000 to $74,999 | 22 (31.9%) | 9 (9.4%) |
| $75,000 to $99,999 | 4 (5.8%) | 6 (6.2%) |
| $100,000 to $149,999 | 4 (5.8%) | 24 (25.0%) |
| $150,000 or more | 6 (8.7%) | 23 (24.0%) |
| Total | 69 (100.0%) | 96 (100.0%) |
Property Value to Household Income Ratio in Pineville
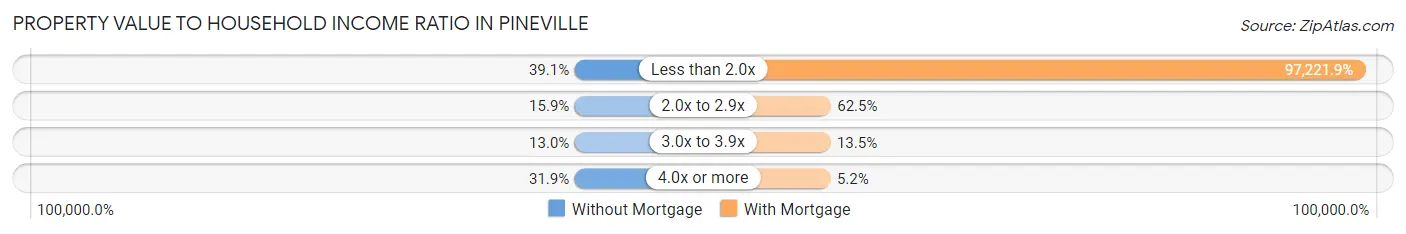
| Value-to-Income Ratio | Without Mortgage | With Mortgage |
| Less than 2.0x | 27 (39.1%) | 93,333 (97,221.9%) |
| 2.0x to 2.9x | 11 (15.9%) | 60 (62.5%) |
| 3.0x to 3.9x | 9 (13.0%) | 13 (13.5%) |
| 4.0x or more | 22 (31.9%) | 5 (5.2%) |
| Total | 69 (100.0%) | 96 (100.0%) |
Real Estate Taxes by Mortgage Status in Pineville
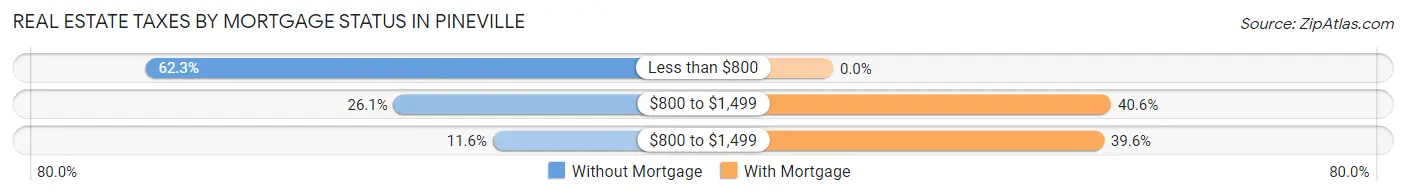
| Property Taxes | Without Mortgage | With Mortgage |
| Less than $800 | 43 (62.3%) | 0 (0.0%) |
| $800 to $1,499 | 18 (26.1%) | 39 (40.6%) |
| $800 to $1,499 | 8 (11.6%) | 38 (39.6%) |
| Total | 69 (100.0%) | 96 (100.0%) |
Health & Disability in Pineville
Health Insurance Coverage by Age in Pineville
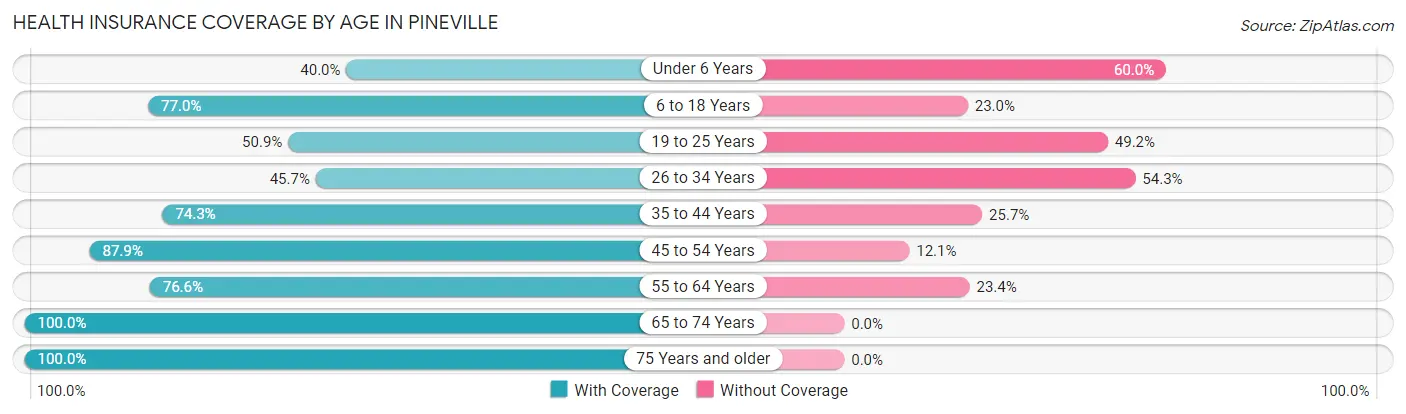
| Age Bracket | With Coverage | Without Coverage |
| Under 6 Years | 18 (40.0%) | 27 (60.0%) |
| 6 to 18 Years | 137 (77.0%) | 41 (23.0%) |
| 19 to 25 Years | 30 (50.8%) | 29 (49.1%) |
| 26 to 34 Years | 32 (45.7%) | 38 (54.3%) |
| 35 to 44 Years | 78 (74.3%) | 27 (25.7%) |
| 45 to 54 Years | 116 (87.9%) | 16 (12.1%) |
| 55 to 64 Years | 82 (76.6%) | 25 (23.4%) |
| 65 to 74 Years | 131 (100.0%) | 0 (0.0%) |
| 75 Years and older | 41 (100.0%) | 0 (0.0%) |
| Total | 665 (76.6%) | 203 (23.4%) |
Health Insurance Coverage by Citizenship Status in Pineville
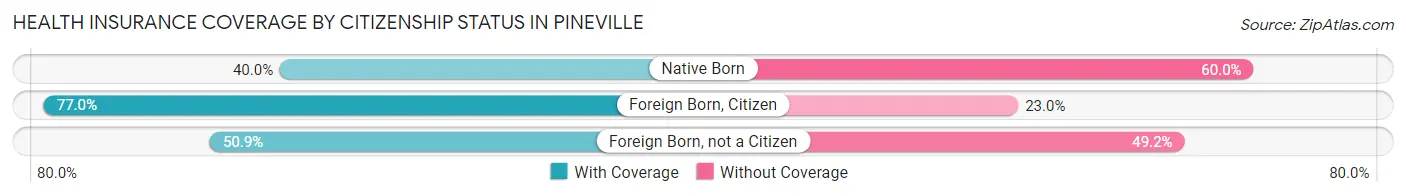
| Citizenship Status | With Coverage | Without Coverage |
| Native Born | 18 (40.0%) | 27 (60.0%) |
| Foreign Born, Citizen | 137 (77.0%) | 41 (23.0%) |
| Foreign Born, not a Citizen | 30 (50.8%) | 29 (49.1%) |
Health Insurance Coverage by Household Income in Pineville
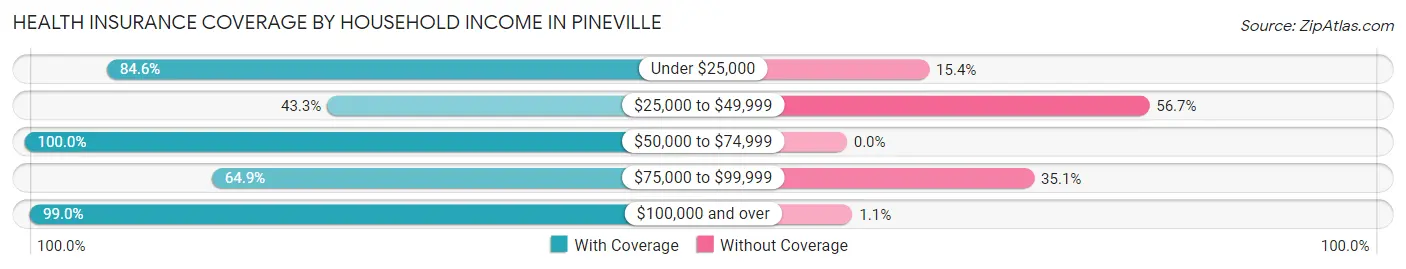
| Household Income | With Coverage | Without Coverage |
| Under $25,000 | 159 (84.6%) | 29 (15.4%) |
| $25,000 to $49,999 | 91 (43.3%) | 119 (56.7%) |
| $50,000 to $74,999 | 129 (100.0%) | 0 (0.0%) |
| $75,000 to $99,999 | 98 (64.9%) | 53 (35.1%) |
| $100,000 and over | 188 (99.0%) | 2 (1.1%) |
Public vs Private Health Insurance Coverage by Age in Pineville
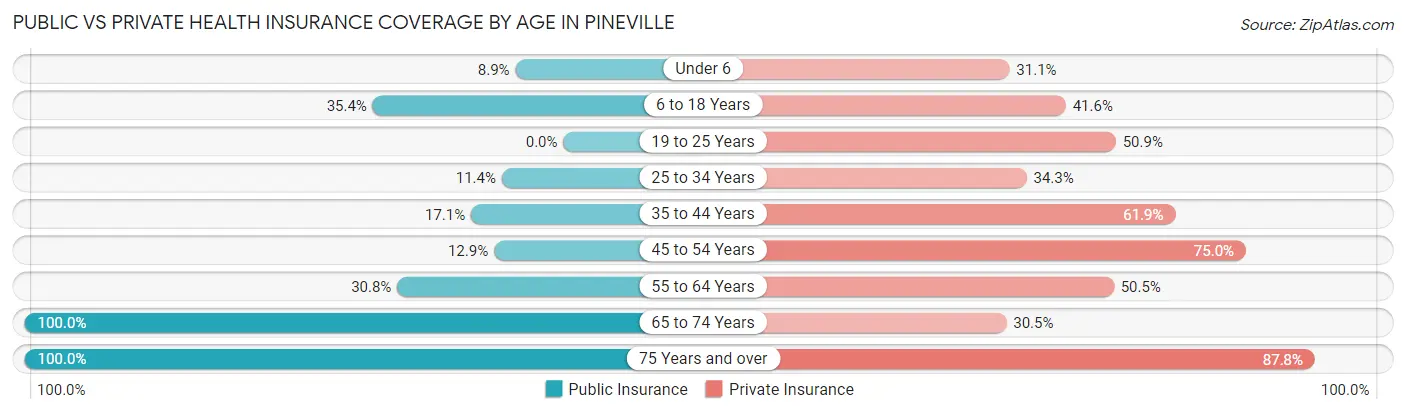
| Age Bracket | Public Insurance | Private Insurance |
| Under 6 | 4 (8.9%) | 14 (31.1%) |
| 6 to 18 Years | 63 (35.4%) | 74 (41.6%) |
| 19 to 25 Years | 0 (0.0%) | 30 (50.8%) |
| 25 to 34 Years | 8 (11.4%) | 24 (34.3%) |
| 35 to 44 Years | 18 (17.1%) | 65 (61.9%) |
| 45 to 54 Years | 17 (12.9%) | 99 (75.0%) |
| 55 to 64 Years | 33 (30.8%) | 54 (50.5%) |
| 65 to 74 Years | 131 (100.0%) | 40 (30.5%) |
| 75 Years and over | 41 (100.0%) | 36 (87.8%) |
| Total | 315 (36.3%) | 436 (50.2%) |
Disability Status by Sex by Age in Pineville
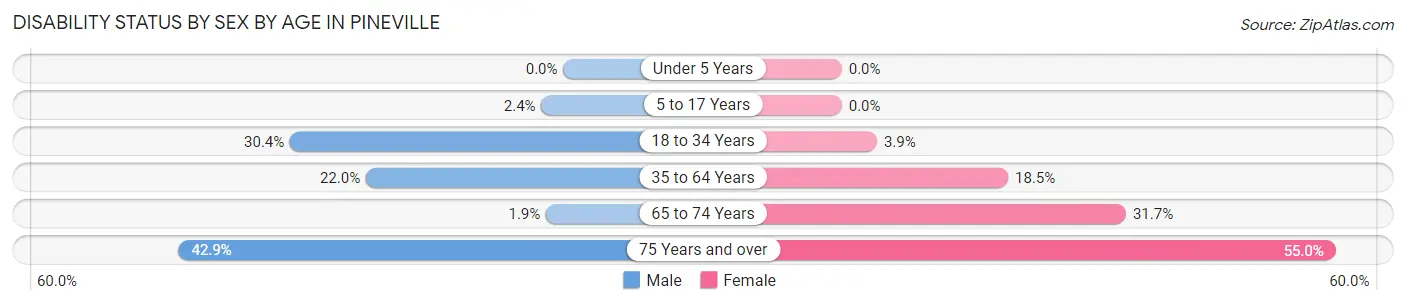
| Age Bracket | Male | Female |
| Under 5 Years | 0 (0.0%) | 0 (0.0%) |
| 5 to 17 Years | 3 (2.4%) | 0 (0.0%) |
| 18 to 34 Years | 14 (30.4%) | 4 (3.9%) |
| 35 to 64 Years | 40 (22.0%) | 30 (18.5%) |
| 65 to 74 Years | 1 (1.9%) | 25 (31.7%) |
| 75 Years and over | 9 (42.9%) | 11 (55.0%) |
Disability Class by Sex by Age in Pineville
Disability Class: Hearing Difficulty
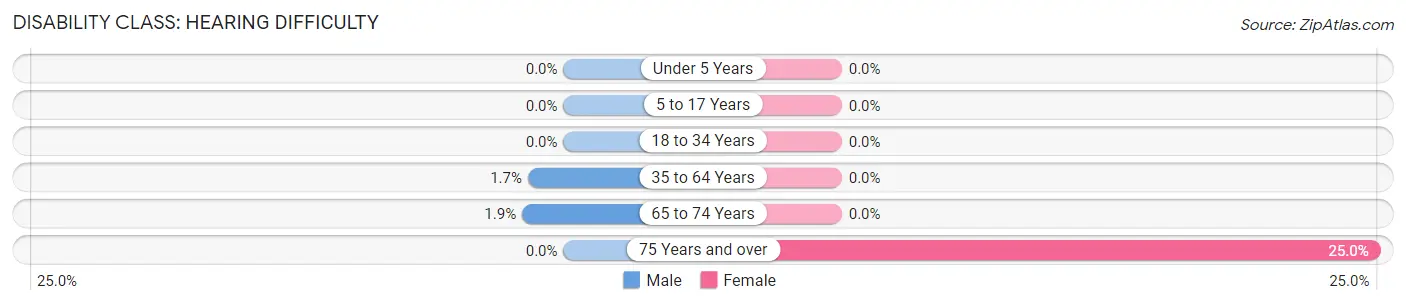
| Age Bracket | Male | Female |
| Under 5 Years | 0 (0.0%) | 0 (0.0%) |
| 5 to 17 Years | 0 (0.0%) | 0 (0.0%) |
| 18 to 34 Years | 0 (0.0%) | 0 (0.0%) |
| 35 to 64 Years | 3 (1.7%) | 0 (0.0%) |
| 65 to 74 Years | 1 (1.9%) | 0 (0.0%) |
| 75 Years and over | 0 (0.0%) | 5 (25.0%) |
Disability Class: Vision Difficulty
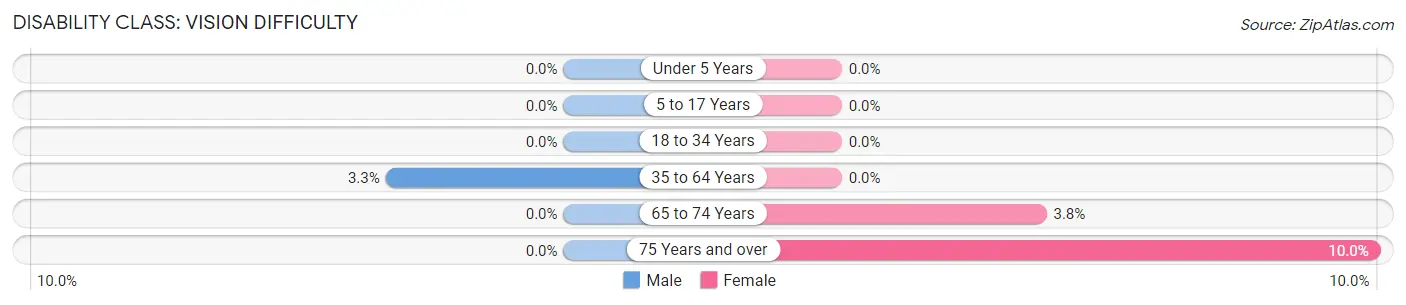
| Age Bracket | Male | Female |
| Under 5 Years | 0 (0.0%) | 0 (0.0%) |
| 5 to 17 Years | 0 (0.0%) | 0 (0.0%) |
| 18 to 34 Years | 0 (0.0%) | 0 (0.0%) |
| 35 to 64 Years | 6 (3.3%) | 0 (0.0%) |
| 65 to 74 Years | 0 (0.0%) | 3 (3.8%) |
| 75 Years and over | 0 (0.0%) | 2 (10.0%) |
Disability Class: Cognitive Difficulty
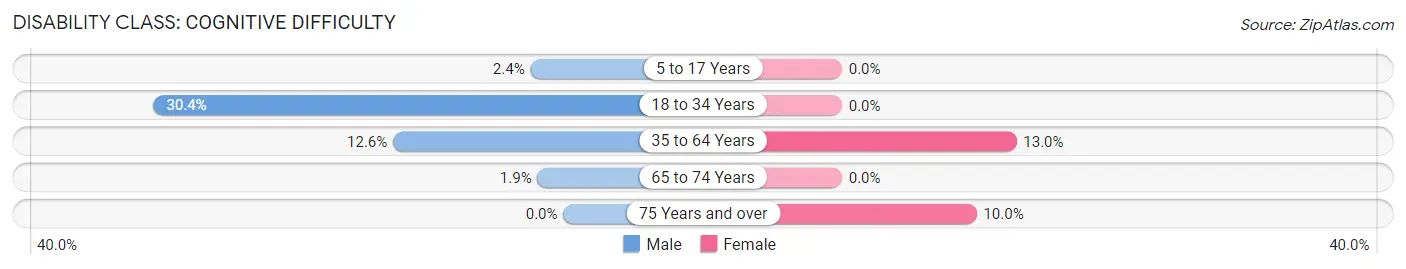
| Age Bracket | Male | Female |
| 5 to 17 Years | 3 (2.4%) | 0 (0.0%) |
| 18 to 34 Years | 14 (30.4%) | 0 (0.0%) |
| 35 to 64 Years | 23 (12.6%) | 21 (13.0%) |
| 65 to 74 Years | 1 (1.9%) | 0 (0.0%) |
| 75 Years and over | 0 (0.0%) | 2 (10.0%) |
Disability Class: Ambulatory Difficulty
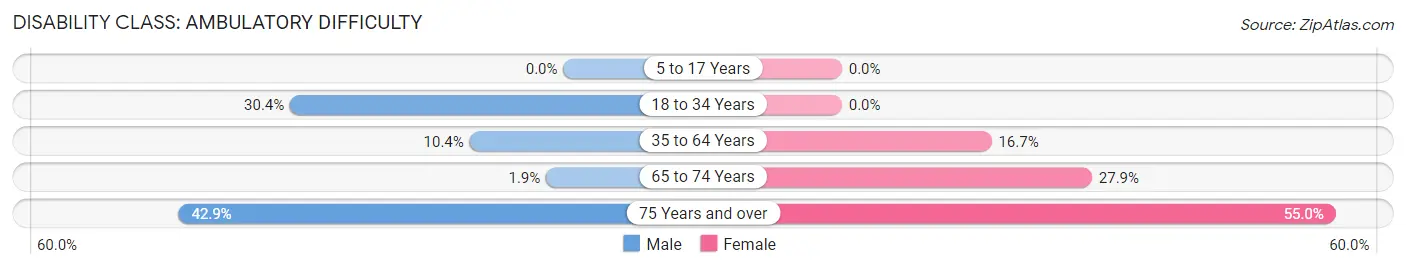
| Age Bracket | Male | Female |
| 5 to 17 Years | 0 (0.0%) | 0 (0.0%) |
| 18 to 34 Years | 14 (30.4%) | 0 (0.0%) |
| 35 to 64 Years | 19 (10.4%) | 27 (16.7%) |
| 65 to 74 Years | 1 (1.9%) | 22 (27.9%) |
| 75 Years and over | 9 (42.9%) | 11 (55.0%) |
Disability Class: Self-Care Difficulty
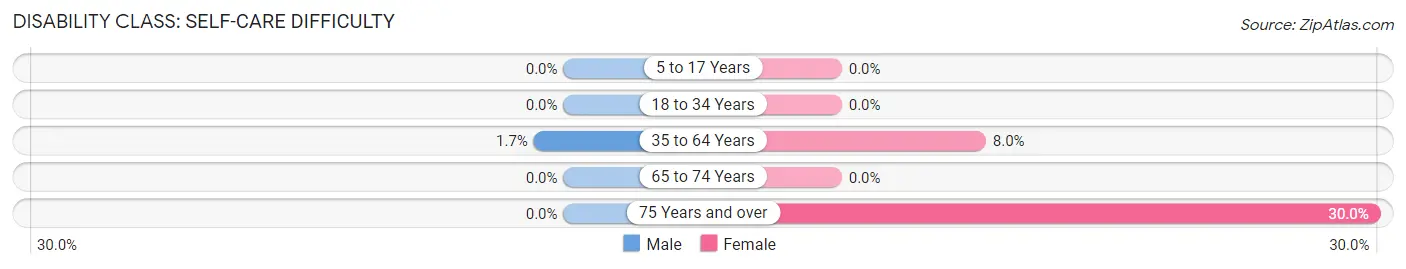
| Age Bracket | Male | Female |
| 5 to 17 Years | 0 (0.0%) | 0 (0.0%) |
| 18 to 34 Years | 0 (0.0%) | 0 (0.0%) |
| 35 to 64 Years | 3 (1.7%) | 13 (8.0%) |
| 65 to 74 Years | 0 (0.0%) | 0 (0.0%) |
| 75 Years and over | 0 (0.0%) | 6 (30.0%) |
Technology Access in Pineville
Computing Device Access in Pineville
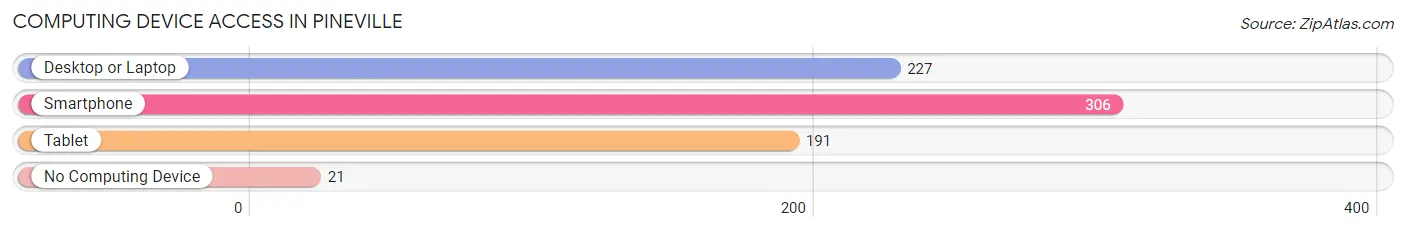
| Device Type | # Households | % Households |
| Desktop or Laptop | 227 | 63.4% |
| Smartphone | 306 | 85.5% |
| Tablet | 191 | 53.3% |
| No Computing Device | 21 | 5.9% |
| Total | 358 | 100.0% |
Internet Access in Pineville
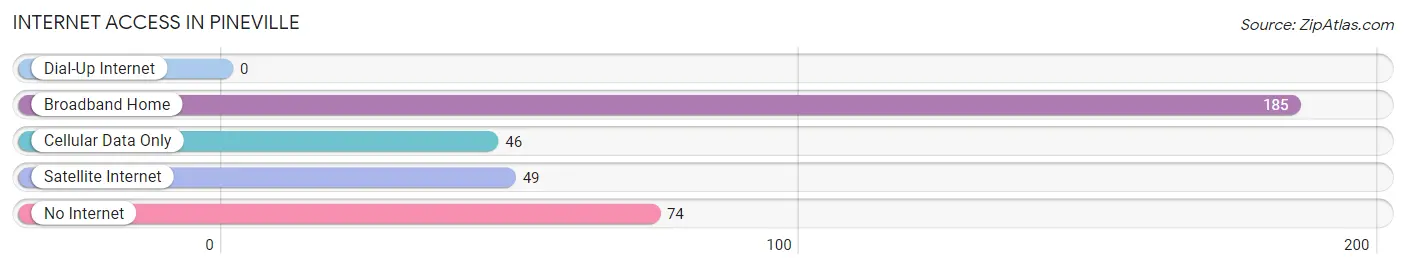
| Internet Type | # Households | % Households |
| Dial-Up Internet | 0 | 0.0% |
| Broadband Home | 185 | 51.7% |
| Cellular Data Only | 46 | 12.9% |
| Satellite Internet | 49 | 13.7% |
| No Internet | 74 | 20.7% |
| Total | 358 | 100.0% |
Pineville Summary
Pineville, Missouri is a small town located in McDonald County, in the southwestern corner of the state. The town is situated on the banks of the Elk River, and is surrounded by rolling hills and lush forests. The town has a population of just over 1,000 people, and is part of the Joplin, Missouri metropolitan area.
History
Pineville was founded in 1883 by a group of settlers from Arkansas. The town was named after the abundance of pine trees in the area. The first post office was established in 1884, and the town was incorporated in 1887.
In the early 1900s, Pineville was a thriving agricultural community, with a variety of crops being grown in the area. The town was also home to several sawmills and gristmills, which provided lumber and grain for the local economy.
In the 1950s, the town began to experience a decline in population as many of the younger residents moved away in search of better job opportunities. However, the town has seen a resurgence in recent years, with new businesses and residents moving to the area.
Geography
Pineville is located in the Ozark Mountains region of Missouri. The town is situated on the banks of the Elk River, and is surrounded by rolling hills and lush forests. The town is located approximately 30 miles south of Joplin, Missouri, and is part of the Joplin metropolitan area.
The climate in Pineville is generally mild, with hot summers and cold winters. The average annual temperature is around 60 degrees Fahrenheit, and the average annual precipitation is around 40 inches.
Economy
The economy of Pineville is largely based on agriculture and tourism. The town is home to several farms, which produce a variety of crops, including corn, soybeans, wheat, and hay. The town is also home to several wineries, which produce a variety of wines.
In addition, the town is home to several small businesses, including restaurants, shops, and other services. The town is also home to several manufacturing companies, which produce a variety of products, including furniture, clothing, and automotive parts.
Demographics
As of the 2010 census, the population of Pineville was 1,072. The racial makeup of the town was 97.3% White, 0.7% African American, 0.3% Native American, 0.2% Asian, 0.1% Pacific Islander, and 1.4% from other races. The median household income was $35,000, and the median family income was $41,000.
The town is home to several churches, including the First Baptist Church, the First United Methodist Church, and the Church of Christ. The town is also home to several schools, including Pineville Elementary School, Pineville Middle School, and Pineville High School.
Common Questions
What is Per Capita Income in Pineville?
Per Capita income in Pineville is $23,929.
What is the Median Family Income in Pineville?
Median Family Income in Pineville is $61,406.
What is the Median Household income in Pineville?
Median Household Income in Pineville is $34,018.
What is Income or Wage Gap in Pineville?
Income or Wage Gap in Pineville is 39.5%.
Women in Pineville earn 60.5 cents for every dollar earned by a man.
What is Inequality or Gini Index in Pineville?
Inequality or Gini Index in Pineville is 0.48.
What is the Total Population of Pineville?
Total Population of Pineville is 895.
What is the Total Male Population of Pineville?
Total Male Population of Pineville is 453.
What is the Total Female Population of Pineville?
Total Female Population of Pineville is 442.
What is the Ratio of Males per 100 Females in Pineville?
There are 102.49 Males per 100 Females in Pineville.
What is the Ratio of Females per 100 Males in Pineville?
There are 97.57 Females per 100 Males in Pineville.
What is the Median Population Age in Pineville?
Median Population Age in Pineville is 41.8 Years.
What is the Average Family Size in Pineville
Average Family Size in Pineville is 3.0 People.
What is the Average Household Size in Pineville
Average Household Size in Pineville is 2.4 People.
How Large is the Labor Force in Pineville?
There are 399 People in the Labor Forcein in Pineville.
What is the Percentage of People in the Labor Force in Pineville?
56.3% of People are in the Labor Force in Pineville.
What is the Unemployment Rate in Pineville?
Unemployment Rate in Pineville is 6.0%.